- 1College of Geological Engineering and Geomatics, Chang'an University, Xi′an, China
- 2Institute of Geographic Sciences and Natural Resources Research, CAS, Beijing, China
Quaternary loess is widely distributed over the tertiary Hipparion red clay on the Loess Plateau of China. Large-scale loess landslides often occur along the weak contact interface between these two sediment materials. To investigate the failure mode and shear strength characteristics of the loess–Hipparion red clay contact interface, a series of shearing experiments were performed on interface specimens using purpose-built shear equipment. In this article, the relationship between shear strength and interface morphology is discussed, and an empirical shear model of the interface is proposed based on the experimental results and theoretical work. The results indicate that discontinuities between the loess and the Hipparion red clay reduce the shear strength of specimens significantly. The contribution of the contact interface to shear performance including failure mode, shear deformation, and shear strength varies with the interface morphology and the applied normal stress. With low interface roughness or normal stress, sliding failure is likely to occur. With increasing interface roughness and normal stress, the peak strength increases rapidly. With further increase in the interface roughness and normal stress, the increment of peak strength decreases gradually as the failure mode transitions from sliding mode to cutoff mode. A staged shear model that takes the failure mode into consideration is developed to express the non-linear change in the interface shear strength. The shear model’s capability is validated by comparing model estimates with experimental data. This work improves our understanding of shear mechanisms and the importance of considering the effects of interfacial properties in the mechanical behavior of contact interfaces.
Introduction
On China’s Loess Plateau, loess was deposited on the Hipparion red clay, forming a discontinuous weak interface. Approximately 55% of the large loess landslides occur mainly along this loess–Hipparion red clay interface related to the groundwater activity (Wen et al., 2005; Wang et al., 2019a; Peng et al., 2019). Recent research studies on this type of landslides have shown that the Hipparion red clay is an important factor controlling and affecting the formation of landslides (Qu et al., 1999; Li et al., 2012a). For example, the Hipparion red clay has low permeability and is easy to be weathered (Lei and Qu, 1991); when under the action of water, the red clay is prone to generate creep deformation, and this long-term deformation results in the formation of a sliding surface (Song et al., 1994; Jiang, 2009; Wang et al., 2012; Xin et al., 2014). Meanwhile, a better understanding of the shear strength of the weak interface between loess and Hipparion red clay is necessary for elucidating the mechanism of loess landslides (Lawrence et al., 2011; Li et al., 2012b; Wu et al., 2014; Peng et al., 2019). However, most recent research on the slip zone of this type of landslides mainly focused on the shear mechanics of pure loess or pure Hipparion red clay (Xu et al., 2008; Jia et al., 2014; Wu et al., 2014; Wang et al., 2018; Wang et al., 2019b; Liu et al., 2020; Zhu et al., 2021a). The shear strength of the interface between loess and the Hipparion red clay in a loess landslide is not clear.
Past research studies have focused on the shear behavior on the interface between soil and different structures, such as the interface between sand and concrete (Skempton, 1985; Uesugi et al., 1990; Hebeler et al., 2016), clay and concrete (Feligha et al., 2016), soil and steel plate (Mortara et al., 2010), soil and geomembrane (Sayeed et al., 2014; Prashanth et al., 2016; Ammar et al., 2019), and soil and bedrock interface (Jahanian and Sadaghiani, 2015). The shear behavior (shear mechanical characteristics, shear failure modes, and strength-influencing factors) of these interfaces has been investigated using experimental shear tests (Fleming et al., 2006; Mortara et al., 2010; Chai and Saito, 2016). It was found that the interfaces have obvious lower shear strength than pure soils and structures (Zhang et al., 2005) and that their shear behavior is influenced by interface roughness, normal stress, and shear rate (Tiwari et al., 2010). For example, the interfacial shear strength was found to increase gradually with increasing interface roughness (Huck et al., 1974; Canakci et al., 2016), and failure modes, such as sliding along the interface, shear-off through the interface, and simultaneous sliding and shear-off, were found to vary with interface roughness (Feligha et al., 2016; Zhou et al., 2019).
Based on these shear tests, researchers have informed attempts to establish theoretical and empirical shear strength criteria for the interface between geotechnical materials and structures (Gómez et al., 2003; Kosoglu et al., 2010; Kang and Liao, 2019; Kang et al., 2021). These include shear strength models for the interface between different rock types (Patton, 1966; Barton, 1973; Grasselli and Egger, 2003; Cottrell, 2009; Wu et al., 2018), rock and concrete (Andjelkovic et al., 2015; Krounis et al., 2016), soil and concrete (Gómez et al., 2003; Yazdani et al., 2019), and soil and geotextile (Esterhuizen et al., 2001; Iryo and Rowe, 2005; Tolooiyan et al., 2009; Portelinha and Zornberg, 2017). Due to the non-linear change in interfacial shear strength, new guidelines for shear model development consider the effect of the interface morphology on shear strength. For regular rough contact samples, Patton (1966) and Serrano et al. (2014) established some bilinear interfacial strength criteria based on two mechanisms of interface shear failure: slippage between asperities, and asperity failure. Other shear models were developed for regular contact interfaces by considering a continuum of three shear modes: sliding, separation, and cutoff of asperities (Ladanyi and Archambault, 1970; Huang et al., 2002; Johansson and Stille, 2014; Zhou et al., 2019). For irregular rough contact samples, models were proposed to take into account the interface roughness and contact intimacy to predict the variation of interface strength (Maerz et al., 1990; Shen et al., 2019).
In summary, although the shear characteristics of the interface between soils/sediments and various structures have received extensive attention, only a few studies have investigated the shear behavior of discontinuities between different soil/sediment types (Indraratna and Jayanathan, 2005; Jahanian and Sadaghiani, 2015), especially for loess with extensive interface contact types. Several investigations of the shear behavior of the loess–sand interface, loess–concrete interface, and loess–mudstone interface have found that the shear strength of these interfaces is much lower than that of pure materials, and some new strength criteria for anisotropy of interface are obtained (Qiao et al., 2016; Liu et al., 2018; Hong et al., 2019; Yang et al., 2020). However, the shear strength of interfaces between loess/Hipparion red clay remains poorly understood. This is especially the case for the interface between loess and Hipparion red clay, the slip zone of many large loess landslides in the Loess Plateau.
To address this lacuna, in this study, we investigate the shear characteristics of the loess–Hipparion red clay interface, the effect of the interface contact angle on failure mode, the shear deformation characteristics, and strength properties. Our study involves experimental work and modeling. Interface specimens with different contact angles were prepared with a specimen preparation device, and a series of direct shear tests were performed on these specimens under different normal stress conditions using purpose-built direct shear equipment. Based on these experimental results, we discuss the failure mode and the effect of the interface angle and normal stress on the shear behavior of the interface. We also developed an empirical shear model that takes into consideration the failure mode to estimate the peak shear strength of the interface. The accuracy of the proposed model is tested by comparing the experimental results with the model-derived values.
Materials and Methods
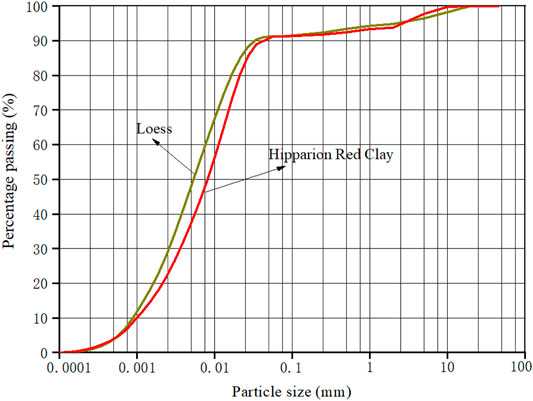
Soil Materials
The research area is in Xi’an that is located south of Loess Plateau in China (Figure 1A). In the area, there are five layers including Malan loess (Q3), Lishi loess (Q2), Wucheng loess (Q1), Hipparion red clay
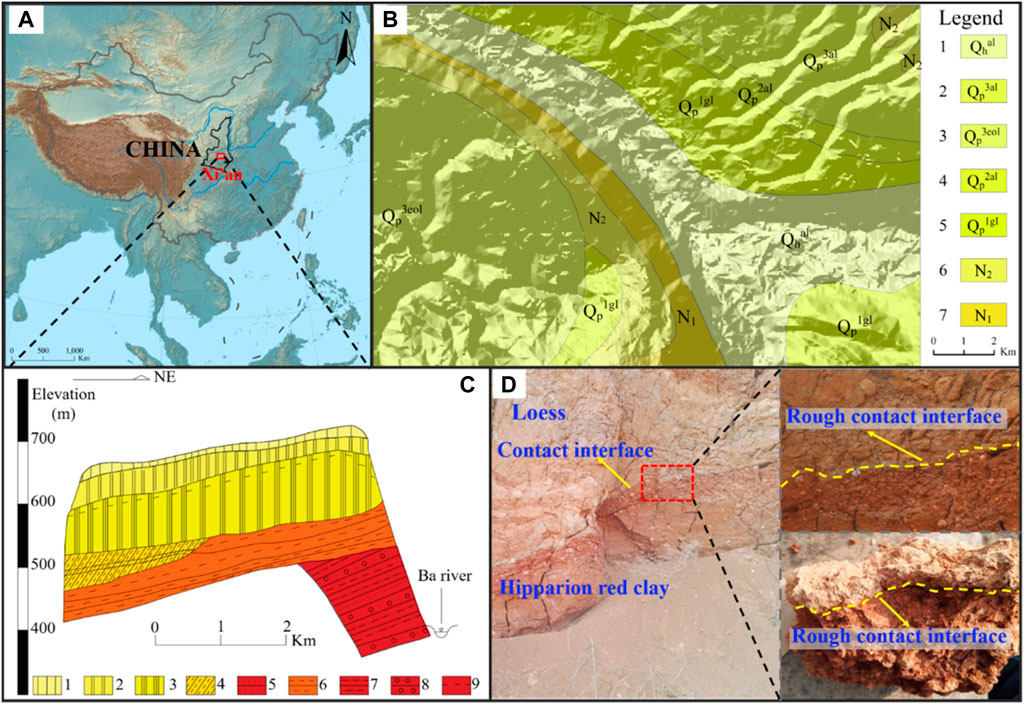
FIGURE 1. Location of research area and sampling site. (A) Research location and (B) geological map of research area: 1 the Holocene alluvial sediment, 2 the Upper Pleistocene alluvial loess, 3 the Upper Pleistocene aeolian loess, 4 the Middle Pleistocene alluvial loess, 5 the Lower Pleistocene glacial loess, 6 the Middle Neogene Stratum, 7 the Lower Neogene stratum, and (C) engineering geological profile of the study area (modified form the survey report of the second hydrological team of Shaanxi Bureau of Geology and mineral resources, 1979): 1 Malan loess, 2 Wucheng loess, 3 Lishi loess, 4 mild clay, 5 sand soil, 6 mudstone, 7 sandy mudstone, 8 conglomerate, 9 ground water table, and (D) rough loess—Hipparion red clay interface.
Specimen Preparation
Two types of contact interfaces in the remodeled samples should be set in the remodeled samples, to investigate the shear strength of the loess–red clay interface that is rough in the original layers at Chenjiapo landslide. The rough interface and smooth interface are set in the remodeled samples. The rough interface is set using a special device that comprises a bracket, a jack, and a specimen compaction cylinder consisting of a top cap, a cylinder, a base, and interface molds (Zhu et al., 2021b). The angle of the rough interface includes 0°,15°, 30°, 45°, and 60° made in a set of regular sawtooth metal molds that have the same length of 7.7 mm, and different heights of 0, 1.03, 2.22, 3.85, and 6.66 mm.
The remodeled samples with a rough interface are made in three steps. In the first step, the sawtooth mold was placed in the compaction cylinder, and the loess material is set in the specimen compaction cylinder and compacted. Then the sawtooth mold and the specimen were extracted from the compaction cylinder and detached, and the sawtooth joint was cloned on the loess specimen. The prepared loess specimen was then placed in the compaction cylinder as a mold, with the rough interface facing upward, and some Hipparion red clay material was inserted in the compaction cylinder, above the loess mold. After that, the cylinder fill was compacted again, so that the base of the Hipparion red clay material fitted the rough surface of the loess specimen exactly. Finally, the compressed specimen is extracted from the compaction cylinder using a jack. After the aforementioned steps, the specimen with the size of 61.8 mm in diameter and 20 mm in height was prepared (Zhu et al., 2021b).
Test Equipment and Procedure
The direct shear test on the specimens with loess–Hipparion red clay interface is conducted using computer-controlled direct shear equipment developed by Chang’an University and Zhongzhi Geotechnical Technology Co., Ltd, Nanjing (Zhu et al., 2021b). The equipment consists of a normal loading unit, a shear loading unit, a shear box, a data acquisition and controlling unit, and a measurement unit. The normal loading unit uses an air pressure cylinder to apply normal load in the range of 0–500 kPa, with an accuracy of ±1%. Pressure is provided by an air compressor. The shear loading unit uses a servomotor (type: RS57, with strain control from 0.025 to 6.35 mm/min and accuracy of ±5%, Nanjing, China) to apply the shear load in a strain-controlled manner. The shear box is made into two shapes and sizes suitable for different test standards: square (61.8 mm in side length; 20 mm in height) and circular (61.8 mm in diameter; 20 mm in height). The measurement unit consists of horizontal linear variable differential transformers (LVDTs; type: Fxg-81N; range: 0–10 mm; accuracy: 0.2%; Fuxin, China), vertical LVDTs (type: Fxg-80N; range: 0–5 mm; accuracy: 0.1%; Fuxin, China), and stress sensors (type: CSF-A; range: 0–2 kN; accuracy: 0.2%; Bengbu, China). The measurement unit allows automatic recording of the displacement and shear stress of the tested specimens by a controlling computer. The data acquisition and controlling unit consists of the controlling computer and the data acquisition and controlling instrument, which can be used to servo-control the normal and shear loading and to collect and transfer the data acquired by the measurement unit in real time.
Using computer-controlled direct shear equipment, five groups of specimens with sawtooth angles i of 0°, 15°, 30°, 45°, and 60° were tested. Samples in each group were tested under eight normal stress levels: 12.5, 25, 37.5, 50, 100, 200, 300, and 400 kPa. The direct shear test was carried out after fixing the interface specimen between the upper and lower shear boxes according to the method ASTM D5321/D5321M-14 (2014). Each specimen was settled in the shear box, and the normal load was applied at a rate of 1 kPa/s until a certain value. The normal load was kept constant during the following shearing process. Then the shear load was applied at a shear displacement rate of 0.8 mm/min until the shear displacement reached 4 mm that corresponds to the post-peak stage. During the direct shear test, the normal load, vertical displacement, shear load, and shear displacement were recorded automatically using a computer in real time.
Failure Modes
Exploring the failure modes is important for understanding the shear behavior of an interface. The final failure modes of interface specimens after shear testing are shown in Figure 3. It was found that the shear plane was generated along the contact interface of loess–Hipparion red clay. However, the failure modes are different due to different normal stress conditions and sawtooth angles. Based on the two types of shear behaviors—sliding along the sawtooth surface and failure through the sawtooth, the failure mode can thus be divided into three types: sliding, sliding, and shear-off, and cutoff (see Figure 3).

FIGURE 3. Failure modes of interface specimens. (A) Failure modes of specimens with the sawtooth angle i of 45° under various normal stresses, and (B) failure modes of specimens with various interface angles under normal stress of 200 kPa.
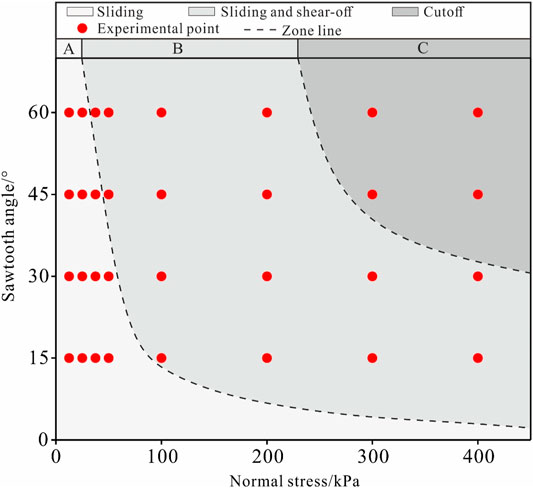
Figure 3 indicates that the failure mode depends on both the sawtooth angle and the normal stress, that is, the failure mode varies with the normal stress if the same sawtooth angle is the same, such as the specimen with a sawtooth angle i of 45° (Figure 3A). Under low normal stress (σ ≤ 25 kPa), the failure mode is sliding. Under medium normal stress (37.5 kPa ≤ σ ≤ 200 kPa), the shear failure mode is sliding and shear-off. Under high normal stress (σ ≥ 300 kPa), the shear failure mode is cutoff. Overall, as the normal stress increases, the failure mode transitions gradually from sliding to cutoff. Besides, the failure mode varies with the sawtooth angle if the normal stress is the same, such as the specimens under a normal stress of 200 kPa (Figure 3B). The failure mode transitions from sliding to shear-off with an increasing sawtooth angle. For the sliding mode, the interface specimens mainly slid along the sawtooth contact surface during the entire shear process. For sliding and shear-off modes, sliding along the sawtooth surface occurred first, and then the interfaces specimen was sheared off above the root of the sawtooth. For cutoff mode, the interface specimen was cutoff along the root of the sawtooth. These indicate that the shear process is pure sliding, or pure cutoff, or coupling of sliding and shear-off.
Furthermore, the dependency of the failure modes on the sawtooth angles and normal stresses is discussed in the normal stress–sawtooth angel plane, as shown in Figure 4. In the article, the normal stress and sawtooth angle for the transition of different failure modes are called the threshold values. The range of threshold values was divided according to the failure mode of samples as shown in the zone line (A-B line and B-C line) in Figure 4. It is obvious that the threshold values that distinguish different failure modes are not constant, which is related to normal stress and sawtooth angle. It should be noted that the cutoff mode is more likely to occur with a higher sawtooth angle and normal stress, whereas the sliding mode tends to occur with a lower sawtooth angle and normal stress.
To further explore the aforementioned failure modes, it is necessary to investigate the stress state of the sawtooth. Although the shear failure of discontinuity surfaces have been studied (Lee et al., 2001; Asadi et al., 2013; Serrano et al., 2014; Hong et al., 2016), few studies have focused on the stress state of a single asperity at a certain inclination angle (Zhang et al., 2019). In order to analyze the stress state of the sawtooth during shearing, we, respectively, define the sliding thrust Fc as the power force that makes the specimen slide upward along the sawtooth surface, the sliding resistance Fcr as the resistance that prevents the specimen from sliding upward along the sawtooth surface, the shear thrust Fs as the power force that makes the specimen to be sheared off through the sawtooth, and the shear resistance Fsr as the resistance that prevents the specimen from being sheared off through the sawtooth, as shown in Figure 5A.
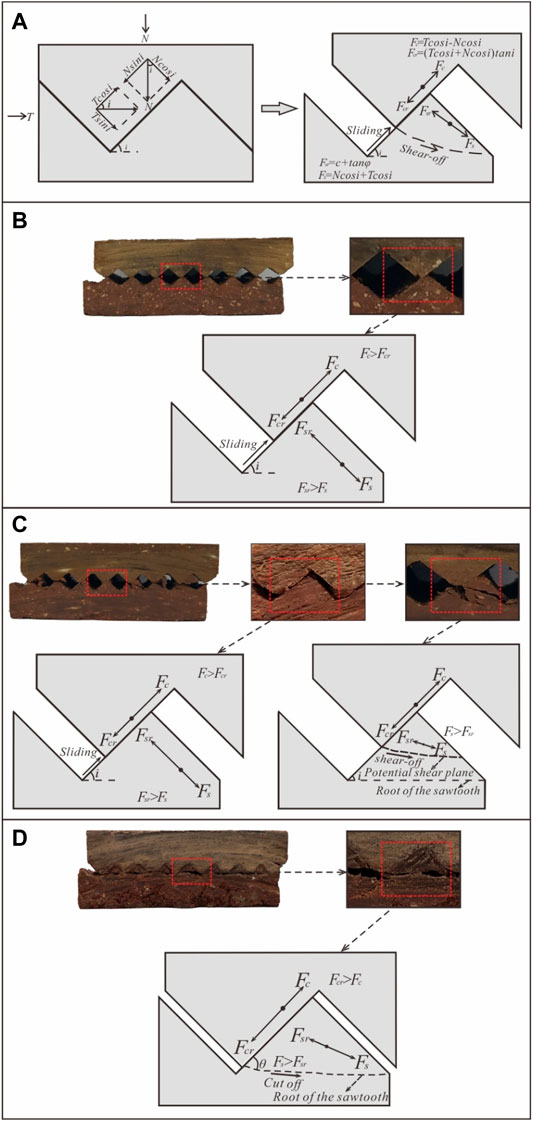
FIGURE 5. Force diagram for the sawtooth of specimen in different failure modes. (A) Force state of sawtooth before and after shear, (B) specimens in sliding mode, (C) specimens in sliding and shear-off mode, and (D) specimens in cutoff mode.
The normal and shear load generate the sliding thrust Fc, parallel to the contact interface, and generate the shear thrust Fs, perpendicular to the contact interface, as shown in Figure 5A. The calculation formulas of Fc and Fs are as follows:
where N is the normal load /kPa, T is the shear load /kPa, and i is the sawtooth angle/°.
The sliding resistance Fcr is composed of the friction strength between the sawtooth surfaces, and its value is rated to normal load and sawtooth angle (Figure 5A). The shear resistance Fsr is composed of the shear strength of sawtooth, and its value is rated to shear plane position of the sawtooth (Figure 5A). The calculation formulas of Fcr and Fsr are as follows:
where λ is the friction coefficient of the sawtooth surface, c is the cohesion of sawtooth materials /kPa, φ is the friction angle of sawtooth materials/°.
According to Figure 5A, it is clear that the failure mode of the interface depends on the relationship between the sliding thrust acting on the sawtooth and the sliding resistance between the sawtooth surface, Fc and Fcr, and, also, on the relationship between the shear thrust acting on the sawtooth and the shear resistance of the sawtooth, Fs and Fsr. Figure 5 shows the force diagram for the sawtooth of the specimen in different failure modes. At low normal stress and sawtooth angle, the sliding resistance Fcr between the sawtooth surface is also low, and the sliding thrust Fc can easily overcome it. In this situation, sliding occurs along the sawtooth surface (Figure 5B). With increasing normal stress and sawtooth angle, at the initial stage of shearing, the shear thrust Fs is smaller than the shear resistance Fsr, but the sliding thrust Fc can overcome the sliding resistance Fcr. In this condition, sliding along the sawtooth surface occurs first. Then the potential shear plane position on the sawtooth surface continues to move up with sliding until the shear thrust Fs can overcome the shear resistance Fsr of the potential cut part of the sawtooth. At this moment, the specimen is sheared off through the sawtooth, and the shear-off plane is located above the root of the sawtooth (Figure 5C). With even higher normal stress and sawtooth angles, the sliding resistance Fcr increases continually, and the sliding thrust Fc is insufficient to overcome the increasing sliding resistance Fcr. However, shear thrust Fs can overcome the shear resistance Fsr, and then the specimen is cutoff directly through the root of the sawtooth (Figure 5D).
Shear Deformation Characteristics
Shear Stress Versus Shear Displacement
Figure 6 shows the typical shear curves for specimens with different sawtooth angles subjected to different normal stresses. It is obvious that the shear strength of the interface specimen is lower than that of pure loess or pure Hipparion red clay specimens. Most of the shear curves are non-linear with stress reducing sharply after peak stress as the shear displacement increases. The stress reducing sharply means the interface specimen is cutoff along the potential shear plane in the sawtooth. Then the shear stress gradually comes to a stable state corresponding to the residual shear strength. The evolution characteristics of shear curves are related to the normal stress and sawtooth angles. First, the sawtooth angle has a great effect on the shear curves of the interface, especially the peak strength and the post-peak stress-dropping behavior, that is, the peak strength of the interface increases with increasing sawtooth angle; however, the post-peak stress-dropping first increases and then decreases as the sawtooth angle increases (Figure 7A). Second, the normal stress also greatly affects the shear behavior of the interface, especially the pre-peak curves, peak strength, and the post-peak curves (Figure 6), that is, both shear stiffness and peak strength of the interface increase gradually with increasing normal stress, and the post-peak stress drop is more pronounced with increasing normal stress, suggesting that the difference between the peak shear stress and the residual shear becomes larger (Figure 7B).
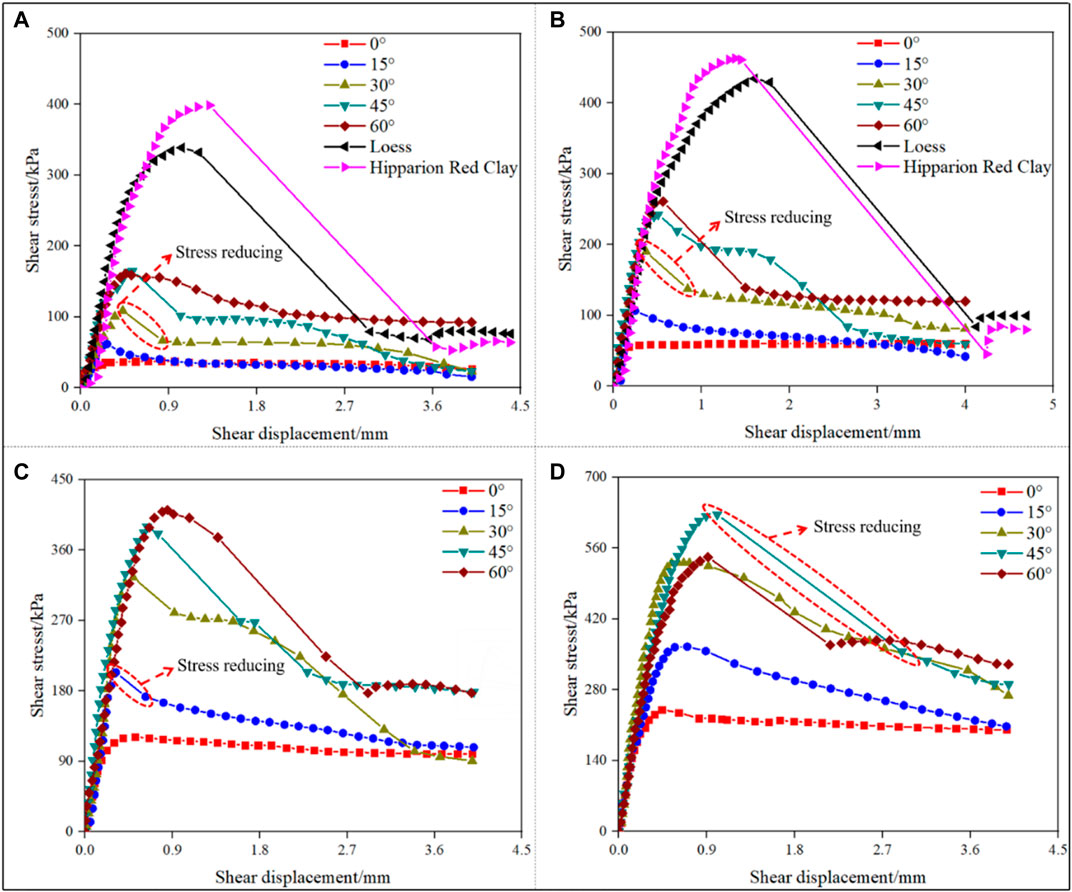
FIGURE 6. Shear stress–shear displacement curves for interface specimens with different sawtooth angles. (A) Normal stress with 50 kPa, (B) normal stress with 100 kPa, (C) normal stress with 200 kPa, and (D) normal stress with 400 kPa.
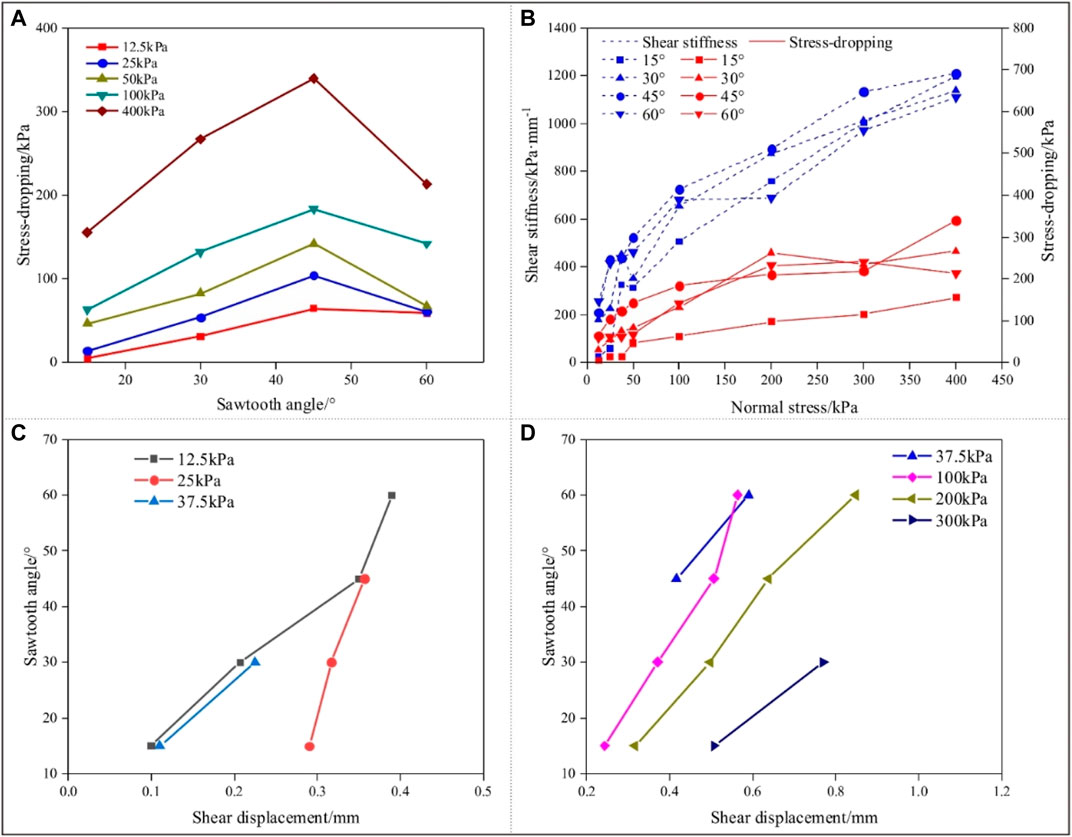
FIGURE 7. Variation of shear stiffness, post-peak stress and shear displacement of interface specimens. (A) Post-peak stress-dropping, (B) shear stiffness, and post-peak stress-dropping, (C) shear displacement corresponding to peak stress of specimens in sliding mode, and (D) shear displacement corresponding to peak stress of specimens in sliding and shear-off mode.
The aforementioned change in the shear curves reflects different failure modes that are related to normal stress and sawtooth angle. When normal stress or sawtooth angle is small, the sliding mode takes place along the contact interface after peak stress (Figure 5B). The shear displacement corresponding to peak stress reflects the occurrence of the sliding failure, and the sliding failure occurs earlier if shear displacement corresponding to peak stress is small (Figure 7C). Furthermore, the shear displacement corresponding to peak stress increases with the increasing sawtooth angle, indicating the larger sliding displacement at failure (Figure 7C).The sliding failure will transform from the sliding mode to the shear-off mode as normal stress and sawtooth angle increase (Figure 7D). This can be verified by the sharper shear stress dropping after peak stress (Figure 7A), which corresponds to the cutoff failure of the sawtooth. Furthermore, the shear-off failure occurs earlier if the shear displacement corresponding to peak stress is smaller. Smaller shear displacement corresponding to peak stress indicates that the plastic deformation of the interface specimen at failure is smaller, and this usually occurs for the interface specimen with relatively small sawtooth angles (Figure 7D).
Shear Dilatancy Characteristics
Normal Displacement
The normal deformation is caused by the sliding along the interface, which is influenced by normal stress and sawtooth angle, as shown in Figure 8. Such as the typical normal displacement curves of interface specimens with different sawtooth angles subjected to the normal stress of 400 kPa (Figures 8A,B), the normal displacement first increases and then stabilizes as shear displacement and shearing time increase. However, with an increasing sawtooth angle, there is an obvious hysteresis effect in the occurrence time of normal displacement (Figure 8A); after its onset, the normal displacement first increases and then decreases with the increasing sawtooth angle (Figure 8B). This influence of the sawtooth angle on normal displacement is mainly related to the failure model. With a low sawtooth angle, the sliding mode is more likely to occur, so the normal deformation increases with an increasing sawtooth angle at first. As the sawtooth angle continues to increase, the shear failure gradually transitions from the sliding mode to the shear-off mode (Figure 3B).In this case, the sliding of the interface decreases during shearing, which results in attenuation of normal displacement with an increasing sawtooth angle (Figures 8A,B).
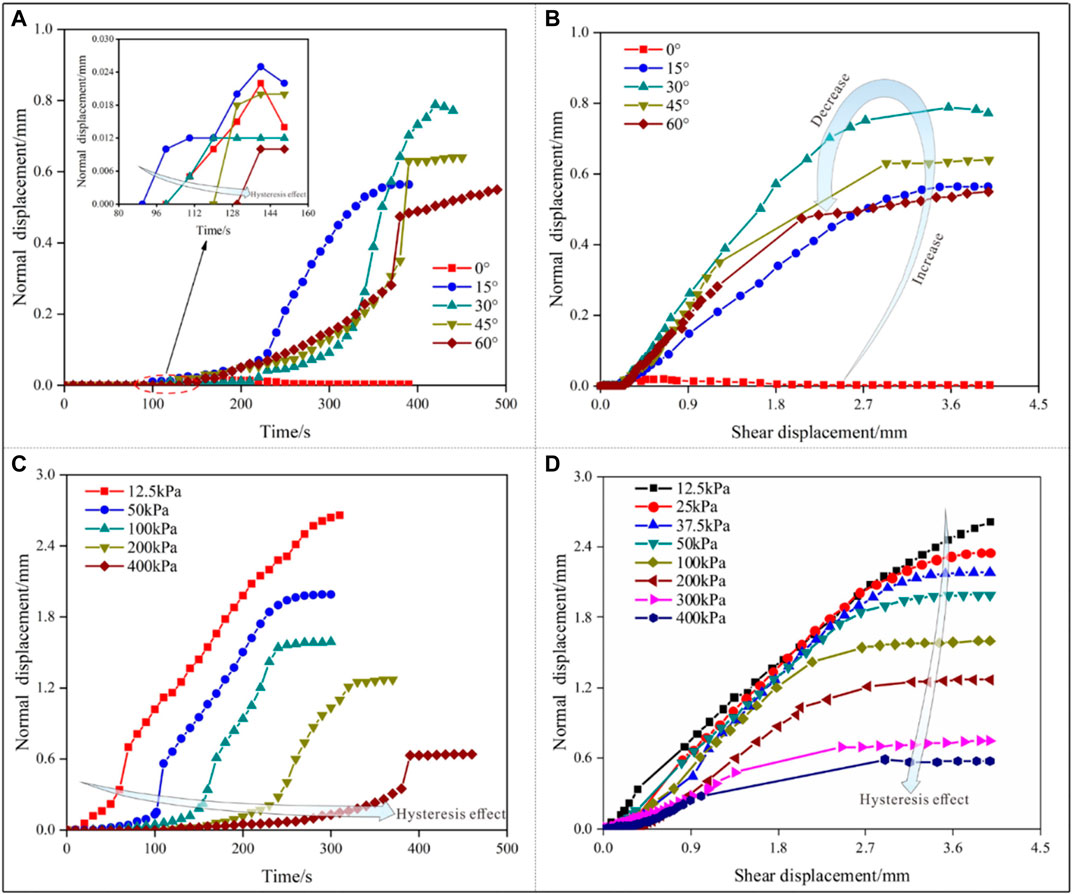
FIGURE 8. Normal displacement curves of interface specimens. (A) Normal displacement–time curves of specimens subjected to the normal stress of 400 kPa, (B) normal displacement–shear displacement curves of specimens subjected to the normal stress of 400 kPa, (C) normal displacement–time curves of specimens with sawtooth angle of 45°, and (D) normal displacement–shear displacement curves of specimens with sawtooth angle of 45°.
The evolution of normal displacement is also significantly affected by normal stress. Figures 8C,D present typical normal displacement curves of interface specimens with a sawtooth angle of 45° subjected to different normal stress. With increasing normal stress, there is also an obvious hysteresis effect in the occurrence time of normal displacement (Figure 8C); after its emergence, the normal displacement decreases gradually with increasing normal stress (Figure 8D). This influence in normal stress on normal displacement is mainly related to the failure mode. With low normal stress, sliding along the sawtooth surface results in a rapid increase in the normal displacement with increasing shearing time (Figure 8C). As the normal stress continues to increase, the shear failure gradually transitions to the cutoff mode (Figure 3A), and thus, the decreased sliding results in the reduction of the normal displacement during shearing, as shown in Figure 8D.
The normal displacement develops in stages according to the increment rate of the normal displacement. Figure 9 shows the typical stage division of normal displacement curves of interface specimens with different failure modes, which indicates the stage division of these curves is different from failure modes. Figure 9A presents the stage division for interface specimens with sliding mode. The normal displacement curve can be divided into three stages: compaction of the sawtooth interface in the compaction stage, sliding along the sawtooth surface in the sliding stage, and the friction on the shear plane in the friction stage. For interface specimens with sliding and shear-off modes, the normal displacement curve can be divided into four stages: compaction of the sawtooth interface in the compaction stage, sliding along the sawtooth surface in the sliding stage, cutting through the sawtooth in the cutting stage, and friction on the shear plane in friction stage (Figure 9B). For interface specimens with a cutoff mode, the normal displacement curve can be divided into four stages: compaction of the sawtooth interface in the compaction stage, plastic deformation of the sawtooth in the deformation stage, cutting through the sawtooth in the cutting stage, and friction on the shear plane in friction stage (Figure 9C).
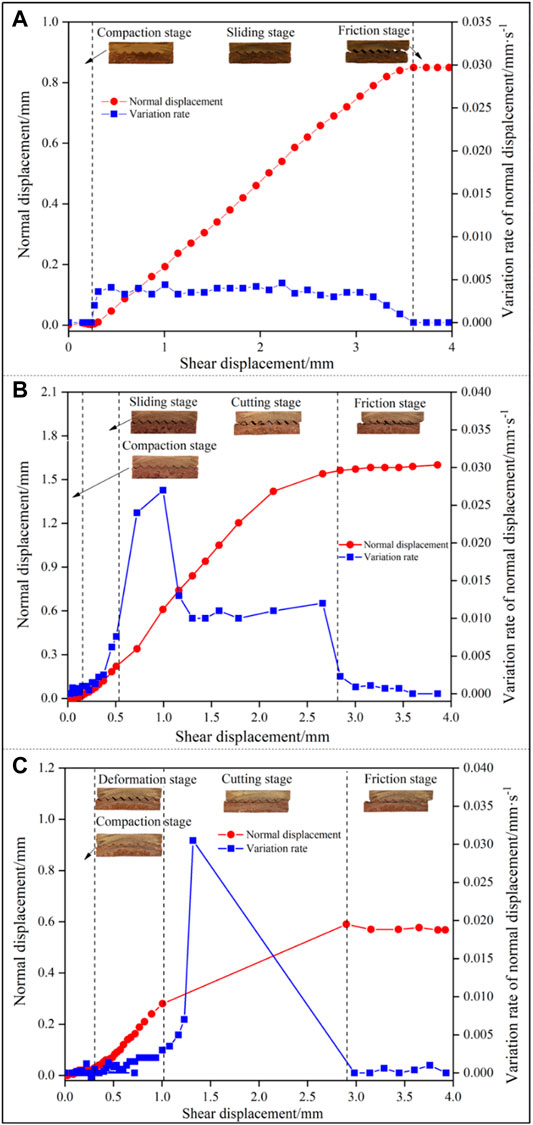
FIGURE 9. Stage division of normal displacement of interface specimens with different failure modes. (A) Sliding: specimen with sawtooth angle of 15° under normal stress of 25 kPa, (B) sliding and shear-off: specimen with sawtooth angle of 45° under normal stress of 100 kPa, and (C) cutting off: specimen with sawtooth angle of 45° under normal stress of 400 kPa.
The variation in normal displacement at the different stages above is different. In the compaction stage, although the shear displacement increases, the normal displacement is almost absent (Figures 9A–C). This is because the sawtooth is continuously compacted under the action of horizontal shear in this stage with no sliding. In the sliding stage, the normal displacement rapidly increases with the shear displacement, indicating that the sawtooth slides upward along the sawtooth interface quickly in this stage (Figures 9A,B). In the cutting stage, the increase rate of shear normal displacement increases abruptly at first and then decreases gradually (Figure 9B). The normal displacement thus increases by leaps to a peak value, indicating that the specimen is instantaneously sheared off through the sawtooth in this stage (Figure 9B). During the friction stage, the normal displacement remains steady, indicating that only frictional behavior along the shear plane occurs in this stage (Figures 9A–C).
Peak Shear Dilatancy Angle
The peak normal displacement is the maximum dilatation of the interface specimen after failure. The ratio of the peak normal displacement to the horizontal displacement is defined as the peak shear dilatancy angle in this article. It was found that all specimens exhibit shear dilatation, as shown in Figure 10. Figure 10A shows that the peak normal displacement is influenced by the sawtooth angle and normal stress. That is, the peak normal displacement decreases with increasing normal stress and increases first and then decreases with the increasing sawtooth angle. As shown in Figure 10B, the peak shear dilatancy angle also changes significantly with the sawtooth angle and normal stress. Specifically, the peak shear dilatancy angle decreases with increasing normal stress, and this indicates that the volumetric deformation of the interface gradually decreases after shear failure. In addition, the peak shear dilatation angle increases with the increasing sawtooth angle, and its increment drops with increasing normal stress. This indicates that the increment of volumetric deformation of the specimen gradually decreases after shear failure. It should be mentioned that the changing of the peak normal displacement and peak dilatancy angle are all related to the failure mode of the interface including sliding mode, sliding and shear-off mode, and cutoff mode (see Figure 3 and Figure 10), that is, shear dilatation is more obvious when the sliding mode occurs, while the shear dilatation is small when sliding and shear-off mode occurs.
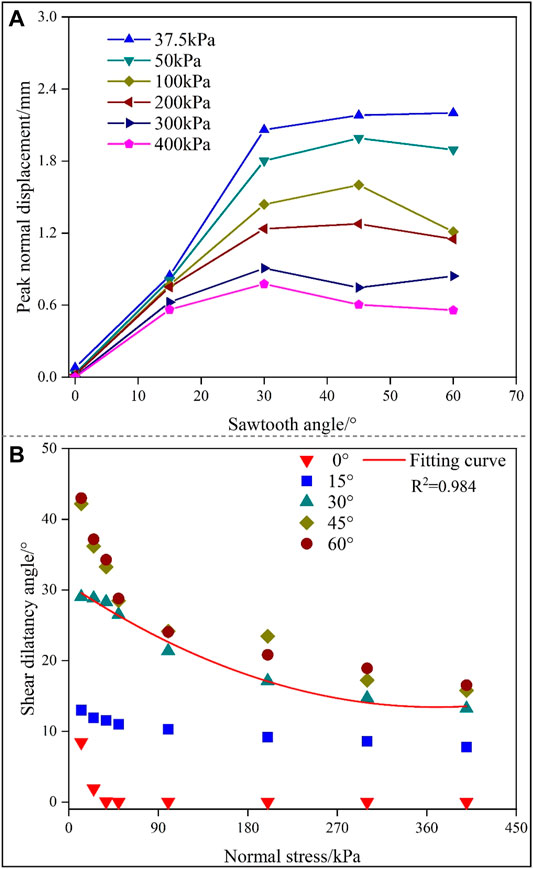
FIGURE 10. Variation of peak normal displacement and shear dilatancy angle of interface specimens. (A) Peak normal displacement of specimens with different sawtooth angles and (B) peak shear dilatancy angle of specimens with different normal stresses.
Shear Strength Characteristics
Interfacial Shear Strength
Figure 11 shows the influence of the sawtooth angle and normal stress on the peak strength in a three-dimensional space coordinate system. It is obvious that the peak strength of the interfacial specimen is lower than that of the pure loess specimen or pure Hipparion red clay specimen, indicating that discontinuities between the loess and the Hipparion red clay reduce the shear strength of specimens significantly (Figure 11A). The peak strength increases linearly with increasing normal stress if the interface is smooth (with a sawtooth angle of zero). While the peak strength increases non-linearly with increasing normal stress if the interface is rough (with a sawtooth angle larger than zero), and the increment of peak strength decreases gradually (Figure 11B). This influence is related to the failure mode including sliding mode, sliding and shear-off mode, and cutoff mode. The sliding mode occurs if normal stress and the sawtooth angle are small (see Figure 4), and the peak strength is related to the friction strength between the interface that increases with increasing normal stress and the sawtooth angle, as shown in Figure 5. Therefore, the peak strength increases rapidly with increasing normal stress and sawtooth angle (Figure 11). However, the cutoff mode occurs with continuous increase in normal stress and the sawtooth angle (Figure 4), and the peak strength is related to the shear strength of the sawtooth, as shown in Figure 5. The shear strength of the sawtooth increases with the increasing normal stress and sawtooth angle, but its increment is lower than that of friction strength between the interface with the increasing normal stress and sawtooth angle. Therefore, the increment of peak strength with the increasing normal stress and sawtooth angle drops gradually.
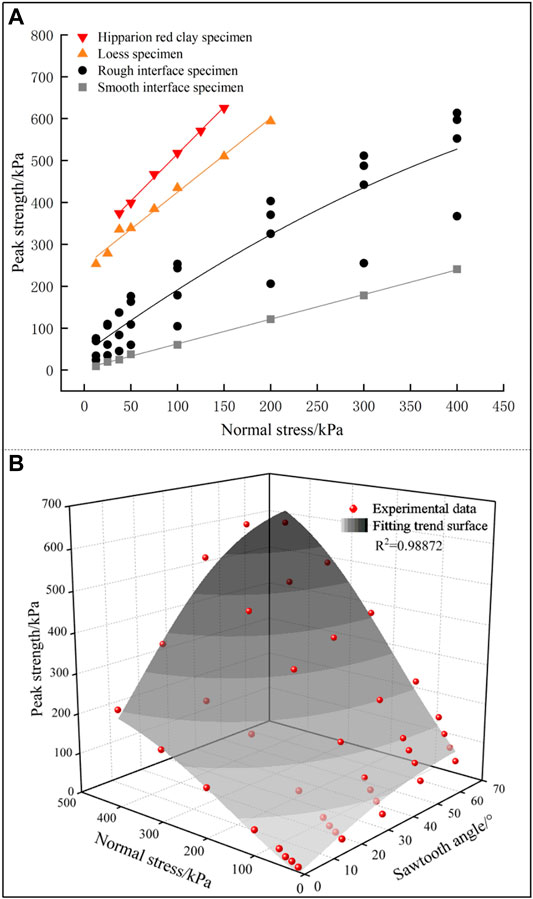
FIGURE 11. Variation of peak strength of interface samples. (A) Peak strength–normal stress curves and (B) relationship of peak strength versus normal stresses and sawtooth angles.
The shear strength curves of the interface specimens were divided into stages according to the failure mode. Figure 12 presents the staged shear strength curves of interface specimens under normal stress in the 0–400 kPa range. As this figure shows, there are three types of curves. When the contact interface angle is zero, the shear strength curve is linear (Figure 12A). When the sawtooth angle is 15° or 30°, the shear strength curve is divided into two stages (Figures 12B,C). When the sawtooth angle is 45° and 60°, the shear strength curve is divided into three stages (Figures 12D,E). Evidently, the staged expression of the shear strength envelope can accurately reflect the evolution of the interfacial shear strength, and the shear strength in each stage conforms to the Coulomb strength criterion. The dividing points σa and σb that demarcate each stage are defined as the normal stress thresholds. When σ ≤ σa, the shear failure is the sliding mode; when σa < σ ≤ σb, the shear failure is the sliding and shear-off mode; and when σ>σb, the shear failure is the cutoff mode. The normal stress thresholds σa and σb can be obtained as follows: based on the experimentally observed failure mode of the interface under different normal stress (Figure 4), the measured shear strength of specimens with the same failure mode is fitted with linear Coulomb strength criterion. The intersection point of each linear strength line corresponds to the normal stress threshold. Note that the normal stress threshold used to divide the shear strength curve is not a constant, and it varies with sawtooth angle.
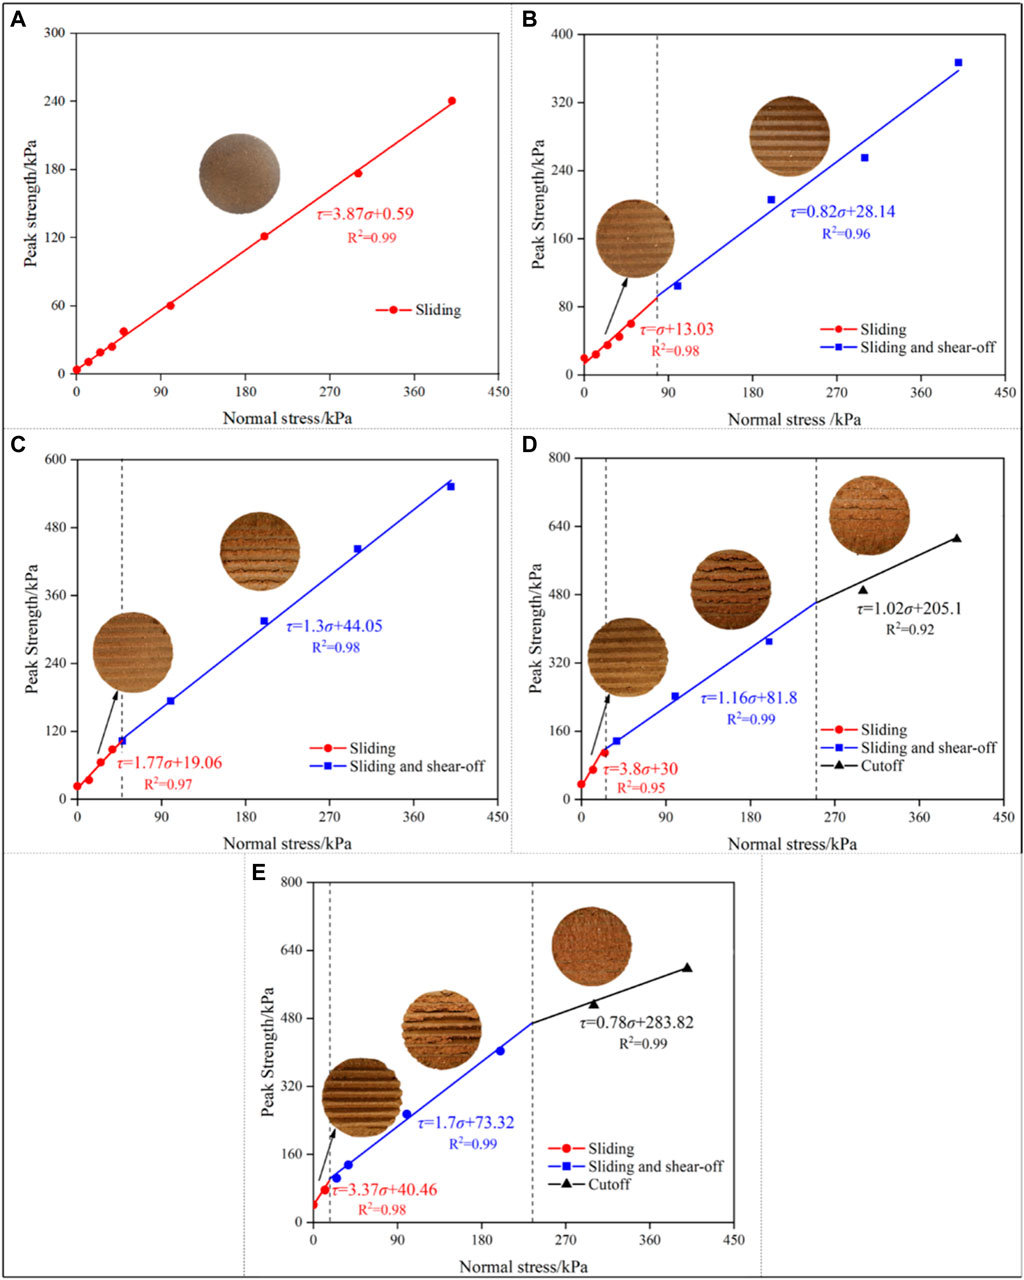
FIGURE 12. Shear strength envelope of interface specimens. (A) Sawtooth angle with 0°, (B) sawtooth angle with 15°, (C) Sawtooth angle with 30°, (D) sawtooth angle with 45°, and (E) sawtooth angle with 60°.
An Empirical Shear Model of Interface
The experimental results indicate that the shear strength of the interface changes in a non-linear manner; therefore, the non-linear change in shear strength of the interface cannot be evaluated by the linear Coulomb criterion. Thus, it is necessary to formulate an empirical shear model to describe the non-linear shear strength change of interface inspired by other non-linear strength models of geotechnical materials with structural planes (Patton, 1966; Ladanyi and Archambault, 1970; Maerz et al., 1990; Serrano et al., 2014; Barton, 1973; Huang et al., 2002; Andjelkovic et al., 2015; Zhou et al., 2019). Based on the stage division of the shear strength of the interface (Figure 12), a staged interfacial shear model is formulated as follows:
where σ is the normal stress; ϕ is the total friction angle containing the friction angle between the sawtooth contact interface and the friction angle of the sawtooth, and C is the total cohesion containing the cohesion between the sawtooth contact interface and the cohesion of the sawtooth.
The staged interfacial shear model is established according to the failure mode as follows:
Sliding Mode
When the shear failure of the interface specimen is the sliding mode, the shear strength consists of the friction strength and the cohesive strength between the sawtooth contact interface (see Figure 13), and the friction strength is related to the sawtooth contact angle and normal stress. In many shear strength formulas of structural interfaces on geotechnical materials (Patton, 1966; Ladanyi and Archambault, 1970; Barton, 1973), the relationship between shear strength and dilatancy angle was established. Especially for rock samples with regular sawtooth interfaces, as the dilatancy angle is equal to the sawtooth contact angle, the relationship between shear strength and dilatancy angle can be established directly. Inspired by this, the functional relationship between shear strength and dilatancy angle can be established as follows:
where ϕs is the static friction angle between the sawtooth contact interface (which is equal to the friction angle between the sawtooth contact interface when the sawtooth angle is zero); βp is the dilatancy angle corresponding to the peak strength of the interface; and Ci is the cohesion between the sawtooth contact interface.
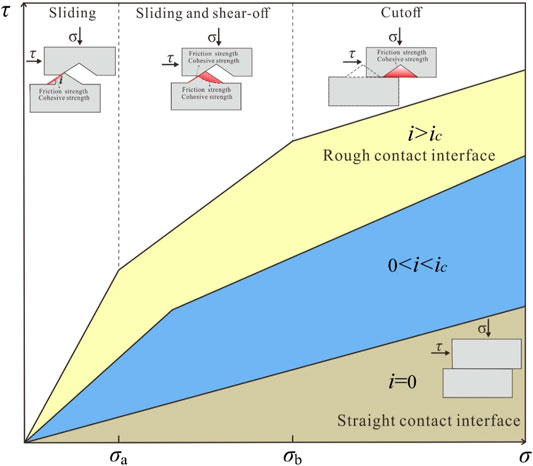
FIGURE 13. Shear strength envelope of the interface expressed in stages based on the proposed shear model.
Sliding and Shear-off Mode
When the shear failure is the sliding and shear-off mode, the shear strength consists of the friction and cohesive strength between the sawtooth contact interface (corresponding to the sliding process), and the friction and cohesive strength of the sawtooth (corresponding to the shear-off process), as shown in Figure 13. Therefore, we need to establish a strength formula that can reflect the whole process of sliding and shear-off.
The friction strength between the sawtooth contact interface, related to the sawtooth angle and normal stress, can be established as a function of the peak dilatancy angle. The friction strength of the sawtooth can be established as a function of the basic friction angle of the sawtooth determined by the residual strength. Taboada et al. (2006) studied the interfacial shear strength of cohesive granular materials and reported that the dilatancy angle at the peak state can be expressed as a function of the difference between the peak and the residual friction angles. Inspired by this work, the peak friction angle of the interface, ϕp, is established as the sum of two terms of different origins: the basic friction angle, ϕr, and the peak dilatancy angle, βp, as follows:
where ϕp is the peak friction angle, determined by the peak strength; ϕr represents the contribution of pure friction to the shear strength, determined by the residual strength; and βp represents the contribution of dilatancy to the shear strength.
The cohesive strength of the interface is composed of the cohesive strength between the sawtooth contact interface, Ci, and the cohesive strength of the sawtooth, Cs. The cohesive strength Cs, related to the shearing position of the sawtooth (Figure 13), can be expressed as follows:
where Cr is the cohesive strength of the sawtooth when the specimen is sheared off through the root of the sawtooth (see Figure 10) and k is a correction coefficient related to the normal stress and the position of shear plane. k is calculated as follows:
where a and b are test parameters. Note that that k is a coefficient smaller than 1.
Therefore, the shear model of an interface with sliding and shear-off mode can be expressed as follows:
Cutoff Mode
When the shear failure is the cutoff mode, the shear strength is mainly composed of the cohesive strength and the friction strength of the sawtooth (Figure 13). The friction strength of the interface can be regarded as the combination of dilatancy and friction. Therefore, the shear model of an interface with the cutoff mode is expressed as follows:
According to the aforementioned analysis, an empirical shear model of an interface is obtained as follows:
The shear model parameters ϕs, ϕr, βp, Ci, and Cr were obtained from the test-derived values of peak strength, residual strength, dilatancy displacement, and shear displacement of the interface specimens. The shear model parameters a and b were calculated from the fitted line of shear strength expressed in stages (Figure 12). The values of the shear model parameters are listed in Table 1.
Model Validation
In order to verify the accuracy of the proposed shear model, firstm the theoretical values of the shear strength of the interface under different normal stress were calculated by using Eq. 12. Then the model-derived values of shear strength of interfaces were compared with the experimental values, as shown in Table 2. It is obvious that the proposed interface shear model shows a satisfying prediction accuracy with prediction errors were between −31.66% and +16.68%. This indicates that the proposed interfacial shear model can be used to estimate the shear strength of the loess–Hipparion red clay interface with relative accuracy.
Based on the proposed shear model, the shear strength envelope of the interface can be expressed in stages, as shown in Figure 13. If the contact interface of the specimen is smooth, that is, when the sawtooth surface angle is 0, the shear strength of the interface specimens conforms to the linear Coulomb strength criterion. If the contact interface of the specimen is rough, the shear strength curve is a non-linear, composed of three stages related to the failure mode: sliding mode for σ ≤ σa, sliding and shear-off mode for σa< σ ≤ σb, and cutoff mode for σ > σb. The normal stress thresholds σa and σb are not constant and decrease with increasing sawtooth angle (see Figure 4 and Figure 12).
Furthermore, Figures 12, 13 also show that the shear strength curves can be divided into two or three stages under the range of normal stress used in this test (0–400 kPa). This indicates that there is also a sawtooth angle threshold, ic (Figure 13), that is, when the sawtooth angle i < ic, the shear strength curve is two-staged because the cutoff mode does not occur under normal stress in the range of 0–400 kPa; when i > ic, the shear strength curve is three-staged, indicating that all three modes of shear failure including sliding, sliding and shear-off, and cutoff occur. Based on the stage division of the shear strength curves (Figure 4 and Figure 12), the sawtooth angle threshold ic is estimated between 30° and 45°.
Based on the shear strength characteristics of interface specimens, it is noted that the discontinuous loess–Hipparion red clay interface has significantly lower shear strength, and the contribution of the interface to shear performance (failure mode, shear deformation, and shear strength) varies with the interface roughness and applied normal stress. For the loess–Hipparion red clay interface, if the contact interface is approximately flat, the interfacial shear strength is lower. However, if the contact surface is rough, the interfacial strength is higher than that of the flat interface, and increases with increasing roughness. Therefore, for the genetic mechanism analysis of loess landslides, the weak shear strength of sedimentary unconformity interface between loess and Hipparion red clay should be fully considered. Nevertheless, the influence of the contact interface roughness on the formation of loess slopes requires further research.
Conclusion
A list of shearing tests on the loess–Hipparion red clay interface was conducted to better explore the interface’s shear performance and influencing factors. In the shearing tests, rough interface specimens with different contact angles were prepared and subjected to different normal stress. The test results indicate that contact interface roughness and normal stress greatly influence the shear performance including failure mode, shear deformation, and shear strength. The detailed conclusions are shown as follows:
1) The shear failure mode of the loess–Hipparion red clay interface can be divided into three types. The shear failure modes are related to the interface roughness and normal stress, and different failure modes can be identified according to the shear dilatancy in the shear process. The loess–Hipparion red clay interface undergoes the sliding mode if interface roughness is low and large shear dilatation of specimens due to sliding can be observed. With higher interface roughness, the cutoff mode is more likely to occur, and the shear dilatation of specimens is small with this failure mode.
2) Discontinuities between loess and the Hipparion red clay reduce the shear strength of the soil/sediment significantly. The roughness of the contact interface greatly affects the shear strength. The peak shear strength is found to increase non-linearly with increasing interface roughness. Meanwhile, the increment of shear strength decreases for high-angle contact interfaces. It should be noted that the trend of interfacial shear strength is related to the shear failure mode. The sliding mode is likely to occur if the interface roughness or normal stress is small, and the peak strength increases rapidly with increasing friction resistance on the interface. The increment of peak strength decreases gradually as the mode of interface failure transitions from the sliding mode to cutoff mode if the interface roughness and normal stress further increase.
3) An empirical shear model considering the shear failure mode was developed to describe the non-linear variation of shear strength of interfaces with interface angle and normal stress. The model was further validated by comparing the model prediction and experimental results. The results indicate that the empirical shear model can capture the peak shear strength of the interface with relative accuracy (estimation errors −18.17–10.35%). The aforementioned results not only provide a reference for understanding the interfacial shear but also explore both the importance of interfacial properties and normal stress in the mechanical behavior of contact interfaces, especially the shear behavior of interfaces between different soils and sediments.
Data Availability Statement
The original contributions presented in the study are included in the article/supplementary material; further inquiries can be directed to the corresponding authors.
Author Contributions
SM and HL conducted model test. YZ and SM wrote the paper. YH made figures. HL provided article revision.
Funding
This study was financially supported by the National Natural Science Foundation of China (41877247, 41790443, and 41927806).
Conflict of Interest
The authors declare that the research was conducted in the absence of any commercial or financial relationships that could be construed as a potential conflict of interest.
Publisher’s Note
All claims expressed in this article are solely those of the authors and do not necessarily represent those of their affiliated organizations, or those of the publisher, the editors, and the reviewers. Any product that may be evaluated in this article, or claim that may be made by its manufacturer, is not guaranteed or endorsed by the publisher.
References
Ammar, A., Najjar, S., and Sadek, S. (2019). Mechanics of the Interface Interaction between Hemp Fibers and Compacted clay. Int. J. Geomechanics 19 (4), 1–15. doi:10.1061/(asce)gm.1943-5622.0001368
Andjelkovic, V., Pavlovic, N., Lazarevic, Z., and Nedovic, V. (2015). Modelling of Shear Characteristics at the concrete-rock Mass Interface. Int. J. Rock Mech. Mining Sci. 76, 222–236. doi:10.1016/j.ijrmms.2015.03.024
Asadi, M. S., Rasouli, V., and Barla, G. (2013). A Laboratory Shear Cell Used for Simulation of Shear Strength and Asperity Degradation of Rough Rock Fractures. Rock Mech. Rock Eng. 46 (4), 683–699. doi:10.1007/s00603-012-0322-2
ASTM Standard (2014). D5321/D5321M-14 Standard Test Method for Determining the Strength of Soil-Geosynthetic and Geosynthetic-Geosynthetic Interfaces by Direct Shear. West Conshohocken: ASTM International.
Barton, N. (1973). Review of a New Shear-Strength Criterion for Rock Joints. Eng. Geology. 7 (4), 287–332. doi:10.1016/0013-7952(73)90013-6
Canakci, H., Hamed, M., Celik, F., Sidik, W., and Eviz, F. (2016). Friction Characteristics of Organic Soil with Construction Materials. Soils and Foundations 56 (6), 965–972. doi:10.1016/j.sandf.2016.11.002
Chai, J. C., and Saito, A. (2016). Interface Shear Strengths between Geosynthetics and Clayey Soils. Int. J. Geosynthetics Ground Eng. 2 (3), 19. doi:10.1007/s40891-016-0060-8
Cottrell, B. (2009). Updates to the GG-Shear Strength Criterion. Dissertation: University of Toronto.
Esterhuizen, J. J. B., Filz, G. M., and Duncan, J. M. (2001). Constitutive Behavior of Geosynthetic Interfaces. J. Geotechnical Geoenvironmental Eng. 127 (10), 834–840. doi:10.1061/(asce)1090-0241(2001)127:10(834)
Feligha, M., Hammoud, F., Belachia, M., and Nouaouria, M. S. (2016). Experimental Investigation of Frictional Behavior between Cohesive Soils and Solid Materials Using Direct Shear Apparatus. Geotech Geol. Eng. 34 (2), 567–578. doi:10.1007/s10706-015-9966-5
Fleming, I. R., Sharma, J. S., and Jogi, M. B. (2006). Shear Strength of Geomembrane-Soil Interface under Unsaturated Conditions. Geotextiles and Geomembranes 24 (5), 274–284. doi:10.1016/j.geotexmem.2006.03.009
Gómez, J. E., Filz, G. M., and Ebeling, R. M. (2003). Extended Hyperbolic Model for Sand-To-concrete Interfaces. J. Geotechnical Geoenvironmental Eng. 129 (11), 993–1000. doi:10.1061/(asce)1090-0241(2003)129:11(993)
Grasselli, G., and Egger, P. (2003). Constitutive Law for the Shear Strength of Rock Joints Based on Three-Dimensional Surface Parameters. Int. J. Rock Mech. Mining Sci. 40 (1), 25–40. doi:10.1016/s1365-1609(02)00101-6
He, X. (2014). Research on the Formation Mechanism of Landslide on the Left Bank of Bahe River in Xi’An --case Study on Chendongpo Landslide. Beijing: China University of Geosciences.
Hebeler, G. L., Martinez, A., and Frost, J. D. (2016). Shear Zone Evolution of Granular Soils in Contact with Conventional and Textured CPT Friction Sleeves. KSCE J. Civ Eng. 20 (4), 1267–1282. doi:10.1007/s12205-015-0767-6
Hong, E.-S., Kwon, T.-H., Song, K.-I., and Cho, G.-C. (2016). Observation of the Degradation Characteristics and Scale of Unevenness on Three-Dimensional Artificial Rock Joint Surfaces Subjected to Shear. Rock Mech. Rock Eng. 49 (1), 3–17. doi:10.1007/s00603-015-0725-y
Hong, Y., Zhou, R., Zheng, X. Y., and Ling, X. C. (2019). Shear Mechanical Properties of Sand-Loess under Different Drainage Conditions. J. Jilin Univ. (Earth Sci. Edition) 49 (4), 1073–1081. doi:10.13278/j.cnki.jjuese.20170320
Huang, T. H., Chang, C. S., and Chao, C. Y. (2002). Experimental and Mathematical Modeling for Fracture of Rock Joint with Regular Asperities. Eng. Fracture Mech. 69 (17), 1977–1996. doi:10.1016/s0013-7944(02)00072-3
Huck, P. J., Liber, T., and Chiapetta, R. L. (1974). Dynamic Response of Soil/concrete Interface at High Pressure. Int. J. Rock Mech. Mining Sci. 13 (11), 132.
Indraratna, B., and Jayanathan, M. (2005). Measurement of Pore Water Pressure of Clay-Infilled Rock Joints During Triaxial Shearing. Geotechnique 55 (10), 759–764. doi:10.1680/geot.2005.55.10.759
Iryo, T., and Rowe, R. K. (2005). Infiltration into an Embankment Reinforced by Nonwoven Geotextiles. Can. Geotech. J. 42 (4), 1145–1159. doi:10.1139/t05-035
Jahanian, H., and Sadaghiani, M. H. (2015). Experimental Study on the Shear Strength of sandy clay Infilled Regular Rough Rock Joints. Rock Mech. Rock Eng. 48 (3), 907–922. doi:10.1007/s00603-014-0643-4
Jia, L., Zhu, Y. P., and Zhu, J. C. (2014). Influencing Factors for Shear Strength of Malan and Lishi Compacted Loess in Lanzhou. Chin. J. Geotech. Eng. 36 (2), 120–124. doi:10.11779/CJGE2014S2020
Jiang, M. (2009). Research on the Mechanism and Stability of Loess-Redbed Landslide in Baoji. Beijing: China University of Geosciences.
Johansson, F., and Stille, H. (2014). A Conceptual Model for the Peak Shear Strength of Fresh and Unweathered Rock Joints. Int. J. Rock Mech. Mining Sci. 69, 31–38. doi:10.1016/j.ijrmms.2014.03.005
Kang, X., and Liao, H. (2019). Bounding Surface Plasticity Model for Jointed Soft Rocks Considering Overconsolidation and Structural Decay. Comput. Geotechnics 108, 295–307. doi:10.1016/j.compgeo.2018.12.029
Kang, X., Liao, H., Huang, Q., and Dai, Q. (2021). Enhanced Anisotropic Bounding Surface Plasticity Model Considering Modified Spacing Ratio of Anisotropically Consolidated clay. Acta Geotech [Epub ahead of print]. doi:10.1007/s11440-021-01314-6
Kosoglu, L. M., Bickmore, B. R., Filz, G. M., and Madden, A. S. (2010). Atomic Force Microscopy Method for Measuring Smectite Coefficients of Friction. Clays Clay Miner. 58 (6), 813–820. doi:10.1346/ccmn.2010.0580609
Krounis, A., Johansson, F., and Larsson, S. (2016). Shear Strength of Partially Bonded concrete-rock Interfaces for Application in Dam Stability Analyses. Rock Mech. Rock Eng. 49 (7), 2711–2722. doi:10.1007/s00603-016-0962-8
Ladanyi, B., and Archambault, G. (1970). “Simulation of Shear Behavior of a Jointed Rock Mass,” in Proc.11th Symp. on Rock Mechanics: Theory and Practice, New York, USA (AIME), 105–125.
Lawrence, J. F., Deng, T., Wang, Y., Xie, G. P., Hou, S. K., Pang, L. B., et al. (2011). Observations on the Hipparion Red Clays of the Loess Plateau. Vertebrata Palasiatica 49 (3), 275–284. doi:10.1631/jzus.B1000197
Lee, H. S., Park, Y. J., Cho, T. F., and You, K. H. (2001). Influence of Asperity Degradation on the Mechanical Behavior of Rough Rock Joints under Cyclic Shear Loading. Int. J. Rock Mech. Mining Sci. 38 (7), 967–980. doi:10.1016/s1365-1609(01)00060-0
Lei, X. Y., and Qu, H. J. (1991). The Stability of Loess Landslides on the Edges of the Bailu tableland,Xi`an and Their Relationship with Human Activities. Geol. Rev. 37 (3), 258–264.
Li, B., Wu, S. R., and Shi, J. S. (2012b). Analysis on the Cause of Formation of Large-Scale Loess Landslide in Weibei Loess Plateau. Res. Soil Water Conservation 19 (1), 206–211.
Li, B., Wu, S. R., and Si, J. S. (2012a). Research and Analysis on Large-Scale Loess Landslides in Loess Tableland Area of Weibei. Reaearch of Soil and water Conservation 12, 1918–1924.
Liu, J. W., Fan, H. H., Song, X. Y., and Yang, X. J. (2020). Characteristics of Shear Strength and Deformation of Compacted Q3 Loess. Soil Mech. Found. Eng. 57, 65–72. doi:10.1007/s11204-020-09672-1
Liu, W., Chen, W., Lin, G., Wang, J., Sun, G., and Zhong, X. (2018). “Shear Strength of Slip Surface in Loess-Mudstone Interface Landslide,” in Proceedings of GeoShanghai 2018 International Conference: Fundamentals of Soil Behaviours. GSIC 2018, Singapore, May 27-30, 2018. Editors A. Zhou, J. Tao, X. Gu, and L. Hu (Springer), 531–539. doi:10.1007/978-981-13-0125-4_59
Maerz, N. H., Franklin, J. A., and Bennett, C. P. (1990). Joint Roughness Measurement Using Shadow Profilometry. Int. J. Rock Mech. Mining Sci. Geomechanics Abstr. 27 (5), 329–343. doi:10.1016/0148-9062(90)92708-m
Mortara, G., Ferrara, D., and Fotia, G. (2010). Simple Model for the Cyclic Behavior of Smooth Sand-Steel Interfaces. J. Geotech. Geoenviron. Eng. 136 (7), 1004–1009. doi:10.1061/(asce)gt.1943-5606.0000315
Peng, J., Wang, S., Wang, Q., Zhuang, J., Huang, W., Zhu, X., et al. (2019). Distribution and Genetic Types of Loess Landslides in China. J. Asian Earth Sci. 170, 329–350. doi:10.1016/j.jseaes.2018.11.015
Portelinha, F. H. M., and Zornberg, J. G. (2017). Effect of Infiltration on the Performance of an Unsaturated Geotextile-Reinforced Soil Wallffect of Infiltration on the Performance of an Unsaturated Geotextile-Reinforced Soil wall. Geotextiles and Geomembranes 45 (3), 211–226. doi:10.1016/j.geotexmem.2017.02.002
Prashanth, V., Murali Krishna, A., and Dash, S. K. (2016). Pullout Tests Using Modified Direct Shear Test Setup for Measuring Soil-Geosynthetic Interaction Parameters. Int. J. Geosynth. Ground Eng. 2 (2), 10. doi:10.1007/s40891-016-0050-x
Qiao, L. J., Zhou, G. Q., Shang, X. Y., Lv, X. L., and Zhao, G. S. (2016). Study on the Influence of Water Content on Mechanical Behavior of Loess-Sand Mortar Interface and its Application. Chin. J. Underground Space Eng. 6 (2), 1660–1664.
Qu, Y. X., Zhang, Y. S., and Tan, Z. M. (1999). Hipparion Laterite and Landslide Hazards on Loess Plateau of Northwestern China. J. Eng. Geology. 7 (3), 257–265.
Sayeed, M. M. A., Ramaiah, B. J., and Rawal, A. (2014). Interface Shear Characteristics of Jute/polypropylene Hybrid Nonwoven Geotextiles and Sand Using Large Size Direct Shear Test. Geotextiles and Geomembranes 42 (1), 63–68. doi:10.1016/j.geotexmem.2013.12.001
Serrano, A., Olalla, C., and Galindo, R. A. (2014). Micromechanical Basis for Shear Strength of Rock Discontinuities. Int. J. Rock Mech. Mining Sci. 70 (70), 33–46. doi:10.1016/j.ijrmms.2014.02.021
Shen, Y., Wang, Y., Yang, Y., Sun, Q., Luo, T., and Zhang, H. (2019). Influence of Surface Roughness and Hydrophilicity on Bonding Strength of concrete-rock Interface. Construction Building Mater. 213, 156–166. doi:10.1016/j.conbuildmat.2019.04.078
Skempton, A. W. (1985). Residual Strength of Clays in Landslides, Folded Strata and the Laboratory. Géotechnique 35 (1), 3–18. doi:10.1680/geot.1985.35.1.3
Song, K. Q., Cui, Z. X., Yuan, J. G., and Li, B. (1994). Creep Characteristics Analysis and Prediction of GuliuSlide. Chin. J. Geotechnical Eng. 16 (4), 54–64.
Taboada, A., Estrada, N., and Radjaї, F. (2006). Additive Decomposition of Shear Strength in Cohesive Granular Media from Grain-Scale Interactions. Phys. Rev. Lett. 97 (9), 098302. doi:10.1103/PhysRevLett.97.098302
Tiwari, B., Ajmera, B., and Kaya, G. (2010). Shear Strength Reduction at Soil Structure Interface. Proc. GeoFlorida, 1747–1756. doi:10.1061/41095(365)177
Tolooiyan, A., Abustan, I., Selamat, M. R., and Ghaffari, S. H. (2009). A Comprehensive Method for Analyzing the Effect of Geotextile Layers on Embankment Stability. Geotext. Geomembr. 27 (5), 399–405. doi:10.1016/j.geotexmem.2008.11.013
Uesugi, M., Kishida, H., and Uchikawa, Y. (1990). Friction between Dry Sand and concrete under Monotonic and Repeated Loading. Jpn. Geotechnical Soc. 27 (6), 115–128. doi:10.3208/sandf1972.30.115
Wang, G. L., Zhang, M. S., Wu, F. Q., Zeng, Q. M., and Zhang, X. S. (2012). Review on Study of Mechanism of Loess Landslides Controlled by Hipparion Red clay. J. Eng. Geology. 20, 170–175.
Wang, J., Xu, Y., Ma, Y., Qiao, S., and Feng, K. (2018). Study on the Deformation and Failure Modes of Filling Slope in Loess Filling Engineering: a Case Study at a Loess Mountain Airport. Landslides 15 (12), 2423–2435. doi:10.1007/s10346-018-1046-5
Wang, J., Zhang, D., Wang, N., and Gu, T. (2019b). Mechanisms of Wetting-Induced Loess Slope Failures. Landslides 16, 937–953. doi:10.1007/s10346-019-01144-4
Wang, S. K., Peng, J. B., Zhuang, J. Q., Kang, C. Y., and Jia, Z. J. (2019a). Underlying Mechanisms of the Geohazards of Macro Loess Discontinuities on the Chinese Loess Plateau. Eng. Geology. 263, 1–13. doi:10.1016/j.enggeo.2019.105357
Wen, B. P., Wang, S. J., Wang, E. Z., Zhang, J. M., Wu, Y. G., and Wang, X. L. (2005). Deformation Characteristics of Loess Landslide along the Contact between Loess and Neocene Red Mudstone. Acta Geologica Sinica 79 (1), 139–150. doi:10.1111/j.1755-6724.2005.tb00930.x
Wu, Q., Xu, Y., Tang, H., Fang, K., Jiang, Y., Liu, C., et al. (2018). Investigation on the Shear Properties of Discontinuities at the Interface between Different Rock Types in the Badong Formation, China. Eng. Geology. 245, 280–291. doi:10.1016/j.enggeo.2018.09.002
Wu, W. J., Su, X., Liu, W., Wei, W. H., Feng, L. T., and Yang, T. (2014). Characteristics and Genesis of Landslide at Loess-Mudstone Interface. J. Glaciology Geocryology 36 (5), 1167–1175. doi:10.7522/j.issn.1000-0240.2014.0139
Xin, P., Wu, S. R., Shi, J. S., Wang, T., and Shi, L. (2014). Research on Kinematics and Dynamic Mechanism of Large-Scale Deep-Seated Landslide on the north Bank of Baoji Stream Segment of Weihe River in Loess Plateau. Acta Geologica Sinica 88 (7), 1341–1352.
Xu, L., Dai, F. C., Kuang, G. L., and Min, H. (2008). Types and Characteristics of Loess Landslides at Heifangtai Loess Plateau, China. J. Mountain Sci. 26 (3), 364–371. doi:10.16089/j.cnki.1008-2786.2008.03.011
Yang, X., Wang, Y., and Sun, Z. (2020). The Shearing Anisotropy Characteristics on the Interface of Loess with Bedrock. Bull. Eng. Geol. Environ. 79, 5205–5212. doi:10.1007/s10064-020-01887-8
Yazdani, S., Helwany, S., and Olgun, G. (2019). Influence of Temperature on Soil-Pile Interface Shear Strength. Geomechanics Energ. Environ. 18, 69–78. doi:10.1016/j.gete.2018.08.001
Zhang, X. B., Jiang, Q. H., Kulatilake, P. H. S. W., Feng, X., Yao, C., and Tang, Z. C. (2019). Influence of Asperity Morphology on Failure Characteristics and Shear Strength Properties of Rock Joints under Direct Shear Tests. Int. J. Geomechanics 19 (2), 1–13. doi:10.1061/(asce)gm.1943-5622.0001347
Zhang, X. S., Liao, H. J., and Xing, X. K. (2005). Laboratory Test Study on Mechanical Properties of Pile-Soil Interaction. Geotechnical Invest. Surv. (6), 1–4.
Zhou, H., Cheng, G. T., Zhu, Y., Chen, J., Lu, J. J., and Cui, G. J. (2019). Experimental Study of Shear Deformation Characteristics of marble Dentate Joints. Rock Soil Mech. 40 (3), 1–9. doi:10.16285/j.rsm.2017.0964
Zhu, Y. B., Han, Y. T., Miao, S. S., Li, H. F., Li, W. J., Lan, H. X., et al. (2021b). Influencing Factors on the Shear Strength of Sliding Zone of Loess-Hipparion Red clay Landslide. J. Earth Sci. Environmen. 43 (4), 744–759. doi:10.19814/j.jese.2021.05024
Keywords: loess, Hipparion red clay, contact interface, shear strength, shear model
Citation: Zhu Y, Miao S, Li H, Han Y and Lan H (2022) An Empirical Shear Model of Interface Between the Loess and Hipparion Red Clay in a Loess Landslide. Front. Earth Sci. 9:806832. doi: 10.3389/feart.2021.806832
Received: 01 November 2021; Accepted: 16 December 2021;
Published: 07 January 2022.
Edited by:
Fanyu Zhang, Lanzhou University, ChinaReviewed by:
Zelin Zhang, China Agricultural University, ChinaXin Peng, Chinese Academy of Geologi-cal Sciences (CAGS), China
Copyright © 2022 Zhu, Miao, Li, Han and Lan. This is an open-access article distributed under the terms of the Creative Commons Attribution License (CC BY). The use, distribution or reproduction in other forums is permitted, provided the original author(s) and the copyright owner(s) are credited and that the original publication in this journal is cited, in accordance with accepted academic practice. No use, distribution or reproduction is permitted which does not comply with these terms.
*Correspondence: Yanbo Zhu, emh1eWFuYm9AY2hkLmVkdS5jbg==; Hengxing Lan, bGFuaHhAaWdzbnJyLmFjLmNu
 Yanbo Zhu
 Shuaisheng Miao1
 Hengxing Lan