 Oscar Y. W. Zhang
 Kelvin T. F. Chan
 Lifeng Xu
 Zhenzhen Wu1
- 1School of Atmospheric Sciences, Sun Yat-sen University, and Southern Marine Science and Engineering Guangdong Laboratory (Zhuhai), Zhuhai, China
- 2Guangdong Province Key Laboratory for Climate Change and Natural Disaster Studies, Sun Yat-sen University, Zhuhai, China
- 3Key Laboratory of Tropical Atmosphere-Ocean System, Ministry of Education, Sun Yat-sen University, Zhuhai, China
Predicting tropical cyclone (TC) activities has been a topic of great interest and research. Many existing seasonal forecasting models of TC predict the numbers of TC geneses and landfalls based on the environmental factors in the peak TC season. Here, we utilize the mainstream reanalysis datasets in 1979–2005 and propose a statistical seasonal forecasting model, namely the SYSU model, for predicting the number of TC landfalls on South China based on the preseason environmental factors. The multiple linear regression analysis shows that the April sea level pressure over the tropical central Pacific, the March-April mean sea surface temperature southwest to Australia, the March 850-hPa zonal wind east to Japan, and the April 500-hPa zonal wind over Bay of Bengal are the significant predictors. The model is validated by the leave-one-out cross validation and recent 15-year observations (2006–2020). The correlation coefficient between the modeled results and observations reaches 0.87 (p < 0.01). The SYSU model exhibits 90% hit rate (38 out of 42) in 1979–2020. The Antarctic Oscillation, and the variations of the western North Pacific subtropical high and Intertropical Convergence Zone could be the possible physical linkages or mechanisms. The model demonstrates an operational potential in the seasonal forecasting of TC landfall on South China.
Introduction
Tropical cyclone (TC) is one of the most devastating natural phenomena in the world. It could lead to heavy precipitation, flooding, strong winds, and storm surges to the coastal regions (Zhang et al., 2018), causing great economic and human losses. On average, about 80 TCs form globally per year. Among the basins, the western North Pacific (WNP) is a region with the most active tropical cyclogenesis. About one-third of global TCs, 26 on annual average, formed in the WNP during 1975–2011 (Liu and Chan, 2012; Hu et al., 2017), which could make landfall on Southeast Asia and East Asia. East Asia, including China, Korea, and Japan, etc., accommodates around 25% of the world’s total population with a large portion dwelling in coastal regions. South China is one of these regions mostly affected by TCs. Thus, the accurate seasonal forecasting on predicting the seasonal or annual TC landfall numbers on South China is indispensable for disaster prevention and mitigation.
Many studies have made contributions to the prediction of TC activities in the past decades. In the early 1980s, the statistical seasonal forecasts of TC activities have been developed in the Australian (Nicholls, 1979), and dynamical forecast in North Atlantic (Gray, 1984a, b). Subsequently, the statistical models of TC tracks (e.g., Hall et al., 2007), and annual TC frequency (e.g., Fan, 2010; Xie and Liu, 2014) in North Atlantic and North Indian Ocean (e.g., Wahiduzzaman et al., 2019) have also been proposed. The statistical forecasts in different parts of Pacific are also studied. For example, Nicholls (1992) forecasts for the Australian–southwest Pacific, while numbers of studies (e.g., Chan et al., 1998; Au-Yeung and Chan, 2012; Zhang and Villarini, 2019; Chan et al., 2021) work for the WNP. Apart from the statistical forecastings, the dynamical and hybrid statistical-dynamical forecastings (e.g., Huang and Chan, 2014; Ham and Kug, 2015; Zhang et al., 2017; Camp et al., 2019) have also been introduced. The hybrid models are built using climate indices as predictors to train the Poisson regression models. Using climate indices (e.g., subtropical high index) to build the model is apparent because it is much easier to deduce the physical linkages. Camargo et al. (2007), Zhan et al. (2012), and Klotzbach et al. (2019) reviewed the existing models all over the world. Among the studies above, most of them focus on the TC activities over the open oceans (e.g., Liu and Chan, 2003; Wang et al., 2007; Choi et al., 2010), while those focusing on the TC landfall activities (e.g., Fan, 2009; Goh and Chan, 2010), which is more beneficial with socioeconomic value, are rather less. Recently, studies by Gao et al. (2018) and Gao et al. (2020) identify the relationship between the tropical North Atlantic sea surface temperature (SST), and the TC landfalls on East Asia (including mainland China). Furthermore, Zhang and Villarini (2019) have built a simple model for the TC frequency in the WNP using only predictors based on SST. They suggested that using the SST-based predictors gives better predictability than the atmospheric-based predictors. However, although consistent increasing trends in frequency and intensity of landfalling TCs in East China were found, Gao et al. (2020) reviewed that the reported trends in landfalling TC activity in South China were divergent. Some studies (Zhang et al., 2012; Li et al., 2017; Zhang et al., 2019) showed no significant trend in landfalling TC intensity or frequency in South China. Park et al. (2014) suggested no trend in landfalling TC frequency, but a downward trend in landfalling TC intensity in South China, while Mei and Xie (2016) found a counter upward trend in landfalling TC intensity in South China. In addition, Lok and Chan (2017) projected fewer but stronger TCs could make landfall on South China in the late 21st century.
Notably, although the statistical seasonal forecasting of TC has therefore been a hot topic for decades, there is still a lot of rooms to improve. Some of them used a lot of predictors to build their models which could cause model overfitting and complexity. What is more, many forecasts are closed-source, internal use only, and provide little understanding of the physical linkages or mechanisms (see Klotzbach et al., 2019). Another deficiency of the existing models is that, numbers of studies mainly make use of the environmental factors in the peak TC season to make prediction (e.g., Au-Yeung and Chan, 2012; Wang et al., 2012; Zhang et al., 2017; Camp et al., 2019), while very less achieve this using the preseason environmental factors (Chan et al., 2021). Choi et al. (2010) and Chen et al. (2015) suggested that the North Pacific Oscillation (NPO) index in spring could be a reliable predictor for predicting the TC activity over the WNP. Tian and Fan (2019) utilized the predictors in preceding year (e.g., the preceding boreal summer SST) and adopted year-to-year increment method to predict the number of landfalling TCs on China during June to August. Chan et al. (2021) built a statistical seasonal forecasting model for predicting the TC activity over the WNP using the preseason factors including both the dynamics and thermodynamics factors. Practically, due to the quasi-periodic or persistent anomalies, or the delayed memory due to the oceanic processes, some of the preseason environmental factors could have “memory effect”, suggesting that their seasonal or annual characteristics are relatively sustainable and transmittable through certain time periods. Thereby, through selecting the particular factors in the preseason, it is plausible to predict the landfall number in the upcoming TC season.
This study, therefore, aims 1) to establish an effective (not more than 4 predictors), open-source, and competitive (at least 80% hit rate) statistical seasonal forecasting model to predict the number of TC landfalls on South China in the upcoming TC season (May to December) using preseason environmental factors, and 2) to propose possible physical linkages or mechanisms advancing the predictability and understanding of the seasonal forecasting. The paper is organized as follows: section 2 describes the data and methodology. Section 3 raises four potential predictors of the model. Section 4 introduces our statistical seasonal forecasting model with the model validation. Section 5 proposes the possible physical linkages or mechanisms. Section 6 summaries the study with discussion.
Data and Methodology
The best-track data from the China Meteorological Administration, including TC positions, and maximum 2-min average winds are adopted. The TCs that made landfall on South China in 1979–2020 are retrieved. Given that the benchmarks of the number of typhoons (TCs reaching typhoon intensity or above ≥34 m s−1) from different meteorological centers are divergent (Chan et al., 2021), only those reaching tropical storm intensity or above (maximum sustained wind speed ≥17 m s−1) are examined. In this study, South China includes Hainan, Guangxi, Guangdong, Hong Kong, and Macau. It is noted that those made landfall on East China or Vietnam at first and then moved to South China over land are not counted. In other words, only the “sea-to-land” attacks are focused. Those “land-to-land” attacks, which are relatively less destructive, are not considered. In addition, for the TC made several landfalls on South China counts once only. The TC that skirts along the coastal line, which has almost the same impacts as the narrow sense of landfalling TC, is also counted. From 1979 to 2020, there are 175 TCs made landfall on South China in total, that is, 4.2 TC landfalls per year on average. Most of them formed over the north of South China Sea (12–25°N, 105–122°E) and Philippine Sea (5–20°N, 122–142°E) then moved northwestward (Figure 1A). They mostly appeared in July, August, and September (Figure 1B). No TC made landfall on South China in December in 1979–2020.
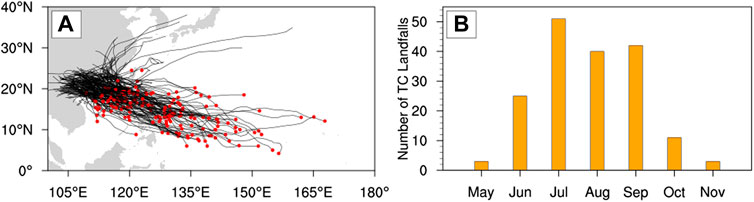
FIGURE 1. (A) Spatial distribution of the genesis locations (red dots) and tracks (black lines) of the TCs made landfall on South China and (B) monthly distribution of corresponding landfalling TCs in 1979–2020.
The monthly fifth generation of European Centre for Medium-Range Weather Forecasts (ECMWF) atmospheric reanalysis of the global climate (ERA5; 0.25° × 0.25°, 1979–2020), the National Centers for Environmental Prediction—Climate Forecast System Reanalysis (NCEP-CFSR; 0.5° × 0.5°, 1982–2020), and the National Oceanic and Atmospheric Administration—Optimal Interpolation SST analysis version 2 (NOAA-OISSTv2; 1° × 1°, 1982–2020) are used for identifying the predictors and examining the possible physical linkages or mechanisms. These data are the mainstreams with high recognition and confidence nowadays. It is noted that two sets of reanalysis data (first: ERA5 from ECMWF; second: CFSR and OISSTv2 from NOAA) are employed in this study because this can avoid the uncertainties or arbitrary conclusions given by the single data source, and hence, increases the robustness of the model. The meteorological quantities like zonal wind, meridional wind, geopotential height, temperature, relative vorticity, sea level pressure (SLP), SST, and relative humidity in the preseason (i.e., January to April) are examined. The Antarctic Oscillation (AAO) index and the outgoing longwave radiation (OLR) data from the NOAA Climate Prediction Center (NCPC) are also examined in this study.
DelSole and Shukla (2009) pointed out that during the screening of predictors, numbers of artificial skills could involve in the model. Therefore, to justifiably train and validate the model, the data before 2006 (24 years +) are used for the model training, while those in the recent 15 years (2006–2020) are used for the model validation in this study. The sampling ratio of the training set to validation set is approximately 2:1. The dozens of candidates from the typical aforementioned meteorological quantities at typical levels (surface, lower, mid, and upper troposphere) are selected by picking the high and significant regions from the correlation maps. Various areas of any significant regions (area ≥ 50° latitude × ° longitude) are extracted. The mutual correlations and collinearities between the predictors are then considered. The combination of four predictors (see next section) has the highest correlation with the number of TC landfalls is adopted to build the model. Standardizations of the predictors (by z-score) are applied in the multiple linear regression analysis so that all the predictors are in form of indices. To test whether there exists collinearity between predictors, the Variance Inflating Factor (VIF) method is performed. If the VIFs (VIF = 1/(1−ri2) of predictors are less than 1/(1−Ri2), where ri is the correlation coefficient between the selected predictor and observed TC landfalls, and Ri is the correlation coefficient between the modeled and observed TC landfalls, then the multicollinearity is weak to affect the coefficient estimates. In order to further validate the model skills, the leave-one-out cross validation has also been performed.
Potential Predictors
In this study, four predictors are optimally selected. They are the April SLP over the tropical central Pacific (SLPTCP,4), the March-April mean SST southwest to Australia (SSTSWA,34), the March 850-hPa zonal wind east to Japan (U850EJ,3), and the April 500-hPa zonal wind over Bay of Bengal (U500BOB,4). The corresponding geophysical regions are shown in Figure 2.
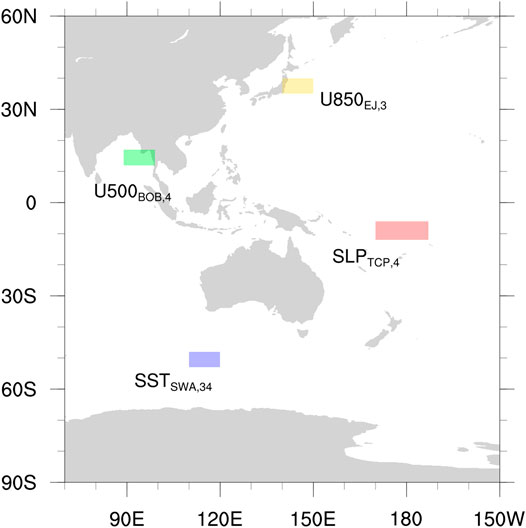
FIGURE 2. Model predictors. The shaded boxes denote their corresponding regions.
Sea Level Pressure
The regional SLP anomalies have been widely employed to reflect the teleconnections and oscillations (e.g., AAO, El Niño Southern Oscillation (ENSO), and NPO) in both the ocean and atmosphere, which have close relationships with TC activities (e.g., Chen et al., 2015). In April, the region over the tropical central Pacific (12–6°S, 170°E–173°W, green rectangles in Figure 3) shows a high correlation (r = −0.65 and −0.52 for ECMWF, and NOAA data, respectively) between the SLP (hereafter SLPTCP,4) and TC landfalls, suggesting that the SLPTCP,4 could be an important potential predictor for the seasonal forecasting model.
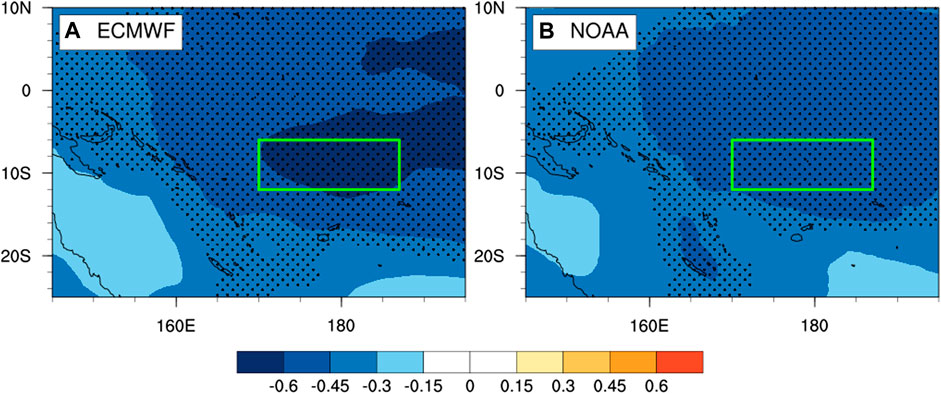
FIGURE 3. Correlation maps between the April SLP and the number of TC landfalls using (A) ECMWF (1979–2005) and (B) NOAA data (1982–2005). The dotted areas indicate where the correlation coefficients are significant at the 95% confidence level. The regions of SLPTCP,4 are specified by the green rectangles.
Sea Surface Temperature
The SST anomalies over the main development region is known as one of the necessary thermodynamic factors for TC formation and development, where it determines the heat flux and moisture flux exchanges between the sea surface and atmosphere. The remote SST might impact on TC activities by causing anomalies of upper and lower tropospheric circulations (Zhan, 2011; Gao et al., 2018; Zhang and Villarini, 2019). Figure 4 shows that the March-April SST southwest to Australia (48–53°S, 110–120°E; indicated by the green rectangles) positively correlates with the TC landfalls (r = 0.63 and 0.44 for ECMWF, and NOAA data, respectively). The observable difference of SST correlations found in Figure 4 is likely due to the heterogeneities of data sources and resolutions (ERA5: 0.25° × 0.25°; NOAA-OISSTv2: 1° × 1°), and the data periods (ERA5 starts from 1979, while NOAA-OISSTv2 starts from 1982; see next section). The positive correlation implies the higher SST in this region (hereafter SSTSWA,34) links to more TC landfalls. Thus, it could be a viable predictor to help establishing the forecasting model via the teleconnection.
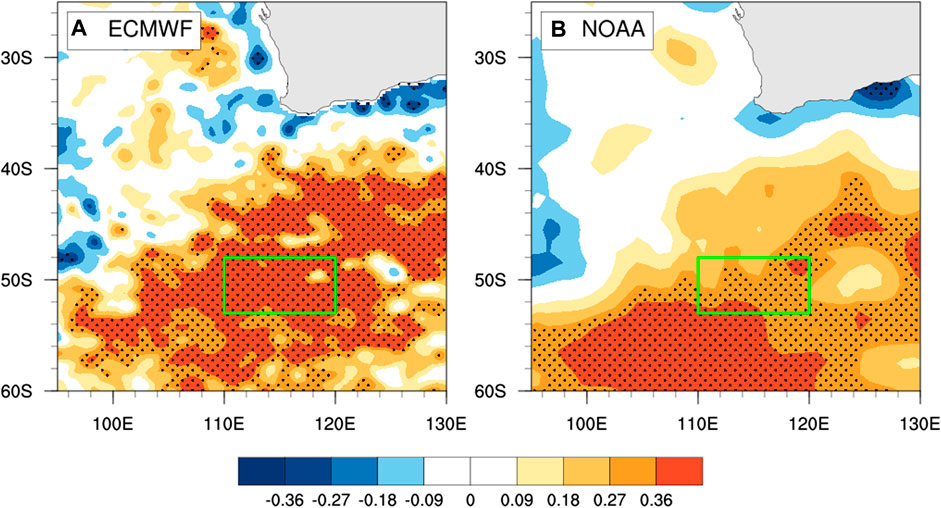
FIGURE 4. Correlation maps between the March-April SST and the number of TC landfalls using (A) ECMWF (1979–2005) and (B) NOAA data (1982–2005). The dots indicate the areas where the correlation coefficients are significant at the 95% confidence level. The regions of SSTSWA,34 are specified by the green rectangles.
Zonal Wind
Although lots of environmental factors (e.g., SST, pressure, and geopotential height) are commonly employed in various statistical forecasting models, the zonal and meridional winds, which are the important components of atmospheric circulations, are seldom adopted. Here we find that the 850-hPa zonal wind east to Japan in March (hereafter U850EJ,3; 35–40°N, 140–150°E; green rectangles in Figure 5) and the 500-hPa zonal wind over Bay of Bengal in April (hereafter U500BOB,4; 12–17°N, 89–99°E; green rectangles in Figure 6) have significant correlations and regressions on the TC landfalls. The correlation coefficients between the U850EJ,3 and the number of TC landfalls are respectively −0.51 and −0.61 for ECMWF, and NOAA data, while those between the U500BOB,4 and TC landfalls are −0.50 and −0.62, correspondingly. The negative correlations suggest that these two easterly anomalies link to a decrease in TC landfalls.
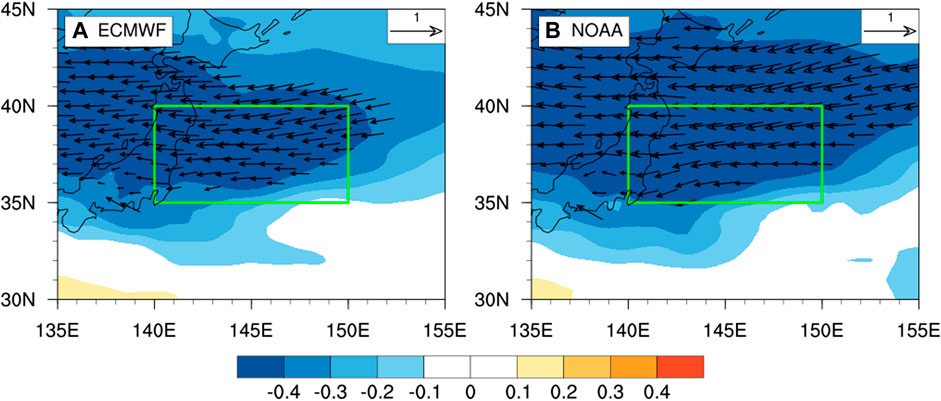
FIGURE 5. Regression (vector; unit: m s−1) and correlation (shading) of the March 850-hPa wind anomalies on the number of TC landfalls using (A) ECMWF (1979–2005) and (B) NOAA data (1982–2005). Either zonal wind or meridional wind statistically significant at the 95% confidence level are shown. Shading indicates the areas where the correlation coefficients of the zonal wind anomalies are significant at the 95% confidence level. The regions of U850EJ,3 are specified by the green rectangles.
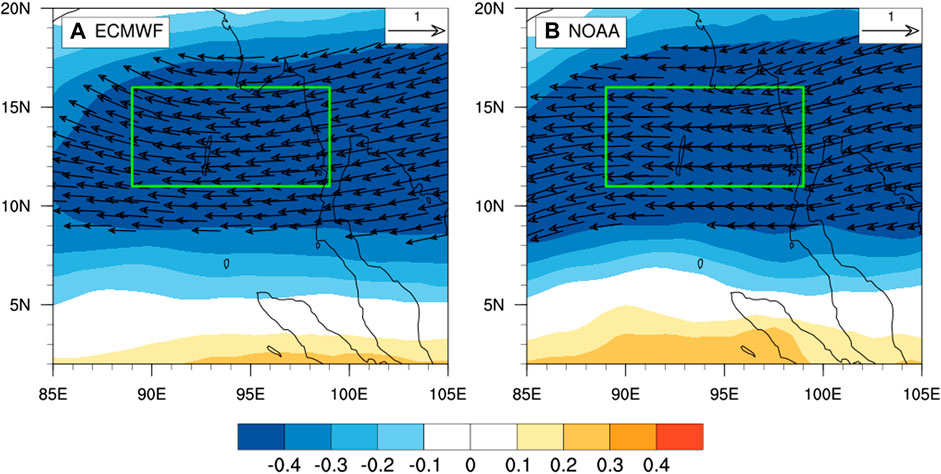
FIGURE 6. Regression (vector; unit: m s−1) and correlation (shading) of the April 500-hPa wind anomalies on the number of TC landfalls using (A) ECMWF (1979–2005) and (B) NOAA data (1982–2005). Either zonal wind or meridional wind statistically significant at the 95% confidence level are shown. Shading indicates the areas where the correlation coefficients of the zonal wind anomalies are significant at the 95% confidence level. The regions of U500BOB,4 are specified by the green rectangles.
Statistical Seasonal Forecasting Model
Table 1 shows that the mutual correlations among the aforementioned predictors are weak. These imply the predictors are mostly independent of each other. Although that between the SSTSWA,34 and U850EJ,3 in the ECMWF dataset is a bit higher, the VIF values of all predictors are less than 4.1 (result of 1/(1−Ri2); see section 2), suggesting that there exists no multicollinearity between predictors. The multiple linear regression analyses further confirm this, in which the regression coefficients of the four predictors all pass the significance test (Table 2).
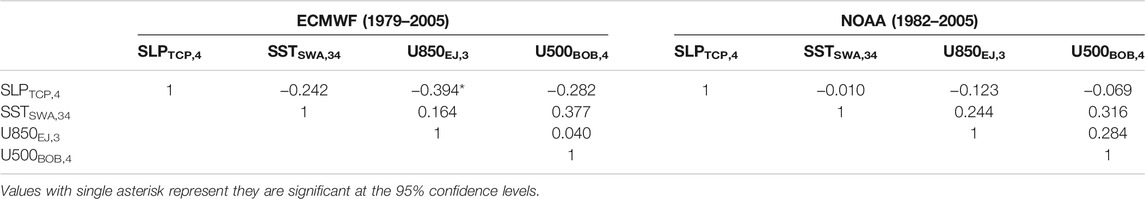
TABLE 1. Mutual correlation coefficients among the SLPTCP,4, SSTSWA,34, U850EJ,3, and U500BOB,4 in the ECMWF and NOAA data.
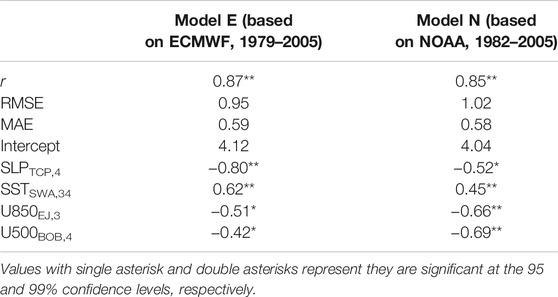
TABLE 2. Correlation coefficients, RMSEs, MAEs, intercepts, and regression coefficients of the Model E and Model N.
In this study, the multiple linear regression model based on the ECMWF data is named as Model E, while that based on the NOAA data is named as Model N. Table 2 shows that both models are primarily consistent with each other, suggesting that the robustness of predictors are strong. The correlation coefficients between the modeled TC landfalls and observed TC landfalls reach 0.85–0.87. The corresponding root mean squared errors (RMSEs) are close to 1. After performing the leave-one-out cross validation, the correlation coefficients between the modeled TC landfalls, and observed TC landfalls become 0.79–0.82, while the corresponding RMSEs are 1.02 and 1.10 for Model E and Model N, respectively. These results demonstrate that both models have a competitively high potential on predicting seasonal TC landfalls on South China.
Figure 7 shows that the modeled landfall number matches well with the observations in 1979–2005. The errors are generally within ±1. The mean absolute errors (MAEs) of Model E and Model N are 0.59 and 0.58, respectively (Table 2). Notably, besides the leave-one-out cross validation, the models are further validated by the recent 15-year (2006–2020) observations. The corresponding absolute errors are ≤2.
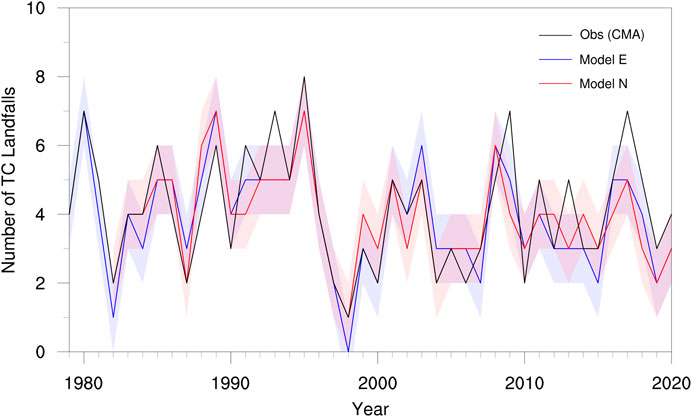
FIGURE 7. Time series of the observed (black line) and modeled TC landfalls on South China based on the ECMWF (Model E; blue line) and NOAA (Model N; red line) data. The blue and red shadings indicate the model uncertainties (denoted by ±1 of corresponding RMSE in Model E and Model N, and then rounded to the nearest integers, respectively). Note that the modeled results before 2006 are based on the model training, those after are for the model validation.
To bring the results from research into practice and application, a new model, namely the Sun Yat-sen University (SYSU) model, is proposed. The SYSU model takes both the Model E and Model N into consideration. The prediction range of the SYSU model is defined as the maximum range of both the modeled landfall numbers ±1 of their corresponding RMSEs, and then rounded to the nearest integers. Visually, it is exactly the all-inclusive shadings shown in Figure 7. Once the observed landfall number falls within the prediction range, we call the model hits. Figure 7 shows that the SYSU model exhibits a 90% hit rate in 1979–2020 (38 out of 42). This is promising for a statistical model which only utilizes 4 preseason factors.
Possible Physical Linkages or Mechanisms
In order to figure out the possible physical linkages or mechanisms of the model, based on the standardized predictors, the corresponding meteorological quantities in the extreme high years (>1) and low years (<−1) are investigated (Table 3). Examining the composite difference between the extreme high and low years can magnify the signals which help the identification. Meanwhile, incorporating what have found in previous studies, three possible physical linkages or mechanisms are proposed.
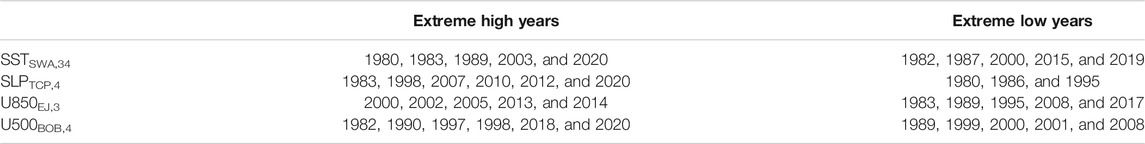
TABLE 3. Extreme high years (>1) and low years (<−1) of four predictors based on the respective standardized values of predictors in 1979–2020.
Antarctic Oscillation
The Antarctic Oscillation (AAO), a dominant low frequency mode of atmospheric variability in the Southern Hemisphere, also known as Southern Annular Mode, is suspected to be a possible mechanism affecting landfalling TC activity. The AAO index could be measured by the zonal mean SLP difference between 40°S and 65°S (Gong and Wang, 1999). Fan et al. (2003) studied the annual variations of AAO and the distribution of correlation coefficient between AAO index and monthly mean SLP anomalies in each month, and proposed series of conclusions. From January to December, the areas of negative correlation are basically the same, located from 60°S to 90°S. During austral winter, the areas of positive correlation could expand from 50°S to 30°N, and even to 60°N during June, July, and August. These suggest that the impacts of AAO could persist and even enhance from boreal spring to summer. Yuan et al. (2021) further found that the AAO in boreal spring can influence the zonal wind and meridional circulation in the Northern Hemisphere, leading to the southeasterly and ascending motion anomalies, and thus, the precipitation anomaly in North China during boreal summer. In this study, we find that the correlation coefficient between SLPTCP,4 and April AAO index is about 0.56, while the correlation coefficient between SSTSWA,34 and March-April AAO index is −0.42. The results suggest that these two predictors are highly associated with the positive and negative phases of AAO, respectively.
Ho et al. (2005) and Wang and Fan (2007) suggested that the AAO would lead to anomalous anticyclonic circulation over the WNP during boreal summer. During positive phase of AAO, the subtropical high in the WNP is weaker and retreats eastward (pink rectangles in Figures 8D–F), leading to an unfavorable condition for TC activity in the proximity of South China, but favorable for TC passage or landfall to East China and Japan. On the contrary, during the negative phase of AAO, the subtropical high is stronger over the WNP and extends westward (Figure 9). In addition, a seasonal southwestward shift of anomalous anticyclone from April to July (green dash rectangles in Figures 9A–D) takes place. These two together favor more landfalling TCs on South China.
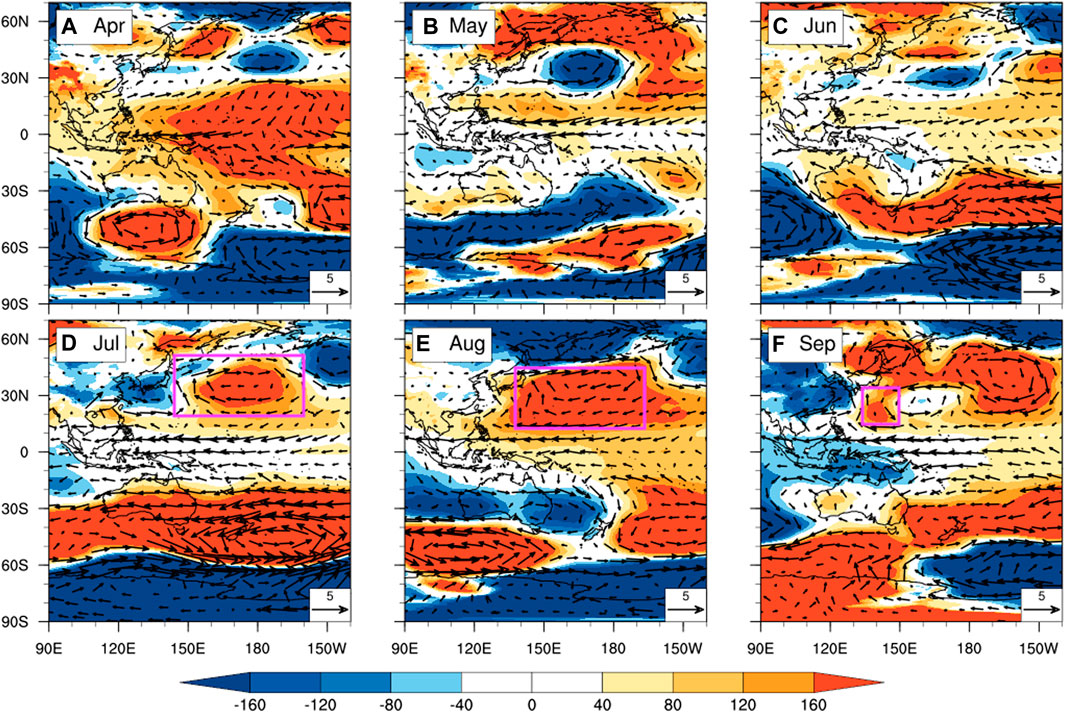
FIGURE 8. Composite differences of (A) April, (B) May, (C) June, (D) July, (E) August, and (F) September mean SLP (shading; unit: Pa) and 850-hPa wind anomalies (vector; unit: m s−1) between the extreme high and low years of SLPTCP,4. Pink rectangles in (D–F) specify the anomalous eastward shift of subtropical high that highly associates with the positive phase of AAO.
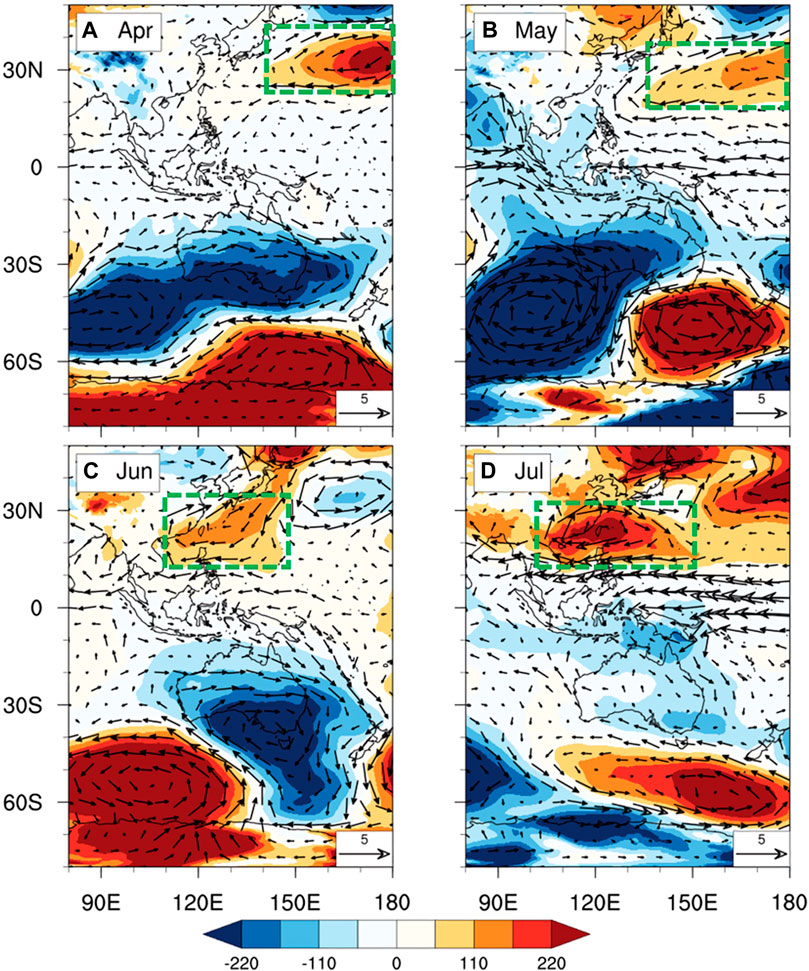
FIGURE 9. Composite differences of (A) April, (B) May, (C) June, and (D) July mean SLP (shading; unit: Pa) and 850-hPa wind anomalies (vector; unit: m s−1) between the extreme high and low years of SSTSWA,34. Green dash rectangles in (A–D) indicate the seasonal shift of anomalous westward or southwestward shift of subtropical high that highly associates with the negative phase of AAO.
Meanwhile, Wang and Fan (2007) and Choi et al. (2010) also suggested that AAO might impact on the WNP TC activity through the teleconnection of meridional circulation anomaly from the middle latitudes in the Southern Hemisphere to the tropical WNP. As the region of SSTSWA,34 has similar longitude range with that of South China Sea, the way how the AAO modifies the later meridional circulation could be another possible mechanism. The composite difference of anomalous meridional circulation shows that there is an anomalous downdraft in 5–13°N during July to September (pink dash rectangle in Figure 10A), which highly associates with the positive phase of AAO and is unfavorable for convective activity over Philippines Sea. On the contrary, the anomalous updraft in 10–25°N during peak TC season (purple dash rectangle in Figure 10B) is favorable for convective activity over the north of South China Sea. These results are highly consistent with Choi et al. (2010).
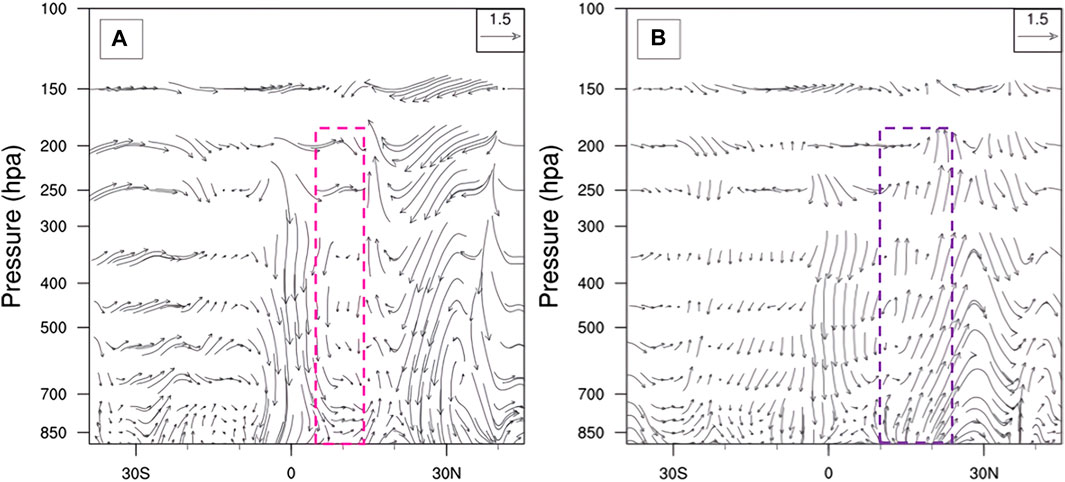
FIGURE 10. Height-latitude cross sections of the composite difference of anomalous meridional circulation (A:123–128°E; B: 110–120°E; unit: m s−1) between the extreme high years and low years of (A) SLPTCP,4 in July, August, and September and (B) SSTSWA,34 in June, July, and August. Vertical velocity is multiplied by 100. The pink (purple) dash rectangle specifies the anomalous downdraft (updraft) in the 5–13°N (10–25°N) band in positive SLPTCP,4 (SSTSWA,34).
Subtropical High
The composite differences of the 850-hPa geopotential height and wind anomalies between the extreme high years and low years of U850EJ,3 show that there exists a persistent anomalous anticyclone southeast to Japan and an anomalous cyclone to its west in the June, July, and August (green rectangles in Figure 11). These imply there is an anomalous eastward shift of subtropical high over the WNP in positive U850EJ,3. As TC generally moves along the western and southern periphery of the WNP subtropical high, the anomalous eastward shift could steer more TCs towards East China, and Korea, or Japan in positive U850EJ,3. Although how the U850EJ,3 propagates signals and affects the subtropical high activity from March to the peak TC season in the WNP remain unclear, it shows a strong linkage with the variation of subtropical high that is physically indicative of the TC landfall on South China. There might be signal transformation and/or propagation process (es) from the boreal spring. For example, Hu et al. (2020) performed 10-year high-pass filtering method to show significant signals of heat flux during March and April over the WNP, which results in anticyclonic anomaly over low latitudes of the WNP and impacts on the East Asia monsoon onset in May. Though it is not suitable to employ high-pass filtering in real-time forecasting because this requires the data beyond the time series (Wheeler and Hendon, 2004), it provides an idea to understand the processes. More investigations are warranted.
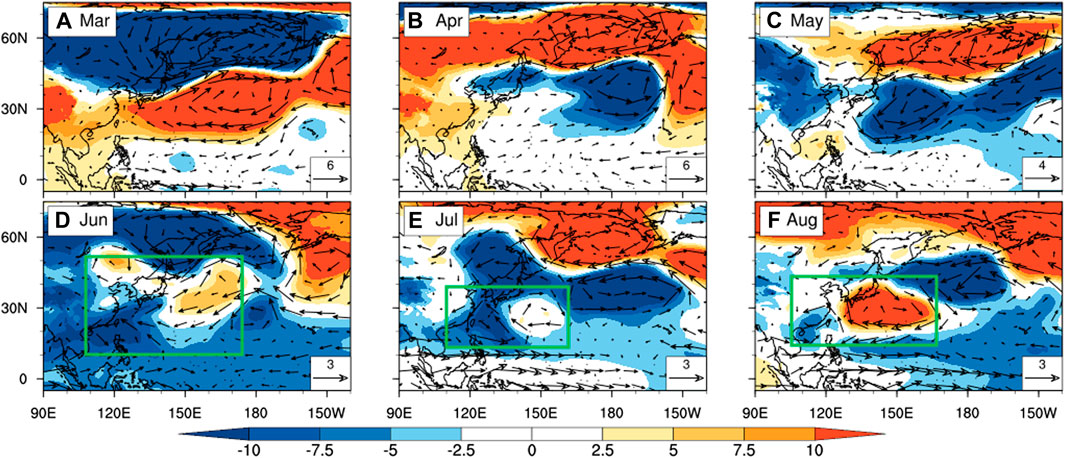
FIGURE 11. Composite differences of (A) March, (B) April, (C) May, (D) June, (E) July, and (F) August mean 850-hPa geopotential height (shading; unit: gpm) and 850-hPa wind anomalies (vector; unit: m s−1) between the extreme high and low years of U850EJ,3. Green rectangles in (D–F) indicate the anomalous eastward shift of subtropical high over the WNP in positive U850EJ,3.
Intertropical Convergence Zone
About 80% of TCs form and develop in ITCZ (Chen and Ding, 1979). The position and intensity of ITCZ are important in TC activities (Zhang et al., 1995; Liu et al., 2007; Liu et al., 2009; Cao et al., 2015). It has been found that the stronger ITCZ favors more cyclogenesis, and vice versa. Figure 12 shows that there is the persistent positive geopotential height anomaly in 0–30°N from April to October, suggesting that during positive U500BOB,4, the convection over ITCZ is weaker, and thus unfavorable for cyclogenesis activity. This is evident by the persistent positive OLR (proxy of convection) anomaly over low latitudes west of 150°E (Figure 13). Meanwhile, the persistent anomalous westerly in the proximity of South China is not favorable for TC landfalls. In addition, the westerly and northwesterly associated with the anomalous low (pink rectangle in Figure 12G) could be detrimental to TC landfalls on South China in October. Although how the U500BOB,4 results in or impacts on the persistence of ITCZ activity from preseason to late season are unclear, it demonstrates an evident linkage with the variation of ITCZ intensity that is physically indicative of the TC landfalls on South China. More work on this is also needed.
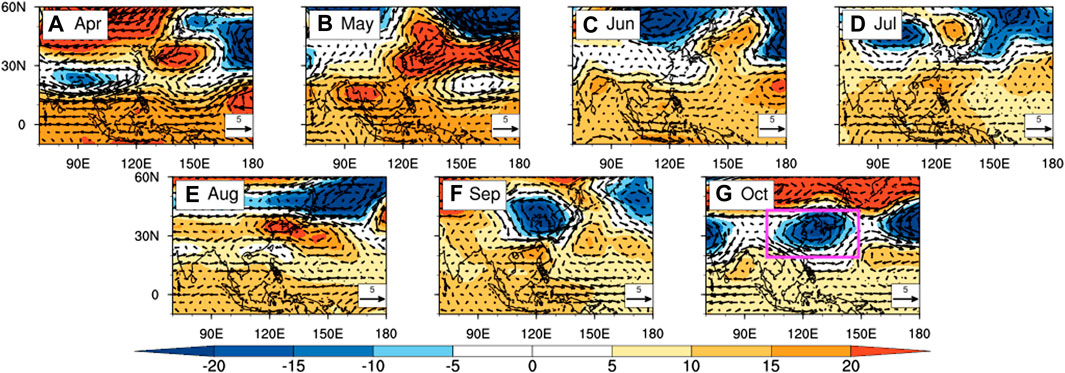
FIGURE 12. Composite differences of (A) April, (B) May, (C) June, (D) July, (E) August, (F) September, and (G) October mean 500-hPa geopotential height (shading; unit: gpm) and 500-hPa wind anomalies (vector; unit: m s−1) between the extreme high and low years of U500BOB,4. Pink rectangle in (G) indicates the cyclonic anomaly in positive U500BOB,4 which is not favorable for TC landfalls on South China.

FIGURE 13. Composite differences of (A) April, (B) May, (C) June, (D) July, (E) August, (F) September, and (G) October mean OLR anomalies (shading; unit: W m−2) between the extreme high and low years of U500BOB,4.
Summary and Discussion
In this study, an effective, open source, and competitive statistical seasonal forecasting model, namely the SYSU model, for predicting the annual TC landfall (reaching tropical storm intensity or above) on South China is proposed. Different from most of the existing seasonal forecasting models that consider the peak-season environment, we make use of preseason environmental factors to build the model. The April SLP over the tropical central Pacific, the March-April mean SST southwest to Australia, the March 850-hPa zonal wind east to Japan, and the April 500-hPa zonal wind over Bay of Bengal are found to be the key predictors. The models based on the ECMWF (Model E) and NOAA (Model N) reanalysis data show high correlations with the observations (r = 0.85–0.87, p < 0.01). Here, we combine the predictions from Model E and Model N to establish the SYSU model. The advantages of this approach can minimize the uncertainties and risks introduced by the single source of data, and thus, increases the robustness of the model predictability. The SYSU model is justifiably validated by the leave-one-out cross validation and recent 15-year observations (2006–2020). It exhibits 90% hit rate in 1979–2020 and demonstrates a promising potential in the seasonal forecasting of TC landfall on South China.
Deduced from the four predictors and previous literature, the AAO, and the variations of subtropical high and ITCZ over the WNP are proposed to be the possible physical linkages or mechanisms underlying the SYSU model. The main idea is that these predictors highly relate to the changes in atmospheric circulation (i.e., steering and convective activity) over South China Sea and the WNP in the TC season via sequences of thermodynamic and dynamic teleconnections. Although these possible linkages and mechanisms are yet not systematically validated, they are physically meaningful and evidently indicative. In this study, the proposed physical linkages and mechanisms are the auxiliary aiming to demonstrate the possible physics behind the model. Doing comprehensive mechanism validations requires a lot of sophisticated modeling work and are left for future study.
No model is perfect. Although the SYSU model proposed in this study shows potentials in the seasonal forecasting of TC landfall on South China, there are always rooms to improve. For instance, why the model misses in 1993, 2009, 2013, and 2017 (see Figure 7)? There may be better predictors and matrices to improve the accuracy, but it requires further research. Last but not least, we would officially implement and keep updating this model targeting to provide the seasonal forecasting products for the public access and monitoring by every mid of May in the near future.
Data Availability Statement
The CMA best-track data was extracted from http://tcdata.typhoon.org.cn. The ERA5 reanalysis data was retrieved from https://www.ecmwf.int/en/forecasts/datasets/reanalysis-datasets/era5. The NCEP-CFSR reanalysis data was downloaded from https://rda.ucar.edu/datasets/ds094.0. The OISSTv2 data was obtained from https://psl.noaa.gov/data/gridded/data.noaa.oisst.v2.html. The OLR data was retrieved from https://climatedataguide.ucar.edu/climate-data/outgoing-longwave-radiation-olr-avhrr. The AAO index data is available at https://www.cpc.ncep.noaa.gov/products/precip/CWlink/daily_ao_index/aao/aao_index.html. Further inquiries can be directed to the corresponding author.
Author Contributions
OZ performed the analysis. OZ and LX did the visualization. OZ and KC wrote the manuscript. OZ, KC, and LX contributed to the editing. KC and ZW supervised the study. All authors participated in the discussion.
Funding
This study was supported by the National Key R&D Program of China (2019YFC1510400), the National Natural Science Foundation of China and Macau Science and Technology Development Joint Fund (41861164027), the Innovation Group Project of the Southern Marine Science and Engineering Guangdong Laboratory (Zhuhai) (311021001), the Guangdong Province Key Laboratory for Climate Change and Natural Disaster Studies (2020B1212060025), and the Fundamental Research Funds for the Central Universities, Sun Yat-sen University (2021qntd29).
Conflict of Interest
The authors declare that the research was conducted in the absence of any commercial or financial relationships that could be construed as a potential conflict of interest.
Publisher’s Note
All claims expressed in this article are solely those of the authors and do not necessarily represent those of their affiliated organizations, or those of the publisher, the editors and the reviewers. Any product that may be evaluated in this article, or claim that may be made by its manufacturer, is not guaranteed or endorsed by the publisher.
Acknowledgments
The authors gratefully thank Dr. Dongxiao Wang, Dr. Ke Fan, Dr. Si Gao, Dr. Marco Y.-T. Leung, Dr. Peng Hu, Mr. Zhenyuan Dong, and Miss Minglin Zheng for the valuable discussions. Besides, we thank the anonymous reviewers for the helpful comments and suggestions that significantly improve the manuscript.
References
Au-Yeung, A. Y. M., and Chan, J. C. L. (2012). Potential Use of a Regional Climate Model in Seasonal Tropical Cyclone Activity Predictions in the Western North Pacific. Clim. Dyn. 39, 783–794. doi:10.1007/s00382-011-1268-x
Camargo, S. J., Barnston, A. G., Klotzbach, P. J., and Landsea, C. W. (2007). Seasonal Tropical Cyclone Forecasts. WMO Bull. 56, 297–309.
Camp, J., Roberts, M. J., Comer, R. E., Wu, P., MacLachlan, C., Bett, P. E., et al. (2019). The Western Pacific Subtropical High and Tropical Cyclone Landfall: Seasonal Forecasts Using the Met Office GloSea5 System. Q. J. R. Meteorol. Soc. 145, 105–116. doi:10.1002/qj.3407
Cao, X., Chen, G.-H., Huang, R.-H., and Chen, W. (2014). The Intensity Variation of the Summer Intertropical Convergence Zone in Western North Pacific and its Impact on Tropical Cyclone. J. Trop. Meteorology 20, 193–201. doi:10.16555/j.1006-8775.2014.03.001
Chan, J. C. L., Shi, J.-E., and Lam, C.-M. (1998). Seasonal Forecasting of Tropical Cyclone Activity over the Western North Pacific and the South China Sea. Weather Forecast. 13, 997–1004. doi:10.1175/1520-0434(1998)013<0997:sfotca>2.0.co;2
Chan, K. T. F., Dong, Z., and Zheng, M. (2021). Statistical Seasonal Forecasting of Tropical Cyclones over the Western North Pacific. Environ. Res. Lett. 16, 074027. doi:10.1088/1748-9326/ac05f1
Chen, D., Wang, H., Liu, J., and Li, G. (2015). Why the Spring North Pacific Oscillation Is a Predictor of Typhoon Activity over the Western North Pacific. Int. J. Climatol. 35, 3353–3361. doi:10.1002/joc.4213
Chen, L., and Ding, Y. (1979). The Conspectus of Western Pacific Typhoon. Beijing: Science Press, 107–109.
Choi, K.-S., Moon, J.-Y., Kim, D.-W., and Chu, P.-S. (2010). Seasonal Prediction of Tropical Cyclone Genesis Frequency over the Western North Pacific Using Teleconnection Patterns. Theor. Appl. Climatol. 100, 191–206. doi:10.1007/s00704-009-0182-1
DelSole, T., and Shukla, J. (2009). Artificial Skill Due to Predictor Screening. J. Clim. 22, 331–345. doi:10.1175/2008JCLI2414.1
Fan, K. (2009). Seasonal Forecast Model for the Number of Tropical Cyclones to Make Landfall in China. Atmos. Oceanic Sci. Lett. 2, 251–254. doi:10.1080/16742834.2009.11446811
Fan, K. (2010). A Prediction Model for Atlantic Named Storm Frequency Using a Year-By-Year Increment Approach. Weather Forecast. 25, 1842–1851. doi:10.1175/2010WAF2222406.1
Fan, L., Li, J., Wei, Z., Dong, W., and Wang, J. (2003). Annual Variations of the Arctic Oscillation and the Antarctic Oscillation. Chin. J. Atmos. Sci. 27, 419–424.
Gao, S., Chen, Z., and Zhang, W. (2018). Impacts of Tropical North Atlantic SST on Western North Pacific Landfalling Tropical Cyclones. J. Clim. 31, 853–862. doi:10.1175/JCLI-D-17-0325.1
Gao, S., Chen, Z., Zhang, W., and Shen, X. (2020). Effects of Tropical North Atlantic Sea Surface Temperature on Intense Tropical Cyclones Landfalling in China. Int. J. Climatol. 41, 1056–1065. doi:10.1002/joc.6732
Goh, A. Z.-C., and Chan, J. C. L. (2010). An Improved Statistical Scheme for the Prediction of Tropical Cyclones Making Landfall in South China. Weather Forecast. 25, 587–593. doi:10.1175/2009WAF2222305.1
Gong, D., and Wang, S. (1999). Definition of Antarctic Oscillation index. Geophys. Res. Lett. 26, 459–462. doi:10.1029/1999GL900003
Gray, W. M. (1984a). Atlantic Seasonal Hurricane Frequency. Part I: El Niño and 30 mb Quasi-Biennial Oscillation Influences. Mon. Weather Rev. 112, 1649–1668. doi:10.1175/1520-0493(1984)112<1649:ashfpi>2.0.co;2
Gray, W. M. (1984b). Atlantic Seasonal Hurricane Frequency. Part II: Forecasting its Variability. Mon. Weather Rev. 112, 1669–1683. doi:10.1175/1520-0493(1984)112<1669:ashfpi>2.0.co;2
Hall, T. M., and Jewson, S. (2007). Statistical Modelling of North Atlantic Tropical Cyclone Tracks. Tellus A: Dynamic Meteorology and Oceanography 59, 486–498. doi:10.1111/j.1600-0870.2007.00240.x
Ham, Y.-G., and Kug, J.-S. (2015). Role of north Tropical Atlantic SST on the ENSO Simulated Using CMIP3 and CMIP5 Models. Clim. Dyn. 45, 3103–3117. doi:10.1007/s00382-015-2527-z
Ho, C.-H., Kim, J.-H., Kim, H.-S., Sui, C.-H., and Gong, D.-Y. (2005). Possible Influence of the Antarctic Oscillation on Tropical Cyclone Activity in the Western North Pacific. J. Geophys. Res. 110, D19104. doi:10.1029/2005JD005766
Hu, F., Li, T., Liu, J., Bi, M., and Peng, M. (2018). Decrease of Tropical Cyclone Genesis Frequency in the Western North Pacific since 1960s. Dyn. Atmospheres Oceans 81, 42–50. doi:10.1016/j.dynatmoce.2017.11.003
Hu, P., Chen, W., Chen, S., Liu, Y., Wang, L., and Huang, R. (2020). Impact of the March Arctic Oscillation on the South China Sea Summer Monsoon Onset. Int. J. Climatol. 41, 3239–3248. doi:10.1002/joc.6920
Huang, W.-R., and Chan, J. C. L. (2014). Dynamical Downscaling Forecasts of Western North Pacific Tropical Cyclone Genesis and Landfall. Clim. Dyn. 42, 2227–2237. doi:10.1007/s00382-013-1747-3
Klotzbach, P., Blake, E., Camp, J., Caron, L.-P., Chan, J. C. L., Kang, N.-Y., et al. (2019). Seasonal Tropical Cyclone Forecasting. Trop. Cyclone Res. Rev. 8, 134–149. doi:10.1016/j.tcrr.2019.10.003
Li, R. C. Y., Zhou, W., Shun, C. M., and Lee, T. C. (2017). Change in Destructiveness of Landfalling Tropical Cyclones over China in Recent Decades. J. Clim. 30, 3367–3379. doi:10.1175/JCLI-D-16-0258.1
Liu, G., Sun, S., and Zhang, Q. (2009). Characteristics of the Intraseasonal Oscillation of Intertropical Convergence Zone and its Influence on the Periodical Tropical Cyclogenesis. Chin. J. Atmos. Sci. 33, 879–889.
Liu, G., Zhang, Q., and Sun, S. (2007). A Preliminary Study on Activities of Tropical Cyclones over the Western North Pacific during the Summer of 2006. Climatic Environ. Res. 12, 738–750. doi:10.3969/j.issn.1006-9585.2007.06.004
Liu, K. S., and Chan, J. C. L. (2003). Climatological Characteristics and Seasonal Forecasting of Tropical Cyclones Making Landfall along the South China Coast. Mon. Weather Rev. 131, 1650–1662. doi:10.1175//2554.1
Liu, K. S., and Chan, J. C. L. (2013). Inactive Period of Western North Pacific Tropical Cyclone Activity in 1998-2011. J. Clim. 26, 2614–2630. doi:10.1175/JCLI-D-12-00053.1
Lok, C. C. F., and Chan, J. C. L. (2017). Changes of Tropical Cyclone Landfalls in South China throughout the Twenty-First Century. Clim. Dyn. 51, 2467–2483. doi:10.1007/s00382-017-4023-0
Mei, W., and Xie, S.-P. (2016). Intensification of Landfalling Typhoons over the Northwest Pacific since the Late 1970s. Nat. Geosci. 9, 753–757. doi:10.1038/ngeo2792
Nicholls, N. (1979). A Possible Method for Predicting Seasonal Tropical Cyclone Activity in the Australian Region. Mon. Weather Rev. 107, 1221–1224. doi:10.1175/1520-0493(1979)107<1221:apmfps>2.0.co;2
Nicholls, N. (1992). Recent Performance of a Method for Forecasting Australian Seasonal Tropical Cyclone Activity. Aust. Meteorol. Mag. 40, 105–110.
Park, D.-S. R., Ho, C.-H., and Kim, J.-H. (2014). Growing Threat of Intense Tropical Cyclones to East Asia over the Period 1977-2010. Environ. Res. Lett. 9, 014008. doi:10.1088/1748-9326/9/1/014008
Tian, B., and Fan, K. (2019). Seasonal Climate Prediction Models for the Number of Landfalling Tropical Cyclones in China. J. Meteorol. Res. 33, 837–850. doi:10.1007/s13351-019-8187-x
Wahiduzzaman, M., Oliver, E. C. J., Klotzbach, P. J., Wotherspoon, S. J., and Holbrook, N. J. (2019). A Statistical Seasonal Forecast Model of North Indian Ocean Tropical Cyclones Using the Quasi-Biennial Oscillation. Int. J. Climatol. 39, 934–952. doi:10.1002/joc.5853
Wang, G., Su, J., Ding, Y., and Chen, D. (2007). Tropical Cyclone Genesis over the South China Sea. J. Mar. Syst. 68, 318–326. doi:10.1016/j.jmarsys.2006.12.002
Wang, H., and Fan, K. (2007). Relationship between the Antarctic Oscillation in the Western North Pacific Typhoon Frequency. Chin. Sci. Bull. 52, 561–565. doi:10.1007/s11434-007-0040-4
Wang, Y., Song, T., Liang, J., and Pan, W. (2012). Simulation of Seasonal Tropical Cyclone Activity over the Western North Pacific by Using the WRF Model. Trans. Atmos. Sci. 35, 24–31. doi:10.13878/j.cnki.dqkxxb.2012.01.011
Wheeler, M. C., and Hendon, H. H. (2004). An All-Season Real-Time Multivariate MJO index: Development of an index for Monitoring and Prediction. Mon. Weather Rev. 132, 1917–1932. doi:10.1175/1520-0493(2004)132<1917:aarmmi>2.0.co;2
Xie, K., and Liu, B. (2014). An ENSO-Forecast Independent Statistical Model for the Prediction of Annual Atlantic Tropical Cyclone Frequency in April. Adv. Meteorology 2014, 1–11. doi:10.1155/2014/248148
Yuan, Z., Qin, J., Li, S., Huang, S., and Mbululo, Y. (2021). Impact of Spring AAO on Summertime Precipitation in the North China Part: Observational Analysis. Asia-pacific J. Atmos. Sci. 57, 1–16. doi:10.1007/s13143-019-00157-2
Zhan, R., Wang, Y., and Lei, X. (2011). Contributions of ENSO and East Indian Ocean SSTA to the Interannual Variability of Northwest Pacific Tropical Cyclone Frequency. J. Clim. 24, 509–521. doi:10.1175/2010JCLI3808.1
Zhan, R., Wang, Y., and Ying, M. (2012). Seasonal Forecasts of Tropical Cyclone Activity over the Western North Pacific: A Review. Trop. Cyclone Res. Rev. 1, 307–324. doi:10.6057/2012TCRR03.07
Zhang, C., Hu, C., Huang, G., Yao, C., Zheng, Z., Wang, T., et al. (2019). Perspective on Landfalling Frequency and Genesis Location Variations of Southern China Typhoon during Peak Summer. Geophys. Res. Lett. 46, 6830–6838. doi:10.1029/2019GL083420
Zhang, G., Zhang, X., and Wei, F. (1995). A Study on the Variations of Annual Frequency for Tropical Cyclone in Northwest Pacific during the Last Hundred Years. J. Trop. Meteorology 11, 315–323.
Zhang, Q., Zhang, W., Lu, X., and Chen, Y. D. (2012). Landfalling Tropical Cyclones Activities in the South China: Intensifying or Weakening? Int. J. Climatol. 32, 1815–1824. doi:10.1002/joc.2396
Zhang, W., Vecchi, G. A., Villarini, G., Murakami, H., Gudgel, R., and Yang, X. (2017). Statistical-Dynamical Seasonal Forecast of Western North Pacific and East Asia Landfalling Tropical Cyclones Using the GFDL FLOR Coupled Climate Model. J. Clim. 30, 2209–2232. doi:10.1175/JCLI-D-16-0487.1
Zhang, W., and Villarini, G. (2019). Seasonal Forecasting of Western North Pacific Tropical Cyclone Frequency Using the North American Multi-Model Ensemble. Clim. Dyn. 52, 5985–5997. doi:10.1007/s00382-018-4490-y
Keywords: seasonal forecast, South China, landfall, preseason predictors, tropical cyclone
Citation: Zhang OYW, Chan KTF, Xu L and Wu Z (2022) Statistical Seasonal Forecasting of Tropical Cyclone Landfall on South China Utilizing Preseason Predictors. Front. Earth Sci. 9:806204. doi: 10.3389/feart.2021.806204
Received: 31 October 2021; Accepted: 25 November 2021;
Published: 10 January 2022.
Edited by:
Guanghua Chen, Institute of Atmospheric Physics (CAS), ChinaReviewed by:
Xi Cao, Chinese Academy of Sciences, ChinaRui Jin, China Meteorological Administration, China
Copyright © 2022 Zhang, Chan, Xu and Wu. This is an open-access article distributed under the terms of the Creative Commons Attribution License (CC BY). The use, distribution or reproduction in other forums is permitted, provided the original author(s) and the copyright owner(s) are credited and that the original publication in this journal is cited, in accordance with accepted academic practice. No use, distribution or reproduction is permitted which does not comply with these terms.
*Correspondence: Kelvin T. F. Chan, Y2hlbnRoMjVAbWFpbC5zeXN1LmVkdS5jbg==