 Rongjie Yang
 Yingying Chen1
 Jie Du
 Xiangjun Pei
- 1College of Landscape Architecture, Sichuan Agricultural University, Chengdu, China
- 2Jiuzhaigou National Nature Reserve Administration, A’ba Tibetan and Qiang Autonomous Prefecture, A’ba, China
- 3Institute of Ecological and Environment, Chengdu University of Technology, Chengdu, China
The transfer of CO2 from lakes to the atmosphere is a component of the global carbon equilibrium, while the quantification of the CO2 partial pressure (pCO2) is critical for exploring the contribution of freshwater CO2 emissions in the regional/global carbon budget. To investigate the daily variability of pCO2 and CO2 fluxes (fCO2), we conducted in situ biweekly pCO2 detection at 7:00, 10:00, 14:00, and 17:00 China Standard Time (CST) from Jan. to Sept. 2020 in the subtropical urbanizing Qinglonghu Lake in Chengdu, Sichuan, China. The pCO2 during the daytime varied greatly from 8.3 to 1,061.3 μatm, with an average of 137.7 μatm, while the average pCO2 (n = 11) clearly gradually decreased from 7:00 CST (204.9 ± 295.7 μatm) to 17:00 CST (93.5 ± 105.5 μatm). Similarly, the average fCO2 values were −19.3 (±27.5), −24.8 (±20.7), −29.2 (±9.1) and −30.4 (±10.7) mmol m2 h−1 at 7:00–17:00 CST, respectively. Further, we observed a negative correlation between pCO2 and water temperature and dissolved oxygen, but a positive correlation between pCO2 and total organic carbon and chlorophyll a. By a systematic overview of previously published data, we also discussed the differences and uncertainties in pCO2 and fCO2 estimates at regional and global scales. We therefore speculate that uncertainties may exist in the contributions of CO2 balance on lake surface in regional/global carbon budgets due to this daily pCO2 variation.
Introduction
Since the Industrial Revolution, human activities, such as the consumption of fossil fuels and the exacerbation of land development (e.g., uncontrolled deforestation and rapid urbanization), have increased atmospheric carbon (C) by approximately 40% (Xu et al., 2019; Li Q. et al., 2020; Wang et al., 2021). From 2007 to 2016, approximately 10.7 ± 1.2 Gg C yr−1 of anthropogenic carbon was released into the atmosphere globally, of which 4.7 ± 0.1 Gg C yr−1 remains in the atmosphere (Le Quéré et al., 2018; Chen and Hu, 2019; León-Palmero et al., 2020). The absorption of carbon dioxide (CO2) by the ocean (ca. 2.4 ± 0.5 Gg C yr−1) has caused ocean acidification (an increase of ca. 30% acidity) or surface-water pH decline (ca. 0.1 units), resulting in a decline of marine biodiversity and ecosystem functions (Dickinson et al., 2012; Chen et al., 2017; Chen and Hu, 2019). Furthermore, CO2 emitted into the atmosphere from aquatic ecosystems, including inland freshwater ecosystems, such as urban lakes, can greatly contribute to climate change, as verified by previous works (IPCC, 2014; Wen et al., 2017). Correspondingly, the global carbon balance and hydrological processes are rapidly becoming urgent issues in studies of anthropogenic impacts.
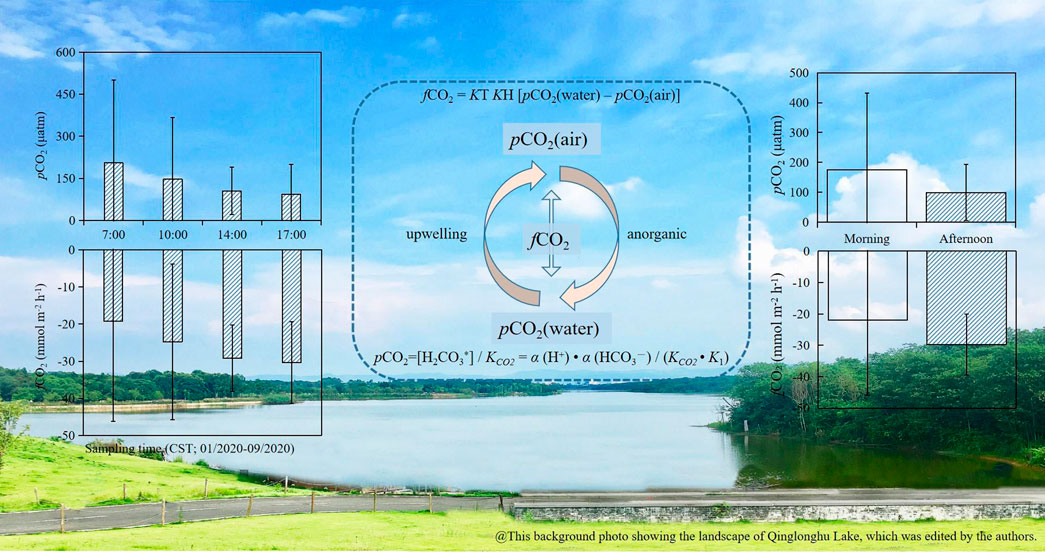
GRAPHICAL ABSTRACT
Inland waters are a small but crucial part of the global carbon cycle (Peter et al., 2014; Yang et al., 2019); the net carbon flux of aquatic ecosystems per unit area is greater than that of surrounding terrestrial ecosystems (Karim et al., 2011). Many publications have reported that 90% of inland lakes worldwide are supersaturated with CO2 compared to the atmosphere and are therefore considered sources of atmospheric CO2 (Cole et al., 1994; Karim et al., 2011). As a result, CO2 outgassing from inland lakes represents a significant contribution to the global carbon equilibrium (Marce et al., 2015). Based on previous evaluations, CO2 emissions from global inland lakes to the atmosphere are more than 1.4 Pg C yr−1 (Li et al., 2012; Keller et al., 2020), of which 60% are from freshwater lakes and 40% are from saline lakes (Cole et al., 1994; Tranvik et al., 2009; Raymond et al., 2013). Furthermore, the level of dissolved CO2 in inland lakes is higher than the typical level (i.e., 380–420 μatm; Sabine et al., 2004; Abril et al., 2014; Li Q. et al., 2020, Li S. et al., 2020) of atmospheric CO2, suggesting that freshwater has the potential to degas aqueous CO2 into the atmosphere (Li et al., 2012). Therefore, CO2 emissions from inland lakes to the atmosphere are an important part of the global and regional carbon budget.
The surface-water CO2 partial pressure (hereafter pCO2) is one of the key parameters quantified in research works to better understand the changes in carbon cycling globally. In general, surface-water pCO2 is mainly controlled by four interrelated phenomena: thermodynamic effects, physical mixing, biological activities, and water-atmosphere CO2 inter-exchange (Yang et al., 2019; Wang et al., 2021). Aquatic environmental variables, such as surface acidity (Pardue et al., 1988), trophic states (Tonetta et al., 2014), chlorophyll level (Xu et al., 2019; Yang et al., 2019), and water temperature (Marotta et al., 2009; Kosten et al., 2010), and other parameters, such as dissolved oxygen (DO), wind speed and solar radiation (Marce et al., 2015; Chen et al., 2017), are closely related to these four phenomena and might cause fluctuations in the spatial-temporal variability of pCO2 and CO2 evasion. Regarding inland freshwater systems, numerous studies have been conducted to investigate pCO2 and CO2 evasion in large rivers (with widths greater than 100 m), such as the Amazon (Richey et al., 2002; Abril et al., 2014), Mississippi (Crawford et al., 2016), Yangtze (Li et al., 2012; Liu et al., 2017) and Yellow Rivers (Ran et al., 2015). The results have revealed that the concentrations of CO2 in these rivers are higher than those in the overlying atmosphere (i.e., that these rivers exhibit CO2 supersaturation), suggesting that these rivers are the “source” of CO2 in the atmosphere (Yoon et al., 2017; Li S. et al., 2020). Unlike the conditional conversion between the “source” and “sink” roles of marine ecosystems (Sabine et al., 2004; Yan et al., 2018), most inland lakes/reservoirs function as net “sources” of CO2 because they are heterotrophic systems, similar to rivers (Cole et al., 1994; Richey et al., 2002; Gu et al., 2011), while some small productive lakes as carbon “sinks” (Maier et al., 2021 and related refs.). Currently, the temporal variability of CO2 in lakes/streams is taken into account in many studies, which find similar relationships between photosynthesis and remineralization in response to variations in solar insolation (Alin and Johnson, 2007; Callbeck et al., 2010; Marotta et al., 2010; Tonetta et al., 2014). However, lots of the field data collected for CO2 evasion estimation have low temporal resolution, such as weekly to quarterly, and therefore ignore the diurnal variation in pCO2 and thus the CO2 flux.
In addition, aquatic pCO2 is markedly affected by photosynthesis (P) and respiration (R), which are driven by temperature and radiation in different geographic regions (Marotta et al., 2010; Tonetta et al., 2014; Xu et al., 2019). For example, the average CO2 flux in the headwater catchment area of the Alaska Highlands, in Arctic tundra, is 5.1 μmol C m2 s−1 (Crawford et al., 2013), while the average CO2 emissions in the two reservoirs in Spain (Guadalcacín and Bornos), in the Mediterranean climate, are between 5.6 and 34.7 μmol C m2 s−1 (Morales-Pineda et al., 2014). Accordingly, the influences of diel pCO2 changes on the estimation of CO2 degassing and uncertainties in these estimates remain unclear, although the estimation of CO2 emissions on a regional/global scale has been strengthened through many studies. Thus, to reduce the uncertainty of CO2 evasion estimation, we need to consider the changes in air-water pCO2 and CO2 flux (i.e., fCO2) over the span of a day, thereby limiting these factors that cause data scatters and variances.
There is still a knowledge gap regarding the daily change in pCO2 and fCO2, while previous studies mainly focused on weekly to quarterly data. Based on the aforementioned background, an in situ investigation of the daily changes in pCO2 and fCO2 in a subtropical urbanized lake (named Qinglonghu Lake) was conducted in Chengdu, Southwest China. Specifically, the objectives of our study are to 1) monitor fortnightly the water-air pCO2 and related environmental parameters during the daytime from Jan. to Sept. 2020; 2) evaluate fCO2 by employing the measured pCO2 and discuss the uncertainties in CO2 evasion estimation; and 3) explore the roles of environmental factors and the in-lake CO2 exchange behaviours. The findings will significantly improve our understanding of the mechanisms of daily pCO2 variations and increase the accuracy of CO2 evasion estimations in freshwater environments.
Methods
Site Description
This study was conducted at Qinglonghu Lake (longitude 104°11′14″ E, latitude 30°38′26″ N) in Chengdu, Southwest China (Figure 1). The lake is located in the Round-the-city Ecological Zone of Chengdu, which is the largest urban wetland in the city and is used for the construction of a lake-forest system. The lake has an open water surface of approximately 82 ha, a circumference of 12 km, and a depth ranging from 0.5 to 6.0 m (Li and Cai, 2019). The lake was irrigated from the Dongfeng Canal in April 2008 and officially opened in Jan. 2016.
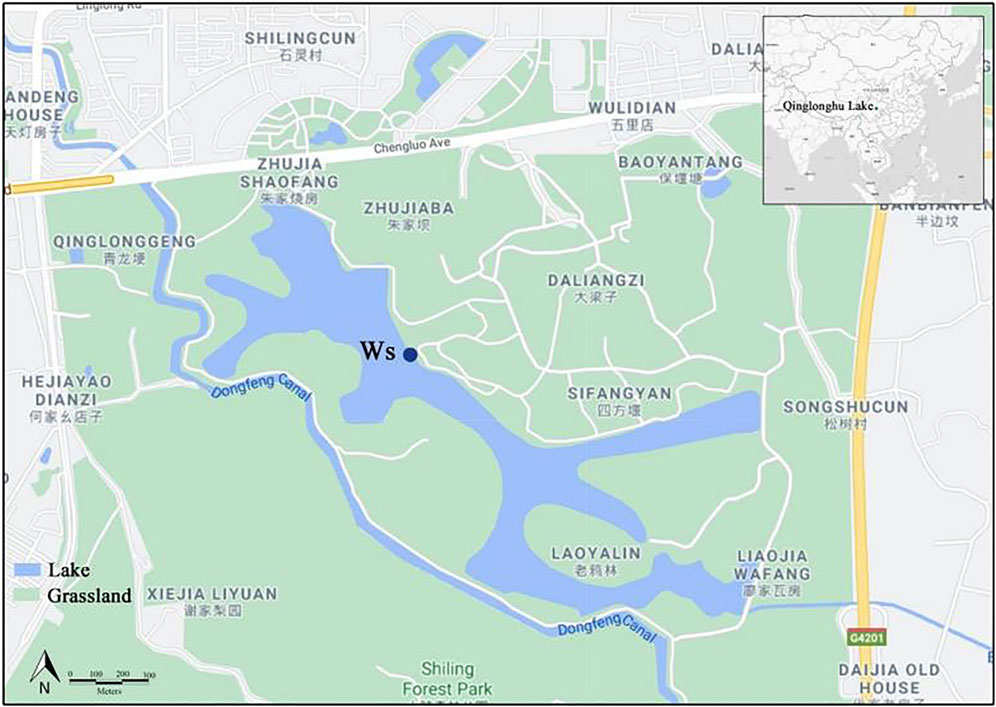
FIGURE 1. Geographical location of Qinglonghu Lake in the city of Chengdu, Sichuan, Southwest China. Ws represents the location of water sample collection and on-site dynamic monitoring. The above is a modified graph based on the Google® Maps (https://www.google.cn/maps).
The study region has a humid subtropical climate with a long frost-free period and abundant rainfall; the average annual air temperature is 16.5°C, with the lowest air temperature in January (4.6°C) and the highest air temperature in July or August (∼37.5°C). During the 9-months investigation period, the average daily air temperature around the lake was −5 to 30°C, with the highest air temperature in August and the lowest air temperature in January (Figure 2A). Moreover, the annual average rainfall is approximately 900 mm. Less precipitation occurs in spring, but more precipitation occurs in summer (e.g., ∼200 mm in Aug. 2020), which can easily cause floods. The annual average number of solar radiation hours is approximately 1,032, and the number of radiation hours from April to August was higher than that from January to March during the study period (Figure 2B).
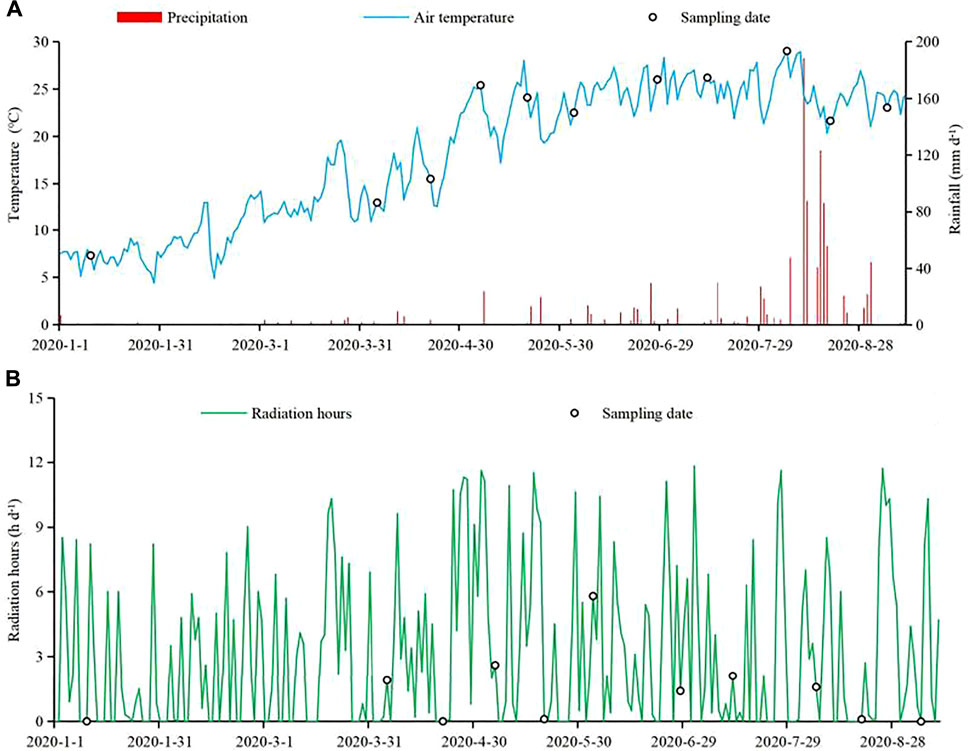
FIGURE 2. Daily air temperature and precipitation ((A); mm d−1) and radiation ((B); h d−1) during the study period in Qinglonghu Lake. The hollow circles represent the dates of sampling and monitoring of water samples. The data in the above figures have been authorized by the National Meterological Data Center of China (https://data,cma,cn/) via the authors’ emails.
Field Measurements
In this study, we conducted biweekly field trips from Jan. to Sept. 2020 to measure pCO2 and related water quality parameters. Based on previous full-scale investigations, an open site near the lake outflow was selected for water sample collection and parameter monitoring (Figure 1). During each trip, in situ measurements were taken at 7:00, 10:00, 14:00, and 17:00 China Standard Time (CST) at approximately 2 m from the lake shore, which was based on previous studies such as Perkins et al. (2015), Xu et al. (2019), and Yang et al. (2019). All measurements were carried out at the same location. To minimize the influences of rainfall/runoff and avoid the potential bias in measurements, all trips were made on sunny days to avoid weather conditions such as rainfall, winds and runoff by adjusting the timing. All on-site detected parameters (including pH, water temperature (twater), transparency (TPC), turbidity (FNU), electrical conductivity (EC), total dissolved solids (TDS), DO, bicarbonate (HCO3−; BCB) and carbonate (CO32−; CB) were measured at a depth of 30–50 cm below the water surface, and recordings were taken after the instrument reading had remained stable for 3–5 min.
Among the detected parameters, TPC was measured using a black-and-white disc with a diameter of 200 mm, while FNU was monitored using a TSS portable turbidity meter (HACH, TSS Portable, Danaher, United States). The other parameters, including pH, EC, TDS, and twater were measured by a Hanna multiparameter pen-type detector (Hanna-HI9829, Hanna Instruments Co., Ltd., Italy). The DO and DO saturation (DO%) were monitored using a Hanna-HI98186 portable high-precision DO meter.
Unlike oceanography, there is currently no consistent definition of an appropriate method for measuring or calculating pCO2 in freshwater. There are direct and indirect methods for measuring pCO2 using acidimetric titrations. An indirect method that greatly simplifies the alkalinity determination procedure by titrating to pH 4.5 and has been widely used, especially for freshwater with pH > 7 and low organic carbon, i.e., pCO2 is calculated via pH/alkalinity in particular (Telmer and Veizer, 1999; Butman and Raymond, 2011; Wang et al., 2011). Moreover, currently direct measurements of water pCO2 remain scarce in freshwater, and most published pCO2 data are calculated from temperature, pH and total alkalinity using the above indirect method (e.g., Li et al., 2013; Abril et al., 2015; Varol and Li, 2017; Xiao et al., 2020; Ni et al., 2021). As we know, the alkalinity and pH are critical for pCO2 calculations, in particular, a pH difference of 0.005 unit could affect pCO2 calculations (Li et al., 2013). Therefore, we carefully scrutinized the values as follows: 1) the pH probes were carefully calibrated, 2) the in situ pH values were recorded when the pH stabilized in 0.01 units for 3–5 min, and 3) three replicates for individual samples were determined for alkalinity and the mean values were taken. Our investigation found that our studied freshwater lake has the pH from circumneutral to basic (∼8.8) and the alkalinity exceeding 1,000 μmol L−1 (Abril et al., 2015), suggesting that the calculation of pCO2 from pH, alkalinity and temperature is effective reliability. Following the previous classic Eq. 1, therefore, pCO2 was calculated by detecting the pH, bicarbonate, ion concentrations and Henry’s law constant (Kh) of water (Telmer and Veizer, 1999).
Thus, we collected 100 ml of water samples into a 250 ml Erlenmeyer flask and then added 4 drops of phenolphthalein indicator. We also employed an HCl standard solution to titrate the solution until it became just faded or colourless and then recorded the amount of standard solution (defined as P) after it turned red. If the solution was colourless after adding the phenolphthalein indicator, it was considered unnecessary to titrate the HCl standard solution again. Subsequently, we continuously added 3 drops of standard methyl orange indicator into the Erlenmeyer flask, standardized the flask with the HCl standard solution until it turned from orange-yellow to orange-red, and then recorded the amount of standard solution (defined as M). Accordingly, the total consumption of HCl standard solution (defined as T) in the water sample was calculated as follows Eq. 2:
According to the different values of P (i.e., P = T, p > 1/2T, P = 1/2T, p < 1/2T, P = 0), the following calculation Eqs. 3, 4 of CB and BCB were employed:
where CHA represents the concentration of HCl standard solution (mol L−1) and V represents the water sample volume (ml). In this study, CHA was 0.025 mol L−1, while V was 100 ml. In addition, (30.005) indicates the mass of CO32− in grams (g) equivalent to 1.00 ml of HCl standard solution (CHA = 1.00 mol L−1), while (61.017) indicates that of HCO3− in grams (g).
After completing the on-site data collection, we collected water samples using a homemade polyethylene grab sampler at 7:00, 10:00, 14:00 and 17:00 CST on each trip for laboratory analysis. Briefly, 500 ml water samples were collected, and 0.5 ml MgCO3 suspension (1%) was added for the determination of water chlorophyll a (Chla). The lake water (20 ml) was filtered with a microporous membrane (50 mm × 0.45 μm; Jiangsu Green-Union Scientific Instrument Co., Ltd., Jiangsu, China) and then stored in polyethylene bottles to determine total carbon (TC) and inorganic carbon (IC). In addition, we collected 50 ml water samples and filtered them with a microporous membrane for anion (i.e., fluoride/F−, chloride/Cl−, sulfate/SO42−, and nitrate/NO3−) detection. All samples were stored in acid-washed high-density polyethylene bottles that were capped tightly and placed in cooling vessels with enough ice during transportation.
Laboratory Analyses
The Chla in water samples was detected using the acetone method following a previous protocol (The National Environmental Protection Agency, 2002). Briefly, a quantitative volume of water sample was poured onto the suction filter with a fibre membrane for complete suction filtration. The filter membrane with phytoplankton was then removed, dried at a low temperature in a refrigerator for 8 h, and fully ground with MgCO3 powder and 2 ml of 90% acetone to extract Chla. The extraction solution was then centrifuged at 3,500 × g for 10 min. The supernatant was ground with 2 ml of acetone, centrifuged again for 10 min, and then transferred/diluted to 10 ml with acetone. Finally, the treated supernatant was detected by using an UV1901PCS ultraviolet spectrophotometer (Youke Instruments, Shanghai, China) at 750, 663, 645, and 630 nm, with 90% acetone as a blank. The Chla concentration (mg m−3) was calculated following formula Eq. 5:
where V is the volume of the water sample (L), D is the absorbance, V1 is the constant volume of the extraction solution, and CL is the optical path of the cuvettes (cm).
Four anions were determined by ion chromatography following the National Environmental Protection Standards of China (HJ 84-2016). Briefly, the water samples were filtered through a 0.45 μm microporous membrane to determine the standard curves (F−, R2 = 0.9996; Cl−, R2 = 0.9991; NO3−, R2 = 0.9998; SO42−, R2 = 0.9999). The concentrations (mg L−1) of the four anions were then detected using IC-2800 ion chromatography (Beijing Dongxi Analytical Instrument Co., Ltd., Beijing, China).
To analyze trophic states, the other parameters such as NT (nitrate; Supplementary Methods S1), TP (total phosphorus; Supplementary Methods S2), TDN (total dissolved nitrogen; Supplementary Methods S3) and eutrophication evaluation [TLI (∑); Supplementary Methods S4] also were evaluated.
TC and IC were analyzed using a Total Organic Carbon Analyser (TOC-L CPH Basic System; Shimadzu Co., Kyoto, Japan). Briefly, 0–50 ml of organic carbon (i.e., potassium hydrogen phthalate), inorganic carbon (i.e., sodium carbonate/bicarbonate) and KNO3 standard solution were added to 50 ml colorimetric tubes and then diluted. The standard curves (IC: R2 = 1.0000; TC: R2 = 1.0000; see Supplementary Figure S1) were measured by using the TOC-L CPH analyser. Before detection, these samples were bubbled with nitrogen to remove inorganic carbon (CO2) (Kortelainen, 1993; Bisutti et al., 2004). Moreover, a filter was used when the tested water samples contained insoluble particles, and the pore size of the filter membrane was ≤60 µm. During the detection, to ensure that no-air (CO2) entered, the sampling tubes were submerged below the liquid surface, and the nozzle of the tube was placed at about 1/3 of the height of the solution near the bottom of the container. The calculations of TC and IC (mg L−1) were based on the peak height of the absorption peak, which subtracts the correction value of the peak height from the blank test absorption peak. Accordingly, the total organic carbon (TOC) concentration (mg L−1) was estimated using Eq. 6
pCO2 and CO2 Flux Calculation
Detection of pCO2
Previous studies have confirmed that dissolved inorganic carbon in water is composed of HCO3−, CO32−, H2CO3, and dissolved CO2. When the aqueous solution is in equilibrium, the concentration of each component is related to the pH, temperature and ionic strength of the water (ref. Cole and Caraco, 1998; Telmer and Veizer, 1999; Yao et al., 2007; Abril et al., 2015). Accordingly, in our work, based on the pH, HCO3−, CO32−, Kh and ions in water, the water-air pCO2 was calculated employing the CB equilibrium model (see Supplementary Methods S5 in detail). Based on the Henry’s Law, pCO2 (μatm) is calculated by the following Eq. 7:
where α (H+) and α (HCO3−) represent the ion activities of [H+] and [HCO3−], respectively (Eqs. 8, 9), while I represents the ionic strength Eq. 10.
Calculation of fCO2
CO2 diffusion at the water-air interface is affected by factors such as the difference in pCO2 between the atmosphere and water, temperature, salinity, and wind speed. Therefore, the calculation of water-air fCO2 in our study was based on the stagnant-layer model as follows Eq. 11 (ref. Cai and Wang, 1998; Bade and Cole, 2006; see Supplementary Methods S6 in detail):
where fCO2 indicates the flux of CO2 at the water-air interface (mmol m2 h−1), KH indicates the solubility of CO2 at a certain temperature (mol L−1 atm−1; ref. Weiss, 1970), KT represents the gas exchange rate of CO2 (cm h−1; ref. Katul and Liu, 2017). Moreover, KT was converted from the standardized Schmidt number of 600 (K600) according to the following Eq. 12 (Jahne et al., 1987):
where n is the Schmidt number exponent that depends on the surface state of the water. n is 0.50 when the wind speed exceeds 3.7 m s−1 and 0.75 when the wind speed is lower than 3.7 m s−1 (Guérin et al., 2007). Based on the findings of Cole and Caraco (1998), the Schmidt number is taken as 0.67 under normal circumstances. [ScCO2] represents the Schmidt number of CO2 at a given temperature (t) (Wanninkhof, 1992). The following Eq. 13 was used to obtain the value of K600 (Vachon and Prairie, 2013):
where U10 is the wind speed normalized to a height of 10 m above the water surface at the sampling time (m s−1; ref. Cole and Caraco, 1998). The data were compiled from the database of the National Meteorological Science Data Center of China (http://data.cma.cn/, Chengdu, Sichuan). This observation station is located in Longquanyi, Chengdu, which is close to the studied lake (less than 5 km away). The data were authorized by the application and were selected based on the average maximum value of 10 min of measurement on the sampling day.
Data Analysis
In this study, all statistical analyses were performed by IBM-SPSS Statistics software (IBM Corp., Armonk, New York, United States) from the contribution software platform provided (http://ms.sicau.edu.cn/soft/detail/52) for Tukey’s tests at the significance level of 0.05. The figures constructed in the present study, including Figures 4, 6, were generated using SigmaPlot 14.0 (Systat Software Inc., San Jose, California, United States).
Results and Discussion
The Sink-Source Behaviours of CO2 in the Mesoeutrophic Urbanizing Lake
As urbanization has accelerated in recent years, anthropogenic waste emissions have increased sharply, which has inevitably caused the deterioration of water quality in urbanizing lakes, the changes in hydrological processes, and the destruction of the water-nutrient-carbon cycle (Li S. et al., 2020). Therefore, studying the carbon dynamics of lakes and their CO2 exchange behaviour is of great significance for understanding the carbon emissions of urbanizing lakes in developing countries.
In the present study, our field investigations showed that on all most of the sampling days from Jan. to Sept. 2020 except April 5 (with the highest pCO2 at 14:00 CST; Figure 3B), May 6 (with the lowest pCO2 at 10:00 CST; Figure 3C) and Sept. 5 (with the highest pCO2 at 14:00 CST; Figure 3K), the concentrations of pCO2 significantly decreased from early morning (at 7:00 CST) to late afternoon (at 17:00 CST). Among the daily pCO2, the lowest values occurred between 14:00 and 17:00 CST, and the highest occurred between 7:00 and 10:00 CST (Figures 3A–L, 4). Furthermore, the average pCO2 (n = 11) showed a clear and gradually decreasing trend from 7:00 CST to 17:00 CST, with average decreases rate of 39.0% from 7:00 (240.9 ± 295.7 μatm) to 10:00 CST (146.9 ± 220.5 μatm), 28.3% from 10:00 to 14:00 CST (105.4 ± 85.3 μatm), and 11.3% from 14:00 to 17:00 CST (93.5 ± 105.5 μatm) (Figure 4A). These findings revealed that this studied lake could be a sink of CO2 throughout the season from January to September (except for August 19), while a sink-source phenomenon was discovered in Capitol/University Lake in central Louisiana, United States (Xu et al., 2019; Yang et al., 2019).
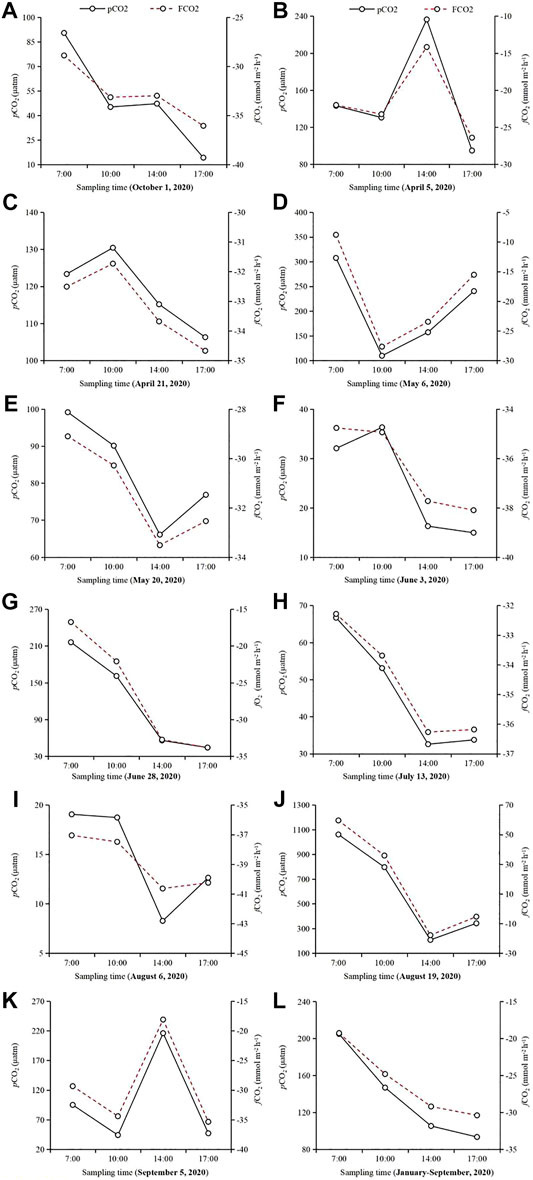
FIGURE 3. Hourly measurements of water pCO2 and estimation of fCO2 in Qinglonghu Lake. (A–K): The dots represents the pCO2 (solid line) and fCO2 (dotted lines) at each sampling time (n = 1). (L): The dots represent the average pCO2 (solid line) and fCO2 (dotted line) of all measurements (n = 11) at each sampling time during the study.
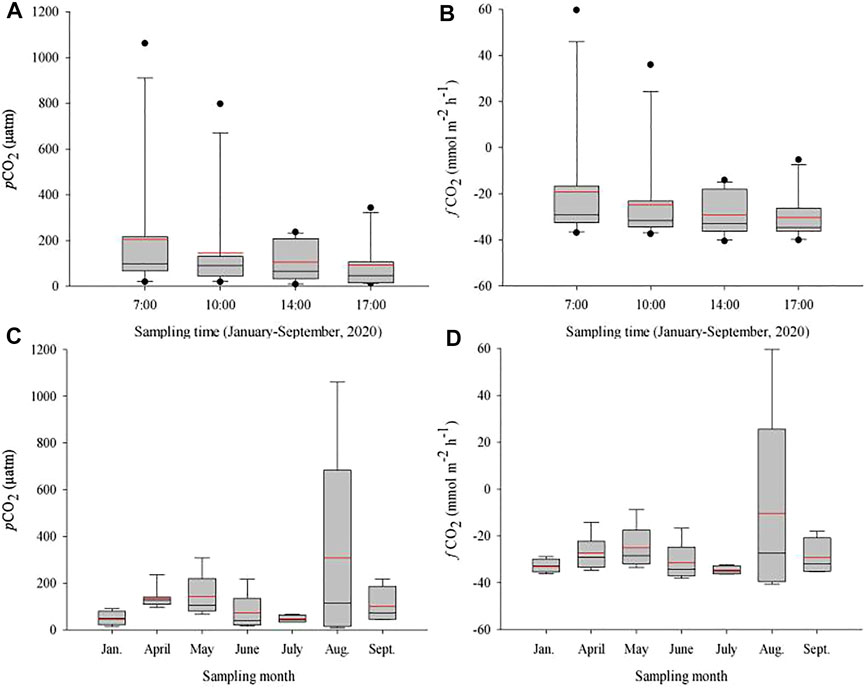
FIGURE 4. Hourly and monthly changes in water pCO2 (A,C) and fCO2 (B,D) at different sampling times Jan. to Sept. 2020 in Qinglonghu Lake. The black line, red line, lower edge, upper edge, bars, dots in or outside the boxes refer to median and mean values, 25th and 75th, 5th and 95th, and <5th and >95th percentiles of all data, respectively. Figures A and B were drawn based on the data of all measures values (n = 11) at each sampling time during the study period, while Figures C and D were drawn based on the data of all measurements (n = 4, 8) in each sapmling month.
Interestingly, the pCO2 on the sampling dates other than August 19 was below 400 μatm (Figure 3), although the pCO2 values in the mornings were higher than those in the afternoons (Figure 5), which may be due mainly to the large amount of atmospheric precipitation (i.e., 80–200; Table 1) compared to that in our previous study (0–85 mm of rainfall; Yang et al., 2019). Studies showed that precipitation affects aquatic pCO2, mainly due to its impact on soil respiration and carbon transport (Hope et al., 2004; Li et al., 2017). After short-term atmospheric precipitation, the biodegradation and decomposition of the labile fractions toward the top soil layers via runoff (Ran et al., 2015) are also important sources of dissolved CO2. However, for the lake area during the dry season, long-term and high-intensity floods offset the contribution of soil CO2 erosion input (Luo et al., 2019), thereby significantly diluting the control of lake pCO2 and CO2 exchange. Further, many previous studies have confirmed that precipitation stimulates complex chemical reactions at the water-air interface. The principle of these processes can be explained by the classic carbonate equilibrium equation as follows Eq. 14:
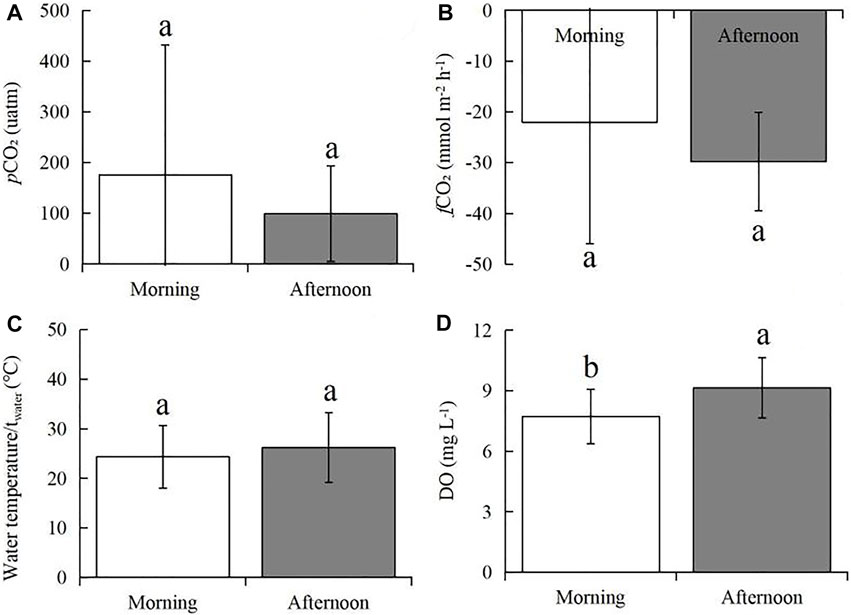
FIGURE 5. Differences in average pCO2 (A), fCO2 (B), twater (C), and DO (D) between the morning hours (7:00–10:00 CST) and the afternoon hours (4:00–17:00 CST). The rectangular bars represent the average values of all measurements at two tome points, while the error bars represents the standard deviations (SDs) among a total of 24 testing results. Different lowercase letters indicate that the mean values are significantly different between morning and afternoon hours at p < 0.005 according to Turkey’ tests.
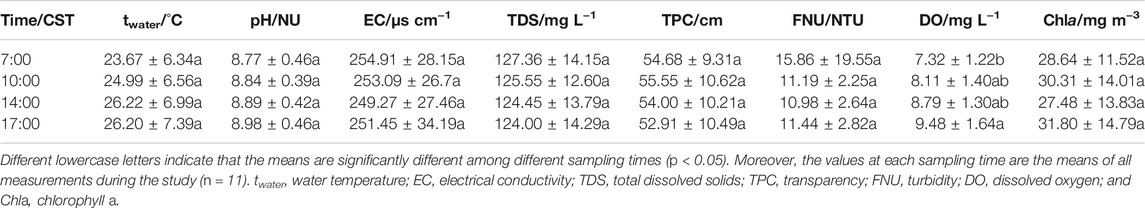
TABLE 1. Hourly changes in water quality parameters in Qinglonghu Lake.
When rainwater with a pH value lower than the lake water falls on the lake surface, the amount of free ion H+ greatly increases, causing the balance of carbonates existing in the water to be disturbed and moving to the left. Therefore, in the case of excessive H+, especially acid rain in urban areas, an extra amount of CO2 will be produced in the surface water. Furthermore, atmospheric precipitation represents a certain chemical pressure, which depends on the quasi-stable daily rhythm of CO2 consumption and emission by aquatic organisms. Once the CO2 content in the surface water is excessive for a short period of time, the biota cannot respond quickly to this change, causing most of the gas to be discharged into the atmosphere. These findings have been confirmed by previous studies on the influence of atmospheric precipitation on the changes in CO2 content at the water-air interface of the Lake Baikal in southern Eastern Siberia, Russia (Domysheva et al., 2007), University Lake in Baton Rouge, Louisiana, United States (Xu et al., 2019) and other lakes (Hastie et al., 2018 and related refs.). Accordingly, in our study, precipitation on the lake surface facilitated CO2 exchange and can be regarded as an additional source. Besides, because the sampling site is relatively open, the overall wind speed is relatively high; this wind accelerates the exchange of water-soluble gases with the atmosphere, decreasing the pCO2 at the water-air interface. In agreement with this study, previous publications have reported that the regression between pCO2 and wind speed was the largest with a no-time-lag negative correlation (Morales-Pineda et al., 2014), suggesting that the acceleration of CO2 gas-water exchange, as the main process, promoted the decrease in pCO2 (Podgrajsek et al., 2015; Shao et al., 2015). Therefore, combining the daily CO2 dynamic information from atmospheric precipitation and wind-speed improves the accuracy of CO2 estimation.
In our study, the daily average pCO2 for the whole period (i.e., Jan. to Sept. 2020) was 108.2 ± 100.8 μatm; at the monthly level, the highest daily average pCO2 was August (308.5 ± 407.4 µatm), while the lowest was July (23.3 ± 16.4 µatm) (Figure 4C). Correspondingly, the levels of daily average fCO2 decreased from 7:00 to 17:00 CST (from −19.3 ± 27.5 to −30.4 ± 10.7 mmol m2 h−1) (Figures 3, 4), while the daily average fCO2 ranged from −10.4 (±38.5) mmol m2 h−1 in Aug. 2020 to −27.3 (±7.2) mmol m2 h−1 in April 2020, with an average fCO2 of −27.3 (±10.7) mmol m2 h−1 (Figures 4B,D). These lower values indicate that the biological productivity at 1.0 m depth far surpassed CO2 dissolution into the water. Similarly, a previous work regarding lake CO2 evasion in central Louisiana, United States, showed that lake water can serve alternately as a seasonal source-sink of CO2 (Xu and Xu, 2015). However, the global size distribution of lakes and ponds is a key source of uncertainty in calculating gas exchange and its contribution. Holgerson and Raymond (2016) analyzed the CO2 concentration of 427 lakes/ponds with a surface area ranging from 2.5 m2 to 674 km2. The results showed that very small ponds accounted for 8.6% of the global lakes/pond area, but accounted for 15.1% of CO2 emissions, and decreased with the increasing in the area of these lakes, which may be due to shallow water, high sediment and edge-to-water volume ratios, and frequent mixing (Kankaala et al., 2013; Holgerson, 2015). Therefore, whether the seasonal source-sink of lakes contribute to the global carbon budget depends on the flux (grams of CO2 per unit area) and the relative contribution of such lake systems to the global lake area, which needs further investigation against our studied lake.
Many previous studies have confirmed that the two main biogeochemical processes influencing pCO2 changes in freshwater systems are photosynthesis (P) and respiration (R) (Alin and Johnson, 2007). In this study, according to the variability of daily pCO2 and fCO2 (Figures 3, 4), the CO2 dynamics in the mesoeutrophic urbanizing lake were mainly driven by P during the daytime and impacted by the balance of P and R (Tranvik et al., 2009; Karim et al., 2011). Similar findings have been reported in our previous works (Xu et al., 2019; Yang et al., 2019) and in other studies of aquatic systems (Peng et al., 2012; Tonetta et al., 2014; Wang et al., 2021). In general, the P and R processes follow a circadian rhythm; that is, C fixation is limited to the day, but R occurs through the whole 24 h cycle (Schelske, 2006). Furthermore, strong negative correlations between DO and both pCO2 and fCO2 occurred during the daytime (i.e., −0.482** for pCO2/DO and −0.502** for fCO2/DO) in this study (Table 2, Supplementary Table S1), suggesting the pCO2 on the water surface mainly caused mainly by R is higher than the atmospheric CO2 when P is less than R (i.e., P:R < 1.0). In other words, this process is heterotrophic. In contrast, pCO2 in autotrophic ecosystems is lower than CO2 in the atmosphere (Gu et al., 2011). When P: R > 1.0, the lake may be supersaturated with CO2. Previous studies showed that the inorganic carbon loading is the main factor influencing dissolved CO2 concentration in lakes/reservoirs in the United States (Mcdonald et al., 2013). Further, water temperature could cause the concentrations of dissolved gases to rise, and the daily trends of pCO2 and DO can become similar because both gases become more difficult to dissolve at higher temperatures. However, in the present work, pCO2 and DO exhibited opposite responses to water temperature changes (Table 2, Supplementary Table S1; Figures 5A,D), indicating that the main force influencing dissolved gas concentration is the balance between P and R (Xu et al., 2019).
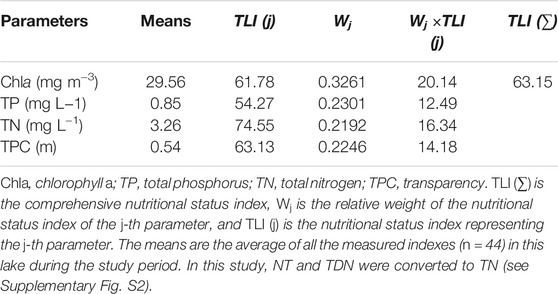
TABLE 2. Comprehensive nutritional status index TLI (∑) of Qinglonghu Lake.
Studies have shown that lakes in temperate regions could be considered heterotrophic when the concentration of dissolved organic carbon is higher than 6.0 mg C L−1 (Carignan et al., 2000). It is generally believed that due to heterogeneous loading of organic matter, pCO2 increases as the organic carbon in lake water increases (Sobek et al., 2005; Xu et al., 2019). In this study, a similar positive correlation between TOC and pCO2 was detected at all water sampling points (Supplementary Table S1), indicating that 7:00 CST may be the transition point between P and R. Moreover, a significantly positive relationship between TOC and Chla (p <0.05) was observed, indicating the TOC in this productive lake mainly sources from autochthonous production (Figure 6A–C, Supplementary Figure S5). In accordance with the results of Gu et al. (2011), the aforementioned result indicated that this phenomenon may be related to the consumption and decomposition of chlorophyll-containing materials overnight and the daytime production of aquatic organisms, which further supports the conclusion that major biological processes are controlling factors.
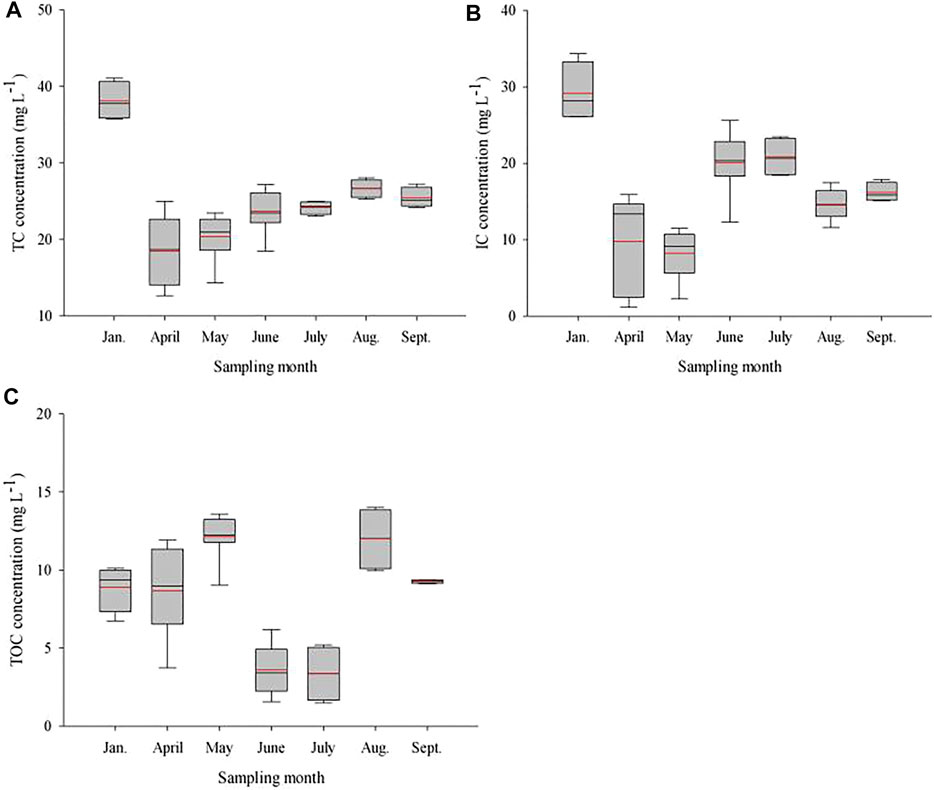
FIGURE 6. Monthly changes in water TC, IC, and TOC in Qinglonghu Lake. The symbol of the box diagrams is similar to Figure 4. The above figires were made based on the data of all measurements (n = 4, 8) in each sampling month.
Main Environmental Variables Contributing to the Dynamics of CO2
A previous investigation by Sobek et al. (2003) confirmed that TOC and pCO2 are co-variable in boreal lakes, which is interpreted as in-lake R of mainly terrestrial derived from TOC or DOC. However, in addition to the formation of aquatic R of pCO2 in the lake sediments, pCO2 supersaturation on the water surface may be the result of terrestrial R, by inputting groundwater with supersaturated pCO2 from soil R (Worrall et al., 2005; Stets et al., 2009). In this study, the CO2 dynamics during the daytime caused by pCO2 changes were mainly P and were driven by the availability of sunlight and nutrients, while R was regulated by water temperature and organic loading (Yvon-Durocher et al., 2010; Yang et al., 2019; Wang et al., 2021). However, current discussions on whether lakes are oversaturated have put forward to various hypotheses. For example, Weyhenmeyer (2008) et al. proposed that if the aquatic R of TOC is the main factor for predicting pCO2 supersaturation along aquatic conduits, the observed increase in dissolved organic carbon (DOC) in many old/new rivers of northern latitudes may lead to an increase in CO2 outflow. The other scholars speculated that if a large part of aquatic pCO2 can be related to terrestrial R transferring to aquatic conduits through groundwater input, the conclusion that TOC is the main causal predictor of CO2 supersaturation in boreal lakes will need to be reconsidered (Algesten et al., 2004; Sobek et al., 2005). Comprehensively, Humborg et al. (2010) has verified, in the Swedish watershed, CO2 supersaturation along aquatic conduits is limited by terrestrial/aquatic R and weathering. Therefore, the mechanisms causing over- or under-saturation in freshwater lakes are complicated, which needs to be studied from multiple carriers and perspectives.
Previous works showed that productive systems are more likely to be CO2 sinks (Marotta et al., 2010; Yang et al., 2019), while a higher nutrient could promote the biological activity of aquatic P and then leading to more CO2 absorption (Cole and Caraco, 2001). Based on the detection of Chla, TP, TN and TPC, the nutritional status index [i.e., TLI (∑)] of this urbanizing lake was 63.15 (Table 2, Supplementary Figure S2), suggesting that a variable relationships between pCO2 and N/P was found (Supplementary Table S2, Supplementary Methods S4; Li et al., 2018), which thus was defined as a middle-eutropher lake. The average DO and TP of this lake (including four anions; Supplementary Figure S6, Supplementary Table S3) were recorded as 8.43 (Supplementary Figure S3) and <0.01 mg L−1 (Supplementary Figure S2), respectively, and therefore being classified as class I abiding by the national standard (GB 3838-2002). For lakes with different nutrients, the diel CO2 changes are different. For example, the dynamic changes in CO2 in a typical tropical productive lake were highly dependent on biological metabolism during the diurnal cycle (Reis and Barbosa, 2014), while no significant diel changes in fCO2 were found in oligotrophic lakes (Morin et al., 2018). In addition, diurnal changes in CO2 and related parameters in lakes with different nutrients change seasonally (e.g., Supplementary Figure S2–S4). In this study, the daily variations in pCO2 on April 5 and Sept. 5 2020, were opposite each other (Figure 3). Similarly, during the peak period of Chla, the diurnal changes in August and September were obvious, whereas no obvious temporal changes occurred in the other months (Shao et al., 2015).
Besides, changes in lake CO2 are also closely related to temperature and pH. In this study, a weak negative correlation between water temperature and daily pCO2 was observed (Table 2), indicating an increase in gas solubility and a decrease in CO2 absorption at low temperatures. The diurnal changes in pCO2 affected by water temperature were therefore usually smaller (R2 = −0.030 for pCO2; R2 = −0.043 for fCO2; Table 3, Supplementary Table S3) than the biologically induced changes (Nimick et al., 2011; Morales-Pineda et al., 2014). Moreover, the lake water temperature during the daytime was almost constant in this study (Figure 5C); further, the average daily twater was negatively correlated with daily pCO2 (Table 3), indicating that daily twater influenced on the CO2 level in the late afternoon. Therefore, we speculate that there may be a temperature threshold in subtrophic water. When the twater exceeds this threshold, pCO2 might be extremely low in the late afternoon due to active P. Accordingly, there is a relationship between CO2 and pH in lakes, as shown in this study (R2 = −0.823** for pCO2, R2 = −0.825** for fCO2; Supplementary Table S1), suggesting that the critical threshold for the pH value shifts from the CO2 absorption capacity to the emission source (Wilson-McNeal et al., 2020)). In river systems, the river represents a CO2 sink when the pH value exceeds 8.59 but acts as a CO2 source when the pH value is less than 8.59 (Li et al., 2020a, Li et al., 2020b). Therefore, we speculate that the increases in EC and nutrient levels in the lake system are closely related to urban development, and that anthropogenic emissions may lower the pH value (see Supplementary Table S1), leading to an increase in aqueous pCO2 (Richey et al., 2002; Ran et al., 2015; Liu et al., 2017).
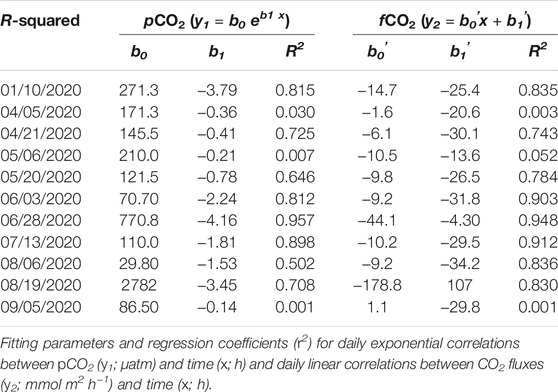
TABLE 3. Daily correlation between pCO2 and fCO2 and time in Qinglonghu Lake (n = 4).
Uncertainties in CO2 Evasion Evaluation Owing to Daily pCO2 Fluctuations
Owing to the variations of pCO2, the interaction of CO2 source-sink within a day is driven by many factors, especially daylight and thus the biological processes in the lake (Cole and Caraco, 1998; Maberly et al., 2013; León-Palmero et al., 2020). Findings of our study indicated, due to daily fluctuations, considerable uncertainties in the current estimations of CO2 evasion from regional and global lake systems. On the one hand, most current estimates of annual CO2 evasion from freshwater lakes are mainly calculated using data collected from measurements with poor temporal coverage (i.e., weekly or monthly) (Cole et al., 2007) or low-frequency time series (Peter et al., 2014). For daily change, as in our study, the time frame (from 7:00 to 17:00 CST) for observing a decrease in pCO2 is actually short, the variable level therefore may cause an underestimation or overestimation for the daily CO2 based on one-time measurement. On the other hand, the observations were made at 3 h intervals from morning to afternoon (Figures 3, 4), with no measurements conducted during the nighttime. The CO2 evasion during the nighttime could be stronger than that during the daytime, which may be due to darkness favors R over P (Xu et al., 2019), or to physical changes in the water column (Wang et al., 2021). For instance, Reis and Barbosa (2014) observed a tropical productive lake in Brazil for two consecutive days showing, the average pCO2 (565 matm from 21:00 to 5:00 BRT) during the nighttime was higher than that during the daytime (436.1 matm from 9:00 to 17:00 BRT). In agreement, based on direct measurements in the Ross Barnett reservoir, fCO2 during the nighttime (0.39 μmol m−2 s−1) was ca. 70% greater than that during the daytime (0.23 μmol m−2 s−1 from 08:00 to 20:00 CST) over the 1-year study period (Liu et al., 2016). In addition, Gu et al. (2011) presented an investigation of limnological data collected from 1987 to 2006, suggesting the average pCO2 (i.e., 224 µatm) at nighttime was slightly higher than that during the daytime but undersaturation with reference to atmospheric pCO2. A study conducted in Lake Lochaber in eastern Nova Scotia, Canada, showed that 65–95% of total CO2 emissions in a day actually occur at night, which is 21:00 to 7:00 Atlantic Daylight Time (Spafford and Risk, 2018).
The uncertainties among studies in CO2 estimates may also be partly due to differences in geographic region (Schelske, 2006). In a study of carbon dynamics in two Mediterranean reservoirs in southern Spain, by relying on different models, Morales-Pineda et al. (2014) found that the average CO2 emissions ranged from 8.0 to 12.5 mmol C m−2 d−1 in Guadalcacín but ranged from 33.0 to 50.0 mmol C m−2 d−1 in Bornos. Further, on a daily scale, variability in pCO2 was closely related to the diurnal cycle of metabolic activity, with a minimum pCO2 value between 15:00 and 18:00 Central European Time and a maximum value between 22:00 and 06:00 CET. Reis and Barbosa (2014) also observed a significant difference in CO2 flux between daytime and nighttime in Lake Carioca, Brazil. Interestingly, CO2 outgassing was lower at 1:00 Brasilia Time than at other times of day, with a maximum of 2.4 mmol C m−2 d−1 and an average of 0.9 mmol C m−2 d−1. Watras et al. (2015) focused on two small seepage lakes in northern Wisconsin, suggesting that the diel cycle is controlled by biological activities, which mediate the production and destruction of organic matter based on daily CO2 dynamics (0.32 mg C m−2 d−1). From October 2011 to September 2013, a strong diurnal change in fCO2 from −0.45 to 0.98 g C m−2 d−1 in western Lake Erie in North America was found by Shao et al. (2015). However, no clear diurnal variation was observed in a small boreal lake (i.e., Lake Kuivajärvi) in Finland, although the average diel fCO2 was 0.7 μmol C m−2 s−1 (Mammarella et al., 2015), while the clear diurnal cycles of fCO2 in three lakes with different characteristics in southwestern Sweden (Natchimuthu et al., 2017).
Furthermore, previous studies have also proved that C derived from terrestrial systems could cause CO2 oversaturation in lakes, where DOC serve as a direct substrate for CO2 production or as a proxy for inorganic C loading (Roehm et al., 2009; Humborg et al., 2010). In this regard, the relationship between pCO2 and DOC could be a key feature for explaining the regional differences in lake pCO2 regulation (Lapierre and del Giorgio, 2012). A strong positive correlation in pCO2-DOC indicates that in-situ oxidation of terrestrial organic C plays a leading role in the excessive CO2 production in lakes, or the significant contribution of DOC related driving factors to pCO2 effects (Larsen et al., 2011). On the contrary, a weak/negative correlation would indicate either a strong contribution from other drivers that are not related to DOC, or drivers that are related to DOC but have an opposite effect on pCO2, respectively. Lapierre and del Giorgio (2012) found that the proxy for lake metabolic balance and terrestrial C exports accounted for a large part of these patterns in the lake pCO2-DOC relationship, indicating that the key driver of the difference in pCO2-DOC is the integration of the average regional TP: DOC ratio and altitude. Based on the findings from these and our studies, we argue that great uncertainties may exist in current regional and global estimations of CO2 evasion from lake systems.
Conclusion
In the current work, we systematically investigated the daily fluctuations in pCO2 and related parameters at 3 h intervals from morning to afternoon from Jan. to Sept., 2020 in a subtropical urbanizing lake. Several interesting findings have resulted from the work. From early mornings to late afternoons, strongly decreasing pCO2 and fCO2 trends were observed except on 2 days on which unusual rainfall/wind occurred. The daily pCO2 was highest at 7:00 CST (1,061.3 µatm on August 19) and lowest at 17:00 CST (12.6 µatm on August 6), while the average pCO2 was highest at 7:00 CST (204.9 ± 295.7 µatm) and lowest at 17:00 CST (93.5 ± 105.5 µatm). As a result, the highest daily fCO2 occurred in the morning hours (−19.3 ± 27.5 and −24.8 ± 20.7 mmol m−2 h−1 at 7:00 and 10:00 CST, respectively) and in the afternoon hours (−29.2 ± 9.1 and −30.4 ± 10.7 mmol m−2 h−1 at 14:00 and 17:00 CST, respectively). These findings revealed that the daily CO2 exchange in the studied subtropical urbanizing lake reflects the dynamics of ecosystem metabolism and remineralization reactions. Accordingly, we speculate that nighttime pCO2/fCO2 may be much higher than daytime pCO2/fCO2, which would indicate that the entire lake is undersaturated and a carbon sink during daylight hours. In addition, there was a strong negative correlation between pCO2 and each of pH, twater, and DO but a positive correlation between pCO2 and each of TOC and Chla, suggesting that uncertainties in the estimation of fCO2 at regional/global scales owing to some factors such as geographical region and temporal coverage. Future work needs to constrain these critical factors and overall uncertainty and determine the levels of accuracy needed to enable robust CO2 estimations at different scales.
Data Availability Statement
The original contributions presented in the study are included in the article/Supplementary Material, further inquiries can be directed to the corresponding authors.
Author Contributions
RY: Conceptualization, Methodology, Software, Formal analysis, Investigation, Data Curation, Writing-Original Draft, Visualization. YC: Software, Formal analysis, Investigation. JD: Project administration, Funding acquisition. XP: Conceptualization, Writing-Review and Editing, Funding acquisition. JL: Investigation. ZZ: Investigation. HS: Conceptualization, Methodology, Resources, Data Curation, Writing-Review and Editing, Supervision, Project administration, Funding acquisition.
Funding
This work was partially supported by the Specialized Fund for the Post-Disaster Reconstruction and Heritage Protection in Sichuan (grant No., 5132202019000128), the Technology Innovation R & D Project in Chengdu (grant No., 2019-YFYF-00040-SN), the Landscape and Recreation Research Center Project in Sichuan (grant No., JGYQ2019025), the Science and Technology Innovation Seedling Project in Sichuan (grant No., 2020118) and the Innovation and Entrepreneurship Training Program for College Students at Sichuan Agricultural University and in Sichuan Province (grant Nos., 202010626104, S202010626104).
Conflict of Interest
The authors declare that the research was conducted in the absence of any commercial or financial relationships that could be construed as a potential conflict of interest.
Publisher’s Note
All claims expressed in this article are solely those of the authors and do not necessarily represent those of their affiliated organizations, or those of the publisher, the editors, and the reviewers. Any product that may be evaluated in this article, or claim that may be made by its manufacturer, is not guaranteed or endorsed by the publisher.
Acknowledgments
The authors acknowledge the Sichuan Keshengxin Environmental Technology Co., Ltd., College of Environmental Sciences and Institute of Landscape Architecture at Sichuan Agricultural University in Chengdu, China, for assisting in the detection of partial water samples for this study. Sincere thanks also go to Drs. Li Li and Shiliang Liu; Mses. Jia Wei, Yuling Qiu, Kezhu Lu, Qianrui Liu, and Xiaoyang Ke; Messrs. Di Li, Ting Lei, Xingyu Zhu, Jianglin Yu, Lijuan Yang, and Hongyu Wu; and other research assistants for their outstanding laboratory and field assistance. The authors also thank Drs. Y. Jun Xu and Zhen Xu from Louisiana State University in Baton Rouge, United States, for their previous trial-design guidance; the Qinglonghu Lake Management Center for providing permission and transportation for the field trials; American Journal Experts (https://www.aje.com/#) for their language editing services for our draft manuscript; and the editors and two reviewers for their helpful comments and suggestions.
Supplementary Material
The Supplementary Material for this article can be found online at: https://www.frontiersin.org/articles/10.3389/feart.2021.805276/full#supplementary-material
References
Abril, G., Bouillon, S., Darchambeau, F., Teodoru, C. R., Marwick, T. R., Tamooh, F., et al. (2015). Technical Note: Large Overestimation of pCO2Calculated from pH and Alkalinity in Acidic, Organic-Rich Freshwaters. Biogeosciences 12, 67–78. doi:10.5194/bg-12-67-2015
Abril, G., Martinez, J.-M., Artigas, L. F., Moreira-Turcq, P., Benedetti, M. F., Vidal, L., et al. (2014). Amazon River Carbon Dioxide Outgassing Fuelled by Wetlands. Nature 505, 395–398. doi:10.1038/nature12797
Algesten, G., Sobek, S., Bergström, A.-K., Ågren, A., Tranvik, L. J., and Jansson, M. (2004). Role of Lakes for Organic Carbon Cycling in the Boreal Zone. Glob. Change Biol 10, 141–147. doi:10.1111/j.1365-2486.2003.00721.x
Alin, S. R., and Johnson, T. C. (2007). Carbon Cycling in Large Lakes of the World: A Synthesis of Production, Burial, and lake-atmosphere Exchange Estimates. Glob. Biogeochem. Cycles 21, a–n. doi:10.1029/2006GB002881
Bade, D. L., and Cole, J. J. (2006). Impact of Chemically Enhanced Diffusion on Dissolved Inorganic Carbon Stable Isotopes in a Fertilized lake. J. Geophys. Res. 111. doi:10.1029/2004JC002684
Bisutti, I., Hilke, I., and Raessler, M. (2004). Determination of Total Organic Carbon–An Overview of Current Methods. Trend. Anal. Chem. 23, 10–11. doi:10.1016/j.trac.2004.09.003
Butman, D., and Raymond, P. A. (2011). Significant Efflux of Carbon Dioxide from Streams and Rivers in the United States. Nat. Geosci 4, 839–842. doi:10.1038/ngeo1294
Cai, W.-J., and Wang, Y. (1998). The Chemistry, Fluxes, and Sources of Carbon Dioxide in the Estuarine Waters of the Satilla and Altamaha Rivers, Georgia. Limnol. Oceanogr. 43, 657–668. doi:10.4319/lo.1998.43.4.0657
Callbeck, C. M., Ehrenfels, B., Baumann, K. B. L., Wehrli, B., and Schubert, C. J. (2021). Anoxic Chlorophyll Maximum Enhances Local Organic Matter Remineralization and Nitrogen Loss in Lake Tanganyika. Nat. Commun. 12, 830. doi:10.1038/s41467-021-21115-5
Carignan, R., Planas, D., and Vis, C. (2000). Planktonic Production and Respiration in Oligotrophic Shield Lakes. Limnol. Oceanogr. 45, 189–199. doi:10.4319/lo.2000.45.1.0189
Chen, S., Hu, C., Cai, W.-J., and Yang, B. (2017). Estimating Surface pCO2 in the Northern Gulf of Mexico: Which Remote Sensing Model to Use. Continental Shelf Res. 151, 94–110. doi:10.1016/j.csr.2017.10.013
Chen, S., and Hu, C. (2019). Environmental Controls of Surface Water pCO2 in Different Coastal Environments: Observations from marine Buoys. Continental Shelf Res. 183, 73–86. doi:10.1016/j.csr.2019.06.007
Cole, J. J., and Caraco, N. F. (1998). Atmospheric Exchange of Carbon Dioxide in a Low-Wind Oligotrophic lake Measured by the Addition of SF6. Limnol. Oceanogr. 43, 647–656. doi:10.4319/lo.1998.43.4.0647
Cole, J. J., Caraco, N. F., Kling, G. W., and Kratz, T. K. (1994). Carbon Dioxide Supersaturation in the Surface Waters of Lakes. Science 265, 1568–1570. doi:10.1126/science.265.5178.1568
Cole, J. J., Cole, J. J., Caraco, N. F., and Caraco, N. F. (2001). Carbon in Catchments: Connecting Terrestrial Carbon Losses with Aquatic Metabolism. Mar. Freshw. Res. 52, 101–110. doi:10.1071/mf00084
Cole, J. J., Prairie, Y. T., Caraco, N. F., McDowell, W. H., Tranvik, L. J., Striegl, R. G., et al. (2007). Plumbing the Global Carbon Cycle: Integrating Inland Waters into the Terrestrial Carbon Budget. Ecosystems 10, 172–185. doi:10.1007/s10021-006-9013-8
Crawford, J. T., Loken, L. C., Stanley, E. H., Stets, E. G., Dornblaser, M. M., and Striegl, R. G. (2016). Basin Scale Controls on CO2 and CH4emissions from the Upper Mississippi River. Geophys. Res. Lett. 43, 1973–1979. doi:10.1002/2015gl067599
Crawford, J. T., Striegl, R. G., Wickland, K. P., Dornblaser, M. M., and Stanley, E. H. (2013). Emissions of Carbon Dioxide and Methane from a Headwater Stream Network of interior Alaska. J. Geophys. Res. Biogeosci. 118, 482–494. doi:10.1002/jgrg.20034
Dickinson, G. H., Ivanina, A. V., Matoo, O. B., Pörtner, H. O., Lannig, G., Bock, C., et al. (2012). Interactive Effects of Salinity and Elevated CO2 Levels on Juvenile Eastern Oysters, Crassostrea virginica. J. Exp. Biol. 215, 29–43. doi:10.1242/jeb.061481
Domysheva, V. M., Panchenko, M. V., Pestunov, D. A., and Sakirko, M. V. (2007). Influence of Atmospheric Precipitation on the CO2 Exchange with the Water Surface of Lake Baikal. Dokl. Earth Sci. 415, 740–743. doi:10.1134/s1028334x07050182
Gu, B., Schelske, C. L., and Coveney, M. F. (2011). Low Carbon Dioxide Partial Pressure in a Productive Subtropical lake. Aquat. Sci. 73, 317–330. doi:10.1007/s00027-010-0179-y
Guérin, F., Abril, G., Serça, D., Delon, C., Richard, S., Delmas, R., et al. (2007). Gas Transfer Velocities of CO2 and CH4 in a Tropical Reservoir and its River Downstream. J. Mar. Sys. 66, 161–172.
Hastie, A., Lauerwald, R., Weyhenmeyer, G., Sobek, S., Verpoorter, C., and Regnier, P. (2018). CO2 Evasion from Boreal Lakes: Revised Estimate, Drivers of Spatial Variability, and Future Projections. Glob. Change Biol. 24, 711–728. doi:10.1111/gcb.13902
Holgerson, M. A. (2015). Drivers of Carbon Dioxide and Methane Supersaturation in Small, Temporary Ponds. Biogeochemistry 124, 305–318. doi:10.1007/s10533-015-0099-y
Holgerson, M. A., and Raymond, P. A. (2016). Large Contribution to Inland Water CO2 and CH4 Emissions from Very Small Ponds. Nat. Geosci 9, 222–226. doi:10.1038/ngeo2654
Hope, D., Palmer, S. M., Billett, M. F., and Dawson, J. J. C. (2004). Variations in Dissolved CO2 and CH4 in a First-Order Stream and Catchment: an Investigation of Soil-Stream Linkages. Hydrol. Process. 18, 3255–3275. doi:10.1002/hyp.5657
Humborg, C., Mörth, C.-M., Sundbom, M., Borg, H., Blenckner, T., Giesler, R., et al. (2010). CO2 Supersaturation along the Aquatic Conduit in Swedish Watersheds as Constrained by Terrestrial Respiration, Aquatic Respiration and Weathering. Glob. Change Biol 16, 1966–1978. doi:10.1111/j.1365-2486.2009.02092.x
IPCC (Intergovernmental Panel on Climate Change) (2014). “Climate Change 2014: Synthesis Report,” in Contribution of Working Groups I, II and III to the Fifth Assessment Report of the Intergovernmental Panel on Climate Change. Editors R. K. Pachauri, and L. A. Meyer, 1–151.
Jähne, B., Heinz, G., and Dietrich, W. (1987). Measurement of the Diffusion Coefficients of Sparingly Soluble Gases in Water. J. Geophys. Res. 92, 10767–10776. doi:10.1029/jc092ic10p10767
Kankaala, P., Huotari, J., Tulonen, T., and Ojala, A. (2013). Lake-size Dependent Physical Forcing Drives Carbon Dioxide and Methane Effluxes from Lakes in a Boreal Landscape. Limnol. Oceanogr. 58, 1915–1930. doi:10.4319/lo.2013.58.6.1915
Karim, A., Dubois, K., and Veizer, J. (2011). Carbon and Oxygen Dynamics in the Laurentian Great Lakes: Implications for the CO2 Flux from Terrestrial Aquatic Systems to the Atmosphere. Chem. Geology. 281, 133–141. doi:10.1016/j.chemgeo.2010.12.006
Katul, G., and Liu, H. (2017). Multiple Mechanisms Generate a Universal Scaling with Dissipation for the Air‐water Gas Transfer Velocity. Geophys. Res. Lett. 44, 1892–1898. doi:10.1002/2016gl072256
Keller, P. S., Catalán, N., von Schiller, D., Grossart, H.-P., Koschorreck, M., Obrador, B., et al. (2020). Global CO2 Emissions from Dry Inland Waters Share Common Drivers across Ecosystems. Nat. Commun. 11, 2126. doi:10.1038/s41467-020-15929-y
Kortelainen, P. (1993). Content of Total Organic Carbon in Finnish Lakes and its Relationship to Catchment Characteristics. Can. J. Fish. Aquat. Sci. 50, 1477–1483. doi:10.1139/f93-168
Kosten, S., Roland, F., Da Motta Marques, D. M. L., Van Nes, E. H., Mazzeo, N., Sternberg, L. d. S. L., et al. (2010). Climate-dependent CO2 emissions from Lakes. Glob. Biogeochem. Cycles 24, a–n. doi:10.1029/2009GB003618
Lapierre, J.-F., and del Giorgio, P. A. (2012). Geographical and Environmental Drivers of Regional Differences in the lake pCO2 versus DOC Relationship across Northern Landscapes. J. Geophys. Res. 117, a–n. doi:10.1029/2012JG001945
Larsen, S., Andersen, T., and Hessen, D. O. (2011). The pCO2 in Boreal Lakes: Organic Carbon as a Universal Predictor. Glob. Biogeochem. Cycles 25, a–n. doi:10.1029/2010GB003864
Le Quéré, C., Andrew, R. M., Friedlingstein, P., Sitch, S., Pongratz, J., Manning, A. C., et al. (2018). Global Carbon Budget 2017. Earth Syst. Sci. Data 10, 405–448. doi:10.5194/essd-10-405-2018
León-Palmero, E., Morales-Baquero, R., and Reche, I. (2020). Greenhouse Gas Fluxes from Reservoirs Determined by Watershed Lithology, Morphometry, and Anthropogenic Pressure. Environ. Res. Lett. 15, 044012. doi:10.1088/1748-9326/ab7467
Li, Q., Guo, X., Zhai, W., Xu, Y., and Dai, M. (2020a). Partial Pressure of CO2 and Air-Sea CO2 Fluxes in the South China Sea: Synthesis of an 18-year Dataset. Prog. Oceanography 182, 102272. doi:10.1016/j.pocean.2020.102272
Li, S., Lu, X. X., and Bush, R. T. (2013). CO2 Partial Pressure and CO2 Emission in the Lower Mekong River. J. Hydrol. 504, 40–56. doi:10.1016/j.jhydrol.2013.09.024
Li, S., Lu, X. X., He, M., Zhou, Y., Li, L., and Ziegler, A. D. (2012). Daily CO2 Partial Pressure and CO2 Outgassing in the Upper Yangtze River basin: A Case Study of the Longchuan River, China. J. Hydrol. 466-467, 141–150. doi:10.1016/j.jhydrol.2012.08.011
Li, S., Luo, J., Wu, D., and Jun Xu, Y. (2020b). Carbon and Nutrients as Indictors of Daily Fluctuations of pCO2 and CO2 Flux in a River Draining a Rapidly Urbanizing Area. Ecol. Indicators 109, 105821. doi:10.1016/j.ecolind.2019.105821
Li, S., Ni, M., Mao, R., and Bush, R. T. (2018). Riverine CO2 Supersaturation and Outgassing in a Subtropical Monsoonal Mountainous Area (Three Gorges Reservoir Region) of China. J. Hydrol. 558, 460–469. doi:10.1016/j.jhydrol.2018.01.057
Li, W., and Cai, Y. M. (2019). Integration of Nature, Ecology, and Humanities: the Phase I Project of Qinglonghu Wetland in Shiling, Chengdu. Sichuan Archit 39, 53–59. doi:10.3969/j.issn.1007-8983.2019.06.020
Li, Y., Yang, X., Han, P., Xue, L., and Zhang, L. (2017). Controlling Mechanisms of Surface Partial Pressure of CO2 in Jiaozhou Bay during Summer and the Influence of Heavy Rain. J. Mar. Syst. 173, 49–59. doi:10.1016/j.jmarsys.2017.04.006
Liu, H., Zhang, Q., Katul, G. G., Cole, J. J., Chapin, F. S., and MacIntyre, S. (2016). Large CO2 Effluxes at Night and during Synoptic Weather Events Significantly Contribute to CO 2 Emissions from a Reservoir. Environ. Res. Lett. 11, 064001. doi:10.1088/1748-9326/11/6/064001
Liu, S., Lu, X. X., Xia, X., Yang, X., and Ran, L. (2017). Hydrological and Geomorphological Control on CO2 Outgassing from Low-Gradient Large Rivers: An Example of the Yangtze River System. J. Hydrol. 550, 26–41. doi:10.1016/j.jhydrol.2017.04.044
Luo, J., Li, S., Ni, M., and Zhang, J. (2019). Large Spatiotemporal Shifts of CO2 Partial Pressure and CO2 Degassing in a Monsoonal Headwater Stream. J. Hydrol. 579, 124135. doi:10.1016/j.jhydrol.2019.124135
Maberly, S. C., Barker, P. A., Stott, A. W., and De Ville, M. M. (2013). Catchment Productivity Controls CO2 Emissions from Lakes. Nat. Clim. Change 3, 391–394. doi:10.1038/nclimate1748
Maier, M.-S., Teodoru, C. R., and Wehrli, B. (2021). Spatio-temporal Variations in Lateral and Atmospheric Carbon Fluxes from the Danube Delta. Biogeosciences 18, 1417–1437. doi:10.5194/bg-18-1417-2021
Mammarella, I., Nordbo, A., Rannik, Ü., Haapanala, S., Levula, J., Laakso, H., et al. (2015). Carbon Dioxide and Energy Fluxes over a Small Boreal lake in Southern Finland. J. Geophys. Res. Biogeosci. 120, 1296–1314. doi:10.1002/2014jg002873
Marcé, R., Obrador, B., Morguí, J.-A., Lluís Riera, J., López, P., and Armengol, J. (2015). Carbonate Weathering as a Driver of CO2 Supersaturation in Lakes. Nat. Geosci 8, 107–111. doi:10.1038/ngeo2341
Marotta, H., Duarte, C. M., Meirelles-Pereira, F., Bento, L., Esteves, F. A., and Enrich-Prast, A. (2010). Long-Term CO2 Variability in Two Shallow Tropical Lakes Experiencing Episodic Eutrophication and Acidification Events. Ecosystems 13, 382–392. doi:10.1007/s10021-010-9325-6
Marotta, H., Duarte, C. M., Sobek, S., and Enrich-Prast, A. (2009). Large CO2 disequilibria in Tropical Lakes. Glob. Biogeochem. Cycles 23, a–n. doi:10.1029/2008GB003434
Mcdonald, C. P., Stets, E. G., Striegl, R. G., and Butman, D. (2013). Inorganic Carbon Loading as a Primary Driver of Dissolved Carbon Dioxide Concentrations in the Lakes and Reservoirs of the Contiguous United States. Glob. Biogeochem. Cycles 27, 285–295. doi:10.1002/gbc.20032
Morales-Pineda, M., Cózar, A., Laiz, I., Úbeda, B., and Gálvez, J. Á. (2014). Daily, Biweekly, and Seasonal Temporal Scales of pCO2 variability in Two Stratified Mediterranean Reservoirs. J. Geophys. Res. Biogeosci. 119, 509–520. doi:10.1002/2013jg002317
Morin, T. H., Rey-Sánchez, A. C., Vogel, C. S., Matheny, A. M., Kenny, W. T., and Bohrer, G. (2018). Carbon Dioxide Emissions from an Oligotrophic Temperate lake: An Eddy Covariance Approach. Ecol. Eng. 114, 25–33. doi:10.1016/j.ecoleng.2017.05.005
Natchimuthu, S., Sundgren, I., Gålfalk, M., Klemedtsson, L., and Bastviken, D. (2017). Spatiotemporal Variability of lake pCO2 and CO2 Fluxes in a Hemiboreal Catchment. J. Geophys. Res. Biogeosci. 122, 30–49. doi:10.1002/2016jg003449
Ni, M., Ge, Q., Li, S., Wang, Z., and Wu, Y. (2021). Trophic State index Linked to Partial Pressure of Aquatic Carbon Dioxide in a Typical Karst Plateau lake. Ecol. Indicators 120, 106912. doi:10.1016/j.ecolind.2020.106912
Nimick, D. A., Gammons, C. H., and Parker, S. R. (2011). Diel Biogeochemical Processes and Their Effect on the Aqueous Chemistry of Streams: a Review. Chem. Geology. 283, 3–17. doi:10.1016/j.chemgeo.2010.08.017
Pardue, J. H., Delaune, R. D., and Patrick, W. H. (1988). Effect of Sediment pH and Oxidation-Reduction Potential on PCB Mineralization. Water Air Soil Pollut. 37, 439–447. doi:10.1007/bf00192953
Peng, X., Wang, B., Liu, C., Liu, X., and Wang, F. (2012). Diurnal Variations of pCO2 in Relation to Environmental Factors in the cascade Reservoirs along the Wujiang River, China. Chin. J. Geochem. 31, 41–47. doi:10.1007/s11631-012-0547-5
Peter, H., Singer, G. A., Preiler, C., Chifflard, P., Steniczka, G., and Battin, T. J. (2014). Scales and Drivers of temporal pCO2 dynamics in an Alpine Stream. J. Geophys. Res. Biogeosci. 119, 1078–1091. doi:10.1002/2013jg002552
Podgrajsek, E., Sahlée, E., and Rutgersson, A. (2015). Diel Cycle of lake-air CO2flux from a Shallow lake and the Impact of Waterside Convection on the Transfer Velocity. J. Geophys. Res. Biogeosci. 120, 29–38. doi:10.1002/2014jg002781
Ran, L., Lu, X. X., Yang, H., Li, L., Yu, R., Sun, H., et al. (2015). CO2outgassing from the Yellow River Network and its Implications for Riverine Carbon Cycle. J. Geophys. Res. Biogeosci. 120, 1334–1347. doi:10.1002/2015jg002982
Raymond, P. A., Hartmann, J., Lauerwald, R., Sobek, S., McDonald, C., Hoover, M., et al. (2013). Global Carbon Dioxide Emissions from Inland Waters. Nature 503, 355–359. doi:10.1038/nature12760
Reis, P. C., and Barbosa, F. A. (2014). Diurnal Sampling Reveals Significant Variation in CO2 Emission from a Tropical Productive lake. Braz. J. Biol. 74, S113–S119. doi:10.1590/1519-6984.01713
Richey, J. E., Melack, J. M., Aufdenkampe, A. K., Ballester, V. M., and Hess, L. L. (2002). Outgassing from Amazonian Rivers and Wetlands as a Large Tropical Source of Atmospheric CO2. Nature 416, 617–620. doi:10.1038/416617a
Roehm, C. L., Prairie, Y. T., and del Giorgio, P. A. (2009). The pCO2 dynamics in Lakes in the Boreal Region of Northern Québec, Canada. Glob. Biogeochem. Cycles 23, a–n. doi:10.1029/2008GB003297
Sabine, C. L., Feely, R. A., Gruber, N., Key, R. M., Lee, K., Bullister, J. L., et al. (2004). The Oceanic Sink for Anthropogenic CO2. Science 305, 367–371. doi:10.1126/science.1097403
Schelske, C. L. (2006). Comment on the Origin of the "fluid Mud Layer" in Lake Apopka, Florida. Limnol. Oceanogr. 51, 2472–2480. doi:10.4319/lo.2006.51.5.2472
Shao, C., Chen, J., Stepien, C. A., Chu, H., Ouyang, Z., Bridgeman, T. B., et al. (2015). Diurnal to Annual Changes in Latent, Sensible Heat, and CO2 Fluxes over a Laurentian Great Lake: A Case Study in Western Lake Erie. J. Geophys. Res. Biogeosci. 120, 1587–1604. doi:10.1002/2015jg003025
Sobek, S., Algesten, G., Bergström, A.-K., Jansson, M., and Tranvik, L. J. (2003). The Catchment and Climate Regulation of pCO2 in Boreal Lakes. Glob. Change Biol 9, 630–641. doi:10.1046/j.1365-2486.2003.00619.x
Sobek, S., Tranvik, L. J., and Cole, J. J. (2005). Temperature independence of Carbon Dioxide Supersaturation in Global Lakes. Glob. Biogeochem. Cycles 19, a–n. doi:10.1029/2004GB002264
Spafford, L., and Risk, D. (2018). Spatiotemporal Variability in Lake-Atmosphere Net CO2 Exchange in the Littoral Zone of an Oligotrophic Lake. J. Geophys. Res. Biogeosci. 123, 1260–1276. doi:10.1002/2017jg004115
Stets, E. G., Striegl, R. G., Aiken, G. R., Rosenberry, D. O., and Winter, T. C. (2009). Hydrologic Support of Carbon Dioxide Flux Revealed by Whole-lake Carbon Budgets. J. Geophys. Res. 114, G01008. doi:10.1029/2008JG000783
Telmer, K., and Veizer, J. (1999). Carbon Fluxes, pCO2 and Substrate Weathering in a Large Northern River basin, Canada: Carbon Isotope Perspectives. Chem. Geology. 159, 61–86. doi:10.1016/s0009-2541(99)00034-0
The National Environmental Protection Agency (NEPA), The Editorial Board of Water and Wastewater Monitoring/Analysis Methods (EB) (2002). The Monitoring and Analysis Methods of Water and Wastewater. Fourth Edition. Beijing: China Environmental Science Press.
Tonetta, D., Fontes, M. L. S., and Petrucio, M. M. (2014). Determining the High Variability of pCO2 and pO2 in the Littoral Zone of a Subtropical Coastal lake. Acta Limnol. Bras. 26, 288–295. doi:10.1590/s2179-975x2014000300008
Tranvik, L. J., Downing, J. A., Cotner, J. B., Loiselle, S. A., Striegl, R. G., Ballatore, T. J., et al. (2009). Lakes and Reservoirs as Regulators of Carbon Cycling and Climate. Limnol. Oceanogr. 54, 2298–2314. doi:10.4319/lo.2009.54.6_part_2.2298
Vachon, D., and Prairie, Y. T. (2013). The Ecosystem Size and Shape Dependence of Gas Transfer Velocity versus Wind Speed Relationships in Lakes. Can. J. Fish. Aquat. Sci. 70, 1757–1764. doi:10.1139/cjfas-2013-0241
Varol, M., and Li, S. (2017). Biotic and Abiotic Controls on CO2 Partial Pressure and CO2 Emission in the Tigris River, Turkey. Chem. Geology. 449, 182–193. doi:10.1016/j.chemgeo.2016.12.003
Wang, F., Wang, B., Liu, C.-Q., Wang, Y., Guan, J., Liu, X., et al. (2011). Carbon Dioxide Emission from Surface Water in cascade Reservoirs-River System on the Maotiao River, Southwest of China. Atmos. Environ. 45, 3827–3834. doi:10.1016/j.atmosenv.2011.04.014
Wang, Y., Qi, D., Wu, Y., Gao, Z., Sun, H., Lin, H., et al. (2021). Biological and Physical Controls of pCO2 and Air-Sea CO2 Fluxes in the Austral Summer of 2015 in Prydz Bay, East Antarctica. Mar. Chem. 228, 103897. doi:10.1016/j.marchem.2020.103897
Wanninkhof, R. (1992). Relationship between Wind Speed and Gas Exchange over the Ocean. J. Geophys. Res. 97, 7373–7382. doi:10.1029/92jc00188
Watras, C. J., Morrison, K. A., Crawford, J. T., McDonald, C. P., Oliver, S. K., and Hanson, P. C. (2015). Diel Cycles in the Fluorescence of Dissolved Organic Matter in Dystrophic Wisconsin Seepage Lakes: Implications for Carbon Turnover. Limnol. Oceanogr. 60, 482–496. doi:10.1002/lno.10026
Weiss, R. F. (1970). The Solubility of Nitrogen, Oxygen and Argon in Water and Seawater. Deep Sea Res. Oceanographic Abstr. 17, 721–735. doi:10.1016/0011-7471(70)90037-9
Wen, Z., Song, K., Shang, Y., Fang, C., Li, L., Lv, L., et al. (2017). Carbon Dioxide Emissions from Lakes and Reservoirs of China: A Regional Estimate Based on the Calculated pCO2. Atmos. Environ. 170, 71–81. doi:10.1016/j.atmosenv.2017.09.032
Weyhenmeyer, G. A. (2008). Water Chemical Changes along a Latitudinal Gradient in Relation to Climate and Atmospheric Deposition. Climatic Change 88, 199–208. doi:10.1007/s10584-007-9331-7
Wilson-McNeal, A., Hird, C., Hobbs, C., Nielson, C., Smith, K. E., Wilson, R. W., et al. (2020). Fluctuating Seawater pCO2/pH Induces Opposing Interactions with Copper Toxicity for Two Intertidal Invertebrates. Sci. Total Environ. 748, 141370. doi:10.1016/j.scitotenv.2020.141370
Worrall, F., Burt, T., and Adamson, J. (2005). Fluxes of Dissolved Carbon Dioxide and Inorganic Carbon from an upland Peat Catchment: Implications for Soil Respiration. Biogeochemistry 73, 515–539. doi:10.1007/s10533-004-1717-2
Xiao, Q., Duan, H., Qi, T., Hu, Z., Liu, S., Zhang, M., et al. (2020). Environmental Investments Decreased Partial Pressure of CO2 in a Small Eutrophic Urban lake: Evidence from Long-Term Measurements. Environ. Pollut. 263, 114433. doi:10.1016/j.envpol.2020.114433
Xu, Y. J., Xu, Z., and Yang, R. (2019). Rapid Daily Change in Surface Water pCO2 and CO2 Evasion: A Case Study in a Subtropical Eutrophic lake in Southern USA. J. Hydrol. 570, 486–494. doi:10.1016/j.jhydrol.2019.01.016
Xu, Z., and Xu, Y. J. (2015). Determination of Trophic State Changes with Diel Dissolved Oxygen: a Case Study in a Shallow lake. Water Environ. Res. 87, 1970–1979. doi:10.2175/106143015x14362865226716
Yan, H., Yu, K., Shi, Q., Lin, Z., Zhao, M., Tao, S., et al. (2018). Air-sea CO2 Fluxes and Spatial Distribution of Seawater pCO2 in Yongle Atoll, Northern-central South China Sea. Continental Shelf Res. 165, 71–77. doi:10.1016/j.csr.2018.06.008
Yang, R., Xu, Z., Liu, S., and Xu, Y. J. (2019). Daily pCO2 and CO2 Flux Variations in a Subtropical Mesotrophic Shallow lake. Water Res. 153, 29–38. doi:10.1016/j.watres.2019.01.012
Yao, G., Gao, Q., Wang, Z., Huang, X., He, T., Zhang, Y., et al. (2007). Dynamics of CO2 Partial Pressure and CO2 Outgassing in the Lower Reaches of the Xijiang River, a Subtropical Monsoon River in China. Sci. Total Environ. 376, 255–266. doi:10.1016/j.scitotenv.2007.01.080
Yoon, T. K., Jin, H., Begum, M. S., Kang, N., and Park, J.-H. (2017). CO2 Outgassing from an Urbanized River System Fueled by Wastewater Treatment Plant Effluents. Environ. Sci. Technol. 51, 10459–10467. doi:10.1021/acs.est.7b02344
Keywords: CO2 evasion, CO2 fluxes, environmental factors, middle-eutropher, pCO2, subtropical urbanizing lake
Citation: Yang R, Chen Y, Du J, Pei X, Li J, Zou Z and Song H (2022) Daily Variations in pCO2 and fCO2 in a Subtropical Urbanizing Lake. Front. Earth Sci. 9:805276. doi: 10.3389/feart.2021.805276
Received: 30 October 2021; Accepted: 20 December 2021;
Published: 18 January 2022.
Edited by:
Xiaofei Yu, Northeast Normal University, ChinaReviewed by:
Bernhard Wehrli, ETH Zürich, SwitzerlandAndrea Pain, University of Maryland Center for Environmental Science (UMCES), United States
Copyright © 2022 Yang, Chen, Du, Pei, Li, Zou and Song. This is an open-access article distributed under the terms of the Creative Commons Attribution License (CC BY). The use, distribution or reproduction in other forums is permitted, provided the original author(s) and the copyright owner(s) are credited and that the original publication in this journal is cited, in accordance with accepted academic practice. No use, distribution or reproduction is permitted which does not comply with these terms.
*Correspondence: Xiangjun Pei, UGVpeGowMTE5QHRvbS5jb20=; Huixing Song, U29uZ2h1aXhpbmdAc2ljYXUuZWR1LmNu