 Qiankuan Wang
 Shili Qiu
 Yao Cheng2
94% of researchers rate our articles as excellent or good
Learn more about the work of our research integrity team to safeguard the quality of each article we publish.
Find out more
ORIGINAL RESEARCH article
Front. Earth Sci. , 13 December 2021
Sec. Geohazards and Georisks
Volume 9 - 2021 | https://doi.org/10.3389/feart.2021.803522
This article is part of the Research Topic Applications of Geotechnical Mechanics in Underground Engineering View all 41 articles
In burst-prone deep underground engineering, seismic waves generated from a near-field ground motion event may play a critical role in causing localized rockburst damage. Accurate estimation of near-field ground motions around excavations is important for seismic hazard risk assessment and dynamic rock support design in underground engineering. During the excavation of an underground cavern, stress redistribution in the surrounding rock leads to the formation of damage zones, including the excavation damage zone (EDZ) and excavation fracture zone (EFZ). The poor properties of the rock in the damage zones cause the wave velocities of the rock mass to decrease and the dynamic wave interaction to change, thereby affecting the ground motions around the excavation. This paper studies the near-field ground motion behavior and reveals the control effect of the seismic wave velocity in the damage zones on the near-field ground motions by the aid of the finite fracturing source model (FFSSM). The research results provide a new knowledge of the influence of excavation disturbance on the ground motion distribution around the excavation, and provide new ideas for the seismic hazard risk assessment and prevention in underground engineering.
With the flourishing development of China’s economy, infrastructure construction under complex geological conditions has gradually increased, especially deep hydropower engineering and energy mining projects in the western region. The outstanding features of these engineering construction projects are the large burial depth, complex geological conditions, and high in situ stresses. As a result, rock mass seismic hazards induced by highly stressed environments, such as rockbursts, pressure bumping, and mine earthquakes, have become increasingly severe and greatly challenged project construction. Therefore, the accurate estimation of ground motions around excavations is important for seismic hazard risk assessment and dynamic rock support design in underground engineering.
During the excavation of deep underground engineering, due to the newly created stress state exceeding the rock mass strength, a low-damage excavation damage zone (EDZ) and a high-damage excavation fracture zone (EFZ) form in the surrounding rock (Li et al., 2016; Xue et al., 2017). The physical, mechanical and hydraulic properties of the rock mass in the EDZ and EFZ deteriorate, and many ruptures and microcracks form in the rock mass, which cause the wave velocities to decrease and the dynamic wave interactions to change, thereby affecting the ground motions around excavations (Backblom and Martin, 1999; Tsang et al., 2005; Ge, 2008; Chen et al., 2018; Jia et al., 2021). When studying ground motion behavior around excavation under dynamic loading conditions, the damage zone must be taken into consideration.
According to a series of field tests, in-situ tests, laboratory tests, analysis and research carried out in the Underground Research Laboratory in Canada, after the excavation of deep tunnels, when the stress redistribution meets certain conditions, damage zones form in the surrounding rock within a certain range of the tunnel (Read, 1994, 2004; Martin et al., 1997; Daraei and Zare 2018; Wang and Zhao, 2021). Siren et al. (2015) divided the damage zones in more detail according to the excavation method used, including the highly damage zone (HDZ), construction-induced excavation damage zone (EDZCI), stress-induced excavation damage zone (EDZSI) and excavation disturbed zone (EdZ). Li et al. (2016) divided the surrounding rock of an excavated cavern into the EFZ, construction damage zone (CDZ), stress-induced damage zone (SIDZ) and excavation influence zone (EIZ) on the basis of the work of Harrison and Hudson (2000), Eberhardt and Diederichs (2012), and Siren et al. (2015). Among them, the EFZ corresponds to the HDZ and the EIZ corresponds to the EdZ defined by Siren et al. (2015). According to the research results of the above-mentioned scholars, the author divides the damage zones into the EFZ, EDZ and EIZ, as shown in Figure 1.
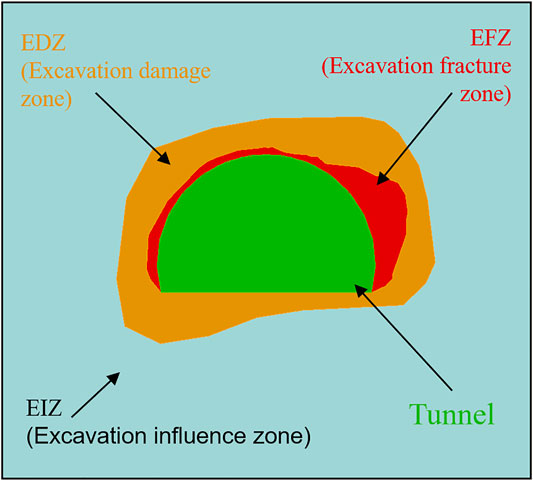
FIGURE 1. Schematic diagram of damage zone division.
Figure 1 shows the surrounding rock around an excavated cavern can be divided into an EFZ, EDZ and EIZ from the surface of the tunnel to the surrounding rock. As the distance from the excavation boundaries increases, the influence of the surrounding rock excavation disturbance and stress redistribution gradually decreases. The EFZ rock mass is characterized by macrofractures caused by excavation or spalling due to high in situ stress, which is only distributed within a small range from the surface of the tunnel, and the physical, mechanical and hydraulic properties of the rock mass decrease significantly. The EDZ rock not only contains some macrofractures but also includes mesoscale damage not visible to the naked eye, such as microcracks. In addition, the EDZ is distributed more widely around the tunnel, and the properties of the rock mass are slightly reduced. The excavation disturbance is small in the EIZ, so no new cracks are generated in the corresponding rock mass; it is basically in the initial stress state, and the rock mass properties are almost unchanged (Li et al., 2016).
In rock, the wave velocity decreases with the development of cracks and increases with the increase in rock integrity and stress. The surrounding rock of a cave wall is affected by excavation unloading, causing the wave velocity to decrease to different degrees. In general, as the depth from the cave wall increases, the influence of external disturbance on the surrounding rock gradually weakens until it disappears (there is a certain degree of local jump). The quality of the EFZ rock mass is the worst, and the wave velocity of this rock mass has dropped significantly, which is the lowest among the three zones. The rock mass in the EIZ is relatively intact, so the decrease in mechanical properties is small, and the wave velocity in the EIZ rock mass is not much different from that in the original rock mass. Therefore, the highest wave velocity among the three zones is observed in the EIZ. The EDZ is a transition zone between the EFZ and EIZ, and the wave velocity in the EDZ is between those of the EFZ and EIZ. The existence of the damage zones changes not only the physical, mechanical and hydraulic properties of the rock but also the dynamic wave interaction between the excavation-damage structure (including the excavation and the damage zones) and the seismic waves, such as the reflection, refraction and diffraction of the seismic waves. These two factors have led to changes in site effects and affected ground motions around excavations.
When the damage degree of underground excavation is different, it has different characteristics of the damage zones. The properties of the rock mass in the damage zones gradually deteriorate with the increasing damage degree, and the most obvious change is the decrease in the wave velocity of the rock mass mentioned above. Factors affecting ground motion around underground excavation mainly include excavation shape, excavation span, seismic magnitude, wavelength, rock mass characteristics, and supporting conditions (Cai et al., 2012; Zhu et al., 2012; Cai, 2013; Deng et al., 2014; Lei and Omer, 2015; Wang and Cai, 2015). Among them, the wavelength and span have the most significant impact on the ground motion amplification effect (Wang and Cai, 2015). The wave velocity in the damage zones will affect the incident wave wavelength (
Ma et al. (2015) found that a seismic event concentration area is usually no more than three times or even the same as the size of the seismic source from the excavation. Research on the distribution of mine earthquakes in the Upper-Silesian coal mine in Poland found that most of the mine earthquake events that induced rockburst damage were within 100 m of the location of the rockburst damage. In view of the above research results, this paper focuses on near-field ground motion events. With the help of the finite fracturing source model (FFSSM) proposed by the authors and the Specfem2D based on spectral element method (SEM), the influence of damage zones on the dynamic wave interaction and the impact of seismic wave velocity in the damage zones on the near-field ground motion is studied.
In the simulation of far-field ground motion events, the size of the seismic source is much smaller than the distance between the seismic source and the excavation, so the size of the seismic source can be ignored. The size and the dynamic fracturing process of the seismic source have very little influence on the distribution of ground motion around the tunnel. Therefore, the source is generally expressed by a point seismic source model (PSSM, as shown in Figure 2A). However, the near-field seismic source is relatively close to the excavation, and the seismic source size and dynamic fracturing process have an important control effect on the dynamic wave interaction and characteristics of ground motion. Therefore, the near-field seismic source cannot be simplified as a point source model. The authors propose the FFSSM (Figure 2B) under the premise of considering the size of the near-field seismic source and the dynamic fracturing process (Wang et al., 2021).
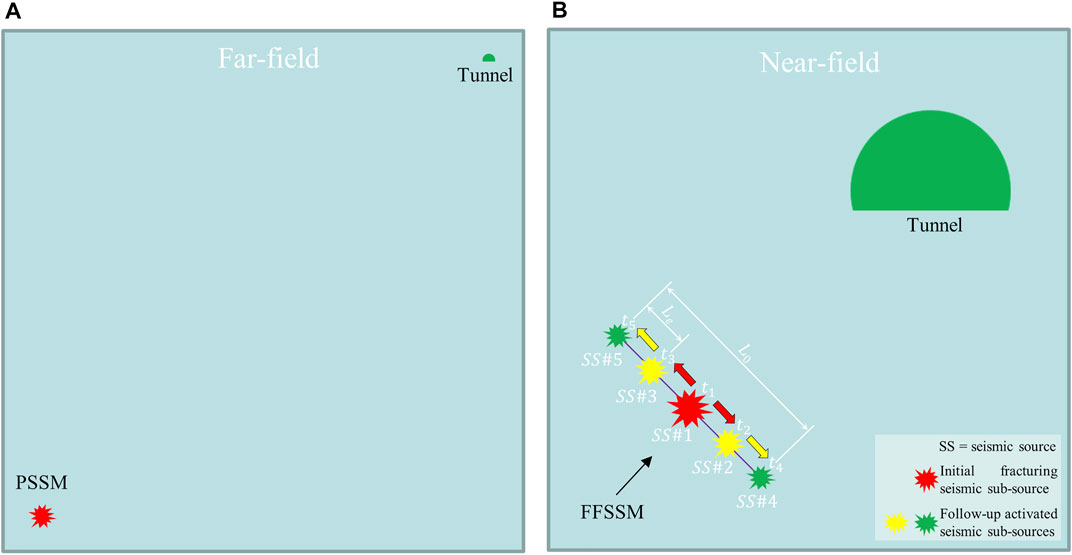
FIGURE 2. The PSSM and FFSSM: (A) The PSSM; (B) The FFSSM.
The basic idea of the FFSSM is to divide the main seismic source into a finite number of sub-sources with the same size (
The FFSSM includes two sets of calculation processes, forward simulation and back analysis, which have been implanted in the SEM software. This paper focuses on parameter analysis, that is, adjusting parameters to simulate different cases, so as to study the distribution of ground motion around excavation under different conditions and reveal the control effect of seismic wave velocity in the damage zones on the near-field motion. Therefore, this paper follows the forward simulation calculation process of FFSSM (Figure 3). There are five parameters involved in forward simulation calculation process, including the size of the seismic sub-source
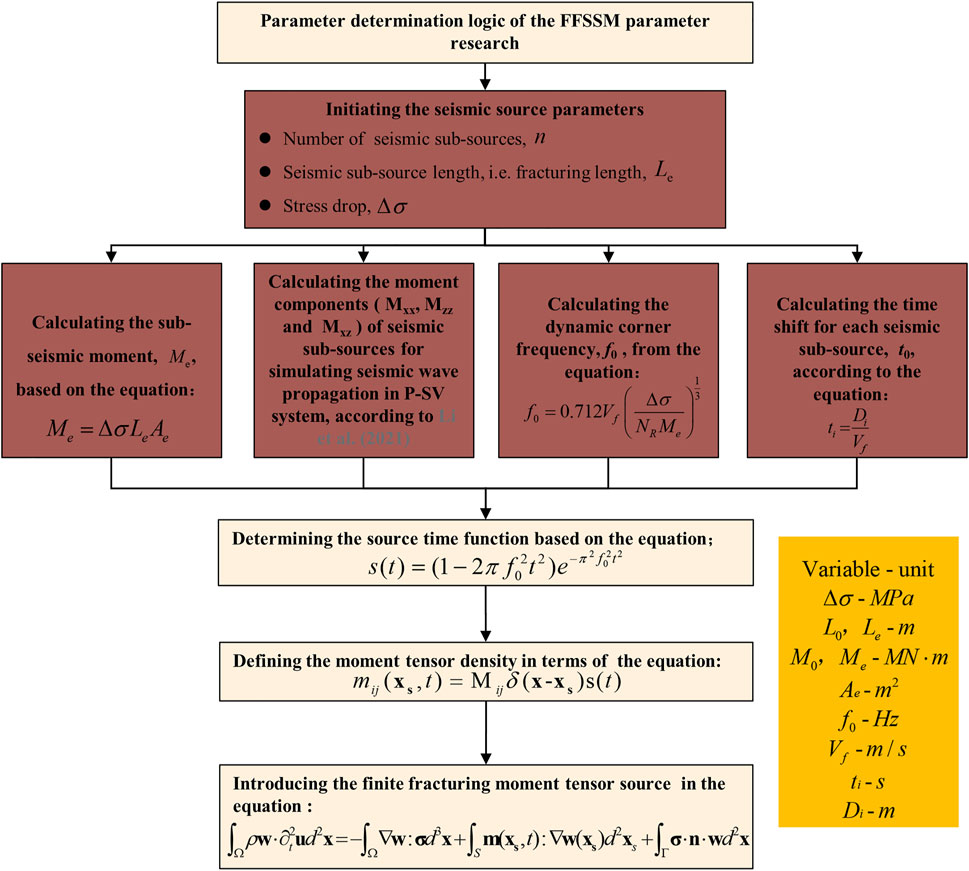
FIGURE 3. Calculation flowchart of the model parameters for the FFSSM [modified from Wang et al. (2021)].
To validate the reliability of the FFSSM, taking the Kiirunavaara mine as an example, the simulation results of FFSMM were compared with the results simulated by Chen et al. (2017) with the three dimension distinct element code (3DEC) and the results obtained through the empirical scaling law proposed by Potvin and Wesseloo (2013). Potvin and Wesseloo (2013) combined the original far-field relationship and near-field saturation, and proposed a scaling law that is applicable to both the far-field and the near-field without considering site effects, as shown in Eq. (1).
where,
To eliminate the influence of the site effect, the numerical simulation did not carry out the excavation (Figure 4A), and the comparison of the peak particle velocity (PPV) curves obtained by different methods is shown in Figure 4B. The simulation result curve of the FFSSM (curve c2) is roughly consistent with the result curve simulated by Chen et al. (2017) with 3DEC (curve c1), and it is between the scaling law curves where
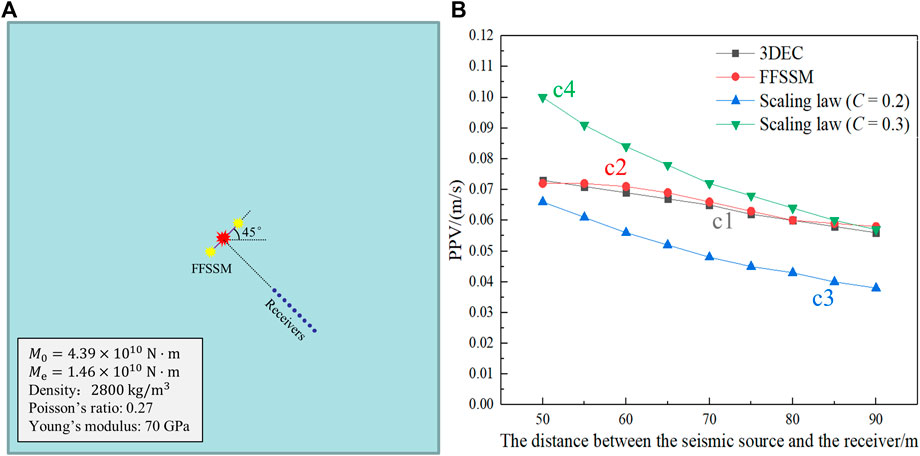
FIGURE 4. Numerical model and PPV comparison: (A) Numerical model with the Kiirunavaara mine as the engineering background; (B) Comparison of PPV obtained by the FFSSM, 3DEC and scaling law.
In addition, Figure 4B also shows the limitations of Eq. 1. This empirical scaling law does not consider the dynamic fracturing process and heterogeneous radiation of near-field ground motion events, which leads to deviations in the evaluation of near-field ground motions. Figure 4B shows that the curves obtained by FFSSM (curve c2) and 3DEC (curve c1) are in the high coincidence degree, while the other two curves (curves c3 and c4) obtained by Eq. 1 are significantly different from the curves c1 and c2 in terms of changing trend and gradient. As the distance between the seismic source and the receiver decreases, curves c1 and c2 gradually approach curve c3. It can be predicted that when the distance is smaller (40 m or less), curves c1 and c2 will exceed the range defined by curves c3 and c4, resulting in higher values obtained by the PPV empirical scaling law. This is because the smaller the distance between the tunnel and the seismic source, the more obvious the size effect of the seismic source on the tunnel, and the more it cannot be ignored. Moreover, because the vibration risk assessment is often carried out before tunnel construction, the insufficiency of engineering data and geological information makes the estimation of empirical constants
In the SPECFEM2D models, heterogeneous media with different seismic wave velocities in the EDZ and EFZ are considered to examine the influence of the EDZ and EFZ on near-field ground motions. The models are shown in Figure 5.
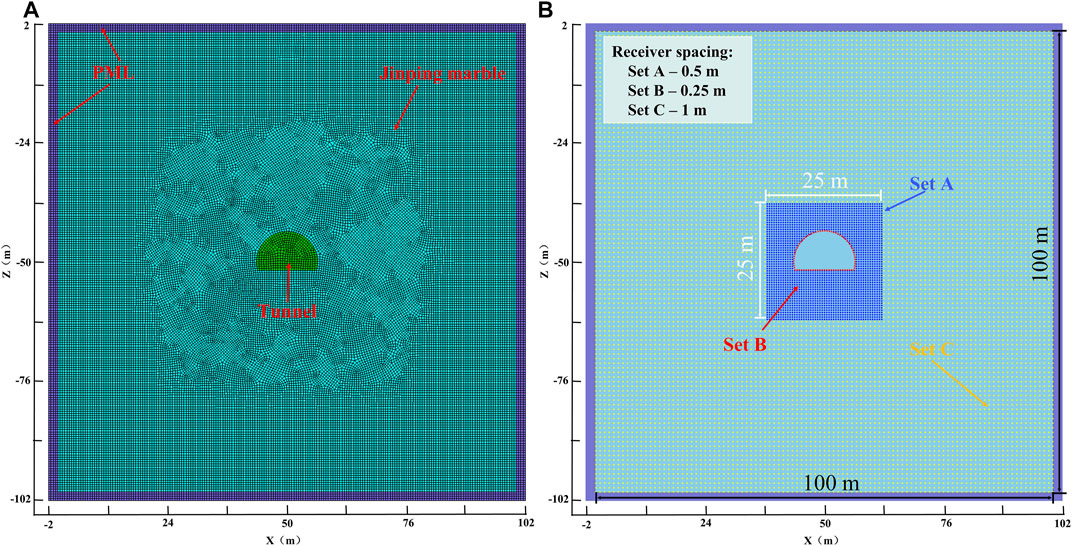
FIGURE 5. The establishment of the numerical model (A) and the setting of the receivers around the tunnel (B).
The calculation model is based on the Jinping II Hydropower Station (Figure 5A). The rock mass in the numerical model of the P-SV system is set as Jinping marble with a density of 2,780 kg/m3, a Young’s modulus of 56 GPa, a Poisson’s ratio of 0.27 (Fan et al., 2021; Wang et al., 2021) and a size of 104 × 104 m2. The four sides of the numerical model (with a thickness of 2 m) are set as perfect matching layers (PML) to eliminate unrealistic seismic wave reflections, and excavate the center (X = 50, Z = -50) of the numerical model.
Three different sets (Set A, Set A and Set C) of receivers are arranged in the numerical model to monitor the ground motion around the excavation, as shown in Figure 5B. Set A are placed in a range of 25 × 25 m2 around the tunnel with an interval of 0.5 m. Set B are placed on the excavation surface, considering the strong ground motion on the excavation surface, the interval is set to 0.25 m. Set C are placed in a range of 100 × 100 m2 with an interval of 1m, and are arranged around Set A.
The excavation section of the tunnel adopts the horseshoe shape of diversion tunnel #2, as shown in Figure 6A. The section includes the upper bench and lower bench. The height of the upper bench is 8.5 m, and the height of the lower step is 4.5 m. In actual engineering, rockbursts mostly occur during the excavation stage of the upper bench, so the excavated cross-section of only the upper bench of the tunnel was considered (Figure 6B).
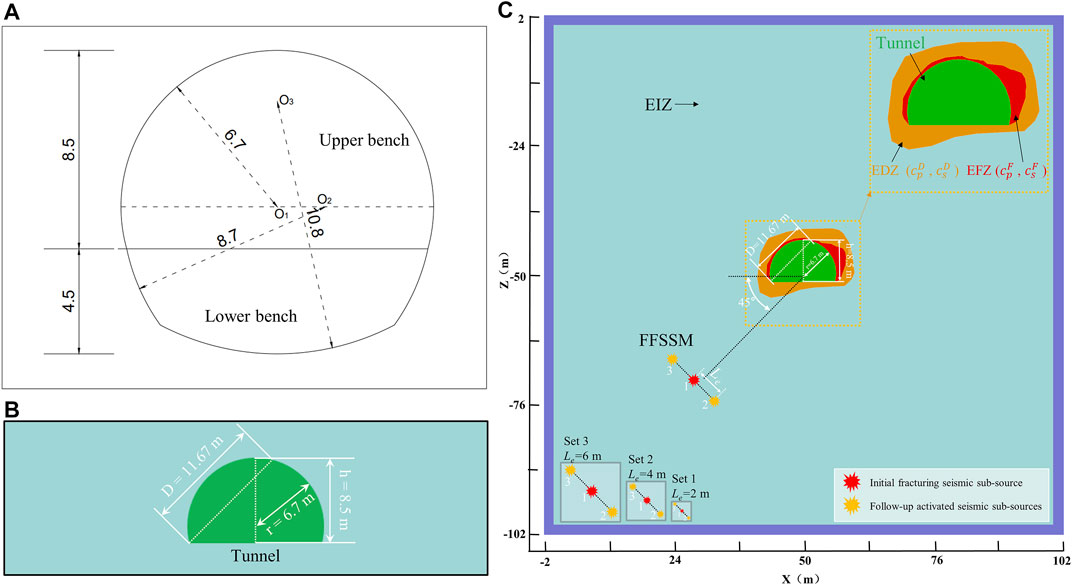
FIGURE 6. 2D models with different seismic wave velocities in the EDZ and EFZ: (A) The horseshoe shape of diversion tunnel #2; (B) Excavation section established in the numerical models; (C) Simulation scheme for different seismic wave velocities in the EDZ and EFZ.
The influence of the damage zones (including the EDZ and EFZ) on the amplification effect is controlled by the damage degree of the damage zones, and there are two main controlling factors: the range of damage zones and the wave velocity in the damage zones. When the degree of damage increases, the depth of the EDZ and EFZ gradually increases, and the wave velocity in the EDZ and EFZ also gradually decreases. This paper focuses on studying the influence of the seismic wave velocity in the damage zones on the amplification effect. On this basis, the following scheme is set up, as shown in Figure 6C below.
The seismic source is represented as the FFSSM and is located in the lower left corner of the numerical model. There are two reasons for setting the seismic source in the lower left corner: 1) The diagonal distance of the rectangular model is greater than the side length, and the seismic source is set in the lower left corner to maximize the use of the numerical model, in other words, reduce the computational domain range and reduce the computing time; 2) The dip of the seismic source is 45°. When it is located at the lower left corner, the largest wavefront will cover the tunnel area, and the vibration effect is the most obvious. According to previous research results (Wang et al., 2021), when the main seismic source moment magnitude
To study the influence of the seismic wave velocity in the EDZ and EFZ on near-field ground motions around excavation due to a fault slip-induced seismic event, three sets (Set 1 to Set 3) of cases with different seismic sub-source length (Le is 2, 4 and 6 m, respectively) are considered, and each set has four cases (Case 1 to Case 4), as shown in Figure 6C. In the same set, the seismic source parameters of the four simulation cases remain unchanged (Table 1) but the seismic wave velocity in the EDZ and EFZ changes (Table 2). In addition to the seismic wave velocity in the EDZ and EFZ, other material properties of the EIZ, EDZ, EFZ and tunnel (such as the density, Young’s modulus, and Poisson’s ratio of the rock mass) in all cases remain unchanged. Moreover, all the 12 cases have the same EDZ and EFZ range as shown in Figure 6C, which is based on the actual range of the EDZ and EFZ at 11 + 205 in diversion tunnel #2 of the Jinping II Hydropower Station (extremely strong rock burst event, with extremely high damage degree to the surrounding rock around the tunnel).
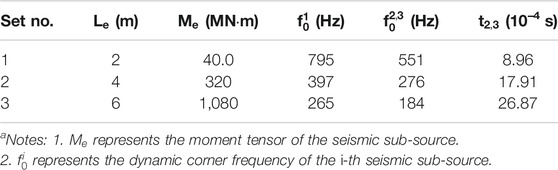
TABLE 1. List of seismic sub-source parameters in the simulation schemea.
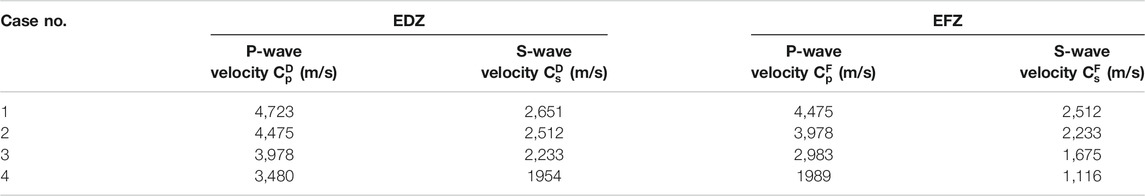
TABLE 2. List of rock mass wave velocities in the EDZ and EFZ used in the simulation scheme.
A non-uniform velocity distribution will lead to high modeling difficulty and complex parameter input, which is difficult to achieve, so we simplified the numerical model. Different seismic wave velocities are assigned to EDZ, EFZ and EIZ, while the seismic wave velocities in the same zone remain unchanged. The rock mass wave velocities in the damage zones are selected based on the long-term monitoring data of Jinping II Hydropower Station. As the damage degree increases, the wave velocity in the surrounding rock decreases. The wave velocities in the EDZ of Case 1 to Case 4 are 0.95, 0.9, 0.8, and 0.7 times of the wave velocity in the EIZ, and the wave velocity in the EFZ is 0.9, 0.8, 0.6, and 0.4 times the wave velocity in the EIZ, respectively.
In the numerical modeling, propagation of seismic waves excited by the FFSSMs in models with different seismic wave velocity in the EDZ and EFZ, including background models (without an excavation) and excavation models, is conducted first. Then, the PPV distribution around the excavation is obtained based on the monitoring data recorded by the receivers. The receiver can set different seismotypes such as velocity, displacement, acceleration, pressure and fluid potential, and the PPV distribution can be obtained by processing the velocity-time curve of each receiver. Finally, an amplification factor (
Figure 7 presents snapshots of the vertical velocity component at 0.0096, 0.016, and 0.0224 s for the four cases with different seismic wave velocity in the EDZ and EFZ (Set 2 of simulation scheme). In the simulation of this paper, because the selected seismic sub-source represents a normal fault with a dip of 45°, the strong ground motion of the S-waves can be observed at 45°/135° to the X axis in the background model (to facilitate the analysis, the results are drawn in the excavation model, as the white dashed line shows in Figure 7A), and the ground motion at other locations is relatively weak (Stein and Wysession, 2009). The following conclusions can be drawn from Figure 7.
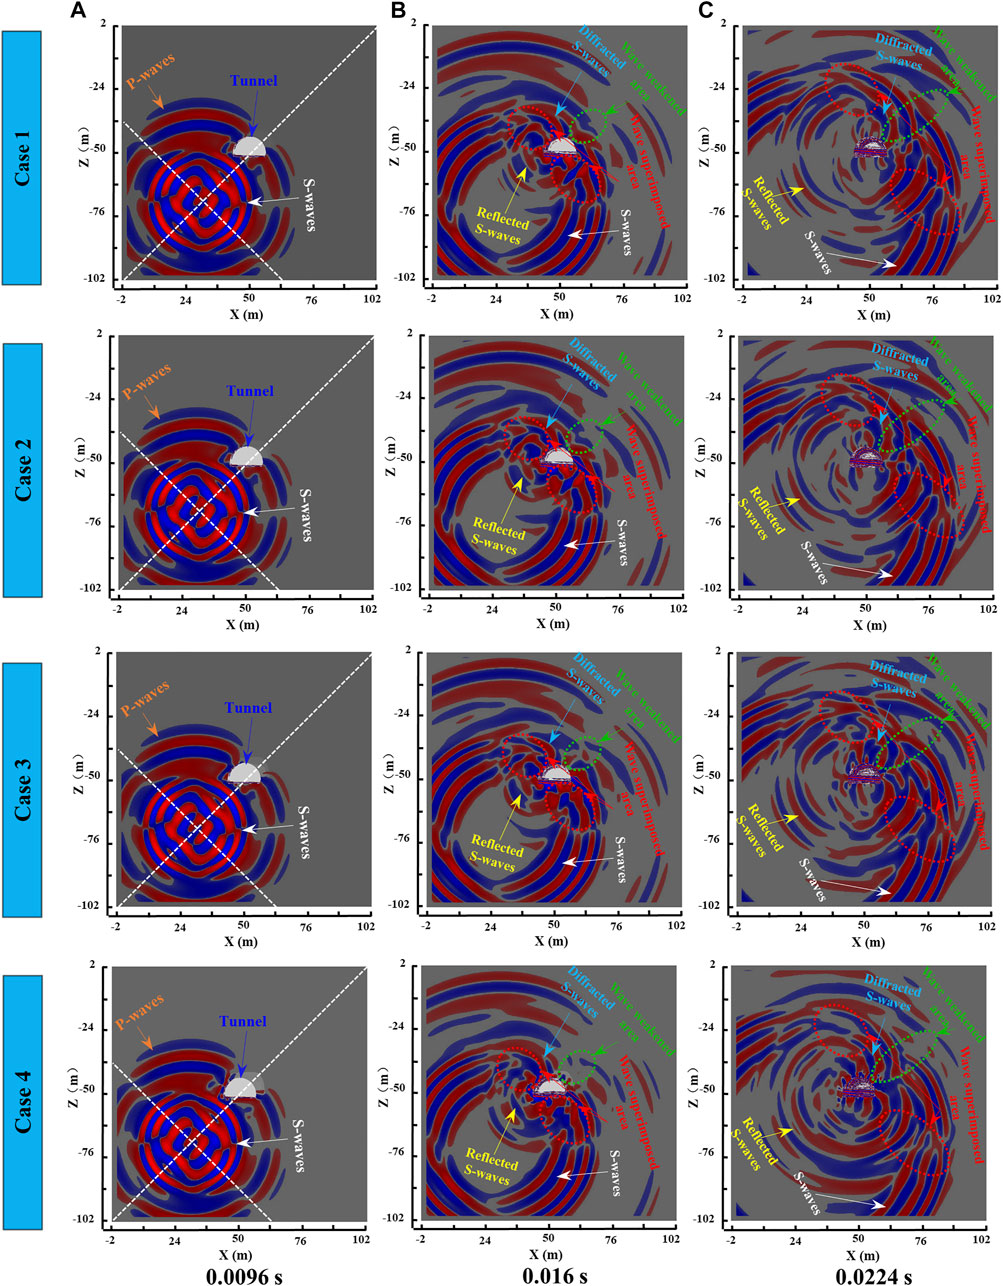
FIGURE 7. Snapshots of the vertical velocity component at 0.0096, 0.016, and 0.0224 s for the four cases with different seismic wave velocity in the EDZ and EFZ, corresponding to Set 2
When S-waves propagate to the excavation structure, reflected S-waves will be generated at the upper-left side and the lower-right side of the excavation. Reflected S-waves will form a seismic wave superposition area with both S-waves and diffracted S-waves, where the ground motion is enhanced, and the wave superimposed area will gradually move farther away over time, as shown by the red dotted box in Figures 7B,C.
Diffracted S-waves will also be generated when the S-wave propagates to the excavation structure. Because of the change in the propagation direction and the generation of diffraction loss, the ground motion at the upper-right side of the excavation, which is the largest wavefront coverage area in the background model, is weakened, forming a wave weakened area that gradually moved farther away, as shown by the green dotted box in Figures 7B,C.
As the seismic wave velocity in the damage zones decreases, the properties of surrounding rock in different zones differ more obviously. The multiple refraction and reflection effects of the EDZ, EFZ and tunnel cause the seismic wave components to be diversified and complicated (such as the incident waves, reflected waves and refracted waves caused by different interfaces), so the degree of wave field disturbance around the tunnel gradually increases, and the site effect of the excavation-damage structure on near-field ground motion gradually increases. Moreover, changes in the seismic wave velocity in the damage zones also cause changes in the shielding effect of the excavation-damage structure. As the seismic wave velocity in the damage zones decreases, the ground motion on the upper-right side of the excavation weakens, which means that the shielding effect will gradually increase.
Figure 8 presents the PPV and amplification factor distributions of four cases with different rock mass wave velocities in the EDZ and EFZ, corresponding to Set 3. As shown in Figure 8A, the reflected and the diffracted S-waves are generated and started to propagate under the dynamic wave interaction, resulting in the appearance of the Zones A and B with high-PPV. The seismic sub-source 1 contacts with the excavation-damage structure first and generates reflected S-waves, and then interacted with the S-waves of the seismic sub-sources 2 and 3 arrived later in the left floor and left sidewall areas of the excavation to form a high-PPV area Zone A. The S-waves superimpose with reflected and diffracted S-waves in the lower-right and upper-left sides of the excavation to form a high-PPV area Zone B. In addition, there is a low-PPV area Zone C (Figure 8A), which is formed by the shielding effect of the excavation-damage structure and the diffraction loss, and is located in the upper-right side area of the tunnel.
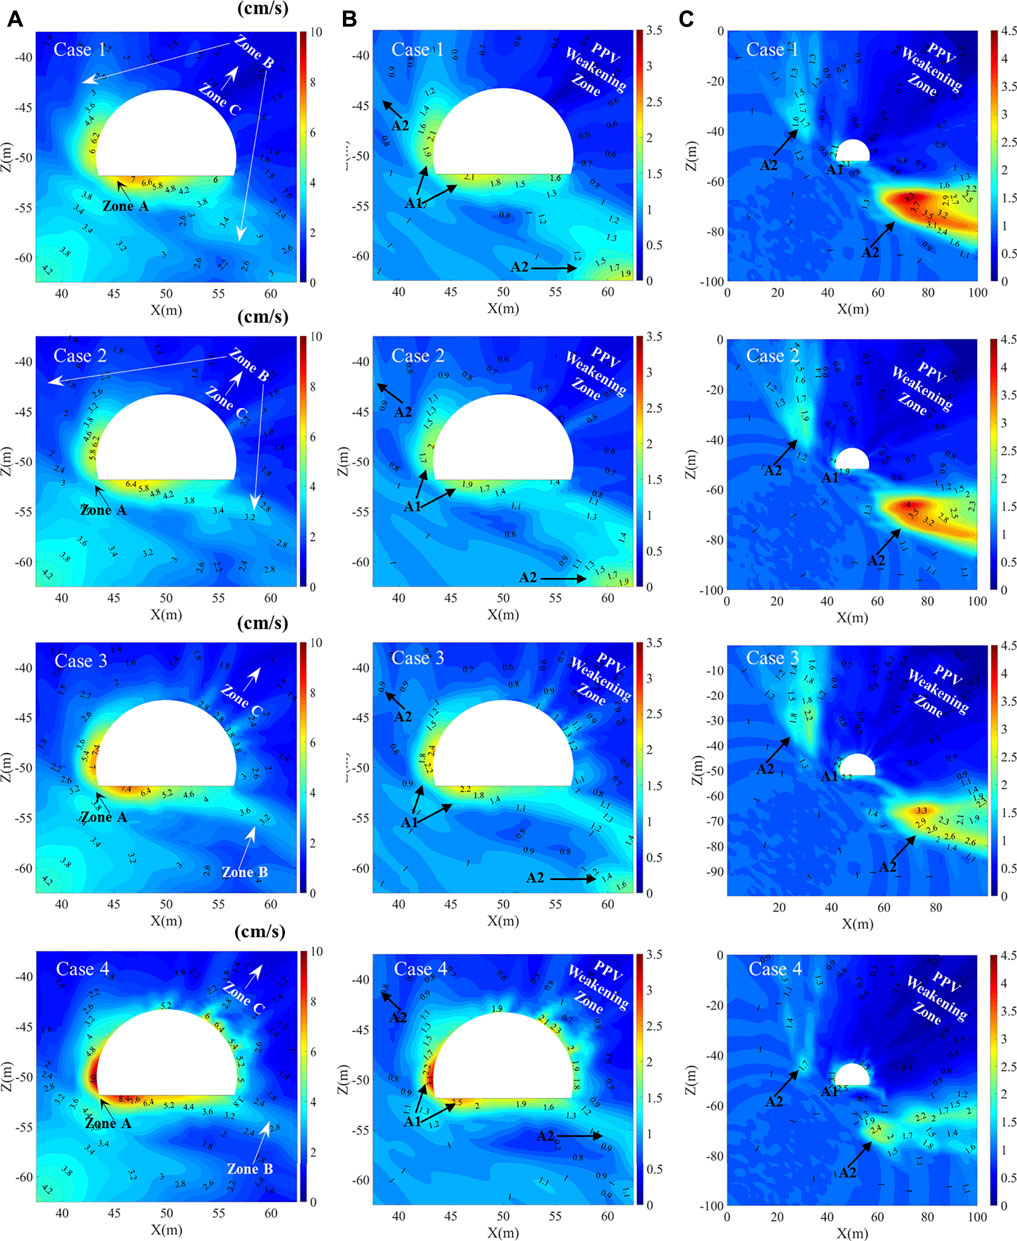
FIGURE 8. Distribution of near-field ground motion around excavation for the four cases with different seismic wave velocities in the EDZ and EFZ, corresponding to Set 3: (A) PPV distributions around the excavation; (B) amplification factor contours around the excavation; (C) amplification factor contours for the entire computational domain.
Table 2 and Figure 8A show that with the decrease in the seismic wave velocity in the EDZ and EFZ, the overall trend of the ground motion around excavation gradually increases. From Case 1 to Case 4, the seismic wave velocity gradually decreases, the values of
The effect of the seismic wave velocity on the PPV contours is shown in Figures 8B,C. Due to the site effect of the excavation-damage structure, two types of representative areas are formed: one is the PPV amplification area (A1 and A2) with α > 1, and the other is the PPV weakening area with α < 1, which shows that the site effect of the excavation-damage structure on the ground motion includes both amplification and shielding. With the decrease in the seismic wave velocity in the EDZ and EFZ, the amplification effect of the tunnel excavation-damage structure increases, and the ground motion around the tunnel gradually increases. From Case 1 to Case 4, the seismic wave velocity gradually decreases, the maximum amplification factor
Combining Figure 7 and Figure 8, the following conclusions can be drawn: the seismic wave velocity in the EDZ and EFZ greatly influences the site effect of the tunnel. As the seismic wave velocity decreases, on the one hand, the amplification effect in the near-excavation area increases, which is presented as an increase in
Figure 9 presents the maximum PPV in the excavation models and the maximum amplification factor in the near-excavation area (A1) with different seismic wave velocity in the EDZ and EFZ, corresponding Table 2. There are two reasons for selecting the near-excavation area A1 for analysis: on the one hand, the near-excavation area has a high PPV value, which can be seen from Figure 8, and on the other hand, the rockburst mainly occurs in the shallow rock mass of the tunnel. The following conclusions can be drawn from Figure 9. When the quality of the surrounding rock decreases, as the seismic wave velocity decreases, both
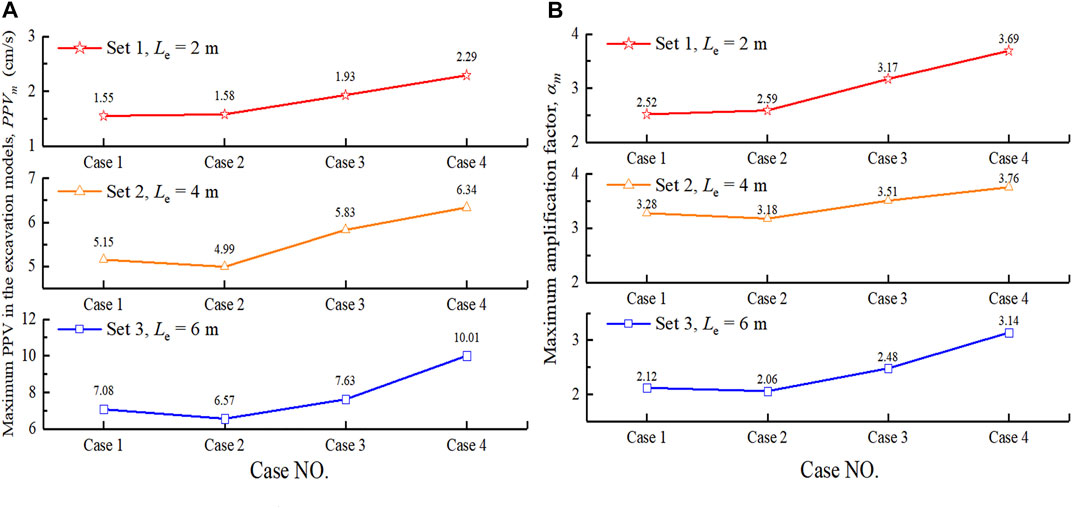
FIGURE 9. The relationship between the near-field vibration and the seismic wave velocity in the excavation models: (A) The maximum PPV in the near-excavation area with different rock mass wave velocities in the EDZ and EFZ; (B) The maximum amplification factor in the near-excavation area with different rock mass wave velocities in the damage zones.
Of course, the above conclusion is an overall trend based on comprehensive consideration of all data, with some exceptions, e.g., the
The excavation unloading of the tunnel forms a high-stress zone, leading to the formation of the damage zones. The quality of the rock mass and the seismic wave velocity in these zones decrease, so the ground motion behavior also changes. This paper studies the near-field ground motion behavior in the damage zones and reveales the influence of the seismic wave velocity in the damage zones on the near-field ground motion by the aid of the finite fracturing source model (FFSSM). The ground motion behavior around the excavation is affected by the seismic wave velocity in the EDZ and EFZ. When the seismic wave velocity in the damage zones changes, the intensity of ground motions around the tunnel also changes. As the seismic wave velocity in the damage zones decreases,
The numerical results provide additional insights into the ground motion behavior of underground excavations under dynamic load conditions, such as hydropower station construction (powerhouses and tunnels), mining (shafts, roadways, and stopes), and enrich the theoretical research of seismic hazard risk assessment and dynamic rock support design. In addition, the next step of this research is to extend the numerical model to three dimensions, couple software to take the in-situ stress and disturbance stress into consideration, and further analyze the impact of underground excavation damage zones on the risk of rock mass seismic hazards around deep tunnels.
The original contributions presented in the study are included in the article, further inquiries can be directed to the corresponding author.
QW and SQ: conceptualization, methodology, software, validation, formal analysis. QW, SZ, and YK: investigation. QW: writing—original draft preparation. SQ and YC: writing—review and editing. SQ: supervision. SQ and PL: funding. All authors have read and agreed to the published version of the manuscript.
This research received financial support provided by the National Natural Science Foundation of China (Grant No. 41877256 and 51979268), the Natural Science Foundation of Hubei Province, China (Grant No. ZRQT2020000114 and 2019CFB268) and the key research program of the Chinese Academy of Sciences (Grant No. KFZD-SW-423).
Author YK was employed by the company Jinchuan Group Co. Ltd.
The remaining authors declare that the research was conducted in the absence of any commercial or financial relationships that could be construed as a potential conflict of interest.
All claims expressed in this article are solely those of the authors and do not necessarily represent those of their affiliated organizations, or those of the publisher, the editors and the reviewers. Any product that may be evaluated in this article, or claim that may be made by its manufacturer, is not guaranteed or endorsed by the publisher.
The authors would like to thank the Computational Infrastructure for Geodynamics (CIG) for providing the open-source software package SPECFEM2D (www.geodynamics.org).
Abercrombie, R. E. (1995). Earthquake Source Scaling Relationships from −1 to 5MLusing Seismograms Recorded at 2.5-km Depth. J. Geophys. Res. 100 (B12), 24015–24036. doi:10.1029/95JB02397
Allmann, B. P., and Shearer, P. M. (2009). Global Variations of Stress Drop for Moderate to Large Earthquakes. J. Geophys. Res. 114 (1), 1–22. doi:10.1029/2008JB005821
Atkinson, G. M., and Pierre, J.-R. (2004). Ground-motion Response Spectra in Eastern North America for Different Critical Damping Values. Seismological Res. Lett. 75 (4), 541–545. doi:10.1785/gssrl.75.4.541
Bäckblom, G., and Martin, C. D. (1999). Recent Experiments in Hard Rocks to Study the Excavation Response: Implications for the Performance of a Nuclear Waste Geological Repository. Tunnelling Underground Space Technol. 14 (3), 377–394. doi:10.1016/S0886-7798(99)00053-X
Cai, M., Kaiser, P., and Duff, D. “Rock Support Design in Burst-Prone Ground Utilizing an Interactive Design Tool,” in Proceeding of 46th US Rock Mechanics/Geomechanics Symposium, Chicago, Illinois, June 2012, 12–59.
Cai, M. (2013). Principles of Rock Support in Burst-Prone Ground. Tunnelling Underground Space Technol. 36, 46–56. doi:10.1016/j.tust.2013.02.003
Chen, G. H., Li, X. B., Zhang, P., Nordlund, E., and Dong, L. J. (2017). Optimization of Tunnel Support Parameters with Consideration of Seismic Wave Radiation Pattern in the Fault-Slip Burst. J. Mining Saf. Eng. 34 (04), 715–722. (In Chinese). doi:10.13545/j.cnki.jmse.2017.04.016
Chen, M., Yang, S. Q., Gamage, R. P., Yang, W. D., Yin, P. F., Zhang, Y. C., et al. (2018). Fracture Processes of Rock-like Specimens Containing Nonpersistent Fissures under Uniaxial Compression. Energies 12 (1), 79. doi:10.3390/en12010079
Daraei, A., and Zare, S. (2018). Prediction of Overbreak Depth in Ghalaje Road Tunnel Using Strength Factor. Int. J. Mining Sci. Technol. 28 (04), 134–139. doi:10.1016/j.ijmst.2018.04.013
Deng, X. F., Zhu, J. B., Chen, S. G., Zhao, Z. Y., Zhou, Y. X., and Zhao, J. (2014). Numerical Study on Tunnel Damage Subject to Blast-Induced Shock Wave in Jointed Rock Masses. Tunnelling Underground Space Technol. 43, 88–100. doi:10.1016/j.tust.2014.04.004
Eberhardt, E., and Diederichs, M. (2012). Review of Engineering Geology and Rock Engineering Aspects of the Construction of a KBS-3 Repository at the Forsmark Site—Initial Review Phase. Stockholm: Swedish Radiation Safety Authority.
Fan, Y., Cui, X. Z., Leng, Z. D., Zheng, J. W., Wang, F., and Xu, X. L. (2021). Rockburst Prediction from the Perspective of Energy Release: A Case Study of a Diversion Tunnel at Jinping II Hydropower Station. Front. Earth Sci. 9, 624. doi:10.3389/feart.2021.711706
Ge, X. R. (2008). Deformation Control Law of Rock Fatigue Failure, Real-Time X-ray CT Scan of Geotechnical Testing, and New Method of Stability Analysis of Slopes and Dam Foundations. Chin. J. Geotechnical Eng. 30 (1), 1–20. (In Chinese).
Hanks, T. C. (1977). Earthquake Stress Drops, Ambient Tectonic Stresses and Stresses that Drive Plate Motions. Pageoph 115 (1/2), 441–458. doi:10.1007/BF01637120
Hardebeck, J. L., and Aron, A. (2009). Earthquake Stress Drops and Inferred Fault Strength on the Hayward Fault, East San Francisco Bay, California. Bull. Seismological Soc. America 99 (3), 1801–1814. doi:10.1785/0120080242
Harrison, J., Hudson, J., and Popescu, M. (2002). Engineering Rock Mechanics: Part 2. Illustrative Worked Examples. Appl. Mech. Rev. 55, B30. Elsevier: Pergamon. doi:10.1115/1.1451166
Ide, S., and Beroza, G. C. (2001). Does Apparent Stress Vary with Earthquake Size? Geophys. Res. Lett. 28 (17), 3349–3352. doi:10.1029/2001GL013106
Jia, C. J., Zhang, S., and Xu, W. Y. (2021). Experimental Investigation and Numerical Modeling of Coupled Elastoplastic Damage and Permeability of Saturated Hard Rock. Rock Mech. Rock Eng. 54, 1–19. doi:10.1007/s00603-020-02319-5
Lei, M., and Omer, J. (2015). Study on Train Vibration Response and Cumulative Deformation of Double Arch Tunnel in Kast Foundation. Geotech Geol. Eng. 33 (3), 549–558. doi:10.1007/s10706-014-9839-3
Li, J. H., Sheng, Q., Zhu, Z. Q., Liu, S. W., Cheng, H. Z., and Zhou, X. T. (2016). Excavation Damage Zone Depth and Influence Factors of Brittle Rock. Chin. J. Geotechnical Eng. 38 (S2), 190–197. (In Chinese). doi:10.11779/CJGE2016S2031
Ma, T. H., Tang, C. A., Tang, L. X., Zhang, W. D., and Wang, L. (2015). Rockburst Characteristics and Microseismic Monitoring of Deep-Buried Tunnels for Jinping II Hydropower Station. Tunnelling Underground Space Technol. 49, 345–368. doi:10.1016/j.tust.2015.04.016
Martini, C. D., Read, R. S., and Martino, J. B. (1997). Observations of Brittle Failure Around a Circular Test Tunnel. Int. J. Rock Mech. Mining Sci. 34 (7), 1065–1073. doi:10.1016/S1365-1609(97)90200-8
Potvin, Y., and Wesseloo, J. (2013). Towards an Understanding of Dynamic Demand on Ground Support. J. South Afr. Inst. Mining Metall. 113 (12), 913–922. doi:10.36487/acg_rep/1304_18_potvin
Read, R. S. (1994). Interpreting Excavation-Induced Displacements Around a Tunnel in Highly Stressed Granite. Winnipeg: University of Manitoba.
Read, R. S. (2004). 20 Years of Excavation Response Studies at AECL's Underground Research Laboratory. Int. J. Rock Mech. Mining Sci. 41 (41), 1251–1275. doi:10.1016/j.ijrmms.2004.09.012
Siren, T., Kantia, P., and Rinne, M. (2015). Considerations and Observations of Stress-Induced and Construction-Induced Excavation Damage Zone in Crystalline Rock. Int. J. Rock Mech. Mining Sci. 73, 165–174. doi:10.1016/j.ijrmms.2014.11.001
Stein, S., and Wysession, M. (2009). An Introduction to Seismology, Earthquakes, and Earth Structure. Hoboken, New Jersey: John Wiley & Sons.
Tsang, C.-F., Bernier, F., and Davies, C. (2005). Geohydromechanical Processes in the Excavation Damaged Zone in Crystalline Rock, Rock Salt, and Indurated and Plastic Clays-In the Context of Radioactive Waste Disposal. Int. J. Rock Mech. Mining Sci. 42 (1), 109–125. doi:10.1016/j.ijrmms.2004.08.003
Wang, P. L., Yao, J. J., Liu, W. B., Ma, Y. H., and Xia, A. G. (2013). Comparative Study on Stress Drop of Two strong Earthquake Sequences in Yushu Area. Inland Earthquake 27 (4), 295–302. doi:10.16256/j.issn.1001-8956.2013.04.002
Wang, Q. K., Qiu, S. L., Cheng, Y., Li, S. J., Li, P., Huang, Y., et al. (2021). Amplification Effect of Near-Field Ground Motion Around Deep Tunnels Based on the Finite Fracturing Seismic Source Model. J. Rock Mech. Geotechnical Eng. 9 (4), 975–995. doi:10.1007/s10518-011-9249-3
Wang, X., and Cai, M. (2015). Influence of Wavelength-To-Excavation Span Ratio on Ground Motion Around Deep Underground Excavations. Tunnelling Underground Space Technol. 49, 438–453. doi:10.1016/j.tust.2015.06.004
Wang, Z. J., and Zhao, B. M. (2021). Applicability of Accurate Ground Motion Estimation Using Initial P Wave for Earthquake Early Warning. Front. Earth Sci. 9, 778. doi:10.3389/feart.2021.718216
Xue, Yi., Gao, F., Liu, X. G., and Liang, X. (2017). Permeability and Pressure Distribution Characteristics of the Roadway Surrounding Rock in the Damaged Zone of an Excavation. Int. J. Mining Sci. Technol. 27 (02), 211–219. doi:10.1016/j.ijmst.2017.01.003
Keywords: underground engineering, seismic hazard, near-field ground motion, excavation damage zone, excavation fracture zone, finite fracturing seismic source model
Citation: Wang Q, Qiu S, Cheng Y, Li P, Kou Y and Zhang S (2021) Influence of the Seismic Wave Velocity of the Damage Zone on Near-Field Ground Motions. Front. Earth Sci. 9:803522. doi: 10.3389/feart.2021.803522
Received: 28 October 2021; Accepted: 18 November 2021;
Published: 13 December 2021.
Edited by:
Mingfeng Lei, Central South University, ChinaReviewed by:
Mikhail Rodkin, Institute of Earthquake Prediction Theory and Mathematical Geophysics (RAS), RussiaCopyright © 2021 Wang, Qiu, Cheng, Li, Kou and Zhang. This is an open-access article distributed under the terms of the Creative Commons Attribution License (CC BY). The use, distribution or reproduction in other forums is permitted, provided the original author(s) and the copyright owner(s) are credited and that the original publication in this journal is cited, in accordance with accepted academic practice. No use, distribution or reproduction is permitted which does not comply with these terms.
*Correspondence: Shili Qiu, c2xxaXVAd2hyc20uYWMuY24=
Disclaimer: All claims expressed in this article are solely those of the authors and do not necessarily represent those of their affiliated organizations, or those of the publisher, the editors and the reviewers. Any product that may be evaluated in this article or claim that may be made by its manufacturer is not guaranteed or endorsed by the publisher.
Research integrity at Frontiers
Learn more about the work of our research integrity team to safeguard the quality of each article we publish.