 Liu Tangyan1
 Zhao Wenjun
- 1State Key Laboratory of Marine Geology, Tongji University, Shanghai, China
- 2Daqing Branch, China Petroleum Logging Co. Ltd., Daqing, China
- 3College of Chemistry, Nankai University, Tianjin, China
- 4State Key Laboratory of Oil and Gas Reservoir Geology and Exploitation, Southwest Petroleum University, Chengdu, China
The complex pore structure of rock may influence resistivity logs and make it challenging to perform saturation estimations with better precision. For example, water saturation may go higher or lower when Archie’s formulae are used to obtain the saturation as the logging resistivity may become greater or smaller, due to the influences of complex pore structures in the reservoirs. In this paper, having considered the influences of pore structure on logging resistivity, we have developed a different algorithm to improve the equivalent rock element model (EREM, a rock conduction model) to have better water saturation. First of all, the nuclear magnetic resonance (NMR) echo data of cores are inverted by using the optimized inversion to calculate pore parameters, such as the average radius of spherical pore tubular pore, Cd path, and sorting coefficient. Secondly, according to the parameters derived from the optimization inversions, the pore structures of the core are divided into different groups. Based on the classifications of the pore structure, the conduction parameters of rock for different pore structures are determined by fitting the experimental conduction data of rock with a damping factor. Finally, the working flow of calculating fluid saturation according to the EREM model is determined for different conduction parameters. The key feature of the improved EREM saturation model is to eliminate the influence of pore structure on rock conduction, highlight the influence of pore fluid on rock conduction, and then improve the calculation accuracy of saturation in it. The applications of our research show that the saturation estimations derived from the improved EREM model appear to be more reasonable in terms of the saturation value and its numerical trend. Thus, the improved EREM model has potential in petroleum exploration and exploitation.
Introduction
The exploration and development of complex oil-bearing reservoirs are becoming increasingly important in the petroleum industry worldwide. It has become challenging for petroleum engineers to find a solution to perform oil exploitation economically and efficiently. Moreover, many research reports have confirmed that pore structure and pore fluid distribution may influence the resistivity of rocks. Even if the porosity and saturation are identical, the resistivity of the rock may change evidently when the pore structure changes significantly and/or the fluid shape in the pore changes significantly. In this case, the classic Archie formula (Archie., 1942) cannot be applied in the complex reservoir. In addition, many studies suggested that the excessive usage of the Archie formulae could result in a significant error of saturation estimation, even when the qualified logging data are available. In the classic Archie formulae, petroleum engineers cannot distinguish if the resistivity responses are induced by pore structure or by pore fluids (Aguilera and Aguilera, 2003; Azar and Javahenrian, 2008; Allori et al., 2011; Bauer and Youssef, 2011; Shi et al., 2020). The pore structure of the reservoir is so complex that it is almost impossible to characterize it by any analytic equation.
Furthermore, pore-throat-size distribution (PSD) may control numerous fundamental petrophysical properties, such as rock resistivity, permeability, and fluid flow in the pore and impact the characterization of water and hydrocarbon reserves (Garcia and Heidari, 2021; Tang et al., 2021). Nevertheless, to have higher accuracy of saturation estimation, we must develop some quantitative models or/and methods to eliminate the influences of pore structure on rock resistivity (Zhan et al., 2020; Zhan et al., 2021). Abousrafa et al. (2009) designed a spherical pore to connect three tubular pores. When the tubular pores connect the spherical pore at different angles, Abousrafa studied the influences of pore structure on rock resistivity using an analytical method. His research is of great value to understanding the influence of pore structure on rock resistivity. However, developing a practical model to obtain the saturation in tight reservoirs is still a problem. Bryan and Pallatt (1996) noted that the applicability of the Archie formula in complex reservoirs was limited before the research by Abousrafa. It is suggested that the conductivity of rock is closely related to the pore shape and pore fluid distribution, and a specific cement index was proposed in the research by Bryan. For example, when the pore porosity is less than 10%, the classical Archie formula does not apply to a tight reservoir. Still, it may be suitable for the tight reservoir after data correction. To confirm his views, Bryan and Pallatt (1996) developed a particle accumulation model to simulate the dolomitization compaction process and quartz cementation process on rock resistivity.
The model by Bryan can predict rock formation factors and the resistivity index, and all the predictions show excellent consistency with the experimental data. The predictions of this model can be used to calculate oil saturation in consolidated and unconsolidated sandstone. However, it still is a problem to describe the pore structure by field logging data. Suman, Man, and other researchers have also carried out a series of practical research on the mechanism of rock conduction. Suman and Knight (1997) proposed a network model to study the relationships between pore structure, skeleton wettability, and rock conduction in partially fluid-saturated rock. After comparing the water wetting rock with the oil wetting rock, he believed that the oil wetting rock has a larger saturation index (n). The wettability of rock influences their conduction, mainly through the film thickness of wettable water. Suman pointed out that the saturation index decreases when larger and simpler pores exist in rocks. Man and Jing (2000) also paid attention to the relationship between rock wettability and conduction. He argued that rock wettability seems variable in analyzing experimental data, and the non-Archie phenomena exist in different samples. To understand these relationships, Man proposed a new pore network model according to the pore morphology and the shape combinations of the different pores. The theoretical model comprehensively considered the geometric characteristics of pores, including the pore shape factor, pore size distribution, and pore coordination number (connectivity of pores). The influence of wetting history and saturating history on rock resistivity and capillary force is also considered (Ramamoorthy et al., 2021). The experimental data of Man show that the wettability of the same pore may change due to the difference in saturating history (Shi et al., 2021). In this paper’s research, the influence of pore structure on rock conduction is attributed to the background factor, and the background factor is characterized by the model parameters (Huang et al., 2020; Tang et al., 2021; Valagiannopoulos, 2021). For different pore structures in the reservoir, the model parameters corresponding to the different pore structures are determined for each model (Newgord et al., 2020; Zhang et al., 2020). Therefore, it can be considered that the pore structure does not constitute any influence on rock conduction in the reservoir with the same or similar pore structures, and the rock resistivity is entirely dependent on the response of pore fluids. Based on these considerations, the accuracy of saturation estimations is then improved.
Improvement of the Equivalent Rock Element Model Model
Shang et al. (2003) proposed the equivalent rock element model (EREM) model to study the influence of rock pore structure on rock conductivity. To objectively describe and quantitatively evaluate the influence of rock conductive path and fluid distribution on rock conduction and understand how the conductive path and fluid distribution influenced rock resistivity, research has been performed in the paper to improve the EREM model. Consequently, a better evaluation of oil saturation is expected. The original EREM model with a complex pore structure suggested by Shang et al. (2003) is presented in Figure 1 and Eqs 1–7.
Where:
• RF is the porosity scaling factor with no dimension, reflecting the influence of pore structure on the conductivity of rock.
• c and d are the coefficients related to pore structure.
• C0 is the initial dimensionless pore structure efficiency, and the parameter characteristics that influence the pore morphology on the conductivity of rock. C0 can be determined with the distribution curve of the spherical fracture model. In this research, the ratio of the potential value of the cumulative distribution curve of the spherical pore and fracture pore in the spherical-fracture model is assigned as C0.
• CF is the initial pore structure efficiency, and it has no dimension.
• Vc is the volume of fracture pore in μm3.
• Vs is the volume of spherical pore in μm3;
• RI is the dimensionless saturation scaling factor, reflecting the influences of hydrocarbon content and fluid distributions on the conductivity of rock;
• e and f are the coefficients related to hydrocarbon saturation and pore fluid distributions.
• CI is the dimensionless saturation structure efficiency, reflecting the influence of hydrocarbon distribution and pore structure on rock conduction.
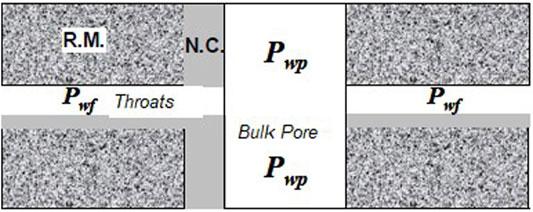
FIGURE 1. Conduction model of complex pore structure (Shang et al., 2003).
The other symbols are in accordance with the definitions of the classical Archie formula. The main feature of Eqs 1–7 is that, in the double logarithmic coordinate system, the relationship between porosity and formation factors shows as nonlinear and plotting water saturation against resistivity increase index also presents the nonlinear equation. If only straight tubular pores exist in the rock model, the equation of formation factor versus resistivity increase index can be expressed in Eqs 8, 9 (Liu et al., 2013).
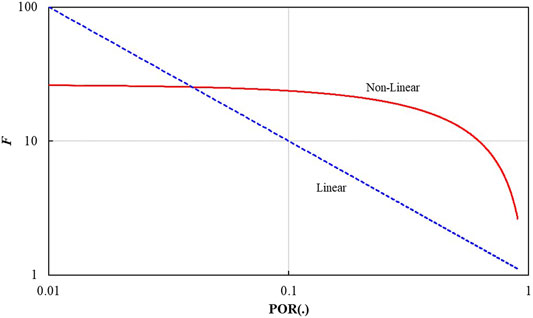
After comparing the improved EREM model with Eqs 8, 9, we can find that the linear terms of (1/φ) and (1/Sw) appear in both Eqs 1–7 and Eqs 8, 9. The expression of F in Eqs 1–7 is separated into two equations (Eqs 10, 11), then F is plotted against porosity (φ) for the two equations in the dual-logarithm coordinate frame (Figure 2). There are a nonlinear relationship and a linear relationship shown in Figure 2. The non-linear and linear ones are derived from Fc (φ) and Fd (φ), respectively.
Eqs. 8–9 have demonstrated that the linear term
Strictly speaking, when only the isolated pores exist in rock, the rock sample will be an isolator for current. The classical Archie formula, however, fails to conclude this. Meanwhile, the improved EREM model is suitable for the isolated pores, and it is equivalent to the case of C0 = 0. Thus, it can be concluded that the rock sample has no conductivity. Furthermore, the improved EREM model is also valid for conductive rocks with only straight tubular pores, equivalent to CF = ∞, CI = ∞.
By solving the quadratic equations for the variable of SW in the improved EREM model (Eq. 1), the calculation formula of SW is obtained (Eqs 12, 13).
Reservoir Classifications Based on Pore Structure
Based on the reservoir classifications of pore structure, the equations of the improved EREM are suggested in our research. Thus, it is necessary to develop a practical method to fulfill the reservoir classification in terms of pore structure before the improved EREM can be put into saturation estimations. Xue et al. presented a method to perform reservoir classifications in terms of pore structure by using the sphere–cylindrical model (2017). We will use the method to fulfill the reservoir classifications.
In studies by Xue et al., (2017), the Cd value and Cd path are employed to characterize pore structure. The Cd value is defined as the radius ratio of the tubular pore to the spherical pore, as shown in Eq. 14. The Cd path is the plot composed of Cd values and the order numbers of T2 binsets (Figure 3). In each T2 binset, the combinations of tubular pore and spherical pore are ruled by the Cd values, so the entire Cd paths of the spherical tube model describe the configurations between spherical pores and tubular pores in reservoirs. It means that the pore structures are similar in rock if they have the same and/or similar Cd paths (Xue et al., (2017)). Therefore, in this study, the Cd path can be used to judge a similar degree of pore structure. Then we can classify reservoirs into different groups according to pore structure. The classifications of Cd path express the ratio between the fracture width of and the radius of spherical pores in each group. Therefore, the Cd paths and their distribution describe the structural characteristics of pores in rock.

FIGURE 3. The Cd path composed of Cd values and the order number of T2 binsets.
A great many publications have stated, at home and abroad, including Kennedy and Herrick (2011), Song et al. (2012), and Haro (2017), that the conductivity of rock is closely related to pore structure. In other words, only on the premise of a consistent pore structure background can we have a better relationship between rock conductivity and oil-bearing properties to improve the estimations of oil saturation further. Therefore, when determining the parameters of the EREM, the data of the same working area are divided into different groups according to the classifications of pore structure. All the rock samples possess the same or similar pore structures in the same data group. Then, the improved EREM model parameters are determined for each data group (Figure 4).
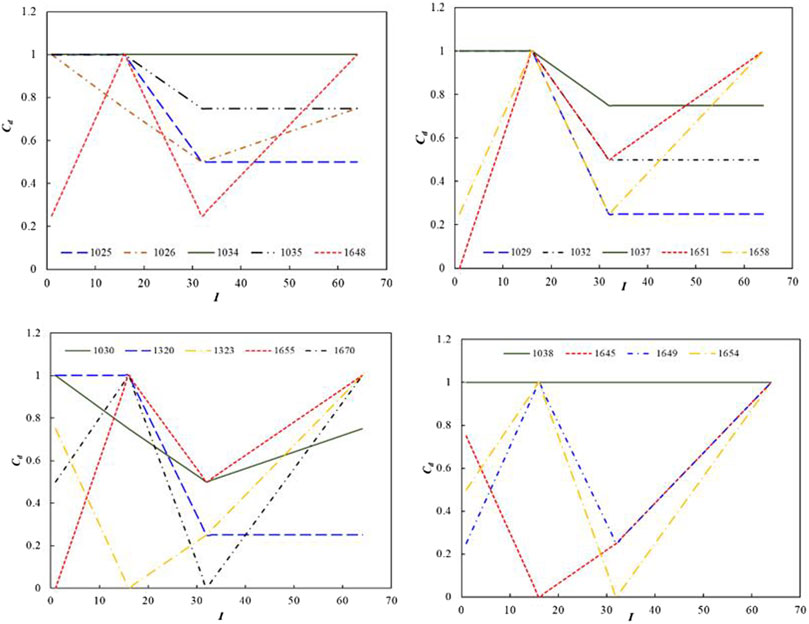
FIGURE 4. Determination of rock pore structure (Cd path) by core NMR experiments.
In the working area, the experiments of nuclear magnetic resonance (NMR) had been performed for 19 samples, and the samples were collected from Well GC10, GC13, and GC16, respectively. The spin echoes of NMR were inversed using the optimizing inversion of a spherical-fracture model (Liu et al., 2006). The Cd paths of the 19 cores were obtained in terms of NMR data (Wang and Liu, 2017). The mean square errors between every two Cd paths were calculated. The smaller the mean square error is, the more similar the Cd path is, and all the samples with fewer mean square errors are put into the same group. It should be noted that, when the parameters c and d in the EREM model are determined with the conduction data of water saturation, or the parameters e and f in the EREM model are determined with the conduction data of oil injection, at least three samples should be involved in each classification group of Cd path because there are two unknown parameters for the conduction data of water saturation. There are two further unknown parameters for the conduction data of oil injection. According to the rules above, the 19 Cd pathways in Figure 2 were divided into three groups with the less minimum mean square deviation (Table 1; Figure 5).
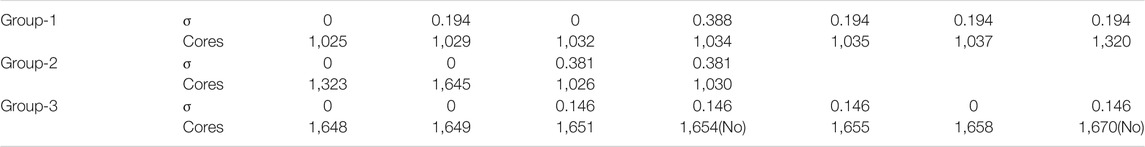
TABLE 1. Cd path classifications of NMR data in the GC working area.
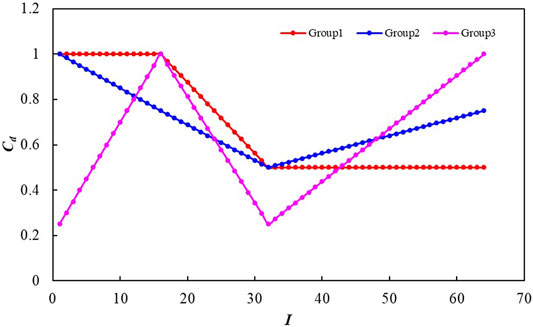
FIGURE 5. Three groups of all the 19 Cd paths.
Determining Parameters for the Improved Equivalent Rock Element Model
The constant cement and saturation indices are abandoned in the improved EREM model presented in Eq. 1. The parabolic functions characterize the influences of pore structure and fluid distribution on the conductivity of rock, making a clear physical sense. Furthermore, it is fairly simple to determine the parameters for the improved EREM model. There are four critical parameters contained in the improved EREM model, “c, d, e, f.”
To determine the parameters of c and d, it is necessary to measure the samples’ resistivity when they are fully saturated by brine for at least three or more cores. The process of parameter determination is suggested as follows:
First, the CF value of the core is calculated according to the F = R0/RW expression in Eqs 1–7.
Second, according to the calculations of the sphere-fracture model, the volumes of fracture and sphere, VFI and VSI, are calculated and C0 = VFI/VSI can obtain the value of C0. Our research showed that the median value of C0 is a good coefficient suitable for the EREM model. For example, C0 = 0.0318 for the working zone.
Third, the matrix YF (Eq. 15) is calculated according to the RF expression in Eqs 1–7.
Fourth, the matrix AF (Eq. 16) is calculated according to the porosity of the cores.
Fifth, the parameters c and d with the matrix equation in Eq. 17 are calculated,
where I is the 2 × 2 unit diagonal matrix and λ is the damping factor by which we can obtain the better stability and rationality of the calculation for Eq. 17. Suppose there is no maximum in the relationship of formation factor versus porosity; in other words, the curve of F versus φ keeps a monotonic increasing trend in the process of porosity decreasing. In that case, the damping factor λ can be taken to zero, or it is necessary to increase the value of λ gradually from zero until the bulge disappears. The parameters of the EREM model are determined by the grouping samples based on the data of 19 cores in the working area (Figures 5, 6 and Table 2).
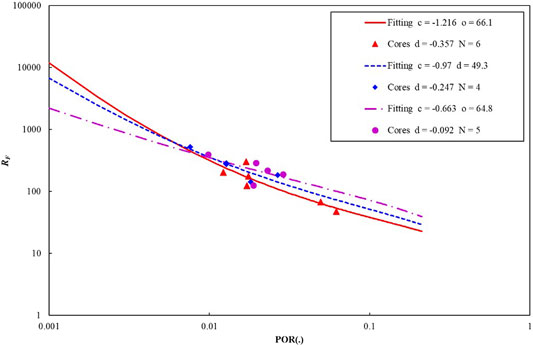
FIGURE 6. Parameters of c and d for the improved EREM model in group1, group2, and group3.
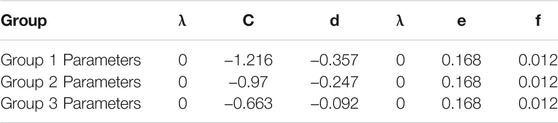
TABLE 2. Parameters of the improved EREM model and Cd path determined by the grouping samples.
After the classifications with the Cd paths, as shown in Table 2, each core data group has a typical Cd path and the corresponding parameters of c, d, e, and f. In other words, all the cores in the same group have the same or similar Cd path. Thus, all the cores in the same group will have the same or similar pore structure. Consequently, the influence of pore structure on rock conductivity in the same group can be eliminated because of the same or similar pore structure. Furthermore, the influence of porosity on rock conductivity can be highlighted. Under this condition, the formation factor is a single-valued function of porosity, meaning that the formation factor is determined by the porosity and only the porosity, as shown in Figure 5.
In the improved EREM model, the parameters of e and f are mainly utilized to characterize the distribution influence of pore fluid on rock resistivity. The determination of e and f is similar to the one of c and d. Due to the tight lithology in the study area, it is complicated to conduct displacement experiments for the shale cores. In this study, the general parameters of e and f in a similar tight gas-bearing reservoir are adopted (Table 2).
Applications of the Improved Equivalent Rock Element Model Model
This study used an iterative process to perform water saturation estimations. The iterative process is perfectly convergent after the logging calculations are completed in the working area, as shown in the chart below (Figure 7).
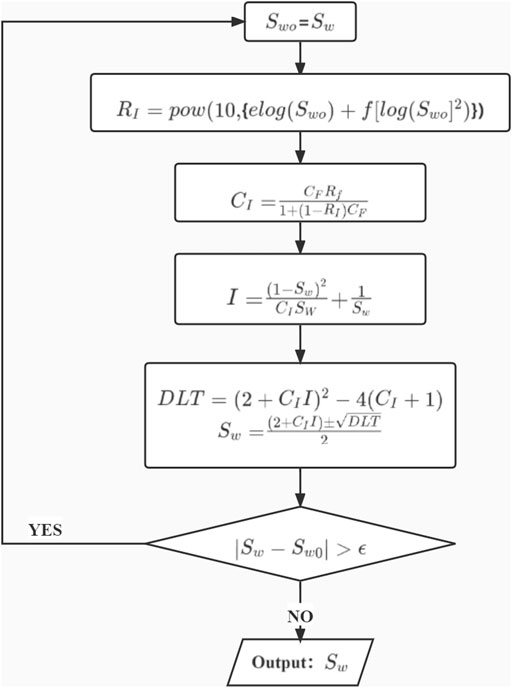
FIGURE 7. Workflow of saturation estimation of iterative calculation.
Using the improved EREM model developed in the research, we performed logging processes in 10 boreholes in the GC working area. Compared with the classical Archie formula, the saturation estimations derived from the improved EREM model tend to be more reasonable on the calculating value and number changing trend. Subsequently, the improved EREM has better application potential. Taking Well xx3 as an example in the working area, the saturation estimations are presented in Figure 8. Gas testing was carried out in the interval section from 4,011 to 4,160 m, and the daily production of natural gas was 432,000 m3. The water saturation in the same interval was between 30% and 55%, showing an excellent alignment with the gas testing data.
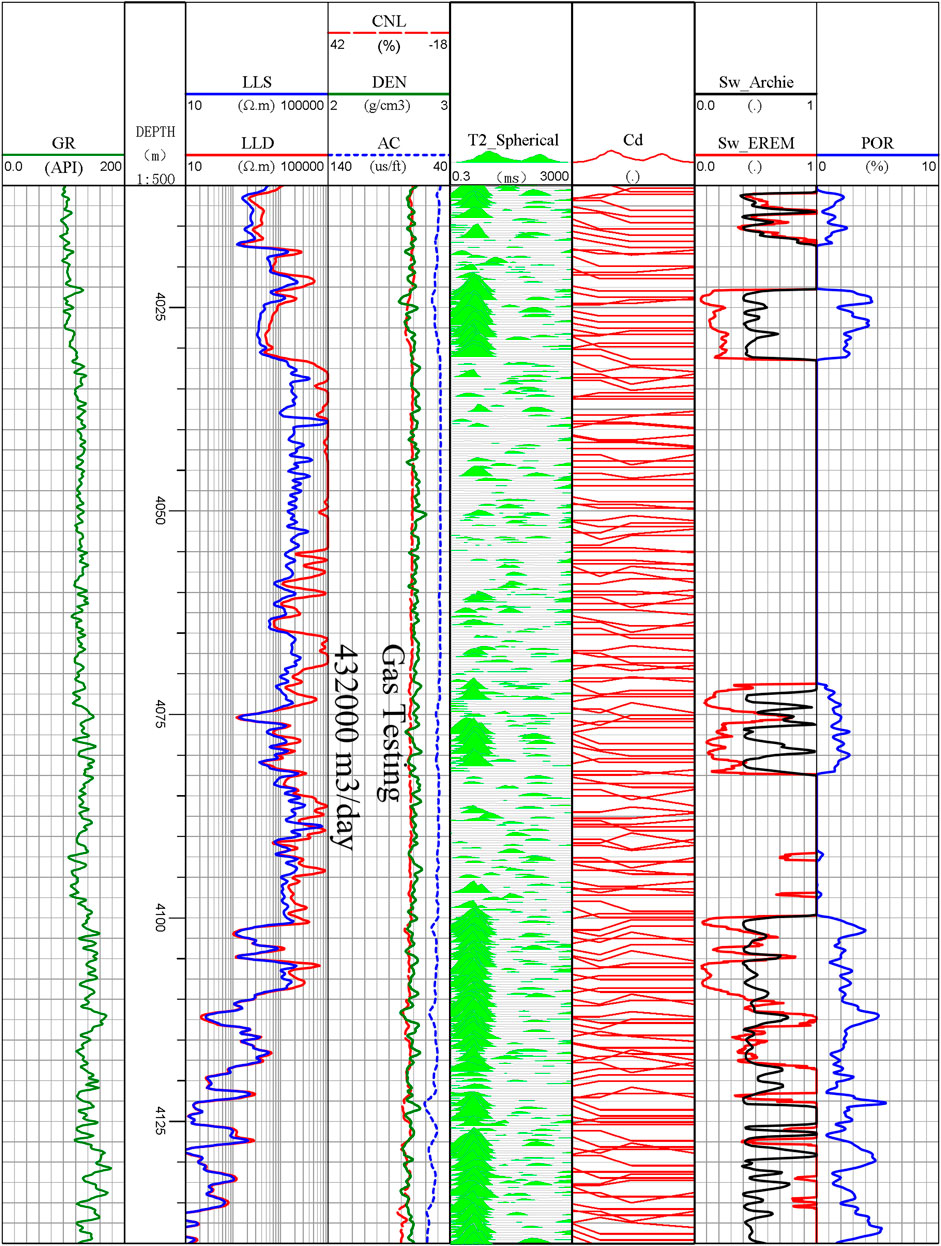
FIGURE 8. Comparison of saturation estimation between the improved EREM model and Archie model in Well XX3.
Comparing the saturation estimations from the improved EREM model with the one from the classical Archie model, the saturation estimation from the former displays better alignment with the gas-testing production in the calculating value and changing trend (Figure 8). Conclusively, the improved EREM model has better application potential in the petroleum industry to locate the right gas reserves. In addition, the variation trend of gas saturation from the former in different depths is more consistent with the natural status of pore fluids in the formation profile. On the other hand, the gas saturation derived in the classical Archie model changes sharply in the same interval section. Still, no physical mechanism of fluid existence can support such gas existence like this in reservoirs.
Conclusion and Discussion
Complex pore structure may have various effects on the rock conductivity in oil-bearing and/or gas-bearing reservoirs, including the effects of increasing or decreasing resistivity, which significantly reduces the accuracy of saturation estimation in the classical saturation model. This paper developed an improved EREM model to obtain the saturation estimations with better precision. In the improved EREM model, all pores are divided into different groups according to their structures. The pore structures are characterized by four parameters. An optimization inversion was performed for the echo data of NMR in terms of the improved EREM to gain the Cd pathways which describe the pore structures. The data processing in our research shows that the saturation estimations from the improved EREM model seem to be in good alignment with the gas production. Based on the research above, the main conclusions of this paper can be summarized as the following three points (Leung et al., 2021Spangenberg, 2001Zhang et al., 2015).
1) The improved EREM model presents a better description of the conductivity characteristics of rocks in a nonlinear way, which objectively reveal the real conductivity mechanism of complex reservoirs.
2) Based on the classifications of pore structure, the saturation parameters are determined according to different pore structures. Its essence is to peel off the influence of pore structure and fluid distribution on rock resistivity, highlighting pore fluids’ influence. Consequently, the saturation estimations are obtained with better precision for complex reservoirs.
3) Compared with the saturation estimations from the classical model, the improved EREM model shows more consistency with the physical occurrence mechanism of fluids in both the value and variation trend.
Data Availability Statement
The original contributions presented in the study are included in the article/Supplementary Material, further inquiries can be directed to the corresponding author.
Author Contributions
All authors listed have made a substantial, direct, and intellectual contribution to the work and approved it for publication.
Funding
This work is supported by the National 13th 5-Year Plan of Oil and Gas Program of China (No. 2017ZX05019-001), CNPC Research Project (No. 2017 F-16), National Natural Science Foundation of China (No. 41476027), and PetroChina Key Technological Program (No. 2016E-0503), all the research support funds are greatly appreciated.
Conflict of Interest
The authors declare that the research was conducted in the absence of any commercial or financial relationships that could be construed as a potential conflict of interest.
Publisher’s Note
All claims expressed in this article are solely those of the authors and do not necessarily represent those of their affiliated organizations, or those of the publisher, the editors, and the reviewers. Any product that may be evaluated in this article, or claim that may be made by its manufacturer, is not guaranteed or endorsed by the publisher.
Abbreviations
C0, the initial pore structure efficiency (dimensionless); CF, the initial pore structure efficiency (dimensionless); Ro, the resistivity of rock completely saturated with water (Ω.m); Rw, the resistivity of formation water (Ω.m); Rt, the resistivity of rock (Ω.m); RF, the porosity scaling factor (dimensionless); RI , the saturation scaling factor (dimensionless); F, the formation resistivity factor; I, the formation resistivity factor; c, d, the coefficients related to pore structure; Vc, the volume of fracture pore in μm3; Vs, the volume of spherical pore in μm3; e, f, the coefficients related to hydrocarbon saturation and pore fluid distributions; CI, the saturation structure efficiency (dimensionless);
References
Abousrafa, E. M., Somerville, J. M., Hamilton, S. A., Olden, P. W. H., Smart, B. D. G., and Ford, J. (2009). Pore Geometrical Model for the Resistivity of Brine Saturated Rocks. J. Pet. Sci. Eng. 65, 113–122. doi:10.1016/j.petrol.2008.12.009
Aguilera, M. S., and Aguilera, R. (2003). Improved Models for the Petrophysical Analysis of Dual-Porosity Reservoir. Petrophysics 44 (1), 21–35.
Allori, D., Bartoli, G., and Miguel, A. F. (2011). “Wind Tunnel Similitude Criteria for Fluid Flow in Macro-Porous Materials,” in Proceedings of 7th International Conference on Diffusion in Solids and Liquids, Vilamoura, Portugal, 312–313.
Archie, G. E. (1942). The Electrical Resistivity Log as an Aid in Determining Some Reservoir Characteristics. Pet. Technol. Am. Inst. Mining Metallurgical Eng. 146, 54–62. doi:10.2118/942054-g
Azar, J. H., Javaherian, A., Pishvaie, M. R., and Nabi-Bidhendi, M. (2008). An Approach to Defining Tortuosity and Cementation Factor in Carbonate Reservoir Rocks. approach defining tortuosity cementation Factor carbonate reservoir rocksJournal Pet. Sci. Eng. 60, 125–131. doi:10.1016/j.petrol.2007.05.010
Bauer, D., Youssef, S., Han, M., Bekri, S., Rosenberg, E., Fleury, M., et al. (2011). From Computed Microtomography Images to Resistivity index Calculations of Heterogeneous Carbonates Using a Dual-Porosity Pore-Network Approach: Influence of Percolation on the Electrical Transport Properties. Phys. Rev. E Stat. Nonlin Soft Matter Phys. 84, 11133. doi:10.1103/PhysRevE.84.011133
Bryant, S., and Pallatt, N. (1996). Predicting Formation Factor and Resistivity Index in Simple Sandstones. J. Pet. Sci. Eng. 15, 169–179. doi:10.1016/0920-4105(95)00066-6
Garcia, A. P., and Heidari, Z. (2021). Non-invasive Quantification of Throat-Size Distribution and Corresponding Capillary Pressure. JOURNAL PETROLEUM SCIENCE ENGINEERING 96, 1–9. doi:10.1016/j.petrol.2020.108019
Haro, C. F. (2006). “Permeability Modeling. Setting Archie and Carman-Kozeny Right,” in Paper Presented at the SPE Europec/EAGE Annual Conference and Exhibition, Vienna, Austria. doi:10.2118/100200-MS
Huang, H., Tsang, L., Colliander, A., Shah, R., Xu, X., and Yueh, S. (2020). Multiple Scattering of Waves by Complex Objects Using Hybrid Method of T-Matrix and Foldy-Lax Equations Using Vector Spherical Waves and Vector Spheroidal Waves. Pier 168, 87–111. doi:10.2528/pier20080409
Kennedy, W. D., and Herrick, D. C. (2011). Conductivity Models for Archie Rocks. GEOPHYSICS 77 (3), WA109–WA128. doi:10.1190/geo2011-0297.1
Leung, T., Tien-Hao, L., and Shurun, T. (2021). Calculations of Bands and Band Field Solutions in Topological Acoustics Using the Broadband Green’s Function-Kkr-Multiple Scattering Method. Prog. Electromagnetics Res. 171, 137–158. doi:10.2528/pier21081706
Liu, T., Zhou, C., and Zaitian, M. A., (2006). Restricted and Optimized Conditions of Sphere-Cylinder Model and its Applications [J]. Journal of Tongji University (Natural Science). doi:10.1016/S1872-2032(06)60021-8
Liu, T. Y., Tang, T. Z., Du, H. H., Zhang, H-N., and Wang, H-T. (2013). The Study of Conductive Rock Mechanism Based on Pore Structure. Chin. J. Geophys. 56 (8), 2818–2826. (in Chinese). doi:10.1002/cjg2.20062
Man, H. N., and Jing, X. D. (2000). Pore Network Modelling of Electrical Resistivity and Capillary Pressure Characteristics. Transport in Porous Media 41, 263–285. doi:10.1023/a:1006612100346
Newgord, C., Garcia, A. P., and Heidari, Z. (2020). Joint Interpretation of Electrical Resistivity and T2 NMR Measurements to Estimate Wettability and Water Saturation. SPE RESERVOIR EVALUATION ENGINEERING, 23, 772–782. doi:10.2118/200499-pa
Ramamoorthy, R., Ramakrishnan, T. S., Dasgupta, S., and Raina, I. (2021). Towards a Petrophysical Consistent Implementation of Archie’s Equation for Heterogeneous Carbonate Rocks. PETROPHYSICS 61 (5), 450–472. doi:10.30632/pjv61n5-2020a4
Shang, B. Z., Hamman, J. G., and Caldwell, D. H. (2003). “A Physical Model to Explain the First Archie Relationship and beyond, SPE 84300,” in SPE Annual Technical Conference and Exhibition held in Denver, Colorado, USA, 5-8 October 2003 (Denver, Colorado: Society of Petroleum Engineers Inc.), 1–12.
Shi, X., Wang, P., Xu, J., Yang, H., and Xu, S. (2020). “Discovery of New Oil Reserves by Combining Production Logging with Open Hole Log Interpretation in Low Resistivity Pay,” in Paper presented at the Offshore Technology Conference, Houston, Texas, USA, May 06, 2020. doi:10.4043/30644-MS
Shi, X., Zhang, J., Lu, Y., Han, Z., and He, Y. (2021). “Quantitative Evaluation of Water Flooding in a Low Resistivity Heavy Oil Reservoir with NMR and Conventional Logs,” in Paper presented at the SPE Annual Technical Conference and Exhibition, Dubai, UAE, September 23, 2021. doi:10.2118/205928-MS
Song, Y. J., Wang, X. Y., and Tang, X. M. (2012). A Saturation Interpretation Model for Low Porosity and Permeability Reservoirs Based on the Pore Geometric Conduction Theory. Logging Tech. 36 (2), 124–129. (in Chinese). doi:10.16489/.issn.1004-1338.2012.02.004
Spangenberg, E. (2001). Modeling of the Influence of Gas Hydrate Content on the Electrical Properties of Porous Sediments. J. Geophys. Res. 106 (4), 6535–6548. doi:10.1029/2000jb900434
Suman, R. J., and Knight, R. J. (1997). Effects of Pore Structure and Wettability on the Electrical Resistivity of Partially Saturated Rocks-A Network Study. Geophysics 62 (4), 1151–1162. doi:10.1190/1.1444216
Tang, J., Fan, B., Xiao, L., Tian, S., Zhang, F., Zhang, L., et al. (2021). A New Ensemble Machine-Learning Framework for Searching Sweet Spots in Shale Reservoirs. SPE J. 26 (01), 482–497. doi:10.2118/204224-PA
Valagiannopoulos, C. (2021). Designing Nanoinclusions for Quantum Sensing Based on Electromagnetic Scattering Formalism (Invited Paper). Prog. Electromagnetics Res. 170, 1–15. doi:10.2528/pier20112306
Wang, H., and Liu, T., (2017). Derivation of Archie’s Law Based on a Fractal Pore Volume. Geophys. J. Int. 209 (3), 1403–1407. doi:10.1093/gji/ggx095
Xue, M., Zhang, H., and Liu, T., (2017). Novel Method to Quantitatively Evaluate Pore Structures by Sphere-cylinder Model [J]. Well Logging Technology. doi:10.3969/j.issn.1004-1338.2014.01.009
Zhan, Q., Wang, Y., Fang, Y., Ren, Q., Yang, S., Yin, W.-Y., et al. (2021). “An Adaptive High-Order Transient Algorithm to Solve Large-Scale Anisotropic Maxwell's Equations,” in Proceeding of the IEEE Transactions on Antennas and Propagation, September 2021 (IEEE), 1. doi:10.1109/tap.2021.3111639
Zhan, Q., Zhuang, M., Mao, Y., and Liu, Q. H. (2020). Unified Riemann Solution for Multi-Physics Coupling: Nisotropic Poroelastic/elastic/fluid Interfaces. J. Comput. Phys. 402, 108961. doi:10.1016/j.jcp.2019.108961
Zhang, H. N., Tang, T. Z., Liu, T. Y., Sun, P., and Jiang, L-M. (2015). Saturation Evaluating Method Based on Pore Structure. Prog. Geophysta 30 (2), 0709–0717. doi:10.6038/pg20150231
Keywords: pore structure, NMR (nuclear magnetic resonance), echo inversion, water saturation, logging interpretation, rock conduction
Citation: Tangyan L, Qingfeng L, Cuihua Z, Wentao Y, Shiqiong L and Wenjun Z (2022) Studies and Applications of Dual Pore Saturation Model Based on Pore Structure Classification in Tight Reservoirs. Front. Earth Sci. 9:802842. doi: 10.3389/feart.2021.802842
Received: 27 October 2021; Accepted: 24 December 2021;
Published: 09 February 2022.
Edited by:
Yuwei Li, Liaoning University, ChinaReviewed by:
Yanchun Ling, University of North Carolina at Chapel Hill, United StatesQiwei Zhan, Zhejiang University, China
Xinlei Shi, China National Offshore Oil Corporation, China
Copyright © 2022 Tangyan, Qingfeng, Cuihua, Wentao, Shiqiong and Wenjun. This is an open-access article distributed under the terms of the Creative Commons Attribution License (CC BY). The use, distribution or reproduction in other forums is permitted, provided the original author(s) and the copyright owner(s) are credited and that the original publication in this journal is cited, in accordance with accepted academic practice. No use, distribution or reproduction is permitted which does not comply with these terms.
*Correspondence: Liu Shiqiong, NTMxODU1MDM2QHFxLmNvbQ==