- 1Research Institute of Petroleum Exploration and Development, China National Petroleum Corporation, Beijing, China
- 2National Energy Shale Gas Research and Development (Experiment) Center, Beijing, China
- 3PetroChina Coalbed Methane Company Limited, Beijing, China
Marine–continental transitional (hereinafter referred to as transitional) Permian shales are important targets for shale gas in China because of the considerable volumes of shale gas resources present in them. In this study, transitional shale samples from the Permian Shanxi Formation in the Daning–Jixian block along the eastern margin of the Ordos Basin were collected to investigate the effects of organic and inorganic compositions on the development of their pore structures through organic petrographic analysis, X–ray diffraction, scanning electron microscope (SEM) observation, gas (N2 and CO2) adsorption, high-pressure mercury injection (HPMI), and methane adsorption experiments. The organic petrographic analysis reveals that the Permian Shanxi shale comprises Type-II2-III kerogens, and the average vitrinite reflectance (Ro) is 2.3% at the overmature stage or in the dry gas window. The shale interval at the bottom of the lagoon facies is considered the most favorable interval throughout the entire section because of its high total organic carbon (TOC) content (4.19–43.9%; an average of 16.9%) and high brittle mineral content (38.3–73.2%; an average of 55.8%). N2 and CO2 gas adsorption and HPMI tests reveal the pore size distribution characteristics of the shale. The full pore size distribution by the gas adsorption and HPMI test reveals that micropores (<2 nm) and mesopores (2–50 nm) were dominant in the pore system, and the contributions of the two pore sizes were nearly equivalent, accounting for 21.95–55.05% (an average of 42.3%) and 37.94–64.6% (an average of 49.64%) of the total pore volume, respectively. Additionally, the pore characteristics related to different phases (mainly as silicate, clays, and organic matter) are further clarified by SEM observation and correlation analysis of phase content and pore structure parameters. OM contains numerous SEM-invisible micropores, whereas clay minerals mainly develop mesopores and small macropores (50–100 nm). Furthermore, we calculated the contribution of different shale components to shale porosity. The OM pores account for 0.26–44.1% (an average of 18.7%), and clay mineral pores account for 53.8–93.3% (an average of 76.9%) of the shale porosity. In particular, the OM contributes 73.2% to the surface area and 33.5% to the pore volume. This implies that both OM and clay minerals are important for the storage capacity of adsorbed and free gas.
1 Introduction
Organic-rich shales in China are deposited in marine, transitional, and lacustrine environments. They are characterized by their ultralow porosity and permeability because of the numerous nanopores in the shale matrix. Organic pores derived through the hydrocarbon generation process are crucial for marine shale. Previous studies have largely revealed the nanoscale pore system of mature marine shales all over the world and realized that the organic pores developed as a result of devolatilization of gaseous hydrocarbons are the dominated pore type and are responsible for the storage of shale gas to a great extent (Loucks et al., 2009; Milliken et al., 2013; Yang et al., 2013; Loucks and Reed, 2014; Wang et al., 2015; Yu et al., 2016; Guo et al., 2017; Ji et al., 2017; Nie et al., 2019; Peng et al., 2019; Xi et al., 2019). In China, the marine shale from the Lower Silurian Longmaxi Formation has been proved to be the most favorable exploitation target, and several shale-gas fields have been put into production (Yang et al., 2020). In recent years, with the support of government policies and the expansion of shale gas exploration, transitional shale has become another favorable exploration target after marine shale (Yang et al., 2019). Different from the marine shales in China that are developed in Lower Paleozoic, the transitional shales in China are mainly developed in Upper Paleozoic (Yang et al., 2017a; Yang et al., 2017b). They are characterized by a high TOC content, mixed-type kerogen, moderate thermal maturity, and high content of clay minerals, which are quite different from the case of marine shales. At present, scholars have made some fundamental studies regarding the reservoir fractal characteristics (Wang et al., 2016a; Li et al., 2019; Yin and Guo, 2019; Huang et al., 2020), mineral composition characteristics (Zhang et al., 2019), pore structure characteristics (Fan et al., 2019; Yu et al., 2019; Yang and Guo, 2020), gas-bearing properties (Dong et al., 2016; Ma et al., 2019; He et al., 2019; Wang and Guo, 2019; Cao et al. (2020)), and the criterion for selecting the favorable exploration blocks (Feng, 2014; Tang et al., 2016).
Pore structure characteristics are critical in determining the occurrence, seepage, and diffusion of shale gas. Previous research on the pore structure indicates the importance of using a low-pressure N2-adsorption experiment, which is effective in the mesopore (2–50 nm) description. Micropores (<2 nm) and macropores (>50 nm) considerably affect the content of adsorbed and free gas, respectively (Zhang et al., 2019). However, there is no full-size characterization of the pore size of the transitional shale. In addition, the influence of organic matter (OM) and the inorganic composition on the pore development of transitional shale has rarely been reported.
The Permian Shanxi Formation is widely distributed in the Ordos Basin, and industrial gas flow has been achieved by fracturing vertical wells in the Daning–Jixian block, which is regarded as one of the most important transitional shale gas targets in China. Since shale, coalbed seams, and tight sandstone are generally interbedded with each other in the Ordos Basin, strengthening the research on the transitional shale is helpful to promote the co-production of shale gas, coalbed gas, and tight sandstone gas. The purpose of this study was to investigate the composition effect on the pore size structure. The geochemical and petrological features of the Shanxi Formation are presented in Section 4.1 and Section 4.2. The full-size characterizations of the pore structures obtained via gas adsorption (CO2 and N2) and HPMI are presented in Section 4.3. The OM contribution to the pore system is discussed in Section 4.4.
2 Geological Setting
The Ordos Basin is the second largest sedimentary basin in China, covering an overall area of 25,000 km2, which can be divided into six second-order tectonic units (Figure 1A). The Daning–Jixian block is located along the southeastern margin of the Yishan slope. It is bordered to the south by the Yanchuannan block, to the north by Xixian, to the east by the Lüliang Mountains, and to the west by the Yellow River. The Daning–Jixian block comprises one depression, one uplift, and two slopes (Zhao et al., 2018). Structures are stable and less faulted within the block, and the strata are gentle.
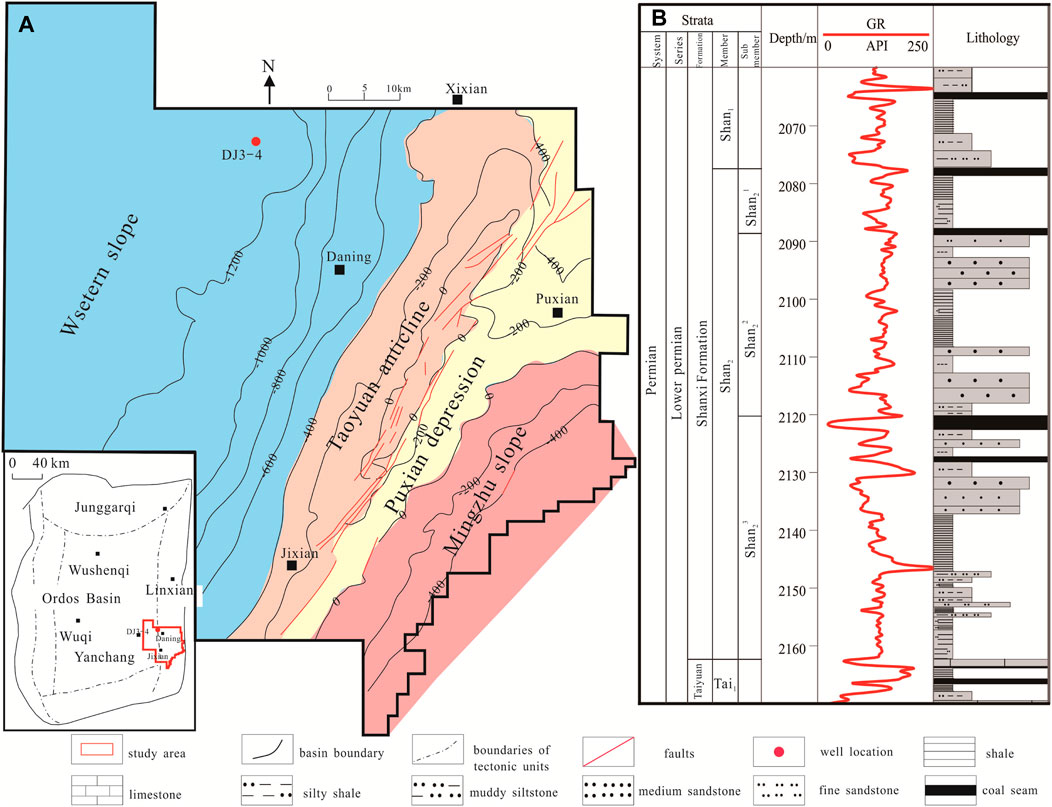
FIGURE 1. (A) Structural map of the Daning–Jixian block in the Ordos Basin and (B) stratigraphic column of the study area (the structural map is revised from Zhao et al. (2018)).
The Upper Paleozoic strata within the study area comprise the Carboniferous Benxi Formation, Lower Permian Taiyuan Formation as well as Shanxi Formation, and Middle Permian Shihezi Formation. In particular, the Shanxi Formation is deposited in transitional facies. According to the sedimentary cycles and lithologies, the Shanxi Formation can be divided into Shan 2 member and the overlying Shan 1 member. The Shan 1 member comprises mainly interbedded gray sandstone and dark gray shale, with locally developed laminated coal seams. The Shan 2 member mainly comprises dark shale and gray sandstone, with 3–5 layers of coal seams. From the bottom to top, the Shan 2 member can be further divided into three sub-members: Shan23, Shan22, and Shan21, of which Shan23 is the most favorable interval for shale gas exploration in the study area (Figure 1B). The lithology of Shan23 mainly comprises black shale, carbonaceous shale, dark gray mudstone, argillaceous siltstone, and silty mudstone. Fine sandstone, medium sandstone, and argillaceous siltstone are locally present, with five# coal seams developed on the top of the Shan23 sub-member. From the bottom to top, sedimentary facies of Shan23 comprises lagoon facies, delta facies, lagoon facies, and tidal flat facies. The lagoon facies at the bottom of the Shan23 are called the bottom lagoon facies, whereas the other lagoon facies in the middle of Shan23 are called the upper lagoon facies.
3 Samples and Experiments
A total of 95 Shan23 sub-member core samples were collected from Well DJ 3–4 in the Daning–Jixian block. The TOC and mineral composition experiments were conducted on 95 shale samples. A total of 55 of the samples were further used for kerogen maceral and vitrinite reflectance analysis, and seven of the 55 samples were used to conduct gas adsorption (CO2 as well as N2) and HPMI tests.
3.1 Organic Geochemistry
The 95 shale samples were crushed into particles smaller than the 200-mesh powder to perform TOC analysis using a Leco CS-230 carbon analyzer in accordance with the standard GB/T19145–2003. The macerals and thermal maturity of the OM were determined using a Lecia DM4500P microscope according to the standards of SY/T5125–2014 and SY/T5124–2012, respectively.
3.2 Mineral Composition
X–ray diffraction (XRD) analysis was conducted on shale samples with a powder size less than 200 mesh, using a Bruker D8 DISCOVER diffractometer in accordance with the standard SY/T5163–1995.
3.3 Pore Size Distribution
Low-pressure N2 and CO2 adsorptions were measured using a Micromeritics ASAP 2420 porosimeter and surface area analyzer based on the standard SY/T6154–1995. The samples were powdered, and less than 200-mesh particles were used to perform experiments. The samples were degassed at the temperature of 110°C for 24 h before measuring the gas adsorption. For N2 adsorption analysis, Brunauer–Emmett–Teller (BET) surface area, Barrett–Joyner–Halenda (BJH) pore volume, and pore size distribution were analyzed in this study. For CO2 adsorption, the micropore volume, micropore area, and pore size distribution were calculated using a density-functional-theory model. Mercury intrusion analysis was performed on vacuum-dried samples using a Quantachrome PoreMaster at a pressure up to 600,000 psia in accordance with the standard of GB/T20650.1–2008.
3.4 SEM
The SEM was used to observe the nanoscale pore structure. The samples were irregular and cut perpendicular to the bedding plane to a size smaller than 1 cm. Prior to SEM imaging, samples were polished with fine sandpaper and argon ions and then coated with carbon to enhance the sample conductivity.
4 Results and Discussion
4.1 Geochemical Characteristics
The measurement of 95 shale samples shows that TOC of Shan23 ranged from 0.11–43.9%, averaging 5.78%. The TOC tends to increase with the burial depth, reaching up to 43.9% at the bottom of the upper lagoon facies, and gradually decreases, reaching the lowest value on the top of the delta facies, and then remains stable in the bottom lagoon facies (Figure 2). The macerals comprise 15–76% liptinite (average 55.2%), 12–60% vitrinite (average 51%), and 5–35% inertinite (average 12.7%). Thus, the kerogen of Shan23 is mainly Type-II2 followed by a few Type-III. The vitrinite reflectance ranges from 2.1–2.61% (an average of 2.3%), indicating that the Shan23 shale is at the overmature stage or entering the dry gas window.
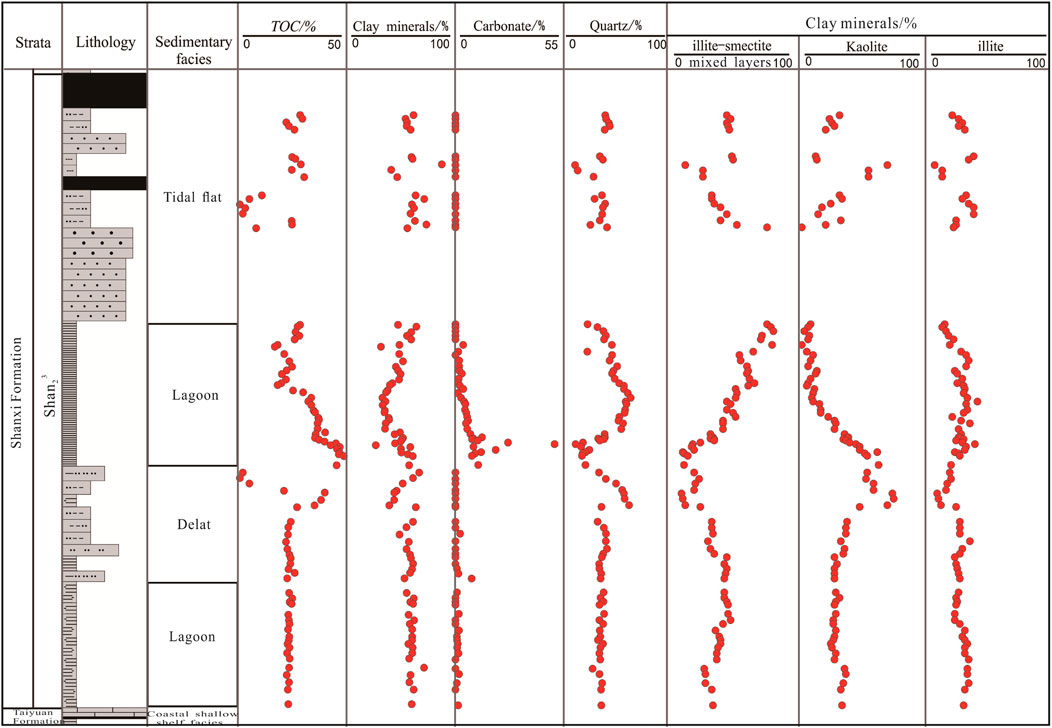
FIGURE 2. TOC content and mineral compositions of the shale reservoir in the Shan23 sub-member of Well DJ 3–4. (TOC, clay minerals, carbonate and quartz data from Zhang et al., 2021)
4.2 Mineral Composition
XRD revealed that Shan23 shale samples mainly comprise quartz and clay, accounting for 62.19–100%, averaging 92.1%. The quartz content ranged from 10.2–61.8%, averaging 37.3%, and the clay mineral content ranged from 26.8–73.7%, averaging 53%. Notably, the pyrite content and carbonate content were much greater at the lower section of the upper lagoon facies with average values of 9.8 and 14%, respectively, indicating that the lower section is probably deposited at greater water depths. The clay minerals were dominated by illite/smectite-mixed layers (7.0–80.4%, averaging 53%), illite (7–41%, averaging 26.5%), kaolinite (1.8–75.2%, averaging 30.1%), and chlorite (0–13.8%, averaging 4.8%) (Figure 2). Brittle minerals were concentrated at the bottom of the upper lagoon facies, with values ranging from 38.23–73.23%, averaging 55.76%. At the bottom of the upper lagoon facies, the TOC content ranged from 4.19–43.90%, averaging 16.87%. Because of the high TOC content and high brittle minerals, the Shan23 shale at the bottom of the upper lagoon facies is considered the most optimal shale interval throughout the entire sub-members. Thus, seven shale samples were recovered at the bottom of the upper lagoon facies for pore size distribution analysis and SEM imaging.
4.3 Pore Structure of Shan23 Shale
4.3.1 Pore Size Distribution
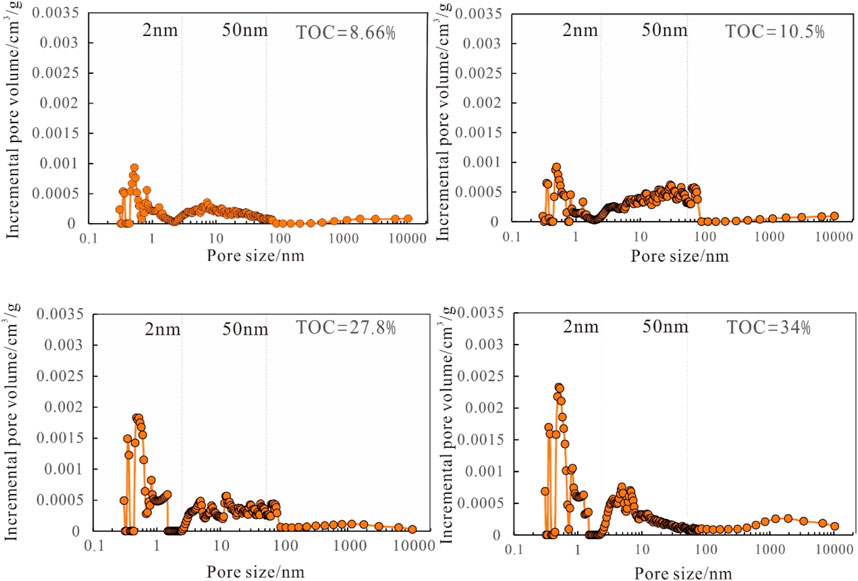
According to the International Union of Pure and Applied Chemistry pore classification, pores with a diameter <2 nm are defined as micropores, 2–50 nm as mesopores, and >50 nm as macropores. The CO2 adsorption mainly captures micropores <1.5 nm, N2 adsorption can describe mesopores, and HPMI is applicable for characterizing macropores by calculating the pore radius and mercury intrusion volume at corresponding pressure points using the Washburn equation. The overlapping section of the measured pore size was integrated by the weighted average method, whereas the nonoverlapping sections were still characterized by their own methods. Thus, the combination of the gas adsorption and HPMI allows for full-size characterization of the Shan23 shale (Figure 3).
The full-size pore size distribution curves of Shan23 shale show bimodal characteristics, and the peak values were 0.35–1.0 and 2–50 nm. The curve envelope area of the mesopores is equivalent to that of the micropores, indicating both micropores and mesopores are crucial in the total pore volume of Shan23 shale. The volume of micropores, mesopores, and macropores obtained by three different methods were analyzed and listed in Table 1. The results suggest that the pore volumes of the shale were predominately micropores and mesopores. In particular, the micropore volume ranges from 0.011 cm3/g–0.039 cm3/g (an average of 0.025 cm3/g), accounting for 21.95–55.05% (an average of 42.41%) of the total pore volume, and the mesopore volume ranges from 0.016 cm3/g–0.039 cm3/g (an average of 0.028 cm3/g), accounting for 37.97–64.60% (an average of 49.58%) of the total pore volume, whereas the macropore volume ranges from 0.001 cm3/g–0.009 cm3/g (an average of 0.005 cm3/g), accounting for 5.1–13.46% (averaging 8.01%). Figure 3 shows that there is no obvious change in the micropore volume when the increase in TOC is small. For example, the pore volume is 0.0111 cm3/g when the sample has a TOC of 8.66% and 0.0106 cm3/g at a TOC of 10.5%. Evident variation in the shale’s micropore volume occurs only with an exponential growth in the TOC. When that happens, the peak value of the mesopores shifts toward the smaller pore size, which is dramatically different from marine shale. For marine shale, the micropore volume and mesopore volume increase with an increase in TOC, and the changes are obvious (Song et al., 2020). Therefore, the micropores and mesopores of the marine shale originate mainly from pores generated by thermal evolution of OM. While for transitional shale, the pore generation ability of OM is poor, which causes no obvious increase in the micropore volume when the TOC content increases.

TABLE 1. TOC content, clay mineral content, and volumes of micropores, mesopores, and macropores of Shan23 shale.
The SEM observation of the Shan23 shale indicates that the OM was highly homogenous and was banded or massively dispersed between mineral particles. The overall development of organic pores was poor. Only a small amount of isolated elliptical pores, circular pores, and irregular pores (e.g., partially angular pores) generated by hydrocarbon generation during pyrolysis and shrinkage cracks between the edge of OM and brittle minerals developed in Shan23 shale (Figure 4). Irregular pores are often larger, whereas elliptical and circular pores are in the mesoscale. Pores <6 nm were not visible in the scanning images because of the limited resolution of the SEM. Figure 5 demonstrates the relationships between the pore volume and the major components of Shan23 shale. The TOC content is positively correlated with the micropore volume with the correlation coefficient of 0.99, indicating that the OM has an absolute control on the micropore development. However, because of the resolution limitation, the micropores developed in the OM were not observed well. Furthermore, the clay mineral content is positively correlated with the micropore volume, and the correlation coefficient was 0.49, indicating that clay minerals have a certain contribution to the development of micropores; however, their effect is limited. Alternatively, mesopores are controlled mainly by clay minerals, as indicated by a strong linear relationship with the clay content at a correlation coefficient of 0.81. The SEM images also show that mesopores were well developed in the clay minerals (Figure 6). The quartz content shows negative correlations with the micropore volume as well as mesopore volume, and the correlation coefficient of micropores reached 0.89 and the mesopores reached 0.37. The content is inversely proportional to the clay mineral content, which inevitably causes the negative correlation between the quartz content and pore volume because of the poor ability in developing pores in quartz.
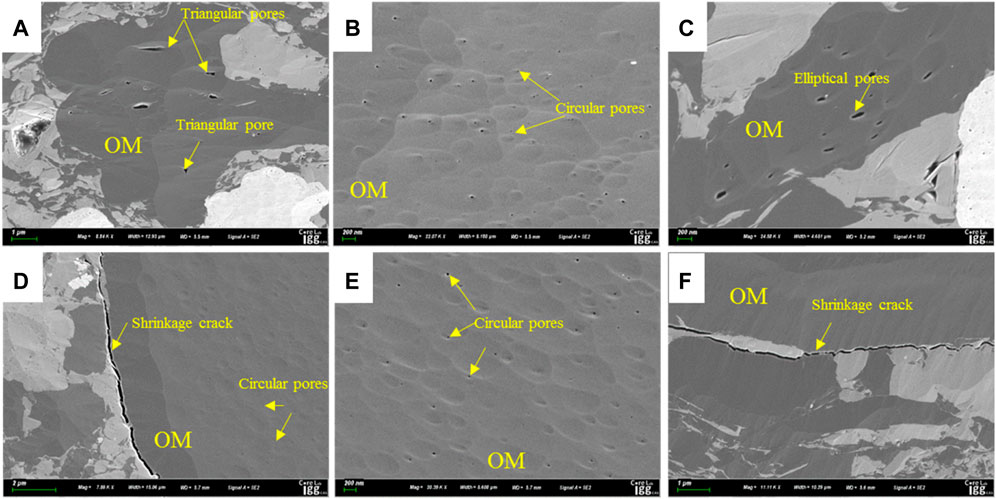
FIGURE 4. Organic pores in the Shan23 shale [(A,B) TOC = 14.4%; (C) TOC = 32.7%; (D,E) TOC = 20.5%; (F) TOC = 29.4%].
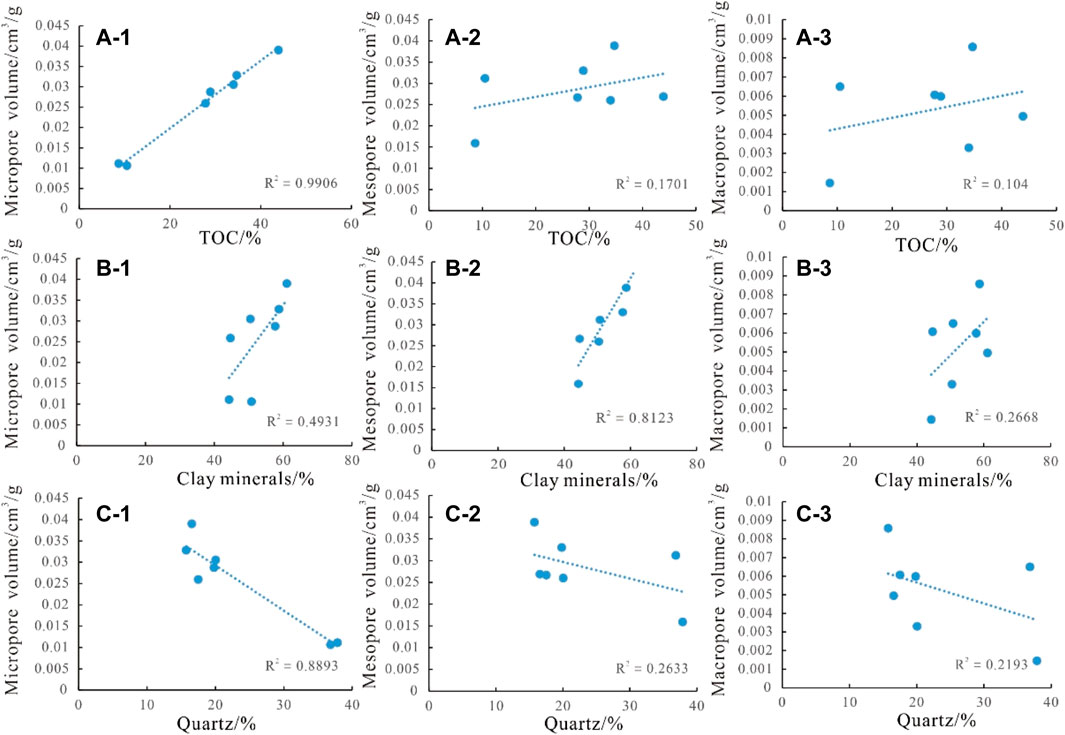
FIGURE 5. Correlation of main shale components with micropores, mesopores, and macropores for Shan23 shale [(A) TOC correlation with micropore, mesopore, and macropore volumes; (B) clay minerals correlation with micropore, mesopore, and macropore volumes; (C) quartz correlation with micropore, mesopore, and macropore volumes].
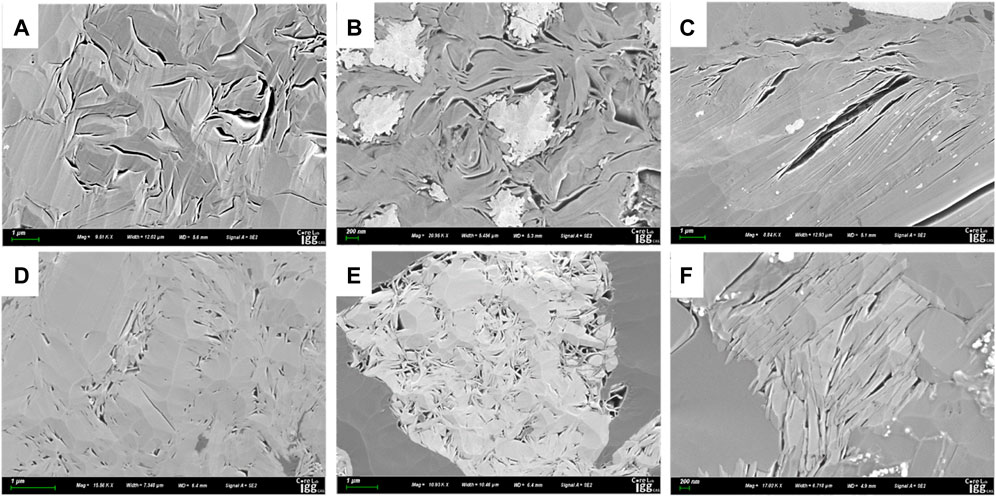
FIGURE 6. Pores developed in clay minerals [(A) 59.6% of clay minerals; intracrystalline pores in clay minerals, slender and curved in shape, and 200 nm to 2 μm length; (B) 61.1% of clay minerals; clay minerals are associated with pyrite. Interlayer fractures of clay minerals are well developed and the width of fractures is generally less than 100 nm; (C) 33.0% of clay minerals; intragranular pores of clay minerals, elongated in shape, 50–600 nm width, and 1–6 μm length; (D,E) 43.8% of clay minerals; interlayer pores of clay minerals, pore size ranges from 20–100 nm; (F) 37.7% of clay minerals; intragranular pores of clay minerals, triangular or parallel plates, 100 nm width, and 100–800 nm length).
4.3.2 Specific Surface Area Distribution
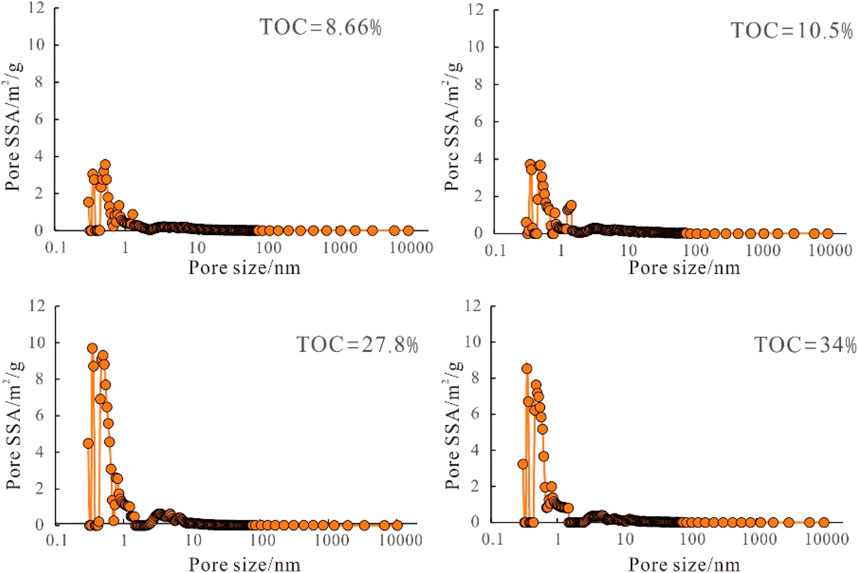
The curve of SSA over pore size obtained by gas adsorption and HPMI tests shows a unimodal distribution, and the peak value was mainly distributed over 0.35–1.0 nm (Figure 7), indicating the predominance of micropores over SSA. Similar to the pore volume distribution, SSA remains stable as TOC increases slightly. When TOC increases exponentially, SSA will change significantly, and a new peak appears in the mesopore range; however, the peak value is low, far below the SSA of micropores.
The TOC, clay mineral content, and SSA of micropores, mesopores, and macropores are listed in Table 2. The SSA of micropores ranges from 37.22 m2/g–135.78 m2/g (an average of 87.87 m2/g), accounting for 72.58–90.20% (average 82.62%) of the total SSA. The SSA of mesopores ranges from 8.13 m2/g–22.21 m2/g (an average of 15.32 m2/g), accounting for 9.81–22.79% (an average of 15.66%) of the total SSA. The SSA of macropores ranges from 0.065 m2/g–0.373 m2/g (an average of 0.24 m2/g), accounting for 0.079–0.69% (average of 0.27%) of the total SSA. Thus, the majority of SSA is contributed by micropores, and the previous analysis shows that there is a significant positive correlation between micropores and TOC content, confirming that TOC is the main factor affecting the SSA of the Shan23 shale samples.

TABLE 2. TOC content; clay mineral content, and volumes of micropores, mesopores, and macropores of Shan23 shale.
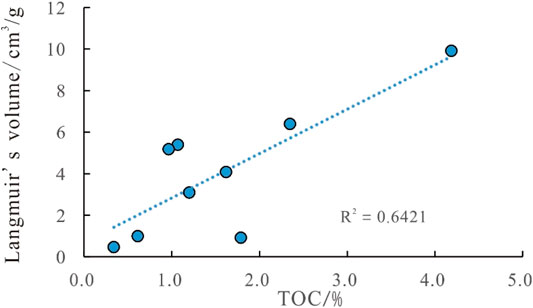
The TOC content of the samples was positively correlated with the Langmuir volume, and the correlation coefficient was 0.64 (Figure 8), which is consistent with the conclusion obtained by Cao et al. (2020) and Yang et al. (2019) regarding the relationship between adsorption capacity and TOC for the transitional Longtan shale. This reveals that Type-II2-III OM contains numerous micropores (<2 nm) that are not captured by the SEM. These micropores provide the main adsorption sites for the adsorbed gas content in shale. Therefore, the contribution of Type-II2-III OM cannot be ignored in the evaluation of the gas-bearing property of transitional shale.
4.4 Composition Effect on the Pore Structure
There are currently three methods available to understand the composition effect on the pore structure. One method is to separate the kerogen from the shale by chemical solution and then characterize the quantitative influence of the OM on the pore structure (Kuila and Prasad, 2013; Xiong et al., 2017; Yang et al., 2019; Zhang et al., 2019). The second method is to quantitatively analyze the pore characteristics of different components by the direct SEM image observation (Wang et al., 2016b; Adeleye et al., 2017; Sun et al., 2018; Zhang et al., 2018). The third method uses a mathematical model to quantitatively calculate the contribution of different components to total pore structure parameters (Wang et al., 2014). However, the process of chemical separation is complex. The use of numerous chemical additives destroys the original pore system to a certain extent and reduces the precision. The SEM method may yield nonrepresentative statistics because of the limited sample size and resolution. However, plentiful statistics are both time- and labor-consuming. Considering the limitation of the aforementioned methods, the composition effect on the pore structure was quantified in our study using the difference of shale and the third method. On the basis of brittle minerals, clay minerals, and OM, the three-layered-rock physical model of shale was established, and the corresponding calculation formula is as follows:
where ρ is the density of shale (t/m3), A is the mineral percentage (%), V is the unit mass pore volume (m3/t), and Φ is the shale porosity (%).
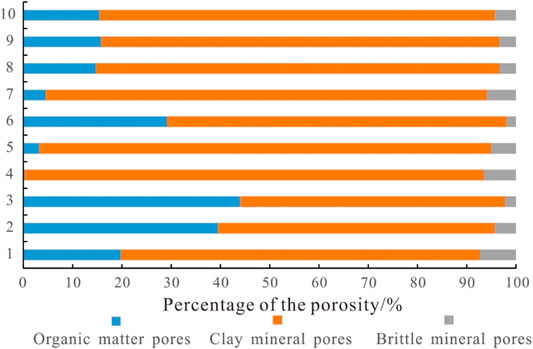
The results show that brittle mineral pores account for 1.9–7.3% (an average of 4.4%), OM pores account for 0.26–44.1% (an average of 18.7%), and clay mineral pores account for 53.8–93.3% (an average of 76.9%) of the shale porosity (Figure 9). The high contribution rate of organic pores to the total porosity is contrary to the SEM observation. Because the pores that developed in the OM were so small that they were not visible under SEM observation. Yang et al. (2019) also suggested that Type-III kerogens contain numerous SEM-invisible micropores (<2 nm). Therefore, the storage space of the Shan23 shale was dominated by clay mineral pores and OM pores. The brittle mineral is predominately quartz that has a poor ability to form pores. Thus, the quantitative research of the composition effect on the pore structure focused on the clay mineral and OM pores.
The clay mineral contents of Sample 176 and Sample 180 were nearly the same, with values of 44.31 and 44.67%, respectively. The TOC content of these two samples was 8.66 and 27.8%, respectively. The clay mineral content of Sample 184 and Sample 178 were also equivalent, with values of 50.5 and 50.8%, respectively, and the TOC content was 34 and 10.5%, respectively. These two sets of samples were used to quantify the OM pore structure. It is assumed that the pores are homogeneously developed with similar clay mineral contents; therefore, the differences in the pore volume and pore SSA of the samples were caused by the difference in the TOC content. The distributions of the pore volume and pore SSA differentials are shown in Figure 10. The difference between the two groups of the samples was arithmetically averaged to obtain the full-scale pore size distribution of per unit mass TOC (Figure 10A–1 and Figure 10A–2). The pore volume of OM shows a bimodal distribution, with two distinct peaks that appear at 0.35–1.0 nm and 2–10 nm. Micropores constitute most of the pore volume. The peak volume reaches 5.68 × 10⁻⁵ cm3/g at 0.48 nm and declines to 1.75 × 10⁻⁵ cm3/g at 4.8 nm, further confirming the contribution of the micropores. The SSA of OM is a unimodal distribution, with the peak at 0.35–1.0 nm. The peak value was 0.26 m2/g at 0.4 nm.
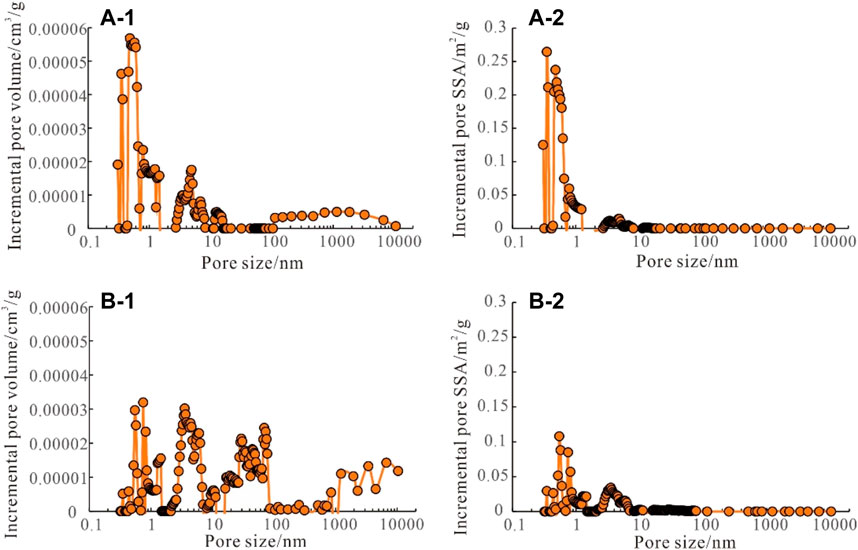
FIGURE 10. Distribution of pore volume and pore SSA over pore size of OM (A-1,A-2) and clay minerals (B-1,B-2) of Shan23 shale.
When quantifying the pore size distribution of clay minerals, the TOC content of the samples should be equivalent. The TOC contents of Sample 182 and Sample 184 were 34.7 and 34%, respectively. The clay mineral content of the two samples was 58.77 and 50.5%, respectively. Sample 188 had a TOC of 28.9% and a clay mineral content of 57.72%, whereas Sample 180 had a TOC of 27.8% and a clay mineral content of 44.67%. The difference in the TOC content between Sample 182 and Sample 184 was 0.7% and 1.1% for Sample 188 and Sample 180. As stated in Section 4.3.2, the changes in the pore volume and pore SSA are not obvious when the TOC increases slightly. Therefore, when the difference of TOC is 0.7 and 1.1%, the pores generated by OM are equivalent, and the difference in pore volume and pore area is because of differences in the clay mineral content. The pore volume and pore area generated by the difference of the clay mineral content in the two groups of samples were calculated to obtain the pore size distribution of per unit mass clay minerals (Figures 10B–1 and Figure 10B–2). The pore volume of clay minerals shows a multimodal distribution with several distinct peaks that appear at 0.35–1.0 nm, 2–10 nm, 10–100 nm, and >1,000 nm. The envelope areas of 2–10 nm and 10–100 nm peak curves were considerably larger than those of >1,000 nm and <2 nm peak curves, suggesting mesopores and small-scale macropores generated by clay minerals play a dominant role in the contribution to pore volume, which is consistent with the understanding stated in Section 4.1. The pore SSA of clay minerals shows a bimodal distribution, with two peaks that appear at 0.35–1.0 nm and 2–10 nm. However, the envelope area of the micropore curve is considerably larger than that of the mesopore curve, indicating that the SSA is provided mostly by micropores.
The influence of TOC on the pore structure was quantitatively analyzed and compared with previous studies. According to the pore volume and pore area distribution characteristics of the full-scale pore size distribution of OM, the pore volume and pore area generated by 1 g OM were 0.0008 cm3/g and 2.95 m2/g, respectively. The TOC content of the samples in this test ranges from 8.66–43.9%, and the pore area generated by OM ranges from 25.5 m2/g–129.5 m2/g (an average of 79.4 m2/g), accounting for 56.3–85.3% (an average of 73.2%) of the total pore SSA. The pore volume provided by OM pores ranges from 0.006 cm3/g–0.035 cm3/g, averaging 0.021 cm3/g and accounting for 17.4–45.5% (average of 33.5%) of the total pore volume. The contribution ratio of OM to the pore SSA obtained by the differential method in this article is comparable to the 72.37% obtained by Xiong et al. (2017) and 87% obtained by Yang et al. (2019). Both quantified the contribution ratio via chemical separation of the OM obtained from the Shanxi Formation and Longtan Formation samples, respectively. Therefore, micropores of Type-II2-III kerogen in transitional shale provide most of the shale’s SSA, even though mesopores and macropores are absent. The contribution ratio of OM to pore volume is greater than that calculated by Yang et al. (2019), possibly because the samples analyzed were recovered from the bottom of the upper lagoon facies, which contained a high TOC of 8.66–43.9% (average 26.9%). Thus, the abundance of micropores in OM results in a relatively high contribution ratio to pore volume.
5 Conclusion
As a case study, Shan23 shale was systematically analyzed for its geochemical characteristics, mineral compositions, and pore structure characteristics. The following conclusions were made:
1) Shan23 shale was characterized by high TOC (average of 5.78%), high clay mineral content (average 53%), and high maturity (average Ro of 2.3%) that indicates a dry gas window. The shale interval located at the bottom of the upper lagoon facies is considered the most optimal interval with higher TOC (4.19–43.90%; an average of 16.87%) and relatively high content of brittle minerals (38.23–73.23%; an average of 55.76%).
2) The micropore volume and mesopore volume were nearly the same, and they account for 86.5–95% (average 92.2%) of the total pore volume. Micropores are the major contributor to SSA, accounting for 76.5–89.4% (average of 83.9%) of the total SSA.
3) OM mainly contains micropores (<2 nm), and clay minerals mainly contain mesopores and smaller macropores. The calculated contribution ratio of OM to the shale’s SSA is 73.2% and that to the shale’s total volume is 33.5%. For transitional shale research, besides clay mineral pores, organic matter pores should also be given special attention to.
Data Availability Statement
The original contributions presented in the study are included in the article; further inquiries can be directed to the corresponding authors.
Author Contributions
QiZ conceived and designed the study, read and approved the final manuscript, analyzed data and interpreted the results, and prepared the manuscript. ZQ revised the manuscript and read and approved the final manuscript. QuZ sampled, analyzed the data, and read and approved the final manuscript. LZ sampled and read and approved the final manuscript. DD analyzed data and interpreted the results and read and approved the final manuscript. YW revised the manuscript and read and approved the final manuscript. SL analyzed data and read and approved the final manuscript. WH sampled and read and approved the final manuscript. XL sampled and read and approved the final manuscript.
Conflict of Interest
Authors QZ, ZQ, QZ, LZ, DD, YW were employed by the Research institute of Petroleum Exploration and Development (RIPED), China National Petroleum Corporation. Authors WH, SL, XL were employed by PetroChina Coalbed Methane Company Limited.
We declare that the research was conducted in the absence of any commercial or financial relationships that could be construed as a potential conflict of interest.
Publisher’s Note
All claims expressed in this article are solely those of the authors and do not necessarily represent those of their affiliated organizations, or those of the publisher, the editors, and the reviewers. Any product that may be evaluated in this article, or claim that may be made by its manufacturer, is not guaranteed or endorsed by the publisher.
Acknowledgments
We are grateful for the funding support from the Scientific Research and Technological Development Program of CNPC, China (2021DJ2001 and YJXK 2019-16). We thank PetroChina for permission of using the core data. We also thank Prof. Zou Caineng and Prof. Wang Hongyan for their helpful suggestions in this study.
References
Adeleye, J. O., and Akanji, L. (2017). Pore-Scale Analyses of Heterogeneity and Representative Elementary Volume for Unconventional Shale Rocks Using Statistical Tools [J]. J. Pet. Explor. Prod. Technol. 4, 1–13. doi:10.1007/s13202-017-0377-4
Cao, T. T., Cao, Q. G., Liu, H., Deng, M., and Liu, G. X. (2020). Geochemical Characteristics and Adsorption Capacity of Transitional Mudstone/shale in the Eastern Sichuan Basin [J]. J. China Coal Soc. 45 (04), 1445–1456.
Dong, D. Z., Wang, Y. M., Huang, X. N., Zhang, C. C., Guan, Q. Z., Huang, J. L., et al. (2016). Geological Characteristics, Resources Assessment Methodologies and Critical Parameters of China's Shale Gas [J]. Nat. Gas Geosciences 27 (09), 1583–1601. doi:10.11764/j.issn.1672-1926.2016.09.1583
Fan, W. T., Hu, G. H., and Wang, T. (2019). Quantitative Characterization of Pore Structure of Transitional Shale at the Eastern Margin of the Ordos Basin [J]. China Sciencepape 14 (04), 429–434.
Feng, Z. (2014). Reservoir Characteristics of and Evaluation on the Shanxi Formation Transitional Shale in the southeastern Part of the Ordos Basin [D]. Beijing): China University of Geociences.
Guo, H., Jia, W., Peng, P. A., Zeng, J., and He, R. (2017). Evolution of Organic Matter and Nanometer-Scale Pores in an Artificially Matured Shale Undergoing Two Distinct Types of Pyrolysis: A Study of the Yanchang Shale with Type II Kerogen. Org. Geochem. 105, 56–66. doi:10.1016/j.orggeochem.2017.01.004
He, Q., Dong, T., He, S., and Zhai, G. (2019). Methane Adsorption Capacity of marine-continental Transitional Facies Shales: The Case Study of the Upper Permian Longtan Formation, Northern Guizhou Province, Southwest China. J. Pet. Sci. Eng. 183, 106406. doi:10.1016/j.petrol.2019.106406
Huang, Y. Q., Zhang, P., Zhang, J. C., and Yang, J. W. (2020). Influence of mineral Compostion of marine and Transitional Shale on Their Pore Fractal Feature [J]. Bull. Mineralogy, Petrology Geochem. 39 (03), 548–557. doi:10.19658/j.issn.1007-2802.2020.39.026
Ji, L., Su, L., Wu, Y., and He, C. (2017). Pore Evolution in Hydrocarbon-Generation Simulation of Organic Matter-Rich Muddy Shale. Pet. Res. 2, 146–155. doi:10.1016/j.ptlrs.2017.07.002
Kuila, U., and Prasad, M. (2013). Specific Surface Area and Pore-Size Distribution in Clays and Shales. Geophys. Prospecting 61 (2), 341–362. doi:10.1111/1365-2478.12028
Li, Y., Wang, Z., Pan, Z., Niu, X., Yu, Y., and Meng, S. (2019). Pore Structure and its Fractal Dimensions of Transitional Shale: A Cross-Section from East Margin of the Ordos Basin, China. Fuel 241, 417–431. doi:10.1016/j.fuel.2018.12.066
Loucks, R. G., and Reed, R. M. (2014). Scanning-Electron-Microscope Petrographic Evidence for Distinguishing Organic-Matter Pores Associated with Depositional Organic Matter versus Migrated Organic Matter in Mudrocks. J. Gulf Coast Assoc. Geologica 3, 51–60. doi:10.16186/j.cnki.1673-9787.2019120015
Loucks, R. G., Reed, R. M., Ruppel, S. C., and Jarvie, D. M. (2009). Morphology, Genesis, and Distribution of Nanometer-Scale Pores in Siliceous Mudstones of the Mississippian Barnett Shale. J. Sediment. Res. 79 (12), 848–861. doi:10.2110/jsr.2009.092
Ma, R. Y., Zhang, J., Wang, M., Ma, W. P., and Zhao, J. G. (2019). Microscopic Pore Structure and Gas-Bearing Property of Transitional Shale Reservoir in the Qinshui Basin [J]. Editorial Board J. HPU (National Science) 40 (4), 1–11.
Milliken, K. L., Rudnicki, M., Awwiller, D. N., and Zhang, T. (2013). Organic Matter-Hosted Pore System, Marcellus Formation (Devonian), Pennsylvania. Bulletin 97 (2), 177–200. doi:10.1306/07231212048
Nie, H., Jin, Z., Sun, C., He, Z., Liu, G., and Liu, Q. (2019). Organic Matter Types of the Wufeng and Longmaxi Formations in the Sichuan Basin, South China: Implications for the Formation of Organic Matter Pores. Energy Fuels 33 (9), 8076–8100. doi:10.1021/acs.energyfuels.9b01453
Peng, N., He, S., Hu, Q., Zhang, B., He, X., Zhai, G., et al. (2019). Organic Nanopore Structure and Fractal Characteristics of Wufeng and Lower Member of Longmaxi Shales in southeastern Sichuan, China. Mar. Pet. Geology. 103, 456–472. doi:10.1016/j.marpetgeo.2019.03.017
Song, Y., Gao, F. L., Tang, X. L., Chen, L., and Wang, X. M. (2020). Influencing Factors of Reservoir Pore Structure Differences between marine and continental Reservoirs [J]. Acta Petrolei Sinica 41 (12), 1501–1512. doi:10.7623/syxb202012005
Sun, Y., Zhao, Y., and Yuan, L. (2018). Quantifying Nano-Pore Heterogeneity and Anisotropy in Gas Shale by Synchrotron Radiation Nano-CT. Microporous Mesoporous Mater. 258, 8–16. doi:10.1016/j.micromeso.2017.08.049
Tang, X., Zhang, J. C., Ding, W. L., Yu, B. S., Wang, L., Ma, Y. L., et al. (2016). Reservoir Property and Gas-Bearing Property of the Upper Paleozoic Transitional Shale in the southeastern Part of the Ordos Basin [J]. Earth Sci. Front. 23 (02), 147–157. doi:10.13745/j.esf.2016.02.015
Wang, J., and Guo, S. (2019). The Whole-Aperture Pore-Structure Characteristics of marine-continental Transitional Shale Facies of the Taiyuan and Shanxi Formations in the Qinshui Basin, North China. Interpretation 7 (2), T547–T563. doi:10.1190/int-2018-0157.1
Wang, Z. W., Lu, S. F., and WangTian, M. S. S. (2016a). Comparison of Pore Fractal Features for Lacustrine and marine Mudstone/shale [J]. Lithologic Reservoirs 28 (01), 88–93.
Wang, P., Jiang, Z., Ji, W., Zhang, C., Yuan, Y., Chen, L., et al. (2016b). Heterogeneity of Intergranular, Intraparticle and Organic Pores in Longmaxi Shale in Sichuan Basin, South China: Evidence from SEM Digital Images and Fractal and Multifractal Geometries. Mar. Pet. Geology. 72, 122–138. doi:10.1016/j.marpetgeo.2016.01.020
Wang, X. Z., Fan, B. J., Zhang, L. X., and Jiang, C. F. (2015). Reservoir Space Characteristics and Charging Process of Lacustrine Shale Gas –a Case Study of the Chang 7 Member in Yanchang Block in Shanbei Slope of Erdos Basin. Oil Gas Geology. 36 (4), 651–658. doi:10.11743/ogg20150415
Wang, Y. M., Dong, D. Z., Yang, H., He, L., Wang, S. Q., Huang, J. L., et al. (2014). Quantitative Characterization of Reservoir Space of the Lower Silurian Longmaxi Formation Shale in the Southern Sichuan Basin [J]. Scientia Sinica(Terrae) 44 (06), 1348–1356. doi:10.1007/s11430-013-4645-y
Xi, Z., Tang, S., Li, J., Zhang, Z., and Xiao, H. (2019). Pore Characterization and the Controls of Organic Matter and Quartz on Pore Structure: Case Study of the Niutitang Formation of Northern Guizhou Province, South China. J. Nat. Gas Sci. Eng. 61, 18–31. doi:10.1016/J.JNGSE.2018.11.001
Xiong, F., Jiang, Z., Li, P., Wang, X., Bi, H., Li, Y., et al. (2017). Pore Structure of Transitional Shales in the Ordos Basin, NW China: Effects of Composition on Gas Storage Capacity. Fuel 206, 504–515. doi:10.1016/j.fuel.2017.05.083
Yang, C., Xiong, Y., and Zhang, J. (2020). A Comprehensive Re-understanding of the OM-Hosted Nanopores in the Marine Wufeng–Longmaxi Shale Formation in South China by Organic Petrology, Gas Adsorption, and X-Ray Diffraction Studies. Int. J. Coal Geol. 218, 103362. doi:10.1016/j.coal.2019.103362
Yang, C., Xiong, Y., Zhang, J., Liu, Y., and Chen, C. (2019). Comprehensive Understanding of OM-Hosted Pores in Transitional Shale: A Case Study of Permian Longtan Shale in South China Based on Organic Petrographic Analysis, Gas Adsorption, and X-ray Diffraction Measurements. Energy Fuels 33, 8055–8064. doi:10.1021/acs.energyfuels.9b01410
Yang, C., Zhang, J. C., and Tang, X. (2013). Microscopic Pore Types and its Impact on the Storage and Permeability of continental Shale Gas, Ordos Basin. Earth Sci. Front. 20 (4), 240–250. (China University of Geosciences (Beijing); Peking University).
Yang, C., Zhang, J., Tang, X., Ding, J., Zhao, Q., Dang, W., et al. (2017a). Comparative Study on Micro-pore Structure of marine, Terrestrial, and Transitional Shales in Key Areas, China. Int. J. Coal Geology. 171, 76–92. doi:10.1016/j.coal.2016.12.001
Yang, C., Zhang, J., Wang, X., Tang, X., Chen, Y., Jiang, L., et al. (2017b). Nanoscale Pore Structure and Fractal Characteristics of a marine-continental Transitional Shale: A Case Study from the Lower Permian Shanxi Shale in the southeastern Ordos Basin, China. Mar. Pet. Geology. 88, 54–68. doi:10.1016/j.marpetgeo.2017.07.021
Yang, X., and Guo, S. (2020). Pore Characterization of marine-continental Transitional Shale in Permian Shanxi Formation of the Southern North China Basin. Energy Exploration & Exploitation 38 (6), 2199–2216. doi:10.1177/0144598720912346
Yin, L., and Guo, S. (2019). Full‐Sized Pore Structure and Fractal Characteristics of Marine‐Continental Transitional Shale: A Case Study in Qinshui Basin, North China. Acta Geologica Sinica ‐ English Edition 93 (3), 675–691. doi:10.1111/1755-6724.13856
Yu, K., Shao, C., Ju, Y., and Qu, Z. (2019). The Genesis and Controlling Factors of Micropore Volume in Transitional Coal-Bearing Shale Reservoirs under Different Sedimentary Environments. Mar. Pet. Geology. 102, 426–438. doi:10.1016/j.marpetgeo.2019.01.003
Yu, Y. X., Luo, X. R., Lei, Y. H., Cheng, M., Wang, X. Z., Zhang, L. X., et al. (2016). Characterization of Lacustrine Shale Pore Structure: an Example from the Upper-Triassic Yanchang Formation, Ordos Basin. Nat. Gas Geosci. 27 (4), 716–726. doi:10.11764/j.issn.1672-1926.2016.04.0716
Zhang, L., Dong, D., Qiu, Z., Wu, C., Zhang, Q., and Wang, Y. (2021). Sedimentology and Geochemistry of Carboniferous-Permian Marine-Continental Transitional Shales in the Eastern Ordos Basin, North China. Palaeogeogr. Palaeoclimatol. Palaeoecol. 571, 110389.
Zhang, L., Li, B., Shu, J., Lu, S., and Lei, C. (2018). Heterogeneity Characterization of the Lower Silurian Longmaxi Marine Shale in the Pengshui Area, South China [J]. Int. J. Coal Geol. 195. doi:10.1016/j.coal.2018.05.015
Zhang, Q., Xiong, X., Pang, Z., Liu, R., Liang, F., Liang, P., et al. (2019). Composition Effects on Pore Structure of Transitional Shale: A Case Study of the Upper Carboniferous Taiyuan Formation in the Eastern Uplift of the Liaohe Depression, China. Mar. Pet. Geology. 110, 638–649. doi:10.1016/j.marpetgeo.2019.07.031
Keywords: transitional shale, pore structure, composition effect, Shan23, Ordos Basin
Citation: Zhang Q, Qiu Z, Zhao Q, Zhang L, Dong D, Wang Y, Hou W, Li S and Li X (2022) Composition Effect on the Pore Structure of Transitional Shale: A Case Study of the Permian Shanxi Formation in the Daning–Jixian Block at the Eastern Margin of the Ordos Basin. Front. Earth Sci. 9:802713. doi: 10.3389/feart.2021.802713
Received: 27 October 2021; Accepted: 23 December 2021;
Published: 02 February 2022.
Edited by:
Dongdong Liu, China University of Petroleum, ChinaReviewed by:
Jianhua Zhao, China University of Petroleum (East China), ChinaChao Yang, Guangzhou Institute of Energy Conversion (CAS), China
Copyright © 2022 Zhang, Qiu, Zhao, Zhang, Dong, Wang, Hou, Li and Li. This is an open-access article distributed under the terms of the Creative Commons Attribution License (CC BY). The use, distribution or reproduction in other forums is permitted, provided the original author(s) and the copyright owner(s) are credited and that the original publication in this journal is cited, in accordance with accepted academic practice. No use, distribution or reproduction is permitted which does not comply with these terms.
*Correspondence: Qin Zhang, emhhbmdxaW4yMTY5QHBldHJvY2hpbmEuY29tLmNu; Zhen Qiu, cWl1emhlbjMxNkAxNjMuY29t
 Qin Zhang
 Zhen Qiu
 Qun Zhao1,2