 Shengjie Chen
 Zhiming Kang1,3*
 Mei Liu
 Jing Ma
95% of researchers rate our articles as excellent or good
Learn more about the work of our research integrity team to safeguard the quality of each article we publish.
Find out more
ORIGINAL RESEARCH article
Front. Earth Sci. , 31 January 2022
Sec. Atmospheric Science
Volume 9 - 2021 | https://doi.org/10.3389/feart.2021.799104
This article is part of the Research Topic Extreme Precipitation Events: Spatio-Temporal Connections, Forecasting, Generation, Impact Analysis, Vulnerability and Risk Assessment View all 13 articles
An observed fact is proposed that the 2020 record-breaking Meiyu over the Yangtze–Huaihe River Basin (YHRB) is characteristic of significant subseasonal variation. The anomalously enhanced rainfall experiences a southward retreat from the northern YHRB in June to the southern YHRB in July. The meridional shift of abnormal rainbelt is closely related to the different anomalous Meiyu front circulations. The first stage features a warm Meiyu front with an extremely strong northward transport of warm-and-wet air, whereas a cold front forms with a convergence between the strong northeasterlies and southwesterlies in July. Another significant subseasonal variation of the 2020 Meiyu is that the Meiyu rainfall evolves in a periodic quasi-biweekly oscillation (QBWO). On the scale of the QBWO, the cold air activities over East Asia contribute significantly to Meiyu; each intense southward invasion of cold air corresponds well to the enhancement of Meiyu rainfall. However, the location of the western Pacific subtropical high, the subtropical East Asia summer monsoon (SEASM), and the intensity of the East Asia subtropical westerly jet exhibit opposite QBWO characteristics in June and July. For an increasing (decreasing) of Meiyu rainfall, the western Pacific subtropical high marches northward (retreats southward), the subtropical East Asia summer monsoon weakens (strengthens), and the East Asia subtropical westerly jet accelerates (decelerates) in June. The opposite holds true in July. Further analyses reveal that the filtered cyclone over Northeast China benefiting the southward intrusion of cold air is associated with the eastward propagation of a wave train over the mid-high latitudes in June, whereas it arises from both the westward propagation of a wave train over the mid-high latitudes and the northward propagation of cyclonic circulation from the tropics in July.
Severe rainstorms and devastating floods severely hit southern Japan and the Yangtze–Huaihe River Basins (YHRB) in China in the early summer of 2020. The rainy period is the well-known Meiyu in China (also called Baiu in Japan and Changma in Korea), a typical episode in the progression of East Asia summer monsoon (EASM) (Tao and Chen, 1987; Yihui and Chan, 2005). Climatologically, Meiyu starts in mid-June and ends in mid-July. However, by the monitoring of China National Climate Center, 2020 Meiyu persists from June 1 to August 1 with an earlier onset and a later ending. The long duration and the accumulated Meiyu precipitation around the Yangtze River Basins both broke the record since 1961 (Gan, 2020; Ding et al., 2021). The anomalously enhanced Meiyu precipitation causes great losses of life and property.
In each summer, the date when Meiyu begins/ends and the Meiyu precipitation amount are the most important issue concerned by meteorological, hydrological, and other services in such regions affected by Meiyu as China, Japan, and Korea. The mechanism and prediction of Meiyu have always been the hot topic (Ninomiya, 1984; Chen and Yu, 1988; Kodama, 1992; Webster et al., 1998; Huaqiang and Yongfu, 1999; Yihui and Chan, 2005; Huang et al., 2011; Yim et al., 2015; Li et al., 2019; Ding et al., 2020).
The onset/ending time, evolution, rainfall amount, and extreme weather events during the Meiyu season are all intimately related to the circulation components of the EASM regime. Generally, the Meiyu rainbelt is anchored over the region of the zonally elongated quasi-stationary Meiyu front. The front is formed by the interaction between the warm-and-wet air masses from the tropics and the cold-and-dry air masses from the mid-high latitudes. To the south of the Meiyu front, southwesterly winds along the northwestern flank of the western Pacific subtropical high (WPSH) supply abundant warm-and-wet air to the Meiyu regions. The northerly winds in the western part of low troughs or in the eastern high ridges over the mid-high latitudes at the middle and lower tropospheres reinforce cold-and-dry air masses intruding into the north of Meiyu front. The persistent confrontation of warm and cold air contributes to the quasi-stationary rain belt (Ninomiya, 1984; Ding, 1992; Ninomiya, 2000; Ding, 2007). Variations of location and intensity of any circulation component of the EASM system could exert influence directly on Meiyu rainfall. For example, the northward shift of the East Asia subtropical westerly jet (EASWJ) to the north of the South Asian High in the upper troposphere and the poleward jump of the ridge line of the WPSH in a zonal shape would modulate the onset and ending time of Meiyu season (Tao and Chen, 1987; Yimin and Guoxiong, 2004; Zhang and Guo, 2005; Zhang et al., 2006; Xuan et al., 2011; Liu et al., 2019). The EASWJ anchors the Meiyu rainband by steering transient eddies and creating convective instability and adiabatic updrafts (Sampe and Xie, 2010; Chowdary et al., 2019; Chowdary et al., 2021). Zhou and Yu (2005) found that southwestward extension of the WPSH and southward shift of the EASWJ over East Asia are favorable for enhanced rainfall over the middle and lower reaches of the Yangtze River, whereas the northwestward extension of WPSH and an eastward shift of the EASWJ contribute to anomalous water vapor transports to the Huaihe River valley. In addition to warm and moist air affected by circulation in the tropics and subtropics, cold air intrusion associated with the mid-high latitude systems plays an equally important role in Meiyu rainfall (Lau et al., 2000; Ding et al., 2020). He et al. (2007) proposed that the frequent activity of the Northeast Cold Vortex, a crucial circulation system over Northeast Asia, is advantageous to more Meiyu rainfall.
The forecast of Meiyu and the associated rainstorms remains challenging, as Meiyu precipitation is characterized by multi-time scale variabilities. Significant differences exist in the influencing factors and the physical mechanisms of Meiyu’s interdecadal, interannual, and subseasonal variations (Ding et al., 2020). On the interannual timescales, external forcings such as El Niño–Southern Oscillation over the Pacific Ocean (Wang et al., 2009; Kosaka et al., 2011; Zhu et al., 2013), sea surface temperature (SST) anomalies over the Indian Ocean (IO) (Xie et al., 2009; Wang et al., 2013; Xie et al., 2016; Takaya et al., 2020), Kuroshio SST front over the East China Sea (Xu et al., 2018), and snow cover of the Tibetan Plateau (Ge et al., 2014; Liu et al., 2014) have been verified to exert important impacts on Meiyu rainfall through air–sea coupling or atmospheric teleconnections. The Madden–Julian Oscillation (Li et al., 2018), the intraseasonal oscillation of EASM (Chen et al., 2015; Li et al., 2015; Song et al., 2016), and the summer North Atlantic Oscillation (NAO) (Bollasina and Messori, 2018; Liu et al., 2020) are viewed as crucial factors that modulate the subseasonal variation of Meiyu rainfall.
Considering the significant extremity, 2020 Meiyu is termed as a super Meiyu. The characteristics and the mechanisms of 2020 super Meiyu have been extensively examined (Li et al., 2020; Liu and Ding, 2020; Takaya et al., 2020; Ding et al., 2021; Guo et al., 2021; Niu et al., 2021; Pan et al., 2021; Zhou et al., 2021). Quite a few studies attribute the excessive rainfall over YHRB to an enlarged WPSH caused by the persistent warming over the tropical IO (Takaya et al., 2020; Ding et al., 2021; Niu et al., 2021; Pan et al., 2021), as well as a La Niña-like SST anomaly forcing in the equatorial Pacific (Pan et al., 2021). However, few details in the subseasonal variability of the 2020 Meiyu have been reported. As a matter of fact, a number of studies based on historical data showed that Meiyu is characterized by low-frequency oscillations with periods of 30–60 and 10–20 days [quasi-biweekly oscillation (QBWO)] (Lau and Li, 1984; Liang and Ding, 2012; Ding et al., 2020). Therefore, this study focuses on the characteristics of the subseasonal variation in 2020 Meiyu rainfall.
The rest of this paper is organized as follows. The data and methods are introduced in Data and Method. The Results and Analysis describes the characteristics and cause of the meridional migration of the 2020 abnormal Meiyu rainbelt from June to July and reveals a QBWO feature of daily Meiyu rainfall intensity and the corresponding atmospheric circulation characteristics. The Conclusions and Discussions contain some concluding remarks and a discussion of the results.
To identify the characteristics of Meiyu rainfall over YHRB in 2020, we used the daily rainfall data at 2,417 meteorological stations from 1961 to 2020 provided by the National Meteorological Information Center in China. The representative stations for monitoring Meiyu are 277 observation stations over YHRB according to China National standard GB/T 33671–2017. The daily circulation data at 02:00, 08:00, 14:00, and 20:00 Beijing local time in 2020 with a horizontal resolution of 1° × 1° is derived from the fifth generation of European Centre for Medium-Range Weather Forecasts (ECMWF ERA-5) atmospheric reanalysis data (Hersbach et al., 2020).
The start and end dates of Meiyu are defined in the China national standard (GB/T 33671–2017) and released by China National Climate Center. The 277 observation stations over YHRB in China are representative for monitoring Meiyu (Supplementary Figure S1). The daily Meiyu intensity is defined as the precipitation averaged over all the monitoring stations. The daily circulation is calculated by averaging the values four times in a day. The climatological mean state of each circulation variable is defined by the arithmetic mean of 1981–2010. Anomalies of variables are calculated as differences between the original data and the climatic means. The local wavelet power spectrum (Torrence and Compo, 1998) and the noise power spectrum analysis (Schulz and Mudelsee, 2002) are applied to show the significant timescale of the daily averaged Meiyu rainfall in 2020. The QBWO component of each variability is extracted by the Lanczos bandpass filter (Trenberth, 1984), retaining fluctuations with a period of 8–16 days.
The 2020 Meiyu is labeled by a rarely long duration and record-breaking precipitation accumulation (Figure 1). Statistically, the total Meiyu amount reaches the extreme value with a standardized anomaly of 3.46, well breaking the record since 1961 (Figure 1A). The super 2020 Meiyu is mainly attributed to the frequent rainstorm processes with the severest intensity of approximately 38 mm at per Meiyu monitoring station. Removing the high-frequency weather signals within 3 days, there are seven peaks of heavy rainfall processes during the whole rainy season (Figure 1B). The Meiyu season persists in the whole of June and July of 2020 with extensively positive rainfall anomalies over the YHRB (Figure 2). The heaviest accumulated Meiyu precipitation is more than 800 mm, with the anomaly percentage exceeding 100% along the middle and lower reaches of the Yangtze River (Figures 2A–D). A robust subseasonal variation of the anomalous rainband is detected that the anomalous precipitation center shifts southward from June to July (Figures 2B, C, E, F). In the first stage, the northern edge of precipitation over 200 mm extends to 35oN over East China, far exceeding the northern boundary of the climatological 200-mm contour. The two above-normal rainbands occur along the Huaihe and Yangtze River Basin, respectively (Figure 2E). In the later period, although the northern edge of rainbelt maintains over 35oN in agreement with the march of climatological rainbelt, the total rainfall amount over the Yangtze River Basin and the Jiang Nan Area is much heavier with anomalies exceeding the climate mean by 200% (Figure 2F).
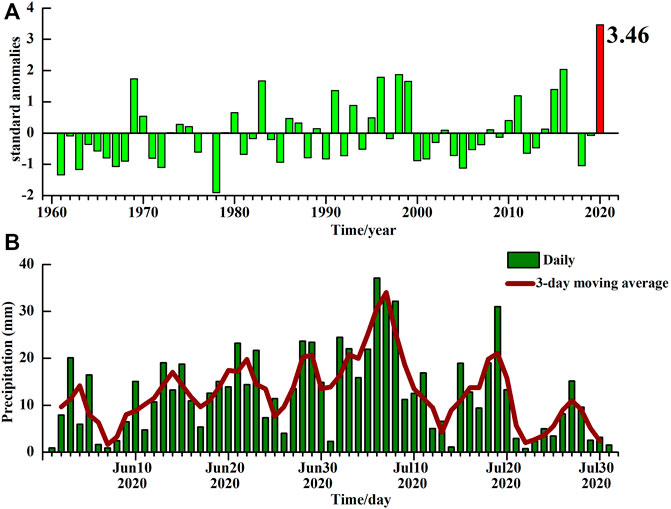
FIGURE 1. (A) Interannual variations of standardized anomalies of total precipitation of June–July averaged at 277 observation stations over Meiyu monitoring area in China from 1961 to 2020. Value in 2020 is labeled. (B) Daily (bars) and 3-day moving mean (curve) precipitation averaged at 277 observation stations over Meiyu monitoring area in China from June 1, 2020, to July 31, 2020.
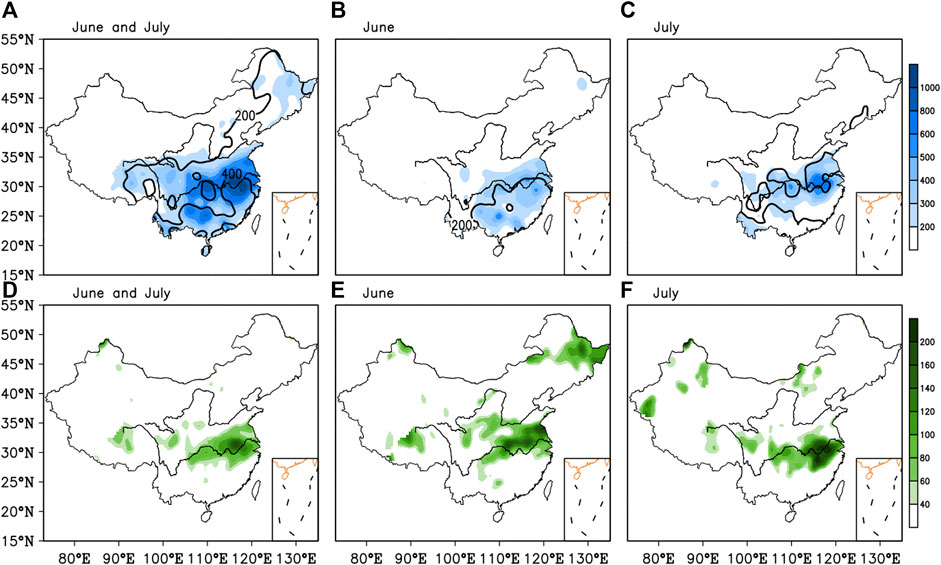
FIGURE 2. Accumulated precipitation (shaded in A–C, unit: mm) and anomaly percentage of precipitation (shaded in D–E, unit: %) in June–July (A,D), June (B,E), and July (C,F) in 2020 over 2,417 stations of China. Contours in A–C are climatological mean precipitation of more than 200 mm with intervals of 200 mm. Climatology of precipitation is calculated from 1981 to 2010.
As a typical stage of the EASM, Meiyu precipitation is a product of the interactions of circulation systems over the tropical, subtropical, and mid-high latitudes (Ninomiya, 1984; Tao and Chen, 1987; Ding, 1992; Yihui and Chan, 2005; Ding, 2007; Ding et al., 2018). The common Meiyu circulation pattern includes the WPSH in a zonal shape with warm and moist air transport in its northwestern flank, blocking-type circulation at the high latitudes and a low trough at the middle latitudes tending to carry cold and dry air. Owing to the necessity of good dynamic lifting conditions, the Meiyu rainbelt is generally located at the right entrance of the upper-level jet and the left exit of the lower-level jet. The typical circulation background summarized above applies for the 2020 Meiyu but cannot explain its extremity. Composite circulation anomalies in June and July show the possible cause of the extremely heavy and persistent Meiyu rainfall (Figures 3, 4). During the whole Meiyu season, the anomalous anticyclone over the western North Pacific (WNPAC) induces the westward and northward expansion of WPSH (Figures 3A, 4B). Correspondingly, the lower-level southwesterly winds in the northwestern flank of the WNPAC accelerate the transport of warm-and-wet air into the YHRB (Figures 3C, 4C). As is known that the WNPAC could be maintained by the local air–sea interaction in the western Pacific ocean or the “relay” role of the tropical Indian Ocean during El Niño decaying summers (Xie et al., 2009; Xie et al., 2016). By analyzing the evolutions of SST anomaly (SSTA) over the Indo and Pacific Ocean from 2020 January to July (Supplementary Figure S2), it is found that the basin-wide tropical IO warming persists from the winter to early summer of 2020 and a quick phase transition of an El Niño-like SSTA pattern over the equatorial central Pacific in the winter of 2020 to a La Niña-like SSTA pattern in the equatorial eastern Pacific in early summer. In agreement with Pan et al. (2021), both the warm SST anomaly forcing in the tropical Indian Ocean and the La Niña-like SST anomaly in the equatorial Pacific contribute to the formation and maintenance of the WNPAC. Additionally, the upper-level jet maintains at the climatological position with a much stronger intensity, favoring the persistence of 2020 Meiyu (Figures 3B, 4B). The vertical circulation structure illustrates a stronger baroclinicity with southerly anomalies at the lower troposphere and northerly anomalies at the higher levels over the subtropics, boosting the classical monsoon circulation and promoting the above-normal ascending motion over the Meiyu region (Figures 3D, 4D).
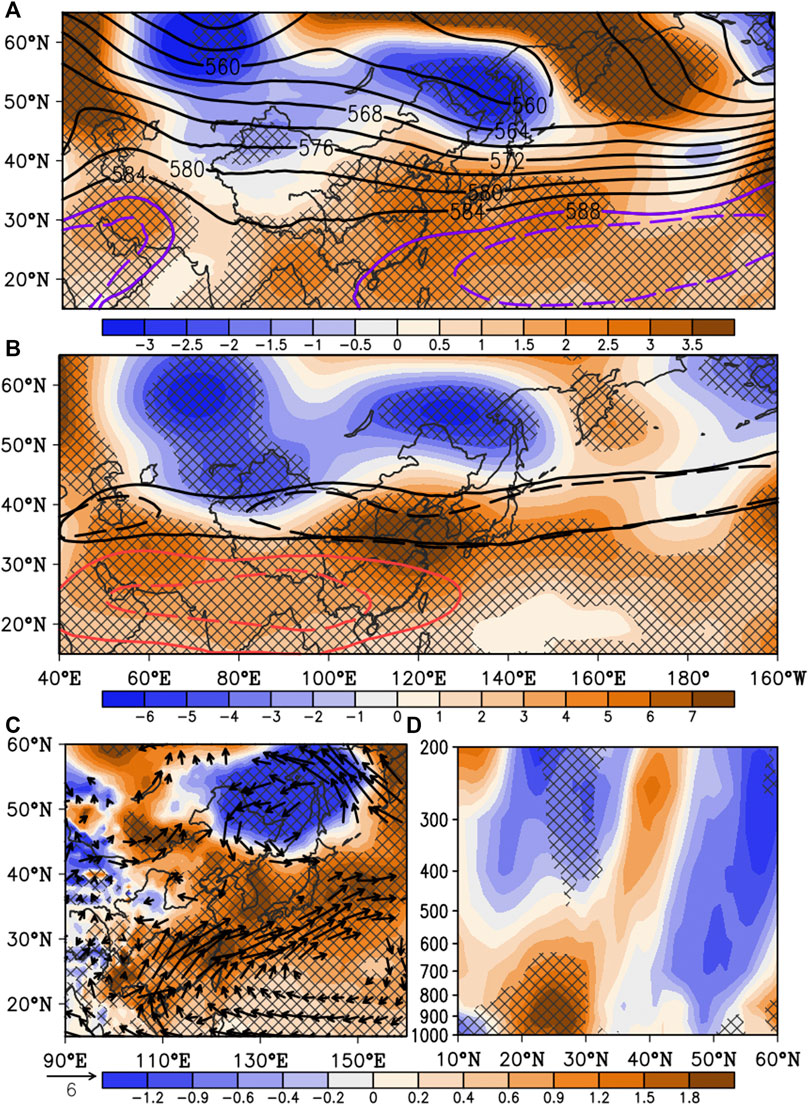
FIGURE 3. (A) Composites of original values (contours, unit: dagpm) and anomalies (shaded, unit: dagpm) of 500-hPa geopotential heights averaged from June 1 to June 30, 2020. Purple solid and dashed lines are 2020 and climatological 588-dagpm contour of 500-hPa geopotential heights, respectively. (B) Composite anomalies of 200-hPa geopotential heights (shaded, unit: dagpm) averaged from June 1 to June 30, 2020. Black solid and dash lines are 2020 and climatological 30 m s-1 contour of 200-hPa zonal winds, respectively. Red solid and dash lines are 2020 and climatological 1,252-dagpm contour of 200-hPa geopotential heights, respectively. (C) Composite anomalies of 925-hPa air temperature (shaded, unit: °C) and winds (unit: m s-1 ). Only anomaly winds value exceeding 0.05 significance level is shown by vectors. (D) Vertical section of composite anomalies of meridional winds (unit: m s-1) averaged over East Asia along 105oE–135oE. Crossed area in each panel denotes anomalies exceeding 0.05 significance level.
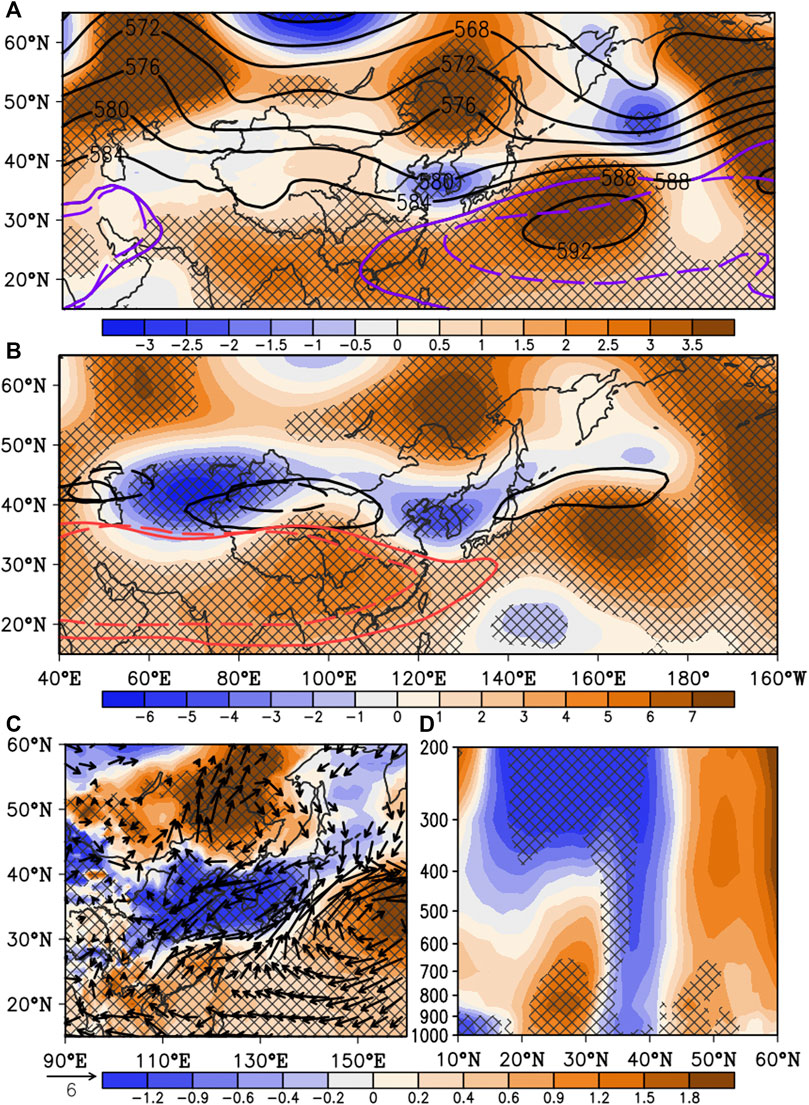
FIGURE 4. As in Figure 3 but for composite analysis from July 1 to July 31, 2020. (A) Composites of original values (contours, unit: dagpm) and anomalies (shaded, unit: dagpm) of 500-hPa geopotential heights averaged from June 1 to June 30, 2020. Purple solid and dashed lines are 2020 and climatological 588-dagpm contour of 500-hPa geopotential heights, respectively. (B) Composite anomalies of 200-hPa geopotential heights (shaded, unit: dagpm) averaged from June 1 to June 30, 2020. Black solid and dash lines are 2020 and climatological 30 m s-1 contour of 200-hPa zonal winds, respectively. Red solid and dash lines are 2020 and climatological 1,252-dagpm contour of 200-hPa geopotential heights, respectively. (C) Composite anomalies of 925-hPa air temperature (shaded, unit: °C) and winds (unit: m s-1). Only anomaly winds value exceeding 0.05 significance level is shown by vectors. (D) Vertical section of composite anomalies of meridional winds (unit: m s-1) averaged over East Asia along 105oE–135oE. Crossed area in each panel denotes anomalies exceeding 0.05 significance level.
Despite the similarity of the atmospheric circulation anomalies in June and July, there exist distinct differences, which are responsible for the subseasonal variation of the anomalous 2020 Meiyu rainbelt location (Figures 3, 4). In June, the quasi-barotropic positive geopotential height anomalies (GHAs) associated with anticyclonic anomalies (ACA) and negative GHAs related to cyclonic anomalies (CA) cover the South China Sea-western Pacific and the northern Asia continent, respectively, presenting a meridional dipole pattern. The positive GHAs of this dipole pattern, that is the WNPAC, contribute to the enhancement, northward expansion, and westward (eastward) extension of WPSH [South Asian High (SAH)], favoring the dynamic conditions for the abundant Meiyu rainfall over the YHRB and inducing the northward march of the anomalous rainbelt (Figures 3A,Β). Although the quasi-barotropic negative GHAs of the dipole pattern over Northeast Asia and West Siberia favor the anomalous cold air accumulation in the high latitudes (Figure 3A−C), northerly anomalies to the north of the Meiyu rainbelt are relatively weak in June (Figures 3C,D), indicating the weak southward intrusion of cold air to the north of Meiyu front. The enhanced Meiyu is mainly attributed to the energetic northward warm-and-wet air transport from the lower latitudes (Figures 3C,D). The front edge of significantly abnormal lower-level southwesterly wind extends northward to 34°N. The dominance of the abnormally warm air suggests a warm Meiyu front feature.
Comparatively, in July, a meridional tripole seesaw pattern of anomalous circulation appears with positive GHAs (ACA) over the South China Sea-western Pacific, negative GHAs (CA) at the middle latitudes over Asia, and positive GHAs (ACA) at the high latitudes, resembling the Pacific–Japan pattern (Nitta, 1987) or the East Asia–Pacific pattern (Ronghui and Yifang, 1989; Huang and Sun, 1992) (Figure 4). Positive GHAs at the high latitudes centered over Northeast Asia and West Siberia indicate more active blocking highs over the mid-high latitudes. Positive GHAs at the lower latitudes cause an intensification and a westward (eastward) extension of the WPSH (SAH). With the obstruction of negative GHAs over the Sea of Japan–North China and the southward migration of the western WNPAC over the South China Sea, the 588-dagpm contour of WPSH features a weak northward expansion, and the ridge line of the western WPSH obviously retreats to the south of the climatological position in July (Figures 4A,B). This large-scale abnormal circulation is favorable for the southward shift of the rainband in July. In contrast to that, in June, the quasi-barotropic CA structure moves southward and maintains to the north of the Meiyu front. Accordingly, the anomalous northerly winds in the western flank of the CA bring cold-and-dry air into the YHRB and converge with the warm-and-moist air from the lower latitudes (Figures 4C,D). In this stage, the southward intrusion of cold air is remarkably enhanced, favoring the formation of a cold Meiyu front.
The 2020 Meiyu begins with a rapid northward march into the Huaihe River basin and experiences a meridional swing with the above-normal rainbelt from the northern YHRB in June to the southern YHRB in July. The two different structures of the Meiyu front regime are responsible for the subseasonal variation of the Meiyu rainband location. The enhanced Meiyu over the northern YHRB in June is primarily due to the extremely vigorous activity of northward warm air transporting moisture, whereas the abnormally abundant Meiyu over the southern YHRB in July is attributed to the significantly southward intrusion of cold air and the intimate meeting of anomalous cold and warm.
Since the 2020 Meiyu has witnessed an obvious subseasonal variation (Figure 1B), we further investigated the subseasonal variability of mean Meiyu intensity using the period analysis methods. The Morlet wavelet analysis reveals that two significant periods dominate the 2020 Meiyu rainfall processes: 2–4 and 8–16 days (Figure 5A). The former is a high-frequency oscillation associated with synoptic transient eddies. The range of 8–16 days, about 2 weeks, is classified as an important low-frequency fluctuation time window on the subseasonal scale. In other words, the QBWO is significant in 2020 Meiyu intensity. The same results can be obtained in the noise power spectrum analysis of the daily Meiyu precipitation (Figure 5B−D). Both period windows of 2–4 and 8–16 days are obviously exceeding the red noise spectrum and the 90% confidence level, except that the range of 8–16 days in June is less than the 90% confidence level. After filtering out the high-frequency signal by the 3-day moving average of daily precipitation, the period of 8–16 days notably exceeds the 95% confidence level and acts as the primary period of Meiyu precipitation during 2020 June–July (Figure 5E). Considering that the 2020 Meiyu is attributed to frequent heavy rainfall processes, the period analyses were also conducted to the daily number of a rainstorm (daily rainfall ≥ 50 mm) and heavy rainstorm (daily rainfall ≥ 100 mm) stations (Figure 5F−G). The period of 2 and 4 days and approximately 2 weeks are all above the noise thresholds for the rainstorm events. For rainstorms, 2 and 4 days associated with the high-frequency variation are much more evident, whereas, for the heavy rainstorm events, the QBWO is the most significant low-frequency component, by far exceeding the 95% confidence level. Therefore, rainfall variabilities with 8–16 days are a crucial period for the alarming 2020 Meiyu, especially for the severe rainstorm events, which require more attention when producing the medium and extended range forecast of rainfall.
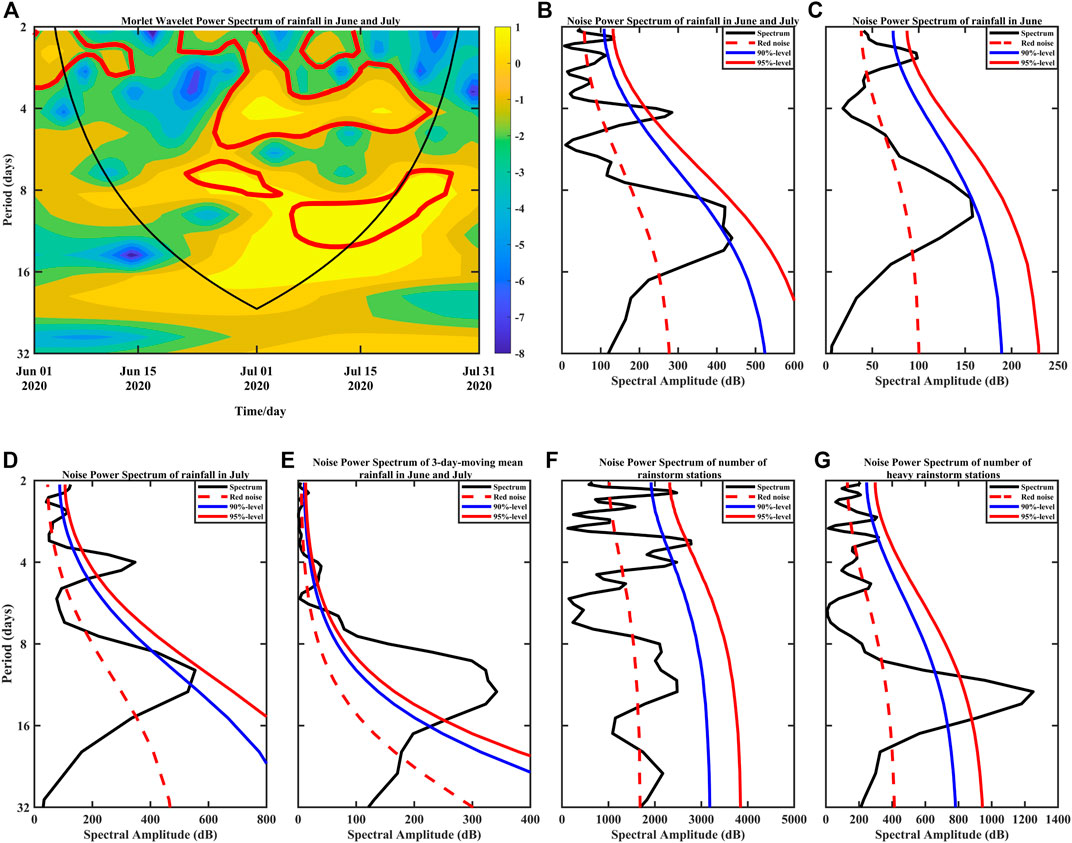
FIGURE 5. (A) Local wavelet power spectrum of series of daily averaged precipitation from June 1, 2020, to July 31, 2020, in Figure 1B using Morlet wavelet analysis (thick red contour encloses regions of greater than 95% confidence for a red-noise process). (B) Noise power spectrum analysis of series of daily mean precipitation in Figure 2B (dashed red line is for red noise spectrum). Solid blue/red line is for 95/90% confidence level for spectrum. (C) as in (B) but for series of precipitation in June 2020. (D) as in (B) but for series of precipitation in July 2020. (E) as in (B) but for series of daily 3-day moving mean averaged precipitation in Figure 2B. (F) as in (B) but for series of daily number of rainstorm (daily rainfall ≥ 50 mm) stations. (G) as in (B) but for series of daily number of heavy rainstorm (daily rainfall ≥ 100 mm) stations.
The QBWO of Meiyu has been investigated by previous studies (Lau and Li, 1984; Liang and Ding, 2012; Ding et al., 2020). How much is the contribution of the QBWO component to the total rainfall amount? How strong is the QBWO of 2020 Meiyu? The intensities of the QBWO of Meiyu precipitation (QBWOI) are defined by calculating the variance of the daily series of 8–16-day Lanczos filter value of daily total precipitation over Meiyu monitoring regions for a specified period. For example, the QBWOI in June–July is referred to as the variance of the daily 8–16-day Lanczos filter precipitation averaged over 277 observation stations from June 1 to July 31, 2020. It is found that the QBWO component can explain 22% of the total variability of the 2020 Meiyu when calculating the variance contribution. The past 60 years have witnessed an obvious increasing tendency of the standardized QBWOI in both June and July since 1961, which passes the 95% confidence level (Figure 6A). A closer look finds a turning point in the early 1980s for the tendency of the QBWOI in both June and July using the Manner–Kendall test. From 1961 to 1979, the QBWOI in June–July, especially in June (Figure 6B), is characterized by a significantly decreasing tendency. In contrast, since 1981, the QBWOI is obviously intensified in June–July, especially in July (Figure 6C). The QBWOI in June–July of 2020 is abnormally high with a standardized anomaly of 1.54, ranked at the sixth place in history. Specially and interestingly, the QBWOI in July is markedly stronger than normal with a standardized anomaly of 3.16 and breaks the record, although the QBWOI in June is weaker than normal. It is noted that the significant subseasonal characteristic of QBWO is also presented in some other extreme Meiyu rainfall events such as 1998, 1999, and 2016 (Figure 6A).
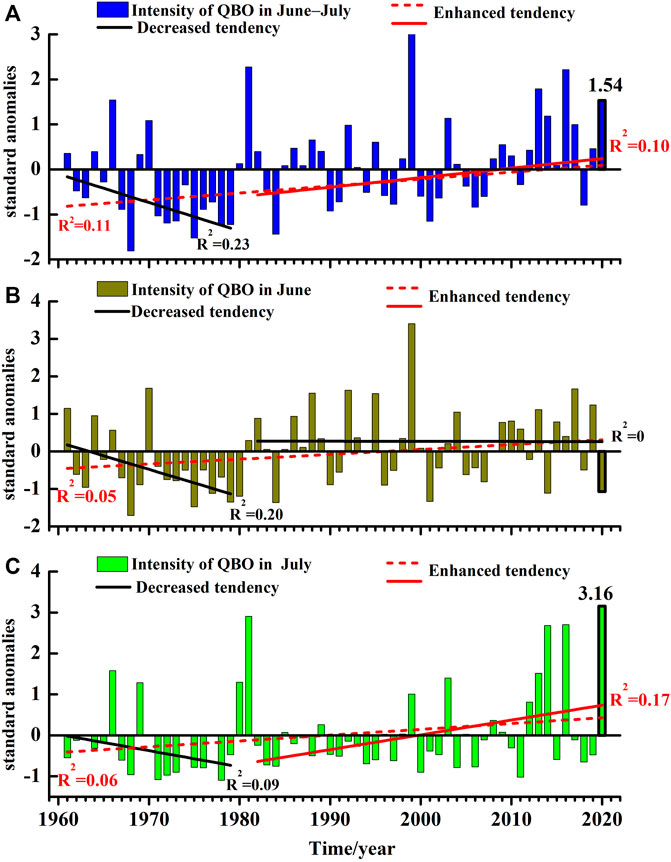
FIGURE 6. (A) Interannual standardized anomalies of intensity of quasi-biweekly (8–16 days) oscillation (QBWOI) of precipitation of June and July (bars) from 1961 to 2020. Red dotted line is tendency of interannual series from 1961 to 2020. Solid lines are tendency of interannual series of 1961–1979 and 1982–2020. Red/black dotted line represents enhanced/decreased tendency. R2 in left side of line is coefficient of determination of tendency of time span from 1961 to 2020. R2 in right side is that of time span of 1961–1979 and 1982–2020. Value in 2020 is labeled. (B) as in (A) but for June. (C) as in (A) but for July.
The QBWO mainly modulates the daily rainfall intensity of the super Meiyu in 2020. The QBWOI of Meiyu rainfall in July even broke the record. How does the QBWO of the Meiyu rainfall happen? As Meiyu rainfall is closely associated with the EASM atmospheric circulation systems, we conducted the spectrum analyses of specific atmospheric circulation systems, including the position of the WPSH ridge line at 120°E, the southern boundary of cold air over East Asia (the latitude of the 564 dagpm at 500-hPa geopotential heights averaged along 105°E–135°E), the intensity of subtropical East Asia summer monsoon (SEASM) (the average 925-hPa meridional winds over the region of 110°E–120°E, 25°N–35°N, defined as China National Meteorological trade standard QX/T 394–2017), and the intensity of EASWJ (the average 200-hPa zonal winds over the region of 120°E–160°E, 35°N–45°N). All of these EAMS variabilities exhibit a significant QBWO as Meiyu rainfall doe (Figure 7).
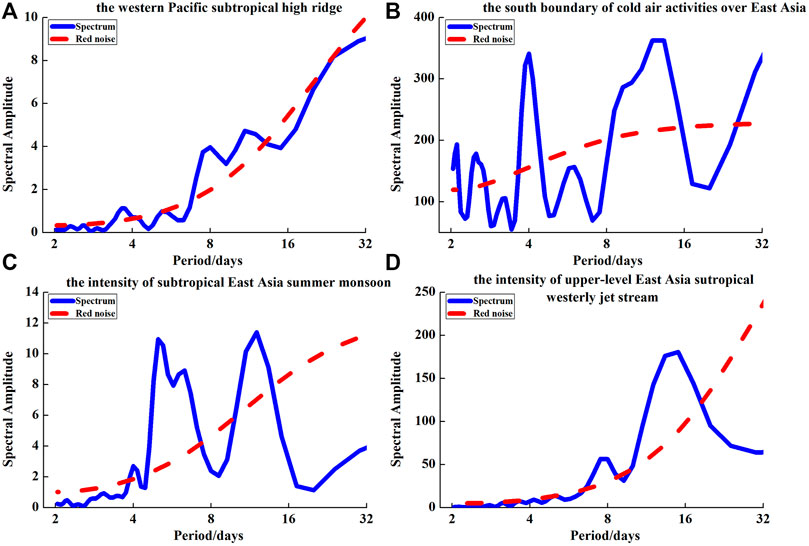
FIGURE 7. Noise power spectrum analysis of series of daily index of western Pacific subtropical high (WPSH) ridge (A), south boundary of cold air over East Asia (B), intensity of subtropical East Asia summer monsoon (SEASM) (C), and intensity of upper-level East Asia subtropical westerly jet (D) in June and July 2020 (dashed red line is for red noise spectrum).
The daily variation of the 8–16-day filtered Meiyu precipitation underlines seven precipitation processes with peaks occurring on June 3, 13, 21, and 28 and July 7, 18, and 28 and corresponding to the abundant Meiyu rainfall phases, respectively (Figure 8). They are named as the first to the seventh round of precipitation processes. The peak/valley of precipitation is referred to as the fifth/first phase of each round. By listing the behaviors of the EASM atmospheric circulation systems associated with the first to the seventh round of precipitation processes during the whole 2020 Meiyu (Table 1), it is found unexpectedly that only the southern boundary of the cold air activity over East Asia corresponds well to the Meiyu rainfall for all the seven processes. When the QBWO component of Meiyu reaches the peaks, the cold air over East Asia invades southward at best (in five processes) or is on the march of the southward invasion (in two processes). The correlation coefficient (CC) of the 8–16-day Lanczos filtered Meiyu precipitation and the latitudes of the southern boundary of cold air over East Asia from June 1 to July 31 is -0.79. The highly negative correlation indicates that the southward invasion of cold air over East Asia is well conducive to Meiyu rainfall. By contrast, the other EASM circulation systems have a weaker relationship with the Meiyu rainfall. Three peaks of QBWO rainfall witness the enhancement or peaks of the SEASM with CC = 0.55 between the filtered intensity of the SEASM and Meiyu rainfall in July while corresponding to the weakening or valleys of SEASM in the first, third, and fourth processes. Besides, the features of the meridional shift of the WPSH ridge and the intensity of the upper-level East Asia subtropical westerly jet during the peak phases of the QBWO rainfall in June are nearly opposite to those in July. The CCs of the QBWO component of the WPSH ridge (the intensity of the upper-level East Asia subtropical westerly jet) with the QBWO rainfall increase up to 0.45 (0.42) in June and decrease down to -0.40 (-0.31) in July. It suggests that the WPSH ridge at 120°E marches northward, and the upper-level East Asia subtropical westerly jet intensifies when the rainfall enhances in June, whereas the reverse applies in July.
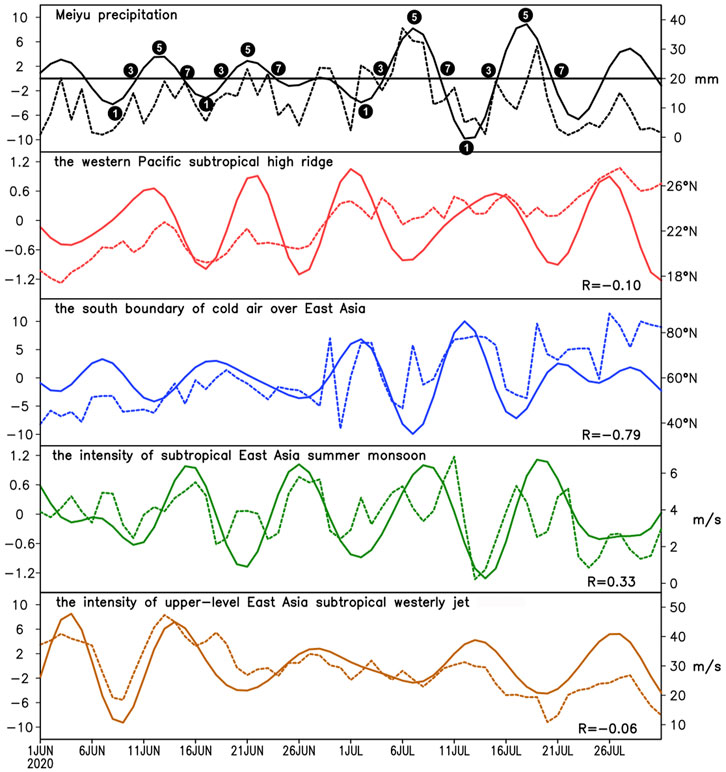
FIGURE 8. 8-16-day Lanczos filter value (solid curves, left axes) and daily original value (dashed curves, right axes) of Meiyu precipitation, WPSH ridge, southern boundary of cold air over East Asia, intensity of SEASM, and intensity of upper-level East Asia subtropical westerly jet from June 1, 2020, to July 31, 2020 (numbers of “1,” “3,” “5,” and “7” denote different phases of four processes of QWBO component during 2020 Meiyu season).
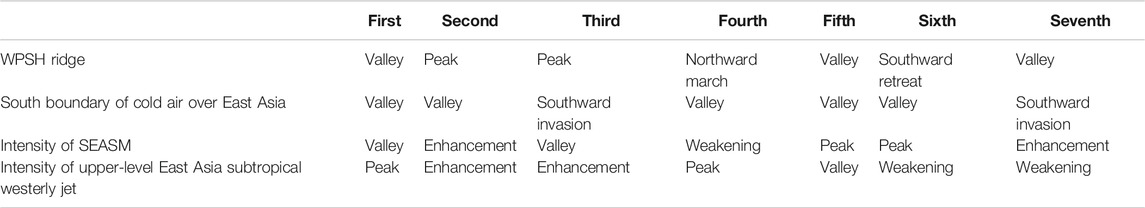
TABLE 1. Behaviors of some ESAMS associated with first to seventh round of precipitation processes during 2020 Meiyu.
To further clarify the QBWO of the atmospheric circulation favorable for the super Meiyu, the composite evolution of the EASM atmospheric circulation systems in the second to third and the fifth to sixth rounds is presented in Figures 9−12. The composite 8–16-day filtered circulations show almost opposite evolution patterns in the first to fourth phase to the fifth to eighth phase in June and July 2020, respectively (Figure 9–12). The filtered circulation pattern at phase 5 that corresponds to the peak phase of precipitation is contrary to that at phase 1.

FIGURE 9. Composite 8–16-day Lanczos filtered 500-hPa height (shaded, unit: dagpm) and 925-hPa winds (only filter value exceeding 1 m s-1 is shown by vectors). Marks of C/A denotes cyclonic/anticyclonic filtered circulation) corresponding to eight evolution phases of QWBO rainfall in second and third rainfall processes. Red lines denote 564- and 588-dagpm contours at unfiltered 500-hPa GHs. A–H correspond to the eight phases of the composite evolution of QWBO component of the the second to third rainfall processes.
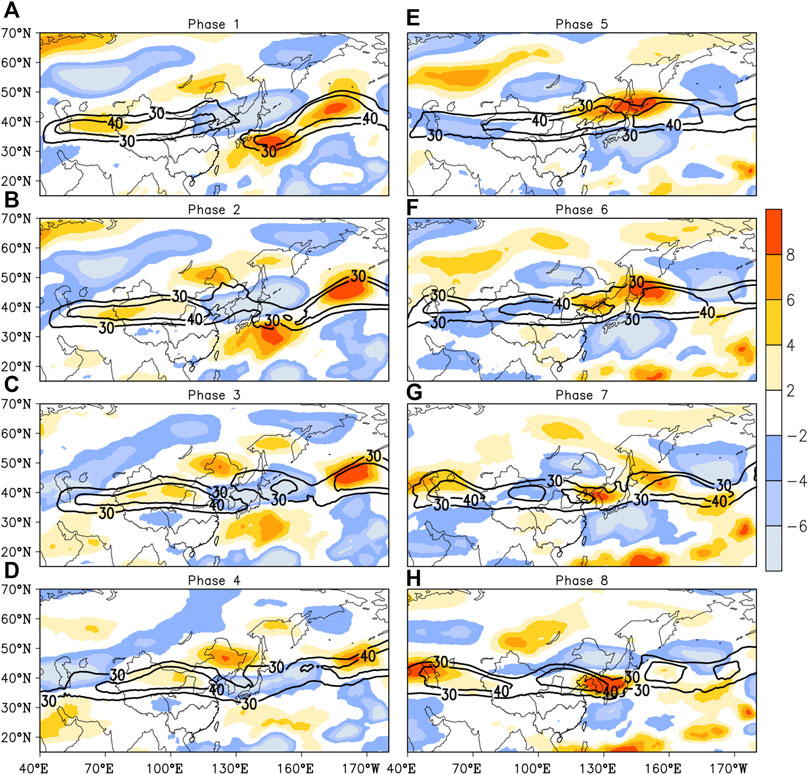
FIGURE 10. Composite 8–16 days Lanczos filtered 200-hPa zonal winds (shaded, unit: m s-1) corresponding to eight evolution phases of QWBO rainfall in second and third rainfall processes. Red lines denote 30 and 40 m s-1 contours at unfiltered 200-hPa zonal winds. A–H correspond to the eight phases of the composite evolution of QWBO component of the the second to third rainfall processes.
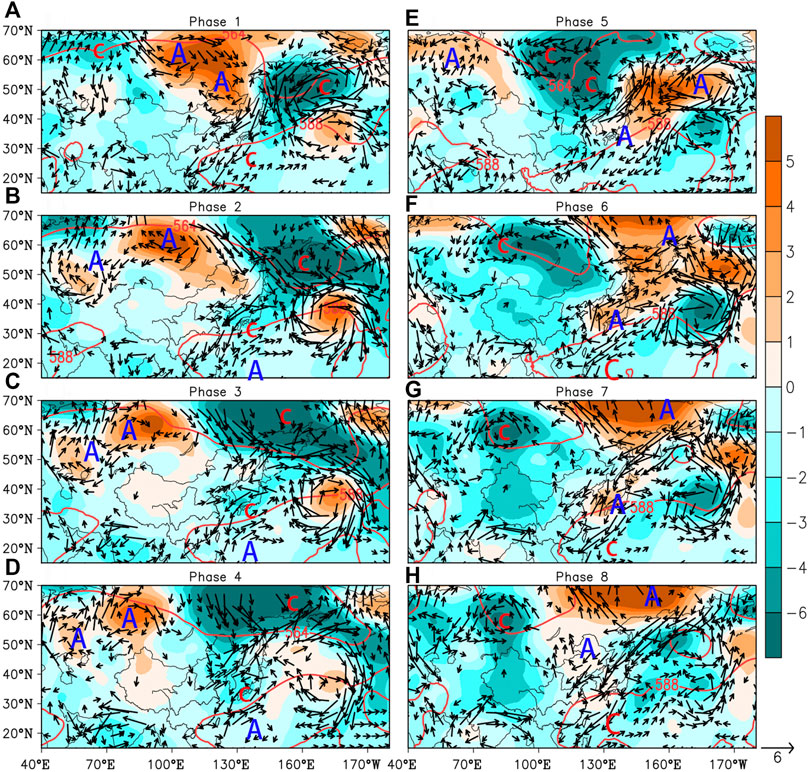
FIGURE 11. As in Figure 9 but for fifth and sixth rainfall processes. A‐H correspond to the eight phases of the composite evolution of QWBO component of the the second to third rainfall processes.
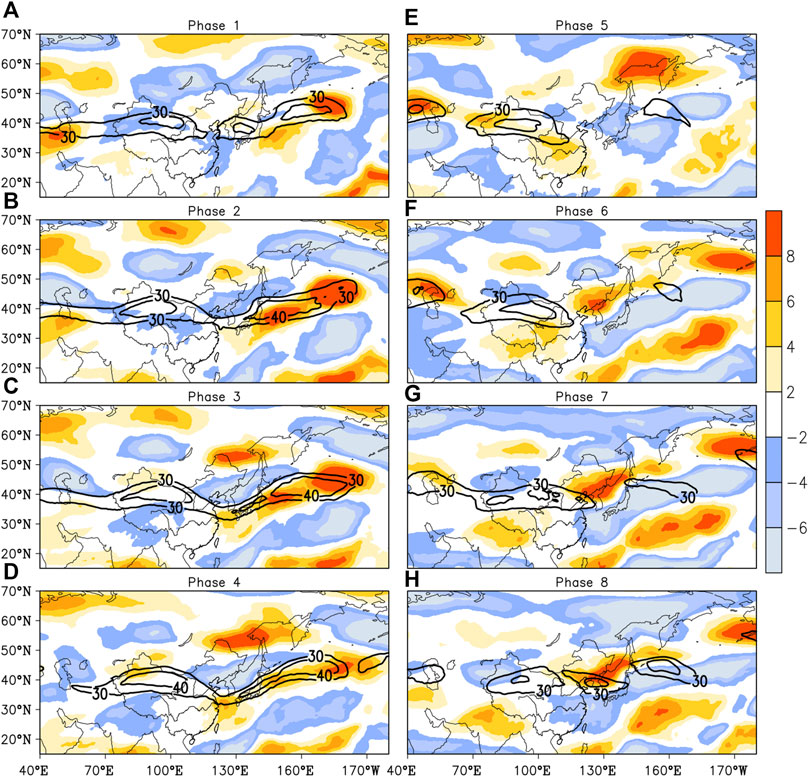
FIGURE 12. As in Figure 10 but for fifth and sixth rainfall processes. A–H correspond to the eight phases of the composite evolution of QWBO component of the the second to third rainfall processes.
In June, the increasing (decreasing) of rainfall on the 8–16-day time scale is accompanied by a northward march (southward retreat) of the WPSH and a southward intrusion (northward diminishing) of the cold air over Northeast Asia (Figure 9). At the peak phase (phase 5), a cyclonic circulation at 500 and 925 hPa occurs over Northeast China. The 588-dagpm contour at 500 hPa shifts northward to the Yangtze River valley, and the 564-dagpm contour arrives at the southernmost location. The meeting of the cold vortex and WPSH contributes to the intensification of Meiyu precipitation. The reverse is true for valley phase 1. The cyclone over Northeast China at phase 5 can be traced back to the cyclonic circulation west of Lake Baikal at phase 1, which is embedded in a wave train over the mid-high latitudes. At phase 1, the wave train is featured with high pressure/anticyclonic winds over the Ural Mountains, low pressure/cyclonic winds west of Lake Baikal, high pressure/anticyclonic winds over Northeast China, and low pressure/cyclonic winds over the North Pacific east of Japan. With the enhancement of rainfall, the wave train moves southeastward. At phase 5, the wave train with the opposite sign to phase 1 takes place at the troposphere (Figure 9).
The eastward propagating wave train might be related to the EASWJ. Although the EASWJ cores persist over the latitudes of 30–40°N, benefiting the stationary rainbelt, its intensity exhibits a significant QBWO (Figure 10). The intensity of the EASWJ reaches the maximum with the positive filtered zonal wind over North China–Japan at phase 5, whereas the EASWJ belt broke with the negative filtered zonal wind over North China–Japan at phase 1. The enhancement of the EASWJ is favorable for the ascending motion, thereby enhancing Meiyu rainfall. On the other hand, it might contribute to the eastward propagating of the wave train as a waveguide.
As in June, broad filtered cyclonic winds at 925 hPa accompanied with a trough over Northeast Asia at 500 hPa favor a southward intrusion of cold air from the mid-high latitudes at the peak phase of Meiyu rainfall in July; the opposite holds true for the valley phase (Figure 11). At phase 5, over the broad low pressure in Northeast Asia, two cyclone centers are found north of Lake Baikal and over Northeast China. The cyclone center to the north of Lake Baikal originates from the northwestward propagation of the low pressure/cyclone over the Aleutian Islands at phase 1 carried by a wave train at the mid-high latitudes. The distribution of the wave train centers in July are distinct from those in June (Figures 9, 11), and it comprises high pressure/anticyclonic winds north of the Ural Mountains, broad low pressure/cyclonic winds over Northeast China, and high pressure/anticyclonic winds over the Aleutian Islands. Another cyclone center over Northeast China might arise from the combination of the westward propagation of the wave train over mid-high latitudes and the northwestward propagation of the cyclonic circulation over the Philippine Sea at phase 1. As the cyclonic circulation over the Philippine Sea marches northward and slightly westward, an anticyclone from the tropics gradually takes its place, inducing the westward extension of the WPSH. Because of the northward migration of the cyclone along the East Asia coast, the WPSH around 120°E retreats southward as Meiyu rainfall increases. Remarkably different from that in June, at phase 5, the southwest winds favorable for warm and wet air transport over southern China are more vigorous to meet with the northwest winds carrying cold and dry air from the north. The two flows contribute to an obvious lower pressure over southeast China, causing the WPSH to retreat to the southernmost (Figure 11). The westward propagation of the wave train over the mid-high latitudes of Eurasia is contrary to that in June, which may be related to that of the EASWJ weakened markedly from June to July. A contrary evolution of the intensity of the EASWJ associated with Meiyu rainfall stands out in July, as shown in Figure 12. At the peak phase of rainfall, the EASWJ weakens with the broad negative filtered zonal wind over East Asia, possibly related to the westward propagation of the wave activities on the scale of the QBWO.
To summarize, the evolutions of the EASM atmospheric circulation systems on the scale of 8–16 days in June and July both well capture the QBWO component of the 2020 Meiyu rainfall but exhibit two different ways. In addition to the opposite propagation of the wave train over the mid-high latitudes of Eurasia, the WPSH ridge, SEASM, and EASWJ exhibit opposite evolution behaviors in June and July.
The super 2020 Meiyu onsets earlier and ends later than normal, with an extremely long duration of 62 days. Persistent rainfall accompanied with frequent heavy rainstorms brings a record-broking Meiyu event and causes devastating floods over the YHRB. The Meiyu rainfall is closely related to the anomalous EASM atmospheric circulation systems with westward and northward WPSH, evident expansion of the EASWJ and SAH, and the accelerated lower-level southwesterly flows.
When closely examining the characteristics of the Meiyu rainbelt migration, it is found that the centers of positive rainfall anomalies experience a southward retreat from June to July. The above-normal rainband was located over the northern YHRB in 2020 June and retreated southward to the southern YHRB in July. To better understand the rainbelt migration, the anomalous large-scale circulation patterns are illustrated in Figure 13. In June, extremely vigorous northward warm-and-wet air transported by the abnormal southwesterlies associated with the WPSH motivates a warm Meiyu front, anchoring the Meiyu rainbelt over the northern YHRB (Figure 13A). By comparison, in July, the significant northeast wind anomalies linked with the CA over the Sea of Japan–North China and the ACA over Northeast Asia induce cold air to invade into the lower latitudes and to converge with the abnormal southwesterlies in the northwestern flank of the ACA over the western Pacific. The intimate merging of cold and warm air is favorable for the Meiyu front formation and the rainbelt over the southern YHRB (Figure 13B).
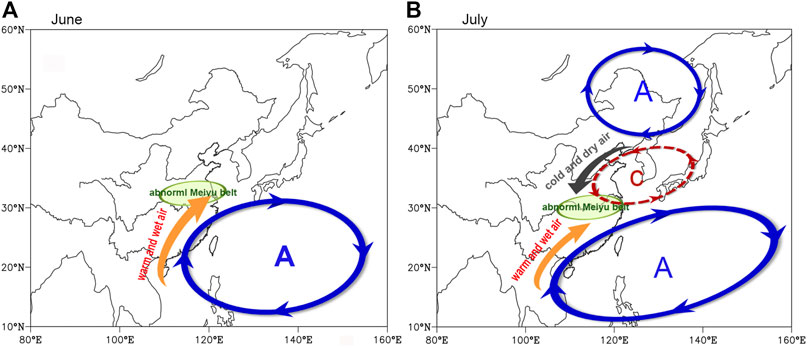
FIGURE 13. Schematic diagram for explanation for abnormal Meiyu rainbelt in June (A) and July (B) 2020 (solid blue/dashed red cycle and blue/red letter A/C denote anticyclonic/cyclonic anomaly).
During all the 2020 Meiyu season, no matter in June or July 2020, it is identified that an extremely strong WNPAC persists and induces abundant Meiyu rainfall over the YHRB. Consistent with Pan et al. (2021), the SSTA pattern over the Indo-Pacific ocean with a basin-wide IO warming persisting from the winter to early summer of 2020 and a quick phase transition of an El Niño-like SSTA pattern over the equatorial central Pacific in the winter to a La Niña-like SST pattern in the equatorial eastern Pacific in the early summer is a great contributor to the formation and maintenance of the WNPAC. However, the explanation for the subseasonal southward shift of the WNPAC over the South China Sea favorable for the meridional migration of the 2020 Meiyu rainbelt from June to July needs to be explored in our further studies.
Another significant subseasonal variation of the 2020 Meiyu precipitation is that the Meiyu rainfall evolves in periodic oscillations of approximately 2 weeks (8–16 days). Interestingly, the QBWO intensity of Meiyu rainfall, especially in 2020 July, has witnessed an obvious increasing tendency since the early 1980s. The QBWO intensity of Meiyu rainfall in 2020 July ranks first place since 1960.
Consistent with the Meiyu rainfall, the circulation systems also exhibit a QBWO feature. Pieces of evidence show that each southward intrusion of cold air over East Asia corresponds well to the increase of Meiyu precipitation on the scale of QBWO. However, other systems such as the WPSH, SEASM, and EASWJ behave in different and even contrary ways between June and July 2020. The results are unexpected and require more investigation of the details. When Meiyu rainfall enhances to the peaks, the WPSH marches northward (retreats southward), the SEASM weakens (strengthens), and the EASWJ accelerates (decelerates) in June (July) 2020. Moreover, the filtered cyclone over Northeast China available for the southward intrusion of cold air from the mid-high latitudes for Meiyu precipitation arises in different ways. In June, the cyclone is attributed to the eastward propagation of a wave train over the mid-high latitudes, whereas that in July is the result of the joint effect of the westward propagation of a wave train over the mid-high latitudes and the northward propagation of the cyclonic circulation from the tropics. Circulations at the peak phase of Meiyu rainfall on the scale of QBWO are summarized in Figure 14.
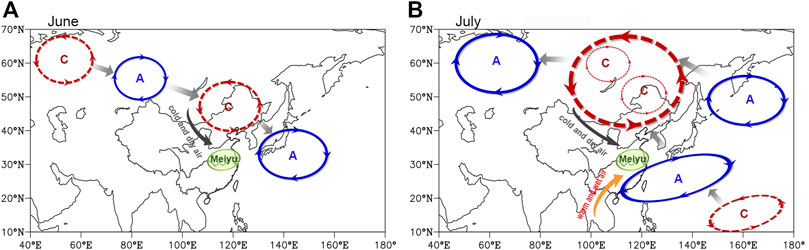
FIGURE 14. Schematic diagram for circulations for Meiyu rainfall on scale of QBWO in June (A) and July (B) 2020 (Solid blue/dashed red cycles and blue/red letter A/C denote anticyclonic/cyclonic filtered circulation. Gray arrows denote propagation of wave train. Filtered circulation associated with valley phase of Meiyu is opposite to that at peak phase, as shown).
This study describes the characteristics and cause of the meridional migration of the 2020 Meiyu rainbelt from June to July and reveals a QBWO feature of daily Meiyu rainfall amount and the corresponding atmospheric circulation characteristics. The external forcings driving the subseasonal variation of the abnormal rainbelt and the QWBO variability require further investigations. Given that the QBWO intensity of Meiyu exhibits significant interannual and interdecadal variations, the influencing factors (e.g., the global SSTA), the associated physical processes, and the contribution to the prediction of Meiyu are still open questions.
The data analyzed in this study is subject to the following licenses/restrictions: The precipitation datasets presented in this article are not readily available because raw data supporting the conclusions of this article is high precision. High spatial and temporal resolution observations are confidential data and cannot be made public according to the data management regulation. Requests to access the datasets should be mailed to the author, dg1728001@smail.nju.edu.cn. The ERA-5 datasets analyzed for this study can be found on the Copernicus Climate Change Service Climate Data Store (https://cds.climate.copernicus.eu/). Requests to access these datasets should be directed to dg1728001@smail.nju.edu.cn.
SC conceived the idea and performed the analysis. ML and KZ revised the interpretation of the results. The other authors contributed the writing.
This research was supported by the National Natural Science Foundation of China (41805051) and the Key Project of the Jiangsu Meteorological Bureau (KZ202101 and KZ202205).
The authors declare that the research was conducted in the absence of any commercial or financial relationships that could be construed as a potential conflict of interest.
All claims expressed in this article are solely those of the authors and do not necessarily represent those of their affiliated organizations or those of the publisher, the editors, and the reviewers. Any product that may be evaluated in this article, or claim that may be made by its manufacturer, is not guaranteed or endorsed by the publisher.
The Supplementary Material for this article can be found online at: https://www.frontiersin.org/articles/10.3389/feart.2021.799104/full#supplementary-material
Bollasina, M. A., and Messori, G. (2018). On the Link between the Subseasonal Evolution of the North Atlantic Oscillation and East Asian Climate. Clim. Dyn. 51, 3537–3557. doi:10.1007/s00382-018-4095-5
Chen, T. J. G., and Yu, C.-C. (1988). Study of Low-Level Jet and Extremely Heavy Rainfall over Northern Taiwan in the Mei-Yu Season. Mon. Wea. Rev. 116, 884–891. doi:10.1175/1520-0493(1988)116<0884:sollja>2.0.co;2
Chen, J., Wen, Z., Wu, R., Chen, Z., and Zhao, P. (2015). Influences of Northward Propagating 25-90-day and Quasi-Biweekly Oscillations on Eastern China Summer Rainfall. Clim. Dyn. 45, 105–124. doi:10.1007/s00382-014-2334-y
Chowdary, J. S., Hu, K., Srinivas, G., Kosaka, Y., Wang, L., and Rao, K. K. (2019). The Eurasian Jet Streams as Conduits for East Asian Monsoon Variability. Curr. Clim. Change Rep. 5, 233–244. doi:10.1007/s40641-019-00134-x
Chowdary, J. S., Vibhute, A. S., Darshana, P., Parekh, A., Gnanaseelan, C., and Attada, R. (2021). Meridional Displacement of the Asian Jet and its Impact on Indian Summer Monsoon Rainfall in Observations and CFSv2 Hindcast. Clim. Dyn. 57, 1432–0894. doi:10.1007/s00382-021-05935-1
Ding, Y., Si, D., Liu, Y., Wang, Z., Liu, Y., Zhao, L., et al. (2018). On the Characteristics, Driving Forces and Inter-decadal Variability of the East Asian Summer Monsoon. Chin. J. Atmos. Sci. 42, 533–558. doi:10.3878/j.issn.1006-9895.1712.17261
Ding, Y., Liang, P., Liu, Y., and Zhang, Y. (2020). Multiscale Variability of Meiyu and its Prediction: A New Review. J. Geophys. Res. Atmos. 125, e2019JD031496. doi:10.1029/2019JD031496
Ding, Y., Liu, Y., and Hu, Z.-Z. (2021). The Record-Breaking Mei-Yu in 2020 and Associated Atmospheric Circulation and Tropical SST Anomalies. Adv. Atmos. Sci. 38, 1980–1993. doi:10.1007/s00376-021-0361-2
Ding, Y. (1992). Summer Monsoon Rainfalls in China. J. Meteorol. Soc. Jpn. 70, 373–396. doi:10.2151/jmsj1965.70.1B_373
Ding, Y. (2007). The Variability of the Asian Summer Monsoon. J. Meteorol. Soc. Jpn. 85B, 21–54. doi:10.2151/jmsj.85B.21
Gan, N. (2020). China Has Just Contained the Coronavirus. Now It'sbattling Some of the Worst Floods in Decades. Available at: https://edition.cnn.com/2020/07/14/asia/china-flood-coronavirus-intl-hnk/index.html (Accessed on: July 14, 2020).
Ge, L., Ren-Guang, W., and Yuan-Zhi, Z. (2014). Persistence of Snow Cover Anomalies over the Tibetan Plateau and the Implications for Forecasting Summer Precipitation over the Meiyu-Baiu Region. Atmos. Oceanic Sci. Lett. 7, 115–119. doi:10.1080/16742834.2014.11447145
Guo, Y., Zhang, R., Wen, Z., Li, J., Zhang, C., and Zhou, Z. (2021). Understanding the Role of SST Anomaly in Extreme Rainfall of 2020 Meiyu Season from an Interdecadal Perspective. Sci. China Earth Sci. 64, 1619–1632. doi:10.1007/s11430-020-9762-0
He, J., Wu, Z., Jiang, Z., Miao, C., and Han, G. (2007). “Climate Effect” of the Northeast Cold Vortex and its Influences on Meiyu. Chin. Sci. Bull. 52, 671–679. doi:10.1007/s11434-007-0053-z
Hersbach, H., Bell, B., Berrisford, P., Hirahara, S., Horányi, A., Muñoz‐Sabater, J., et al. (2020). The ERA5 Global Reanalysis. Q. J. R. Meteorol. Soc. 146, 1999–2049. doi:10.1002/qj.3803
Huang, R., and Sun, F. (1992). Impacts of the Tropical Western Pacific on the East Asian Summer Monsoon. J. Meteorol. Soc. Jpn. 70, 243–256. doi:10.2151/jmsj1965.70.1B_243
Huang, D., Zhu, J., and Kuang, X. (2011). Decadal Variation of Different Durations of Continuous Meiyu Precipitation and the Possible Cause. Chin. Sci. Bull. 56, 424–431. doi:10.1007/s11434-010-4241-x
Huaqiang, L., and Yongfu, Q. (1999). Numerical Simulations of Intense Meiyu Rainfall in 1991 over the Changjiang and Huaihe River Valleys by a Regional Climate Model with P- σ Incorporated Coordinate System. Adv. Atmos. Sci. 16, 395–404. doi:10.1007/s00376-999-0018-z
Kodama, Y. (1992). Large-Scale Common Features of Subtropical Precipitation Zones (The Baiu Frontal Zone, the SPCZ, and the SACZ) Part I: Characteristics of Subtropical Frontal Zones. J. Meteorol. Soc. Jpn. 70, 813–836. doi:10.2151/jmsj1965.70.4_813
Kosaka, Y., Xie, S.-P., and Nakamura, H. (2011). Dynamics of Interannual Variability in Summer Precipitation over East Asia*. J. Clim. 24, 5435–5453. doi:10.1175/2011JCLI4099.1
Lau, K.-M., and Li, M.-T. (1984). The Monsoon of East Asia and its Global Associations-A Survey. Bull. Amer. Meteorol. Soc. 65, 114–125. doi:10.1175/1520-0477(1984)065<0114:tmoeaa>2.0.co;2
Lau, K.-M., Kim, K.-M., and Yang, S. (2000). Dynamical and Boundary Forcing Characteristics of Regional Components of the Asian Summer Monsoon. J. Clim. 13, 2461–2482. doi:10.1175/1520-0442(2000)013<2461:dabfco>2.0.co;2
Li, J., Mao, J., and Wu, G. (2015). A Case Study of the Impact of Boreal Summer Intraseasonal Oscillations on Yangtze Rainfall. Clim. Dyn. 44, 2683–2702. doi:10.1007/s00382-014-2425-9
Li, X., Gollan, G., Greatbatch, R. J., and Lu, R. (2018). Intraseasonal Variation of the East Asian Summer Monsoon Associated with the Madden-Julian Oscillation. Atmos. Sci. Lett. 19, e794. doi:10.1002/asl.794
Li, H., He, S., Fan, K., and Wang, H. (2019). Relationship between the Onset Date of the Meiyu and the South Asian Anticyclone in April and the Related Mechanisms. Clim. Dyn. 52, 209–226. doi:10.1007/s00382-018-4131-5
Li, L., Zhu, C., Zhang, R., and Liu, B. (2020). Roles of the Tibetan Plateau Vortices in the Record Meiyu Rainfall in 2020. Atmos. Sci. Lett. 22, e1017. doi:10.1002/asl.1017
Liang, P., and Ding, Y. (2012). Climatologic Characteristics of the Intraseasonal Oscillation of East Asian Meiyu. Acta Meteorol. Sin. 70, 418–435. 0577-6619/2012/70(3)-0418-35
Liu, Y., and Ding, Y. (2020). Characteristics and Possible Causes for the Extreme Meiyu in 2020. Meteorol. Mon. 46, 1393–1404. doi:10.7519/j.issn.1000-0526.2020.11.001
Liu, G., Wu, R., Zhang, Y., and Nan, S. (2014). The Summer Snow Cover Anomaly over the Tibetan Plateau and its Association with Simultaneous Precipitation over the Mei-Yu-Baiu Region. Adv. Atmos. Sci. 31, 755–764. doi:10.1007/s00376-013-3183-z
Liu, B., Zhu, C., Su, J., Ma, S., and Xu, K. (2019). Record-Breaking Northward Shift of the Western North Pacific Subtropical High in July 2018. J. Meteorol. Soc. Jpn. 97, 913–925. doi:10.2151/jmsj.2019-047
Liu, B., Yan, Y., Zhu, C., Ma, S., and Li, J. (2020). Record‐Breaking Meiyu Rainfall Around the Yangtze River in 2020 Regulated by the Subseasonal Phase Transition of the North Atlantic Oscillation. Geophys. Res. Lett. 47, e2020GL090342. doi:10.1029/2020GL090342
Ninomiya, K. (1984). Characteristics of Baiu Front as a Predominant Subtropical Front in the Summer Northern Hemisphere. J. Meteorol. Soc. Jpn. 62, 880–894. doi:10.2151/jmsj1965.62.6_880
Ninomiya, K. (2000). Large- and Meso-α-Scale Characteristics of Meiyu/Baiu Front Associated with Intense Rainfalls in 1-10 July 1991. J. Meteorol. Soc. Jpn. 78, 141–157. doi:10.2151/jmsj1965.78.2_141
Nitta, T. (1987). Convective Activities in the Tropical Western Pacific and Their Impact on the Northern Hemisphere Summer Circulation. J. Meteorol. Soc. Jpn. 65, 373–390. doi:10.2151/jmsj1965.65.3_373
Niu, R., Zhai, P., and Tan, G. (2021). Anomalous Features of Extreme Meiyu in 2020 over the Yangtze-Huai River Basin and Attribution to Large-Scale Circulations. J. Meteorol. Res. 35, 799–814. doi:10.1007/s13351-021-1018-x
Pan, X., Li, T., Sun, Y., and Zhu, Z. (2021). Cause of Extreme Heavy and Persistent Rainfall over Yangtze River in Summer 2020. Adv. Atmos. Sci. 38, 1994–2009. doi:10.1007/s00376-021-0433-3
Ronghui, H., and Yifang, W. (1989). The Influence of ENSO on the Summer Climate Change in China and its Mechanism. Adv. Atmos. Sci. 6, 21–32. doi:10.1007/BF02656915
Sampe, T., and Xie, S.-P. (2010). Large-Scale Dynamics of the Meiyu-Baiu Rainband: Environmental Forcing by the Westerly Jet*. J. Clim. 23, 113–134. doi:10.1175/2009JCLI3128.1
Schulz, M., and Mudelsee, M. (2002). REDFIT: Estimating Red-Noise Spectra Directly from Unevenly Spaced Paleoclimatic Time Series. Comput. Geosci. 28, 421–426. doi:10.1016/S0098-3004(01)00044-9
Song, Z., Zhu, C., Su, J., and Liu, B. (2016). Coupling Modes of Climatological Intraseasonal Oscillation in the East Asian Summer Monsoon. J. Clim. 29, 6363–6382. doi:10.1175/JCLI-D-15-0794.1
Takaya, Y., Ishikawa, I., Kobayashi, C., Endo, H., and Ose, T. (2020). Enhanced Meiyu‐Baiu Rainfall in Early Summer 2020: Aftermath of the 2019 Super IOD Event. Geophys. Res. Lett. 47, e2020GL090671. doi:10.1029/2020GL090671
Tao, S., and Chen, L. (1987). “A Review of Recent Research on the East Asian Summer Monsoon in China,” in Monsoon Meteorology. Editors C.-P. Chang, and T. N. Krishnamurti (Oxford UP, NY: Oxford University Press), 60–92.
Torrence, C., and Compo, G. P. (1998). A Practical Guide to Wavelet Analysis. Bull. Amer. Meteorol. Soc. 79, 61–78. doi:10.1175/1520-0477(1998)079<0061:apgtwa>2.0.co;2
Trenberth, K. E. (1984). Signal versus Noise in the Southern Oscillation. Mon. Wea. Rev. 112, 326–332. doi:10.1175/1520-0493(1984)112<0326:svnits>2.0.co;2
Wang, J., He, J., Liu, X., and Wu, B. (2009). Interannual Variability of the Meiyu Onset over Yangtze-Huaihe River Valley and Analyses of its Previous strong Influence Signal. Chin. Sci. Bull. 54, 687–695. doi:10.1007/s11434-008-0534-8
Wang, B., Xiang, B., and Lee, J.-Y. (2013). Subtropical High Predictability Establishes a Promising Way for Monsoon and Tropical Storm Predictions. Proc. Natl. Acad. Sci. 110, 2718–2722. doi:10.1073/pnas.1214626110
Webster, P. J., Magaña, V. O., Palmer, T. N., Shukla, J., Tomas, R. A., Yanai, M., et al. (1998). Monsoons: Processes, Predictability, and the Prospects for Prediction. J. Geophys. Res. 103, 14451–14510. doi:10.1029/97jc02719
Xie, S.-P., Hu, K., Hafner, J., Tokinaga, H., Du, Y., Huang, G., et al. (2009). Indian Ocean Capacitor Effect on Indo-Western Pacific Climate during the Summer Following El Niño. J. Clim. 22, 730–747. doi:10.1175/2008JCLI2544.1
Xie, S.-P., Kosaka, Y., Du, Y., Hu, K., Chowdary, J. S., and Huang, G. (2016). Indo-western Pacific Ocean Capacitor and Coherent Climate Anomalies in post-ENSO Summer: A Review. Adv. Atmos. Sci. 33, 411–432. doi:10.1007/s00376-015-5192-6
Xu, M., Xu, H., and Ren, H. (2018). Influence of Kuroshio SST Front in the East China Sea on the Climatological Evolution of Meiyu Rainband. Clim. Dyn. 50, 1243–1266. doi:10.1007/s00382-017-3681-2
Xuan, S., Zhang, Q., and Sun, S. (2011). Anomalous Midsummer Rainfall in Yangtze River-Huaihe River Valleys and its Association with the East Asia westerly Jet. Adv. Atmos. Sci. 28, 387–397. doi:10.1007/s00376-010-0111-3
Yihui, D., and Chan, J. C. L. (2005). The East Asian Summer Monsoon: an Overview. Meteorol. Atmos. Phys. 89, 117–142. doi:10.1007/s00703-005-0125-z
Yim, S.-Y., Wang, B., Xing, W., and Lu, M.-M. (2015). Prediction of Meiyu Rainfall in Taiwan by Multi-lead Physical-Empirical Models. Clim. Dyn. 44, 3033–3042. doi:10.1007/s00382-014-2340-0
Yimin, L., and Guoxiong, W. (2004). Progress in the Study on the Formation of the Summertime Subtropical Anticyclone. Adv. Atmos. Sci. 21, 322–342. doi:10.1007/BF02915562
Zhang, Y., and Guo, L. (2005). Relationship between the Simulated East Asian westerly Jet Biases and Seasonal Evolution of Rainbelt over Eastern China. Chin. Sci. Bull. 50, 1503–1508. doi:10.1360/982004-361
Zhang, Y., Kuang, X., Guo, W., and Zhou, T. (2006). Seasonal Evolution of the Upper‐tropospheric westerly Jet Core over East Asia. Geophys. Res. Lett. 33, 2006GL026377. doi:10.1029/2006GL026377
Zhou, T.-J., and Yu, R. (2005). Atmospheric Water Vapor Transport Associated with Typical Anomalous Summer Rainfall Patterns in China. J. Geophys. Res. 110, D08104. doi:10.1029/2004JD005413
Zhou, Z.-Q., Xie, S.-P., and Zhang, R. (2021). Historic Yangtze Flooding of 2020 Tied to Extreme Indian Ocean Conditions. Proc. Natl. Acad. Sci. USA 118, e2022255118. doi:10.1073/pnas.2022255118
Keywords: 2020 long-persisting meiyu, subseasonal variation, quasi-biweekly oscillation, East Asia summer monsoon systems, wave trains over the mid-high latitudes
Citation: Chen S, Kang Z, Liu M, Lv R, Ma J and He J (2022) Subseasonal Variation of 2020 Meiyu Rainfall With Extremely Long Duration Over the Yangtze–Huaihe River Basin in China. Front. Earth Sci. 9:799104. doi: 10.3389/feart.2021.799104
Received: 21 October 2021; Accepted: 20 December 2021;
Published: 31 January 2022.
Edited by:
Sanjeev Kumar Jha, Indian Institute of Science Education and Research, IndiaReviewed by:
Jasti S Chowdary, Indian Institute of Tropical Meteorology (IITM), IndiaCopyright © 2022 Chen, Kang, Liu, Lv, Ma and He. This is an open-access article distributed under the terms of the Creative Commons Attribution License (CC BY). The use, distribution or reproduction in other forums is permitted, provided the original author(s) and the copyright owner(s) are credited and that the original publication in this journal is cited, in accordance with accepted academic practice. No use, distribution or reproduction is permitted which does not comply with these terms.
*Correspondence: Mei Liu, bG1rZXJyeUAxNjMuY29t; Zhiming Kang, a2FuZ3ptQGNtYS5nb3YuY24=
Disclaimer: All claims expressed in this article are solely those of the authors and do not necessarily represent those of their affiliated organizations, or those of the publisher, the editors and the reviewers. Any product that may be evaluated in this article or claim that may be made by its manufacturer is not guaranteed or endorsed by the publisher.
Research integrity at Frontiers
Learn more about the work of our research integrity team to safeguard the quality of each article we publish.