 Deqiang Wang
 Xiansong Zhang1,2
- 1State Key Laboratory of Offshore Oil Efficient Development, Beijing, China
- 2CNOOC Research Institute Co. Ltd, Beijing, China
It is of great significance to study the seepage characteristics of heavy oil reservoirs, which are conducive to the efficient development of resources. Boundary layer effect (BLE) exists in the pore-scale flow process of macromolecular fluid media, which is different from the flow law of conventional fluid in the pore, yet the influence of BLE is ignored in the previous pore-scale simulation. Conventional porous media simulations have difficulty analyzing the mass transfer law of small-scale models under the influence of microfractures. Based on the CT scanning data and thin section data of the real core in the target area, the rock skeleton and flow space were extracted according to the maximum ball algorithm, and the pore network model representing the complex structure was constructed. The microscale effect of macromolecules in the flow process in the pores was characterized by modifying the effective flow. The effects of the BLE on the effective connectivity, displacement process, and oil distribution law were analyzed. The seepage characteristics of different wettability conditions and different water cut stages were compared. The results show that BLE reduces the effective flow space and leads to deviations in the relative permeability curve and capillary curve. For fractured porous media, the irregular shape of porous media was characterized by the morphological method, and the mass transfer process was analyzed by the equivalent flux method. The influence of the porous media shape on the macromass transfer process was compared. This study provides a solution to the problem of BLE in pore-scale simulation.
Introduction
Heavy oil has great development potential, and the analysis of its seepage characteristics is of great significance to enhance oil recovery. In the study of pore-scale BLE, macromolecular fluid media is different from the regular fluid flow in pores. It is necessary to analyze the flow characteristics of macromolecular fluid media under the influence of pore-scale BLE. Along with the promotion of reservoir fracturing, fractured reservoirs have become the focus of research, yet conventional porous media simulations have difficulty analyzing the mass transfer law of microscale models under the influence of microfractures.
In an experimental simulation, Secchi (Secchi et al., 2016) confirmed the existence of microscale effect in the microscale flow process in a study published in Nature. The study observed the movement of particles by sending particles into the tracer, and the trajectory of particle movement indicated that the flow process on a small scale was affected by fluid–solid interaction. Wu et al. (2017a) analyzed the influence of wettability at the microscale and summarized microscale molecular simulations, physical simulations, and other relevant experiments. The existence of slippage distance was confirmed in the microscale fluid flow process, which reduces the effective flow space of the fluid. Wu et al. (2017b) analyzed the existence of a nonflow boundary in the flow process at the pore scale based on a physical simulation experiment of a microcircular tube and characterized the fluid–solid interaction through a large number of physical simulation experiments. The results show that the microscale fluid–solid interaction was primarily affected by viscosity, pore radius, and pressure gradient. For fractured media, Cheng et al. (2020) conducted water-flooding experiments with fractured cores and analyzed the influence of fracture length on water flooding. J.-T. (Cheng et al., 2004) analyzed the single-phase flow in a rock fracture by micromodels fabricated using projection photolithography to produce voids with known geometry. Tang et al. (2007) used a 2D micromodel of carbonate fracture media to verify a complex-segmenting correlation between the fluid pressure and volume of flow and a simple positive correlation was not adopted. Su et al. (2020) revealed the importance of microfractures in oil primary migration by interdisciplinary and several experimental methods. Many micro mechanisms can be explored by physical simulation, but the cost of research is much higher than numerical simulation.
In the numerical simulation, He et al. (2021) analyzed the influence of thin water film in the pore boundary on a two-phase relative permeability curve by a pore network model. Circular, triangular, and rectangular pores have nonflow films on the boundary, which affect the two-phase permeability curve. For fractured media, Wang and Sheng (2019) analyzed the impact of BLE on macroscale flow characteristics and evaluated the impact of large-scale fractures on productivity but ignored the seepage law of porous media containing microscale fractures. Sun et al. (2019) studied the influence of microfractures on the flow based on pore network models. However, the macromass transfer with microfractures was not analyzed. Wu et al. (2021) used dissipative particle dynamics to analyze the influence of the fluid–solid interaction force on microflow in shale slits, but this method required a large amount of calculations. Chen et al. (2018) used a pore network to simulate fluid–solid interaction, but the research was only applicable to tight reservoirs and lacked macrosimulation analysis.
The aforementioned researchers primarily focus on the study of single-pipe microscale and macroscale reservoirs, which lacked the study of pore scale. The pore network model can simulate the small-scale flow process without fracture, and the amount of calculation is greatly reduced because the pores and throats are simplified into spherical geometry space and rod geometry space. Fluid–solid interaction exists in the pore-scale flow process of macroscopic fluid media, such as heavy oil (Yin and Liu, 2015; Bazazi et al., 2019; Ke et al., 2020). Hydraulic fractured or naturally fractured heavy oil reservoirs lead to the formation including fractures and heavy oil (Babadagli, 2003; Rahnema et al., 2008; Souraki et al., 2011). However, the influence of microscale BLE was not considered in the previous pore-scale simulation. However, the mass transfer process, including microfractures, still needs to be effectively characterized. In this study, the pore network was extracted based on CT data to simulate the flow process for porous media without fractures. The microscale effect of macromolecules was characterized by modifying the seepage model of macromolecular fluid media in the pores to analyze the influence of BLE on the seepage characteristics. For fractured porous media, the irregular shape of porous media was characterized by a morphological method, and the mass transfer process was analyzed by the equivalent flux method. The effects of fractured porous media on the macromass transfer process were compared.
Methods
Effect of BLE
He and Wu (Wu et al., 2017a; He et al., 2021) proved that van der Waals forces between the solid wall and the fluid lead to the fluid medium near the edge of the pipe wall adsorbing on the wall to form a nonflow film for microscale flow, which was called BLE (Wang and Sheng, 2019). The flow process is shown in Figure 1. The brown area represents the solid phase, and the yellow area represents the flowable area. The blue area near the wall represents the nonflowable liquid phase area. The fluid adheres to the wall due to the BLE as shown by the red dot. There are only blue dots that can flow freely away from the wall in the flowable space. Therefore, there is a nonflow film at the pore boundary, resulting in the reduction of effective flow space in the pores.
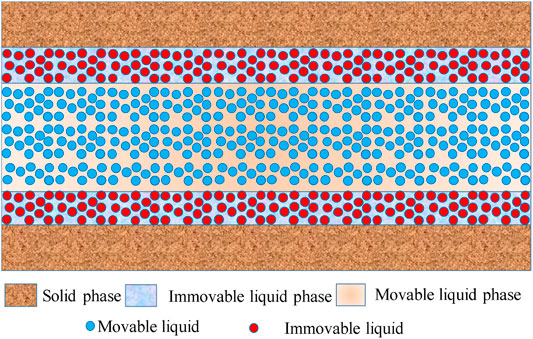
FIGURE 1. Schematic diagram of the presence of BLE at the boundary.
Pore network simulation has been widely used in reservoir simulation because of its high-calculation efficiency (Blunt, 2001; Dong and Blunt, 2009; Gostick et al., 2016). In the conventional pore network simulation, it is assumed that the micropore throat flow conforms to Hagen–Poiseuille’s law, but many researchers have confirmed that Hagen–Poiseuille’s law is not applied to the pore-scale flow characteristics under the influence of BLE through micro-round pipe physical simulation experiments and molecular simulation. Therefore, the flow characterization formula of the pore network model needs to be modified.
Wu et al. proposed the microscale effect, in which there was no flow area at the boundary due to fluid–solid interactions at the pore scale and proposed the expression equation of the modified flow rate for the microscale effect, as shown in Eq. 1. In this study, the improved effective flow velocity is shown in Eq. 2.
Aiming at the BLE at the boundary, Wu et al. (Wu et al., 2017b) proposed the expression equation of modified flow based on a large number of micro-tube experiments, as shown in Eq. 1. The improved effective flow velocity was corrected in Eq. 2.
where a, b, and c are parameters related to BLE, r is pore radius,
where
Construction and Analysis of the Unfractured Model
For porous media without fractures, a pore network model was used to describe the process of seepage in the matrix, and the fluid flow in the flowable area follows NS equation. To establish a network model representing the real pore structure of the matrix, the 600 × 600 × 3-pixel central area was selected in Figure 2A and Figure 2B. Threshold segmentation was conducted to divide the rock skeleton and flow area in Figure 2C. In addition, its voxel size was 15 μm. The maximum sphere algorithm was used to extract the network model, and the reconstruction result is shown in Figure 2D.
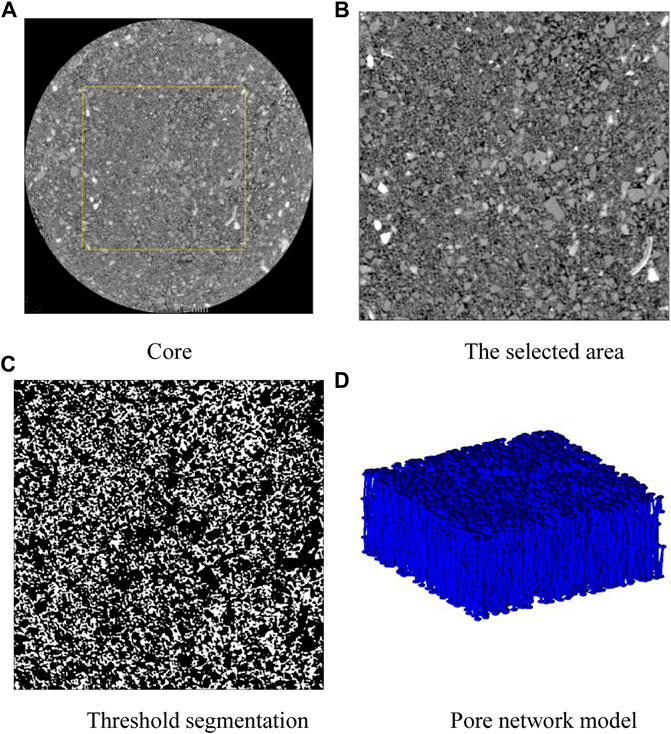
FIGURE 2. Formation process of the pore network model. (A) Core, (B) selected area, (C) threshold segmentation, and (D) pore network model.
To analyze the pore structure characteristics of the target area, the shape factors in pores and throats were counted in Figure 3 and Figure 4. The shape factor can characterize the irregularity of the cross section. The shape factor of the triangular space changed in the range of 0–0.048, and the shape factor increases gradually when the pore space was close to circular. Eighty percent of the shape factor of the extracted throat space cross section was less than 0.04 in Figure 3A. The results showed that most of the cross-sectional shapes were close to triangles, and the proportion of circular pores was lower. The shape factor of the extracted pore space cross section basically conformed to the normal distribution, and 94% of the shape factor of the pore space cross section was in the range of 0.01–0.04 in Figure 3B, indicating that the shape of most pore space cross sections was close to triangle. The low shape factor led to an increase in the water saturation in the pore throat and a decrease in the residual oil saturation when a snap-off event occurs. The larger proportion of triangular pores means that the proportion of angular water increased. These two factors led to an increase in water phase permeability in irregular pores (He et al., 2021). The statistical results of the real core pore–throat ratio are shown in Figure 4, which basically conformed to a normal distribution, and the pore–throat ratio was concentrated at approximately 3. However, the distribution curve had a bimodal shape due to the heterogeneity of connectivity.
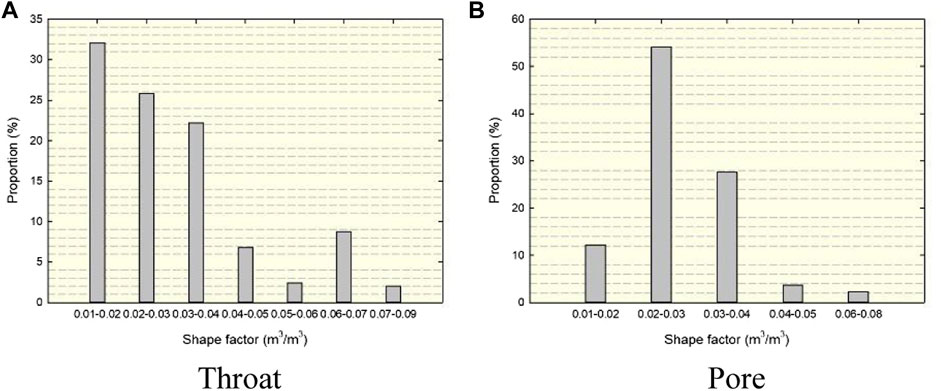
FIGURE 3. Statistical graph of real core shape factors. (A) Throat (B) and pore.
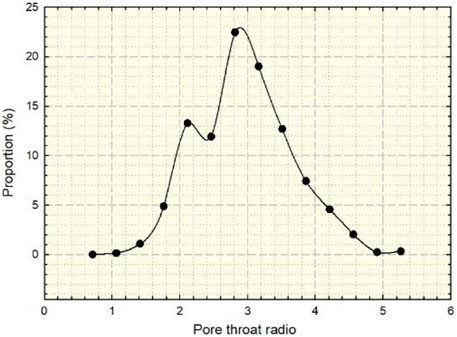
FIGURE 4. Statistical graph of the real core pore–throat ratio.
Construction and Analysis of the Fractured Model
For fractured porous media with irregular shapes, morphological operation was applied to describe the shape of the connection between porous media and fracture. The equivalent flux method was used to describe the mass transfer process in irregular porous media.
Morphological operations can perform a series of operations including shape simplification and enhancement of the image based on set theory (Wang et al., 1995). Morphological operation was used to describe the structural characteristics of pores and throats, which can preserve the details of porous media and reduce the amount of calculation. The obtained injected thin section was divided into dyeing areas in Figure 5A(FISHMEMORY, 2016). The colored grid represents the flowable areas, and the colorless area represents the nonflowable area. First, the open operation was conducted. The original configuration in Figure 5 was corroded leaving the green grid in Figure 5B. Then, the expansion operation was conducted to form the grid area composed of green and yellow as shown in Figure 5C. The purpose of the opening operation was to eliminate small particles, separate small throats, and smooth the boundary of the matrix.
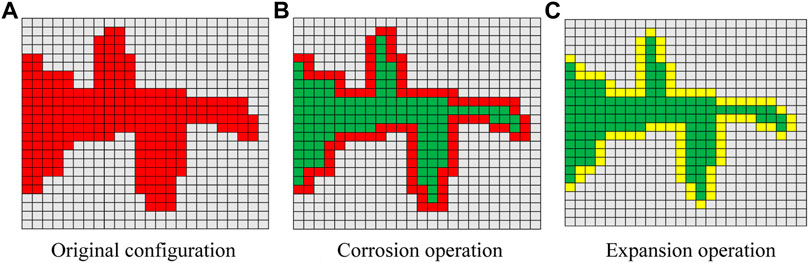
FIGURE 5. Schematic diagram of open operation (FISHMEMORY, 2016). (A) Original configuration, (B) corrosion operation, and (C) expansion operation.
The close operation was applied after the open operation in Figure 6. First, the original configuration in Figure 6A was expanded to obtain the red and green regions in Figure 6B. Then, the corrosion operation was conducted to obtain the yellow grid area in Figure 6C. The close operation can fill the small cavities in the matrix, connect the adjacent areas, and smooth the boundary.
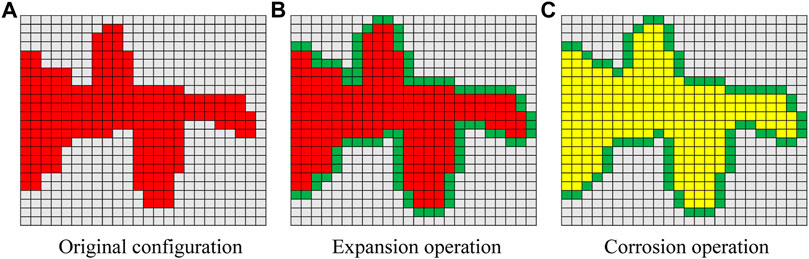
FIGURE 6. Schematic diagram of closed operation (FISHMEMORY, 2016). (A) Original configuration, (B) expansion operation, and (C) corrosion operation.
The dark area in the cast sheet is the flowable area, and the light-colored area is the nonflowable area in Figure 7A. The dye enters the fracture for the thin slice with fracture. The dyeing range can be described by morphological operation to extract the fracture morphology. The fracture is assumed as the blue line in Figure 7B. The wall of the fracture was set to the flux boundary for characterization because the injected medium quickly entered the fracture and continued to propagate. Therefore, the red area in Figure 7C represents the fracture. The fracture can be characterized in the matrix. This method was suitable for the fracture of any shape.
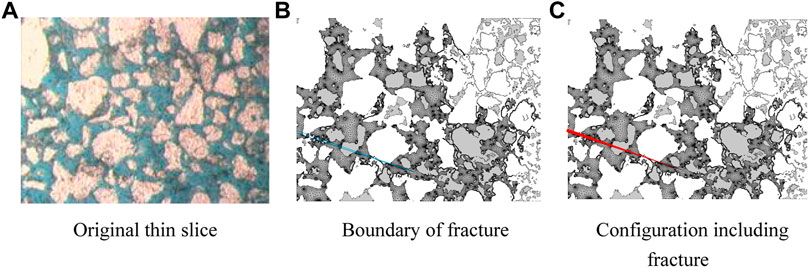
FIGURE 7. Schematic diagram of the construction process. (A) Original thin slice, (B) boundary of fracture, and (C) configuration including.
The injected medium entered the microfractures due to the much higher conductivity than that of the matrix at 0.01 ms in Figure 8A. The injected medium filled the microfractures under a pressure difference at 0.1 ms, as shown in Figure 8B. Under a concentration difference and pressure difference of 1 ms, the fluid in the fracture continuously transfers into the matrix, as shown in Figure 8C.
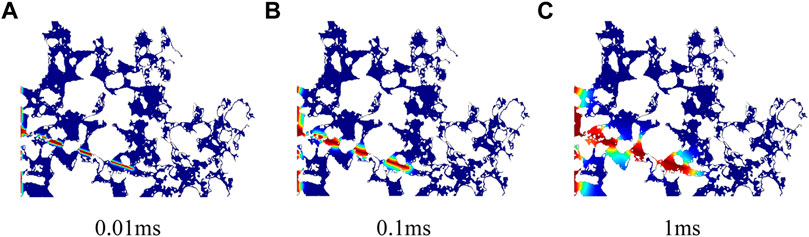
FIGURE 8. Mass transfer for fractured porous media at different time. (A) 0.01ms, (B) 0.1ms, and (C) 1ms.
Verification of the Mass Transfer Model in Porous Media
To quantitatively characterize the mass transfer of concentration diffusion, it was necessary to calculate the effective concentration diffusion coefficient of the characterization unit. The diffusion coefficient of the equivalent homogenous model was calculated by the effective diffusion coefficient of boundary concentration flux of the micromodel (Zimmerman, 2006; Ershadi and Allahverdizade, 2019). The average flux in the red dotted box was calculated by averaging the mass transfer integral at the boundary in Eq. 3.
where
The macroscopic micro real model can be regarded as a homogenous model, and the microscopic concentration diffusion model was equivalent to the representative elementary volume in Figure 9. The equivalent flux between the equivalent model and the real model means that the equivalent model can calculate the effective concentration diffusion coefficient De in Eq. 4:
where
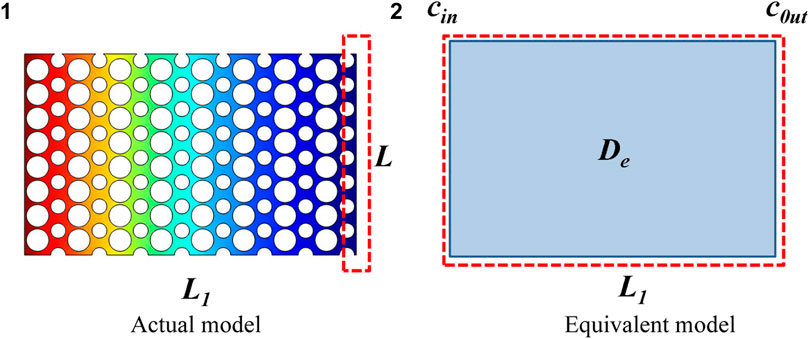
FIGURE 9. Schematic diagram of the concentration flux calculation. (A) Actual model and (B) equivalent model.
The microconcentration diffusion model was established by the aforementioned method, and the parameters are shown in Table 1. The mass transfer process in the real pore and throat is shown in Figure 10. According to Eq. 4, the diffusion coefficient of the equivalent model can be calculated to be 4.6 × 10⁻⁸ m2/ s.
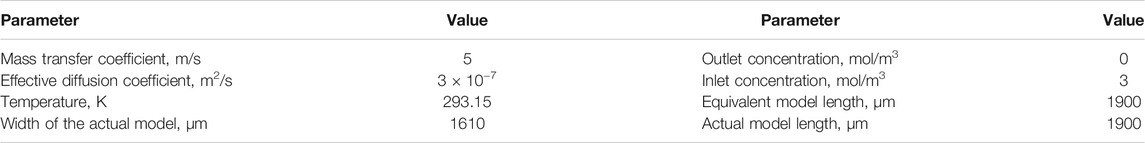
TABLE 1. Basic parameters of the porous model.
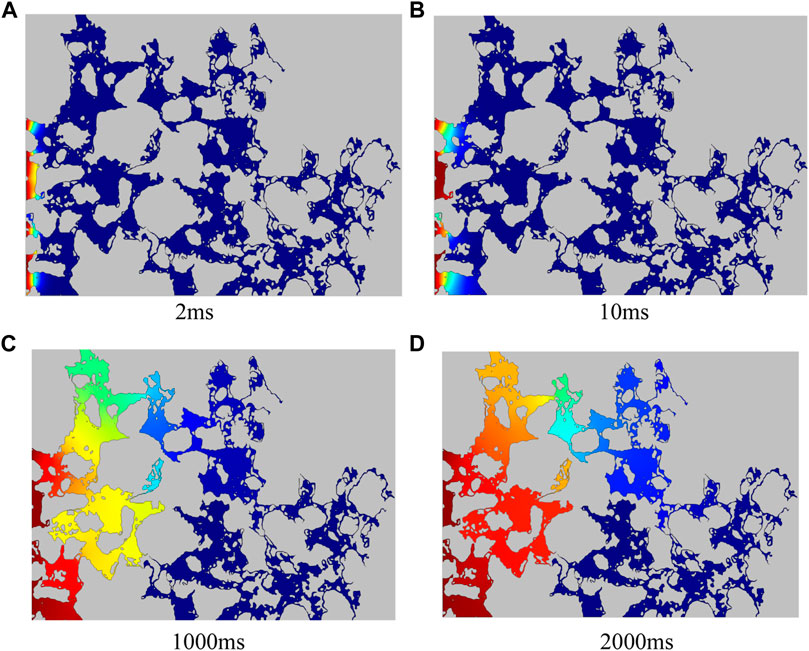
FIGURE 10. Mass transfer process in porous media at different times. (A) 2ms, (B) 10ms, (C) 1000ms, and (D) 2000ms.
The porous media model was divided into two parts, including unfractured model, which was suitable for the matrix without fractures, and fractured model, which was suitable for the matrix with fractures.
For the unfractured model, the simulated data were basically consistent with the experimental relative permeability in Figure 11A for the matrix without fractures, which showed that the pore network model is accurate.
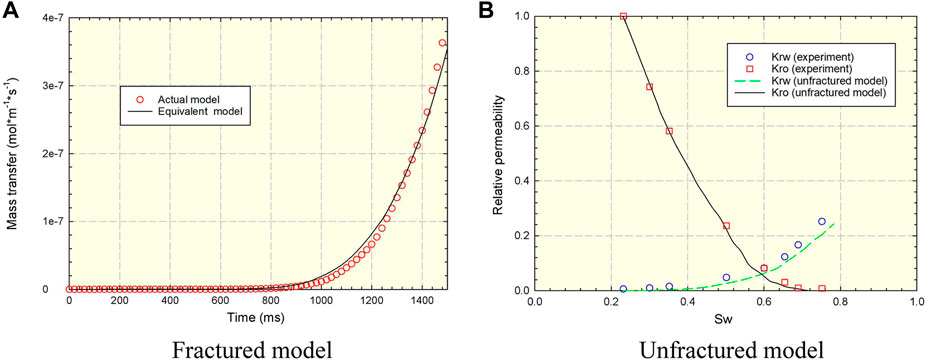
FIGURE 11. Verification of the mass transfer model in porous media. (A) Fractured model and (B) unfractured model.
For the fractured model, the actual model and the equivalent model with the modified effective diffusion coefficient were compared. The boundary flux of the two models is basically the same in Figure 11B. The modified diffusion coefficient obtained by the equivalent flux method can be used to describe the mass transfer process of injected media in porous media.
Results and Discussion
The unfractured model is built for the unfractured matrix with pore network model in Appendix, and the fractured model is built for the fractured core with the discretized mesh. The influence of effective connectivity and wettability, the characteristics of two-phase flow and water cut stage, and distribution of fluids are discussed based on the unfractured model for the matrix without fracture. The effect of irregular porous media and density of fractures is discussed based on the fractured model.
Effect of the Fracture Density
Hydraulic-fractured or naturally fractured reservoirs lead to different fracture densities in the reservoir. The influence of different fracture density on the mass transfer process is analyzed based on the fractured model. Figure 12 shows the mass transfer state of the representative elementary volume with different fracture densities at 1 ms, which includes high-density, mid-density, and low-density. The comparison of mass transfer effects under different densities is shown in Figure 13. There is no effective flow channel in porous media with the low-density fracture. The mass transfer of the boundary increases with time but always remains at a low level. For reservoirs with mid-density fractures, the existence of fractures expands the range of mass transfer and greatly improves the mass transfer of the boundary. For reservoirs with high-density fractures, fractures form effective flow channels. Injection fluid enters the fracture quickly, which leads to high mass transfer efficiency in the media porous with the high-density fracture. The effect of microfracture on mass transfer cannot be ignored.
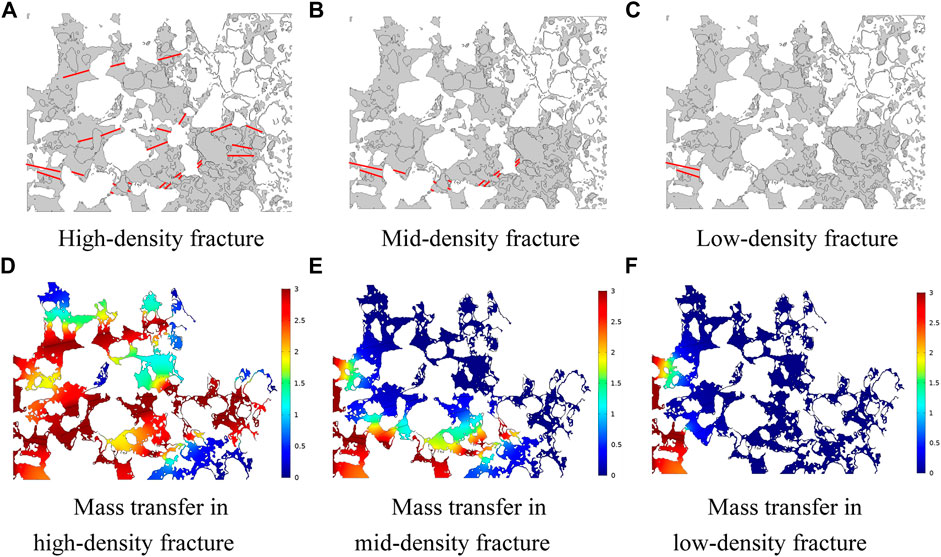
FIGURE 12. Comparison of mass transfer at 1ms with different fracture density. (A) High-density fracture, (B) mid-density fracture, (C) low-density fracture, (D) mass transfer in the high-density fracture, (E) mass transfer in the mid-density fracture, and (F) mass transfer in the low-density fracture.
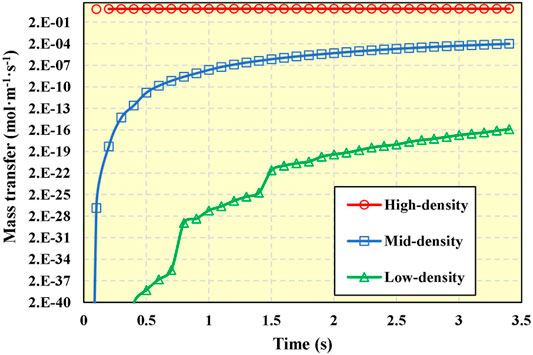
FIGURE 13. Comparison of mass transfer with different fracture density.
Impact on Effective Connectivity
BLE reduces the effective connection space resulting in a difference in seepage characteristics. This section analyzes the difference in effective flow space under BLE. Figure 14A shows the effective connection between the pore and throat without considering the BLE, and Figure 14B shows the connection considering the BLE. The small throat was blocked due to the BLE, and the number of effectively connected throats was reduced, shown as the area within the blue circle. The microscale BLE was greatly affected by the flow radius, so the microscale effect mainly exists on the flow process in small throats, and the effect on large pores can be almost ignored.
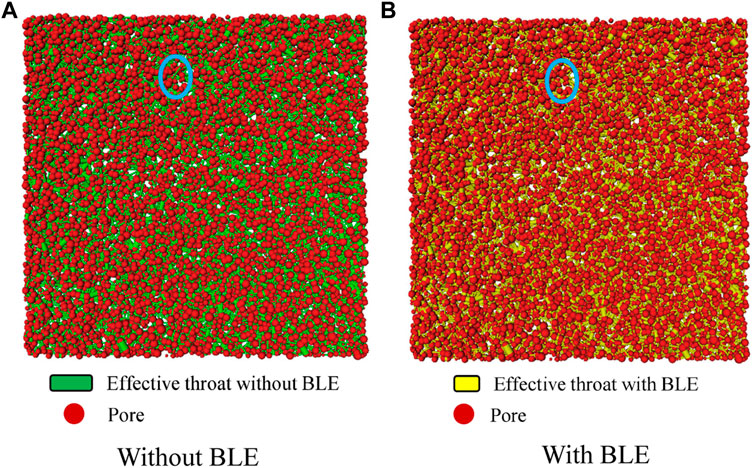
FIGURE 14. Comparison of effective connections between pores and throats. (A) Without BLE and (B) with BLE.
To quantitatively analyze the effective connectivity, the influence of BLE on the effective coordination number is compared in Figure 15. The average effective coordination number decreased from 6.49 to 6.46 due to the BLE. Specifically, the average effective coordination number was slightly reduced due to BLE, where the effective coordination number was greater than 2. It has the greatest impact on the low-coordination number pores. The attached fluid blocks the small throat, and some pores become isolated pores.
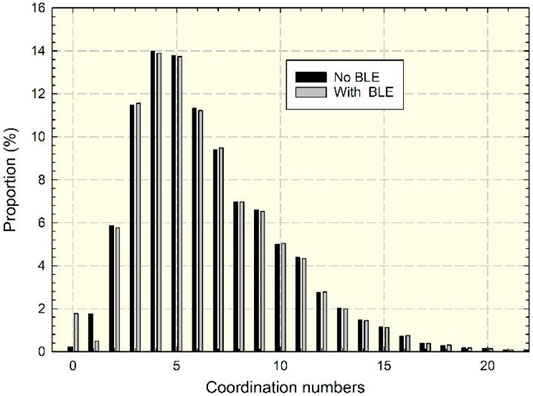
FIGURE 15. Comparison of effective coordination numbers under BLE.
The distribution of the effective throat is shown in Figure 16. BLE reduces the flow space of the effective throat, the number of effective throats decreases, and the distribution curve shifts to the left. Therefore, the influence of BLE on flow characteristics in small pores and throats should be considered.
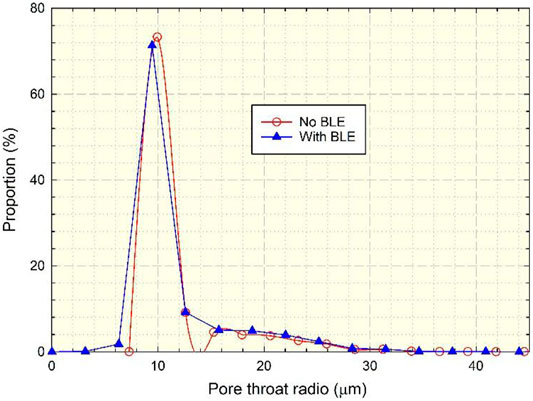
FIGURE 16. Comparison of the distribution of the effective throat radius under BLE.
Impact on Characteristics of Two-Phase Flow
The two-phase permeability curve is an important parameter of macronumerical simulation (Gao and Hu, 2016). The conventional simulation ignored the influence of BLE on microscale two-phase flow (Hughes and Blunt, 2000). When the water saturation was less than 0.3, the capillary force increases, and the water phase permeability increases. The effective throat space was compressed due to BLE in Figure 17 and Figure 18. In the initial stage, a large capillary force was required for displacement. With the process of water flooding, the water film in the pores increased, resulting in the sticking of crude oil in the pores. Therefore, when the water saturation was greater than 0.3, the capillary force decreases. The water film and the water phase permeability increase, and the oil phase permeability decreases. The two-phase seepage area decreased, leading to more residual oil and a worse effect on displacement.
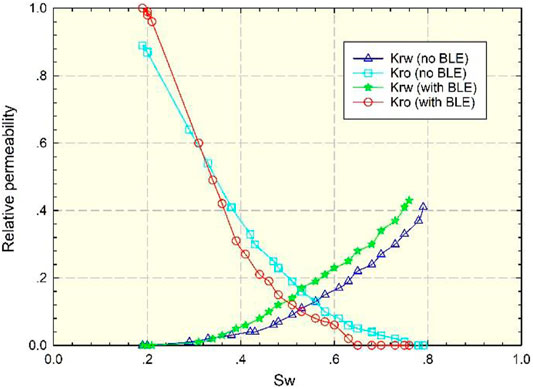
FIGURE 17. Comparison of relative permeability with BLE.
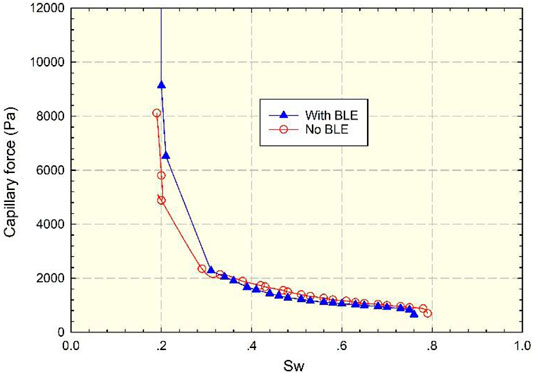
FIGURE 18. Comparison of capillary forces with BLE.
Impact on Oil and Water Distribution
Heavy oil has issues of difficult production and a low-recovery degree, which is different from conventional crude oil (Thomas, 2008; Wassmuth et al., 2009). This section focuses on the analysis of residual oil with BLE. The distribution of oil–water after displacement is compared in Figure 19, and the oil–water distribution is counted to quantitatively compare the displacement effect. The number of pores with only bulk water decreased from 1,082 to 1,052 with BLE, and the number of pores containing bulk oil and water film increased from 4,762 to 4,819, which indicated that fluid more easily adhered to the wall and that the displacement efficiency was reduced with BLE. The pore number of only bulk oil remained at 6, indicating that the BLE has little effect on the residual displacement difficulty.
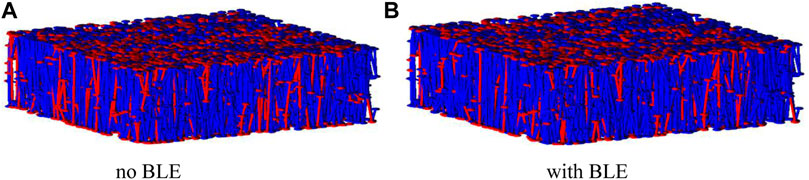
FIGURE 19. Comparison of oil–water distribution under BLE. (A) Without BLE and (B) with BLE.
Influence of Wettability
Wettability had an important impact on EOR (Leach et al., 1962; Morrow, 1990). Many researchers propose injecting chemicals to transform oil wet reservoirs into water wet reservoirs to improve oil recovery (Ali et al., 2020; Nazarahari et al., 2021; Wang et al., 2021). The oil displacement effect under different wettability conditions is compared in this section (contact angle includes 30°, 60°, 120°, and 150°), and the impact on wettability on the relative permeability curve and capillary force curve is analyzed in Supplementary Figure S1 and Supplementary Figure S2. After the reservoir wettability was enhanced, the higher water phase permeability led to a better oil displacement effect. Under the same saturation condition, the capillary force in the wet water reservoir was the driving force, and the capillary force in the wet oil reservoir was the resistance, as shown in Supplementary Figure S2. Therefore, the utilization degree of small pores and throats is improved after wetting reversal by the injection of chemicals.
Influence of the Water Cut Stage
It is of great significance to take different injection measures in different water cut stages (Rez-Morejó et al., 2019; Zhu et al., 2020). Many researchers proposed early polymer injection (Shi et al., 2020), where polymer is injected in the low water-cut to improve the recovery of heavy oil. This section focuses on the comparison of displacement effects in different water cut stages (20, 40, and 60%). In the displacement of the low water-cut stage, the oil phase permeability increased, and the flow capacity became stronger, as shown in Supplementary Figure S3. However, the two-phase area was wider, and the production range was wider. Therefore, from the perspective of two-phase flow capacity, it was better to inject fluid and implement adjustment measures in the low water-cut stage. The blue curve was much higher than the red curve in Supplementary Figure S4, which means that the injected fluid needs to overcome more capillary resistance in the high water-cut stage. Therefore, it was beneficial to implement various adjustment measures in the low water-cut stage, which had a better displacement effect and lower injection difficulty.
Effect of Irregular Porous Media
Porous media have irregular shapes, especially fractured porous media. The representative elementary volume has used a homogenous medium in conventional simulation and ignores the influence of the porous media shape. The irregular shape influences the mass transfer process, which is compared in this section. The effective diffusion coefficient decreases from 3 × 10⁻⁷ m2/s to 4.6 × 10⁻⁸m2/s considering the shape of porous media in Section 2, and the effect on macromass transfer was analyzed based on the modified effective diffusion coefficient. The production well in the target block, where the five-spot pattern was used for gas injection, was selected to compare the effect of irregular porous media. The oil production is shown in Supplementary Figure S5, and the basic physical property parameters of the block are shown in Table. 2. At the initial stage of production, the crude oil near the well was mainly produced by horizontal wells, so the production was essentially the same. At this time, the production was mainly affected by gas displacement, and the diffusion has little impact. In the later stage of development, the diffusion effect was gradually reflected. A part of the injected gas spread to nearby areas, which reduced the displacement effect. The diffusion effect was weakened considering the irregular shape of porous media, so the production was higher than the unmodified production. The irregular shape of porous media should be considered in the macrosimulation process.
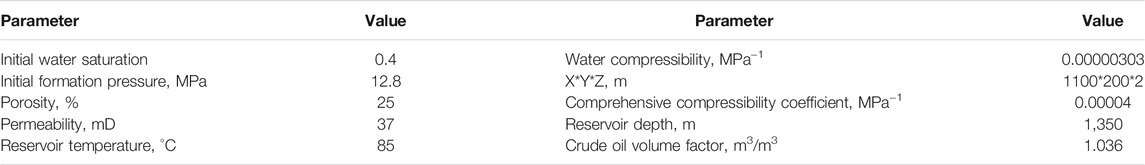
TABLE 2. Basic parameters of the target block.
Conclusion
In this study, a three-dimensional pore network model was extracted from the CT scanning data and thin-section data of a real core, and the seepage model was modified to analyze the influence of the BLE on seepage characteristics.
1. Morphological operation can extract the real shape of a porous media model based on cast sheets, which can preserve the characteristics of pores and reduce the number of simulation calculations. The fractured model can be used to quantitatively describe the mass transfer, and the effect of microfracture on mass transfer should be considered by the comparison of different fracture densities.
2. CT scan data of the target block can be extracted according to the maximal sphere algorithm to establish a three-dimensional real pore structure, and the parameters of the pore structure can be statistically analyzed. The BLE at pore scale can be characterized in the pore network model by modifying the effective flow rate. The existence of BLE reduces the effective flow space by comparing the effective pore–throat ratio, effective coordination number, and other structural parameters. The BLE offsets the two-phase permeability curve and capillary force curve. The fluid more easily adhered to the wall, and the microscopic oil displacement efficiency was reduced.
3. By comparing the changes of two-phase seepage characteristics under different conditions, it was found that the sweep efficiency of the small pore throat was improved after wettability alteration. It is more advantageous to conduct various adjustment measures in the low water-cut stage due to the higher sweep efficiency and lower difficulty of injection.
Data Availability Statement
The original contributions presented in the study are included in the article/Supplementary Material; further inquiries can be directed to the corresponding author.
Author Contributions
DW, JZ, and XZ contributed to the conception and design of the study. DW organized the database. DW performed the statistical analysis. DW wrote the first draft of the manuscript. All authors contributed to manuscript revision and read and approved the submitted version
Conflict of Interest
Authors DW, XZ, and JZ were employed by the company CNOOC Research Institute Co. Ltd.
Publisher’s Note
All claims expressed in this article are solely those of the authors and do not necessarily represent those of their affiliated organizations, or those of the publisher, the editors, and the reviewers. Any product that may be evaluated in this article, or claim that may be made by its manufacturer, is not guaranteed or endorsed by the publisher.
Acknowledgments
We thank the support of “Chemical Flooding Technology for Offshore Oil Fields,” (No. 2016ZX05025-003) a major national special project during the 13th Five-Year Plan period, and “Heavy Oil Chemical Flooding Mechanism and Simulation Technology Research” (No. 2019- YXKJ -008).
Supplementary Material
The Supplementary Material for this article can be found online at: https://www.frontiersin.org/articles/10.3389/feart.2021.797617/full#supplementary-material
Supplementary Figure 1 | Comparison of relative permeability under different wettability conditions.
Supplementary Figure 2 | Comparison of capillary force curves under different wettability 318 conditions.
Supplementary Figure 3 | Comparison of relative permeability in different water cut stages.
Supplementary Figure 4 | Comparison of capillary force curves at different 335 water cut stages.
Supplementary Figure 5 | Effect of irregular porous media during the macroscopic 357 mass transfer process.
References
Ali, M., Sahito, M. F., Jha, N. K., Arain, Z.-U. -A., Memon, S., Keshavarz, A., et al. (2020). Effect of Nanofluid on CO2-wettability Reversal of sandstone Formation; Implications for CO2 Geo-Storage. J. Colloid Interf. Sci. 559, 304–312. doi:10.1016/j.jcis.2019.10.028
Babadagli, T. (2003). Evaluation of EOR Methods for Heavy-Oil Recovery in Naturally Fractured Reservoirs. J. Pet. Sci. Eng. 37 (1), 25–37. doi:10.1016/s0920-4105(02)00309-1
Bazazi, P., Sanati-Nezhad, A., and Hejazi, S. H. (2019). Role of Chemical Additives on Water-Based Heavy Oil Mobilization: A Microfluidic Approach. Fuel 241, 1195–1202. doi:10.1016/j.fuel.2018.12.099
Blunt, M. J. (2001). Flow in Porous media - Pore-Network Models and Multiphase Flow. Curr. Opin. Colloid Interf. Sci. 6 (3), 197–207. doi:10.1016/s1359-0294(01)00084-x
Chen, M., Cheng, L., Cao, R., and Lyu, C. (2018). A Study to Investigate Fluid-Solid Interaction Effects on Fluid Flow in Micro Scales. Energies 11 (9), 2197. doi:10.3390/en11092197
Cheng, J.-T., Morris, J. P., Tran, J., Lumsdaine, A., Giordano, N. J., Nolte, D. D., et al. (2004). Single-phase Flow in a Rock Fracture: Micro-model Experiments and Network Flow Simulation. Int. J. rock Mech. mining Sci. 41 (4), 687–693. doi:10.1016/j.ijrmms.2004.01.003
Cheng, L., Wang, D., Cao, R., and Xia, R. (2020). The Influence of Hydraulic Fractures on Oil Recovery by Water Flooding Processes in Tight Oil Reservoirs: an Experimental and Numerical Approach. J. Pet. Sci. Eng. 185, 106572. doi:10.1016/j.petrol.2019.106572
Dong, H., and Blunt, M. J. (2009). Pore-network Extraction from Micro-computerized-tomography Images. Phys. Rev. E Stat. Nonlin Soft Matter Phys. 80 (3), 036307. doi:10.1103/PhysRevE.80.036307
Ershadi, M. N., and Allahverdizade, M. (2019). “Introduction to COMSOL Multiphysics and Numerical Simulations (In Persian),” in Journal of Scientific Association of Mechanical Engineering- University of Tabriz (Tabriz: Scientific Association of Mechanical Engineering- University of Tabriz).
FISHMEMORY (2016). Morphology-corrosion, Expansion, Open Operation, Close Operation. Available at: https://blog.csdn.net/fishmemory/article/details/53113746.
Gao, Z., and Hu, Q. (2016). Initial Water Saturation and Imbibition Fluid Affect Spontaneous Imbibition into Barnett Shale Samples. J. Nat. Gas Sci. Eng. 34, 541–551. doi:10.1016/j.jngse.2016.07.038
Gostick, J., Aghighi, M., Hinebaugh, J., Tranter, T., Hoeh, M. A., Day, H., et al. (2016). OpenPNM: a Pore Network Modeling Package. Comput. Sci. Eng. 18 (4), 60–74. doi:10.1109/mcse.2016.49
He, M., Zhou, Y., Wu, K., Hu, Y., Feng, D., Zhang, T., et al. (2021). Pore Network Modeling of Thin Water Film and its Influence on Relative Permeability Curves in Tight Formations. Fuel 289, 119828. doi:10.1016/j.fuel.2020.119828
Hughes, R. G., and Blunt, M. J. (2000). Pore Scale Modeling of Rate Effects in Imbibition. Transport in Porous Media 40 (3), 295–322. doi:10.1023/a:1006629019153
Ke, H., Yuan, M., and Xia, S. (2020). A Review of Nanomaterials as Viscosity Reducer for Heavy Oil. J. Dispersion Sci. Tech. 3, 1–12. doi:10.1080/01932691.2020.1851246
Leach, R. O., Wagner, O. R., Wood, H. W., and Harpke, C. F. (1962). A Laboratory and Field Study of Wettability Adjustment in Water Flooding. J. Pet. Technol. 14 (02), 206–212. doi:10.2118/119-pa
Morrow, N. R. (1990). Wettability and its Effect on Oil Recovery. J. Pet. Technol. 42484 (121)–14761.
Nazarahari, M. J., Manshad, A. K., Ali, M., Ali, J. A., Shafiei, A., Sajadi, S. M., et al. (2021). Impact of a Novel Biosynthesized Nanocomposite (SiO2@Montmorilant@Xanthan) on Wettability Shift and Interfacial Tension: Applications for Enhanced Oil Recovery. Fuel 298, 120773. doi:10.1016/j.fuel.2021.120773
Rahnema, H., Kharrat, R., and Rostami, B. (2008). “Experimental and Numerical Study of Vapor Extraction Process (VAPEX) in Heavy Oil Fractured Reservoir,” in Canadian International Petroleum Conference, Calgary, Alberta, Canada, June 17-19, 2008. doi:10.2118/2008-116
Rez-Morejó, J. J., Bertin, H., Omari, A., Hamon, G., Cottin, C., Morel, D., et al. (2019). A New Approach to Polymer Flooding: Effects of Early Polymer Injection and Wettability on Final Oil Recovery. SPE Journal-Richardson 24, 129–139. doi:10.2118/190817-pa
Secchi, E., Marbach, S., Niguès, A., Stein, D., Siria, A., and Bocquet, L. (2016). Massive Radius-dependent Flow Slippage in Carbon Nanotubes. Nature 537 (7619), 210–213. doi:10.1038/nature19315
Shi, L., Zhu, S., Guo, Z., Zhao, W., Xue, X., Wang, X., et al. (2020). Experimental Study on the Effect of Polymer Injection Timing on Oil Displacement in Porous media. Processes 8 (1), 93. doi:10.3390/pr8010093
Souraki, Y., Ashrafi, M., Karimaie, H., and Torsaeter, O. (2011). “Experimental Investigation and Numerical Simulation of Steam Flooding in Heavy Oil Fractured Reservoir,” in SPE Western North American Region Meeting, Anchorage, Alaska, USA, May 7-11, 2011. doi:10.2118/144552-ms
Su, K., Lu, J., Zhang, H., Chen, S., Li, Y., Xiao, Z., et al. (2020). Quantitative Study on Hydrocarbon Expulsion Mechanism Based on Micro-fracture. Geosci. Front. 11 (6), 1901–1913. doi:10.1016/j.gsf.2020.05.013
Sun, H., Duan, L., Liu, L., Fan, W., Fan, D., Yao, J., et al. (2019). The Influence of Micro-fractures on the Flow in Tight Oil Reservoirs Based on Pore-Network Models. Energies 12 (21), 4104. doi:10.3390/en12214104
Tang, X., Jin, Z., Yang, M., and Ming, H. (2007). Experimental Study on Water-Oil Migration and Accumulation in a 2D Micro-model of Carbonate Fracture media. Front. Earth Sci. China 1 (2), 251–256. doi:10.1007/s11707-007-0031-4
Thomas, S. (2008). Enhanced Oil Recovery - an Overview. Oil Gas Sci. Tech. - Rev. IFP 63 (1), 9–19. doi:10.2516/ogst:2007060
Wang, D., Haese-Coat, V., and Ronsin, J. (1995). Shape Decomposition and Representation Using a Recursive Morphological Operation. Pattern Recognition 28 (11), 1783–1792. doi:10.1016/0031-3203(95)00036-y
Wang, X., and Sheng, J. J. (2019). Multi-scaled Pore Network Modeling of Gas-Water Flow in Shale Formations. J. Pet. Sci. Eng. 177, 899–908. doi:10.1016/j.petrol.2019.03.005
Wang, Y., Liang, L., Li, Y., Liu, B., and Tang, L. (2021). Preparation and Application of a Fluoropolymer Emulsion as Novel Wettability Reversal Agent. Colloids Surf. A: Physicochemical Eng. Aspects 612, 125985. doi:10.1016/j.colsurfa.2020.125985
Wassmuth, F. R., Green, K., Arnold, W., and Cameron, N. (2009). Polymer Flood Application to Improve Heavy Oil Recovery at East Bodo. J. Can. Pet. Tech. 48 (02), 55–61. doi:10.2118/09-02-55
Wu, J., Cheng, L., Li, C., Cao, R., Chen, C., Cao, M., et al. (2017). Experimental Study of Nonlinear Flow in Micropores under Low Pressure gradientTransport in Porous Media. Transp Porous Med. 119 (1), 247–265. doi:10.1007/s11242-017-0882-4
Wu, J., Fu, W., Yan, Q., Chen, Y., Hu, Y., Wang, Z., et al. (2021). A Dissipative Particle Dynamics Study:influence of Fluid-Solid Interaction Force on Micro-flow in Shale Slits. Arab J. Geosci. 14 (6), 461. doi:10.1007/s12517-021-06839-4
Wu, K., Chen, Z., Li, J., Li, X., Xu, J., and Dong, X. (2017). Wettability Effect on Nanoconfined Water Flow. Proc. Natl. Acad. Sci. USA 114 (13), 3358–3363. doi:10.1073/pnas.1612608114
Yin, Y., and Liu, Y. (2015). FEM Analysis of Fluid-Structure Interaction in Thermal Heavy Oil Recovery Operations. Sustainability 7 (4), 4035–4048. doi:10.3390/su7044035
Zhu, S., Ye, Z., Zhang, J., Xue, X., Chen, Z., and Xiang, Z. (2020). Research on Optimal Timing Range for Early Polymer Injection in sandstone Reservoir. Energ. Rep. 6, 3357–3364. doi:10.1016/j.egyr.2020.11.247
Zimmerman, W. B. J. (2006). Introduction to Comsol Multiphysics. Multiphysics Modeling with Finite Element Methods. Singapore: World Scientific Publishing Company.
Appendix
The method by Blunt (Blunt, 2001) can be used to calculate the two-phase permeability. The absolute permeability can be calculated according to Eq. 5, when there is only single-phase fluid in the pores.
The relative permeability can be calculated according to Eq. 6
where
The conductivity can be calculated from Eq. 8
The conductivity of single phase can be determined according to the Hagen–Poiseuille equation:
Keywords: numerical simulation, pore network model, porous media, microscale seepage, fluid–solid interaction
Citation: Wang D, Zhang X and Zhang J (2021) Research on Boundary Layer Effect in Fractured Reservoirs Based on Pore-Scale Models. Front. Earth Sci. 9:797617. doi: 10.3389/feart.2021.797617
Received: 19 October 2021; Accepted: 16 November 2021;
Published: 20 December 2021.
Edited by:
Yanyong Wang, Chengdu University of Technology, ChinaReviewed by:
Jiazheng Qin, Southwest Petroleum University, ChinaLijun Liu, Chengdu University of Technology, China
Copyright © 2021 Wang, Zhang and Zhang. This is an open-access article distributed under the terms of the Creative Commons Attribution License (CC BY). The use, distribution or reproduction in other forums is permitted, provided the original author(s) and the copyright owner(s) are credited and that the original publication in this journal is cited, in accordance with accepted academic practice. No use, distribution or reproduction is permitted which does not comply with these terms.
*Correspondence: Deqiang Wang, MjAxNzMxMjAzOEBzdHVkZW50LmN1cC5lZHUuY24=