 Hao Zhou
 Min Dai
 Penghui Wang
 Min Wei
 Lu Tang
 Siyou Xu
 Zhicai Luo
- 1MOE Key Laboratory of Fundamental Physical Quantities Measurement, PGMF and School of Physics, Huazhong University of Science and Technology, Wuhan, China
- 2Institute of Geophysics and PGMF, Huazhong University of Science and Technology, Wuhan, China
Leakage errors derived from spatial filters are the major limitation for estimating terrestrial water storage via the Gravity Recovery and Climate Experiment (GRACE) mission and the recently launched GRACE Follow-On mission. Here we develop an improved forward modeling method and assess its performance of reducing leakage errors over Africa. In noise-free condition, the forward modeling method shows its outperformance in restoring signals, and the improved forward modeling method can further reduce the leakage errors along the coastline of Africa. In noise-contaminated condition, the simulated environment is set as real as possible to GRACE mission and GRACE Follow-On mission. The results based on the simulated GRACE and GRACE Follow-On solutions demonstrate the capacity of improved forward modeling method in reducing leakage errors. In the case of simulated GRACE data, the average improvements of 24 basins over Africa are respectively 37% for annual amplitudes and 36% for trends. When compared with these simulated GRACE data, the improvements via simulated GRACE Follow-On solutions are minor over large and medium size river basins, but they are significant over small size river basins. In the case of simulated GRACE Follow-On solutions, the average improvements over Africa are 39% for annual amplitudes and 41% for trends. Eventually, the improved forward modeling method is used to process GRACE spherical harmonic datasets from the Center for Space Research (CSR). The results present better agreement with those derived from the newly released mascon solutions from Jet Propulsion Laboratory (JPL) and CSR, when compared with those derived from CSR Tellus grids with scale factors. The better consistency between these model-independent approaches indicates the good performance of our improved forward modeling method and the further necessity of careful evaluation of model-dependent approaches when using different prior hydrological models. Overall, experiments based on noise-free observations, noise-contaminated observations, and GRACE datasets indicate that improved forward modeling method is capable of restoring temporal signals.
Introduction
The Gravity Recovery and Climate Experiment (GRACE) mission has provided information about Earth’s time-variable gravity field with unprecedented accuracy between 2002 and 2017 (Tapley et al., 2004). Its unique measurements of terrestrial water storage (TWS), including surface water, soil moisture, snow water, and groundwater arouse the interests in handling various hydrologic problems (e.g., Rodell et al., 2018; Scanlon et al., 2018; Chao et al., 2017; Yang et al., 2017; Pan et al., 2017; Zhou et al., 2018; Tangdamrongsub et al., 2018; Ran et al., 2018). The applications of GRACE measurements to hydrologic problems are also extensive over Africa, where there is a lack of ground-based hydrologic observations while seriously suffering various hydrological disasters. These works greatly improve understanding of hydrologic events related to floods (e.g., Anyah et al., 2018; Ni et al., 2017), droughts (e.g., Ndehedehe et al., 2016; Chao et al., 2016; Seyoum, 2018), estimation of groundwater depletion (e.g., Rodell et al., 2018; Lezzaik et al., 2018), and regional evapotranspiration (Andam-Akorful et al., 2015).
Although GRACE data has been widely used to improve the understanding of various hydrologic problems, there are still several challenges in quantitatively interpreting them. The major challenge is how to handle the high-frequency errors and correlated errors in GRACE data, which reveal as north-south stripe errors in the spatial domain. To reduce these errors, geodesists have made great efforts in the spatial filtering of spherical harmonic coefficients (e.g., Jekeli et al., 1981; Swenson and Wahr, 2006; Kusche et al., 2009). These filters can successfully suppress the strip errors, while the temporal signals in terms of amplitudes and trends are also suppressed. As quantifying TWS variations is vital for hydrologic applications, advances are necessary to reduce the leakage errors which are derived from these spatial filters (Scanlon et al., 2016).
To reduce leakage errors in filtered GRACE TWS signals, three kinds of approaches are generally developed. (1) The first approach is calculating a scaling factor between the filtered and unfiltered TWS variations from land surface models (Landerer and Swenson, 2012). As this approach is easy to implement, it has been widely used with individual basins or regions globally (Pokhrel et al., 2013; Yao et al., 2016; Long et al., 2015), while it may include biases by the dependency on a particular land surface model (Long et al., 2015a; Tangdamrongsub et al., 2016). (2) The second approach is directly solving ill-posed GRACE estimation problem with mascon solutions. The most recently representative advances are the CSR RL05 mascon solutions (Save et al., 2016) and JPL RL05M solutions (Watkins et al., 2015; Wiese et al., 2016). Their cross-comparison result indicates a good agreement in annual amplitudes in large river basins, while the small size river basins still need further investigations. (3) The third approach is forward modeling method which directly restores temporal signals (Chen et al., 2013; 2015; Tangdamrongsub et al., 2016), and it is independent from any land surface model. Alternative approaches for restoring temporal signals include the statistical method (Forrontan et al., 2014), data-driven approach (Vishwakarma et al., 2016), refocusing methods (Guo et al., 2010), etc. Forward modeling method has been widely used in several specific regions (Chen et al., 2013, 2014, 2015; Jin and Zou, 2015; Wu et al., 2015; Ni et al., 2017). Chen et al. (2015) simulated a synthetic trend over West Antarctic and mainly evaluated the performance of forward modeling method in noise-free condition. As GRACE data is contaminated by noise, in order to obtain accurate temporal signals, a full evaluation about the performance of forward modeling method in noise-contaminated condition is necessary. In addition, the study region in Chen et al. (2015) is an isolated area and the leakage errors from adjacent areas are negligible. For the river basins all over the world, the areas are limited and most of them are adjacent to each other, and parts of them are along the coastline of mainland. To prompt this method to hydrology, it is necessary to assess its performance for the river basins in more complicated conditions (e.g., isolated or surrounded distribution, large or small size, different climate zones, and away or along coastlines).
In this contribution, we evaluate the performance of forward modeling method in both noise-free and noise-contaminated condition over Africa. In the evaluation procedure, we use a close-loop simulation environment to generate the in-orbit observations and retrieve the noise-contaminated temporal gravity field model. To the author’s knowledge, this is the first time that forward modeling method has been comprehensively evaluated in a complicated region under such a closed-loop simulation environment. During evaluating the general forward modeling method, we also find the result of this approach presents obvious errors along the coastline of Africa. Therefore, we develop an improved forward modeling method in this work. The performance of this improved forward modeling method is also assessed with simulated data and real GRACE data. Finally, the potential improvements with GRACE Follow-On data are also discussed.
Data and Analysis
Study Region
Africa (Figure 1) is the second largest continent in the world, accounting for about 20% of the world’s total land area. According to Oki and Sud (1998), 24 river basins over Africa are used. The basin definitions and their areas are derived from the Total Runoff Integrating Pathway (TRIP) database (http://hydro.iis.utokyo.ac.jp/taikan/TRIPDATA/TRIPDATA.html). The characteristics of these river basins are listed in Table 1. The aridity index (AI) of each basin is the basin averaged value derived from Global Aridity and PET database (http://www.cgiar-csi.org/data/global-aridity-and-pet-database). Based on AI, these basins are categorized as humid river basins (AI > 0.65), sub-humid river basins (0.5 < AI ≤ 0.65), semi-arid river basins (0.2 < AI ≤ 0.5), and arid river basins (AI < 0.2). Referring to Long et al. (2017), the Congo River Basin, the Nile River Basin, the Niger River Basin, and the Zambezi River Basin are categorized as large basins (basin area >1,000,000 km2); the Orange River Basin, the Chari River Basin, the Okavango River Basin, the Jubba River Basin, the Limpopo River Basin, the Senegal River Basin, and the Volta River Basin are categorized as medium size basins (200,000 km2 < basin area ≤1,000,000 km2); and the other basins are categorized as small basins (basin area ≤200,000 km2). The coastline of Africa is about 26,000 km long, and there are about 20 out of 24 river basins along the coastline. As the leakage errors are always large along the coast, it is necessary to introduce a temporal signal restoration method for GRACE TWS estimation over Africa. It is also one of reasons that we choose Africa as the study region.
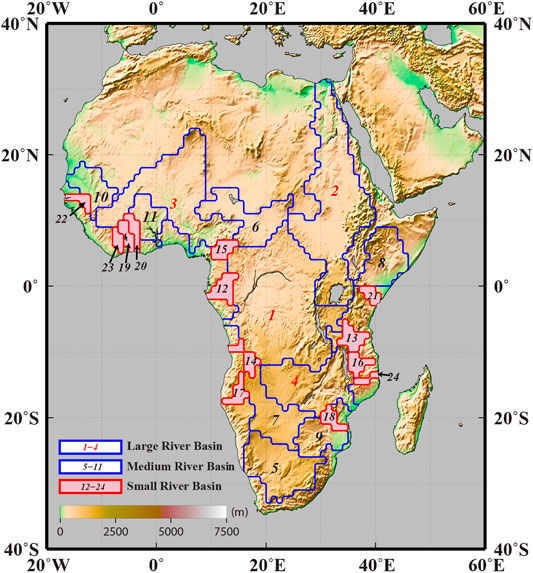
FIGURE 1. The study region of Africa. According to the size of river basins, they are categorized as large river basin, medium river basin, and small river basin. More details of these river basins are listed in Table 1.
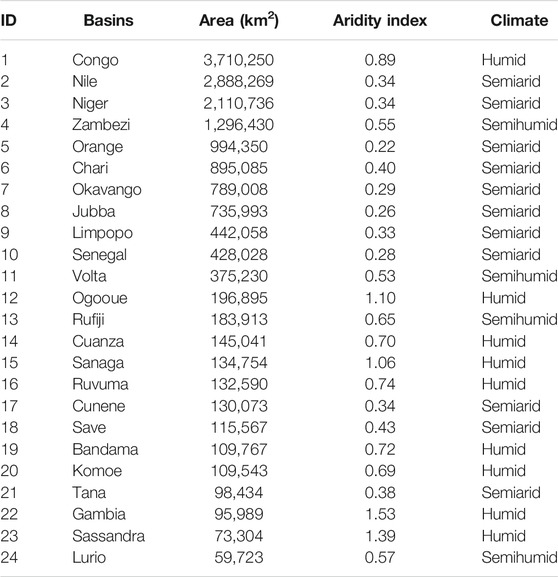
TABLE 1. Characteristics of the river basins over Africa.
GRACE Datasets
In this study, we use monthly GRACE release 05 Level-2 product from the Center for Space Research (CSR), University of Texas at Austin, in the form of spherical harmonic coefficients (SHCs) up to degree and order 60 (ftp://podaac.jpl.nasa.gov/allData/grace/L2/CSR/RL05). Note that the newest release 06 Level-2 product is not applied, which presents as smaller noise in spectral domain and spatial domain. This is important because it enables a more noise-contaminated condition, which is helpful to assess the stability of forward-modeling method.
After removing the long-term mean of monthly GRACE data, the mass changes in terms of equivalent water heights (EWHs) over Africa are calculated (Chao and Gross, 1987; Wahr et al., 1998). GRACE data is contaminated by both observation errors and prior force model errors, including longitudinal stripes associated with correlations of certain SHCs separately as functions of even and odd degrees, aliases of tide model errors, and errors in oceanic and atmospheric model estimates. To alleviate these errors, spatial smoothing filters as well as decorrelation filters are commonly used (Jekeli et al., 1981; Swenson and Wahr, 2006). The de-correlation filter P3M6 is used to reduce correlated errors, and 300 km Gaussian filter is used to further suppress high-frequency noise in CSR release 05 model. These filters can effectively reduce correlated errors and high-frequency errors, and also cause the leakage errors associated with both limited spatial resolution and attenuated signal amplitudes. Here we use forward-modeling method (Chen et al., 2015; Tangdamrongsub et al., 2016) to reduce the leakage errors. For a fair cross-comparison, the same processing procedure of degree-1, degree-2 replacement, and GIA correction is applied following mascon processing procedures.
Apart from SHCs, the mascon grids and GRACE Tellus mass grids are also widely used for TWS estimation (Reager et al., 2016; Bridget et al., 2016; Wiese et al., 2016; Zhou et al., 2018a; Tourian et al., 2018; Landerer et al., 2012). For cross-comparison, the Jet Propulsion Laboratory (JPL) mascon solution JPL RL05M (https://grace.jpl/nasa.gov/data/get-data/jpl_global_mascons), CSR RL05 mascon solution (http://www2.csr.utexas.edu.grace/), and GRACE Tellus mass grids (https://grace.jpl.nasa.gov/data/get-data/monthly-mass-grids-land/) are also used. The JPL RL05M solution is determined by adding a priori spatial correlations, which contains the prior information from GLDAS (Global Land Data Assimilation System) and ECCO2 (Estimating the Circulation and Climate of the Ocean phase two) models (Watkins et al., 2015). The CSR RL05 mascon solution is purely determined by GRACE data and independent of external data (Save et al., 2016). The scale factors are also included in GRACE Tellus mass grids, which are used to reduce the signal losses introduced by both a limited range of SHCs (degree and order 60) and 300 km Gaussian smoothing. These scale factors are estimated based on the land surface model NCAR’s CLM4 (Landerer et al., 2012). In terms of the spatial resolution, the JPL RL05M is the solution with 4,551 equal-area 3 ° × 3 ° spherical cap mascon grids. To reduce the leakage error along the coastlines, a Coastline Resolution Improvement (CRI) filter is employed, and the mascon grids are spatially averaged to 1 ° × 1 ° bins. As for CSR RL05 mascon solutions, these 0.5° longitude-latitude grids are averaged to 1 ° × 1 ° bins. The GRACE Tellus grids provide the 1 ° × 1 ° grids.
Forward Modeling Method
General Forward Modeling Method
Truncation and filtering of GRACE data are expected to significantly affect the amplitudes and trends of the true signals (Chen et al., 2015). To reduce these leakage errors, unconstrained forward modeling method is used, and the general procedures are as follows (Figure 2):
(1) After the spatial smoothing filters are applied to ‘Input SHCs’, the ‘Filtered EWHs’ are computed via spherical harmonic using Equation 3. In the first iteration, the ‘Candidated EWHs’ is set equal to the ‘Filtered EWHs’.
(2) An ‘ocean mask’ is applied as follows: the EWHs of ‘Candidate EWHs’ over ocean are set as the negative mean EWHs over land. After that, using Equation 2, the ocean masked EWHs is converted to ‘Forwarded SHCs’ via spherical harmonic analysis.
(3) Using the same spatial filters, the ‘Forwarded SHCs’ are converted back to ‘Filtered candidate EWHs’ via spherical harmonic using Equation 3.
(4) The ‘EWHs increment’ is computed as the difference between ‘Filtered EWHs’ and ‘Filtered candidate EWHs’.
(5) If the ‘EWHs increment’ meets a stopping criterion, the corresponding ‘Candidate EWHs’ after ocean mask are taken as the final ‘Forwarded EWHs’. Otherwise, the ‘Candidate EWHs’ is updated by adding the ‘EWH increment’, and step (2) to step (5) are repeated untill the ‘EWHs increment’ meets the stopping criterion.
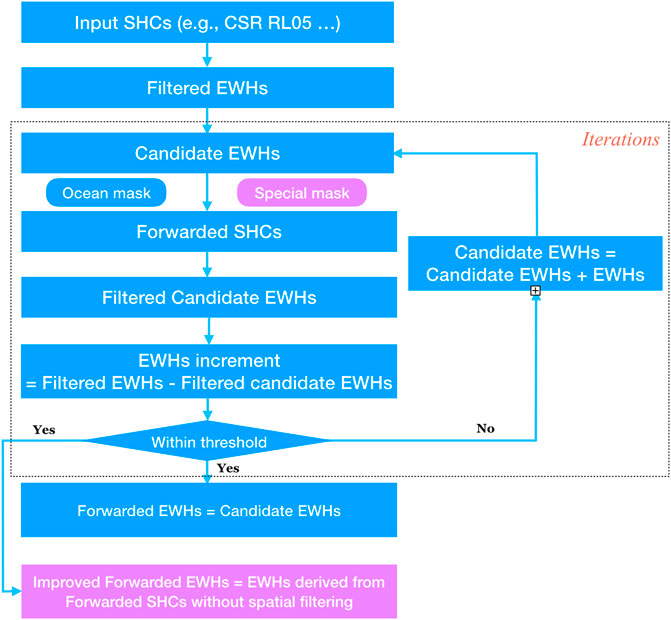
FIGURE 2. The flowchart of forward-modeling method. The pink text boxes relate to the improved forward modeling method.
The stopping criterion is crucial for the accuracy and efficiency of forward modeling method. Combining the recommendations by Chen et al. (2015) and (Tangdamrongsub et al., 2016), we set the maximum iterations as 100. Within the maximum iterations, the signal restoration process is stopped when the ‘EWHs increment’ in every grid are all smaller than 0.5 cm, which is 3–4 times smaller than the noise level of GRACE data (Tangdamrongsub et al., 2016; Zhou et al., 2018a).
Improved Forward Modeling Method
Comparing with the previous studies related to general forward modeling method, there are mainly two improvements (Table 2).
(1) In the previous studies, the final EWHs (i.e., ‘forwarded EWHs’) is set as the ocean masked ‘Candidate EWHs’ in the last iteration. In this way, the mass variations over ocean are equal. It will lead to over restoration effects along the coastline. Therefore, in the last iteration, the ‘Forwarded SHCs’ is used to compute the final EWHs (i.e., ‘Improved forwarded EWHs’ in Figure 2) via spherical harmonic. Note that no spatial filter is applied in this process. The reason and effect of this improvement will be illustrated in the following section.
(2) In previous studies, forward modeling methods have been used mainly to estimate sea level changes and mass changes on large-scale ice sheets. Therefore, an ocean mask is efficient enough to reduce the leakage errors along the coastline. As Africa is selected as the study region, we found that the mask over ocean is not accurate enough. Due to the limited accuracy of GRACE data, the regions with minor temporal signals will be seriously affected by noise. As a result, there is obvious noise accumulation during the iteration via general forward modeling method. Therefore, instead of using a simple ocean mask, a special mask is applied to mask the ‘Candidate EWHs’ (Figure 2). In each iteration, the grids with the absolute EWH values smaller than a specific threshold are set to zero.
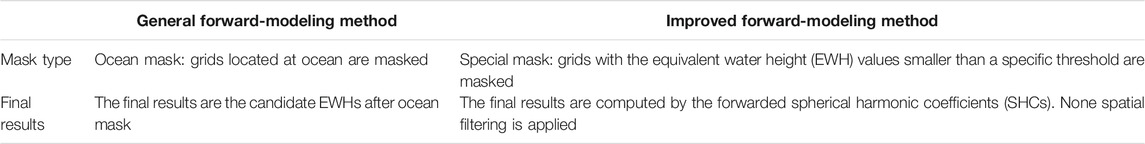
TABLE 2. Comparison of general forward-modeling method and improved forward-modeling method.
The results in the following sections will also illustrate the necessity and rationality of these improvements.
Simulation of Realistic Noise for GRACE and GRACE Follow-On Mission
To assess the forward modeling method in noise-contaminated condition, the realistic noises are simulated by emulating the procedures of determining temporal gravity field model with GRACE real observations. The major difference is that the true temporal signal is exactly known in our simulation environment. The true temporal signal is simulated by the HIS component (hydrology, ice, and solid earth) of updated ESM AOHIS model (Dobslaw et al., 2015). This model is provided with a temporal resolution of 6 h, and it includes the individual components of atmosphere (A), ocean (O), hydrology (H), ice (I), and solid earth (S), which are also separately available. Meanwhile, the corresponding error model for atmosphere and ocean (i.e., ESM AOerr model) can aid us to include the non-tidal model error in the simulation procedure (Dobslaw et al., 2015). More details about the closed-loop simulation are presented in Supplementary Material. Generally, the realistic instrument noise and imperfect background model errors are considered in the closed-loop simulation environment Supplementary Figure 1. Under such a simulation environment, a 5-year full-scale simulation (from 2002 to 2006) is implemented on the basis of realistic assumptions for current GRACE mission and GRACE Follow-On mission.
Figure 3 shows the simulation results in terms of degree variances of geoid height. In spectral domain, the signal curves of ESM HIS models decrease with the increase of degree. The simulated GRACE data also maintains a downwards trend at lower degrees, and agrees well with original ESM HIS models before about degree 20. However, the curves of GRACE data turn upwards when the errors play a dominant role at high degrees. In contrast, the curves of GRACE Follow-On solutions present upwards until about degree 40. It demonstrates the better performance of GRACE Follow-On mission than GRACE mission in time-variable signal recovery, which is mainly attribute to the contribution of laser ranging system (Sheard et al., 2012). Using these simulated models, the performance of forward modeling method is assessed, and the potential improvements of GRACE Follow-On mission are discussed in the following section.
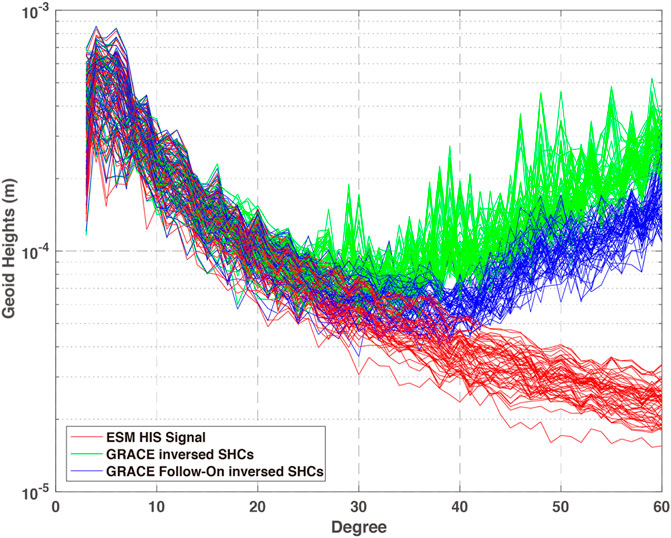
FIGURE 3. Degree variances of geoid height for different solutions for 5 years. Red lines: ESM HIS signal; Green lines: SHCs estimated by simulated GRACE data; Blue lines: SHCs estimated by simulated GRACE Follow-On data.
Results and Discussions
Validation in Noise-Free Condition
In noise-free condition, Chen et al. (2015) have evaluated the performance of forward modeling method in West Antarctica, where the mass variations are only defined in two isolated regions. As shown in Figure 1, river basins over Africa are adjacent to each other. Therefore, it is still necessary to evaluate the performance of the forward modeling method over Africa in noise-free condition.
The ESM HIS models are taken as the ‘True Signals’ (Figure 4A). The ‘Filtered EWHs’ are then obtained via 500 km Gaussian filter (Figure 4B), which are presented as attenuated temporal signals. After using the general forward modeling method (section 2.3.1), the ‘Forwarded EWHs’ (Figure 4C) agree well with the ‘True Signals’ (Figure 4A). It demonstrates that the general forward modeling method can successfully restore the temporal signals which are distorted by Gaussian filter. Figure 4D presents the differences between the ‘Forwarded EWHs’ and original ‘True Signal’. The differences over the inland of Africa are very minor, indicating the good performance of general forward modeling method. However, the differences along the coastline are relatively large.
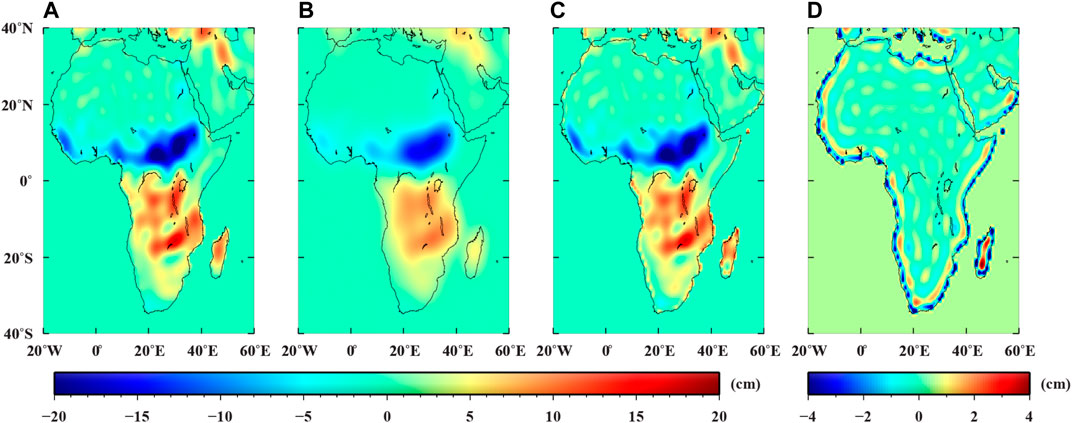
FIGURE 4. Mass variations in terms of cm equivalent water heights. (A) Original mass variations from ESM HIS model; (B) Mass variations after 500 km Gaussian smoothing; (C) forward-modeling mass variations; (D) differences between original and forward-modeling mass variations, i.e., (a) minus (c). Note the different color scales for the four panels.
Figure 4 only present the result for 1 month. To make a more comprehensive analysis, a 5-year simulation is also implemented. The annual amplitudes and trends of 24 basins for 5 years are listed in Table 3. As expected, there are significant signal attenuations for the results after 500 km Gaussian filtering. After applying general forward modeling method, the annual amplitudes and trends are closer to those of original ‘True Signals’. The good agreements also demonstrate the good performance of the general forward modeling method in retrieving temporal signals over Africa.
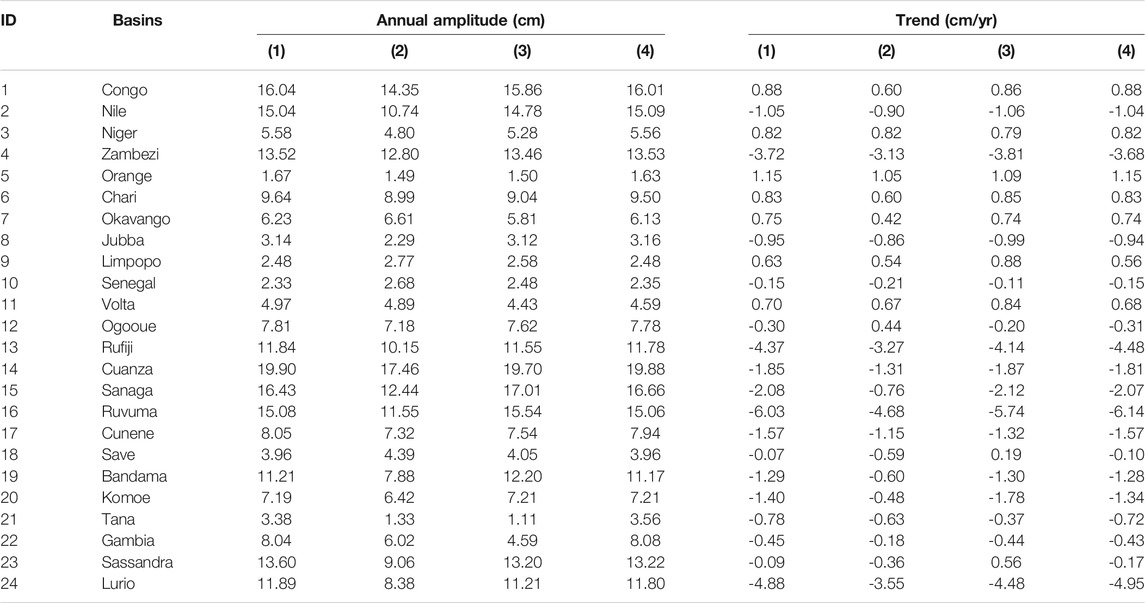
TABLE 3. Annual amplitudes and trends of 24 basins over Africa derived from different processing procedures: (1) true signals derived from ESM HIS model; (2) 500 km Gaussian Filtering; (3) Forward modeling; (4) Improved Forward modeling.
Note that there are also several exceptions in Table 3, such as the Gambia River Basin (Basin ID is 22) and the Sassandra River Basin (Basin ID is 23). The annual amplitude of the Gambia River Basin is 8.04 cm for the ‘True Signals’ but only 4.59 cm for the forward modeled results, which is even smaller than that after 500 km Gaussian filtering. As for the Sassandra River Basin, the trends for the ‘True Signals’ is opposite to that after forward modeling. The reason for these exceptions is likely the edge effects of forward modeling method along the coastline (see Figure 4D).
The assessment of general forward modeling method is also implemented in spectral domain. Figure 5 presents the degree variances of geoid height for different solutions. The temporal signals of ESM HIS model gradually decrease with the increase of degrees, which demonstrates that the low degree and order SHCs contain the majority of temporal signals. After 500 km Gaussian filtering, the temporal signals at low degrees are retained, while those at high degrees are significantly reduced. After applying the iterative forward modeling method, the temporal signals are gradually restored, and the geoid heights are almost identical to those of the ESM HIS model after 50 iterations. The results in spectral domain also verify the good performance of the general forward modeling method.
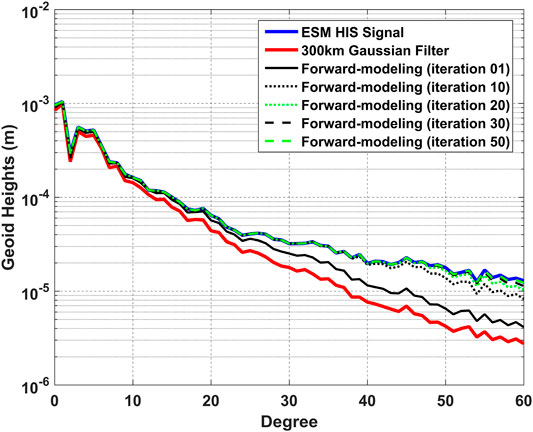
FIGURE 5. Degree variances of geoid height for different solutions. Blue line: ESM HIS signal; Red line: SHCs after 300 km Gaussian filter; Black line and other dotted lines: Forwarded SHCs after several iterations.
Now that the ‘Forwarded SHCs’ in Figure 5 are almost identical to those of ESM HIS model. Therefore, in the improved forward modeling method, we directly use the ‘Forwarded SHCs’ to compute the mass variations over Africa. Note that no spatial filters are applied in this procedure. For clarity, these mass variations in terms of EWHs are called ‘Improved forwarded EWHs’ (Figure 2). As shown in Figure 6C, the distributions of the ‘Improved forwarded EWHs’ are also apparent with those derived from ESM HIS model (Figure 6A or Figure 4A). Moreover, as seen in Figure 6D, the differences between the ‘Improved forwarded EWHs’ and ‘True Signals’ are very minor over the mainland of Africa, especially for the regions along the coastline.
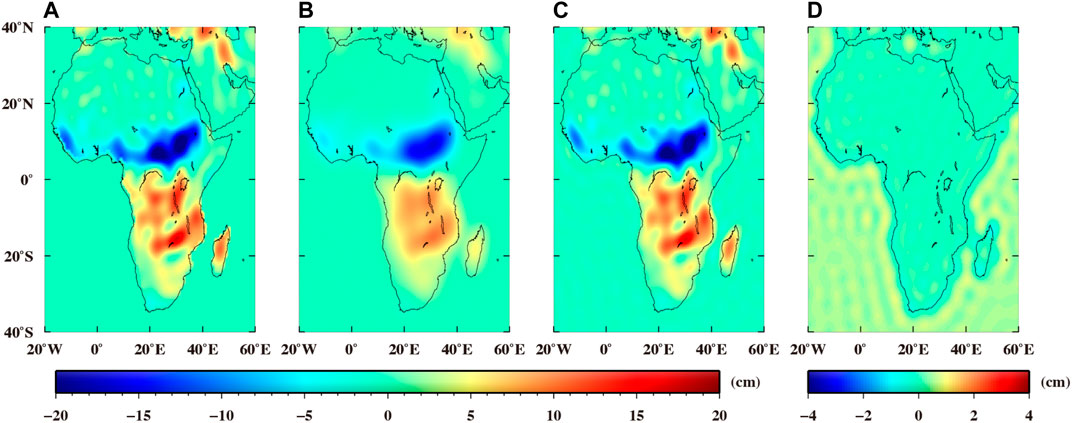
FIGURE 6. Same as Figure 4 but derived from the improved forward modeling method.
Figure 6 only present the results for 1 month. To assess the long-time performance of improved forward modeling method, the annual amplitudes and trends of 24 basins for 5 years are also listed in Table 3. The results derived from improved forward modeling method are closer to those derived from ‘True Signals’, when compared with those derived from general forward modeling method. Particularly, the significant improvements are found in the Gambia River Basin and the Sassandra River Basin. According to these comparison results, the improved forward modeling method is employed in this work.
Validation in Noise-Contaminated Condition
Using the simulated GRACE data in section 2.2.3, the performance of forward modeling method is assessed in the noise-contaminated condition.
The 500 km Gaussian filter is applied to suppress the high-frequency noise in the simulated GRACE data, and the forward modeling method is used to alleviate the leakage errors. To assess the performance of forward modeling method in noise-contaminated condition, the estimates are further visualized in terms of annual amplitudes and trends for 5 years (Figure 7). In spatial domain, the spatial filters significantly attenuate the temporal signals in terms of annual amplitudes and trends (Figure 7(b1) and Figure 7(b2)). After applying the general forward modeling method, the distributions of annual amplitudes and trends (Figure 7(c1) and Figure 7(c2)) become closer to those of original true signals (Figure 7(a1) and Figure 7(a2)), indicating its potential in restoring temporal signals. However, there are still obvious errors along the coastline. To reduce these edge effects, as mentioned in Validation in Noise-Free Condition, the ‘Improved forwarded EWHs’ are directly computed by the ‘Forwarded SHCs’. In this way, the edge effects can be partly alleviated, while the abnormal temporal signals are still observed in several specific regions such as the Sahara Desert. To alleviate these edge effects, a constraint is added. As the noise level of GRACE mission in terms of EWHs is about 2–3 cm (Liu et al., 2010; Chen et al., 2016; Tangdamrongsub et al., 2016), it is appropriate to assume that the noise in GRACE data would seriously affect the grids with EWH absolute values smaller than 0.5 cm. Therefore, apart from masking the ocean areas, the special mask is also added to the grids with absolute EWH values smaller than 0.5 cm at every iteration. Based on this constraint, as shown in Figure 7(d1), the distributions of annual amplitudes are obviously more apparent to the original signals (Figure 7(a1)) when compared to those derived from general forward modeling method (Figure 7(c1)). The same situation is also observed in the results in terms of trends over Africa, indicating the good efficiency of the improved forward modeling method.
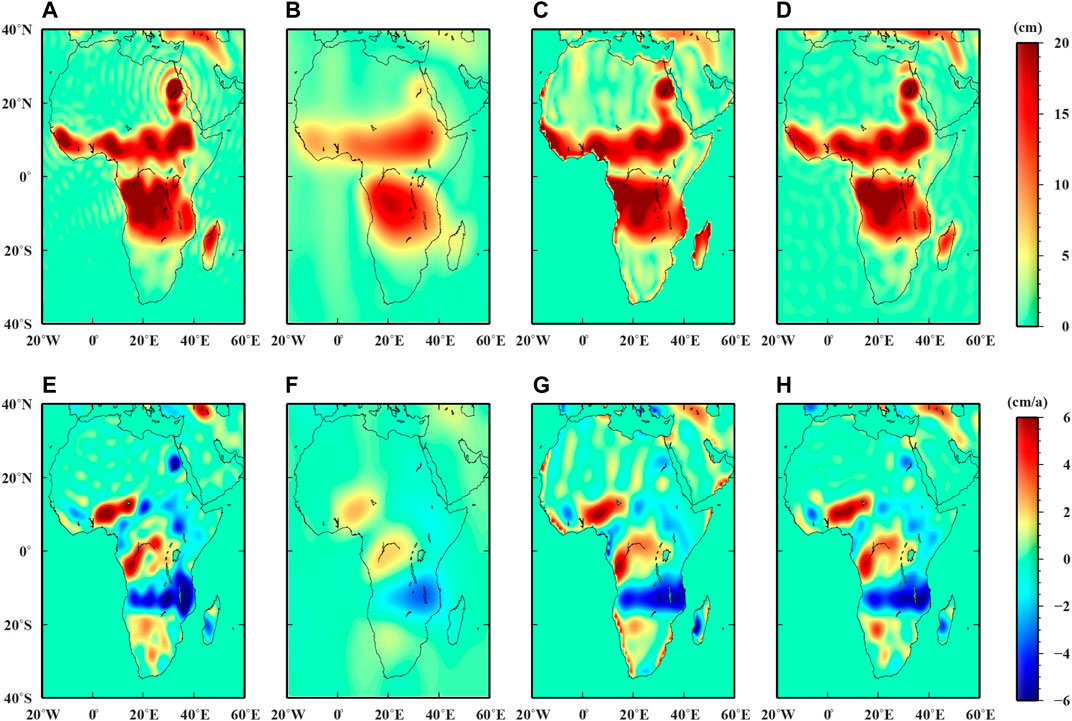
FIGURE 7. Annual amplitudes and trends derived from different simulated solutions over Africa (A1) annual amplitudes of original ESM HIS model for comparison (B1) annual amplitudes of simulated GRACE data after 500 km Gaussian filtering (C1) annual amplitudes of simulated GRACE data after applying general forward-modeling method (D1) annual amplitudes of simulated GRACE data after applying improved forward-modeling method (A2), (B2), (C2) and (D2) show the trends derived from corresponding solutions.
To assess the performance of improved forward modeling method at basin scale, the mass variation time series for eight selected river basins (basins are selected according to their sizes) are displayed in Figure 8. The red fill plots denote the gaps between the true signals and those derived from different processing methods, and more reds indicate worse performance. Generally, the time series derived from general or improved forward modeling methods have a better consistency with those of true signals, when compared to those after applying Gaussian filters. In addition, the consistency is also better over the large river basins (e.g., Congo River Basin and Zambezi River Basin) than those over medium and small river basins. We also list the annual amplitudes and trends of all river basins to compare the performance of different methods (Table 4). The statistics show the improvements of forward modeling methods, when compared with those after applying Gaussian filters. The comparison results in terms of annual amplitudes and trends also show the better performance of improved forward modeling method over that of the general forward modeling method. Moreover, the Root Mean Squares (RMS) of error are also provided in Table 4 to compare the performance of different methods. Overall the improved forward modeling method shows its good performance in retrieving temporal signals.
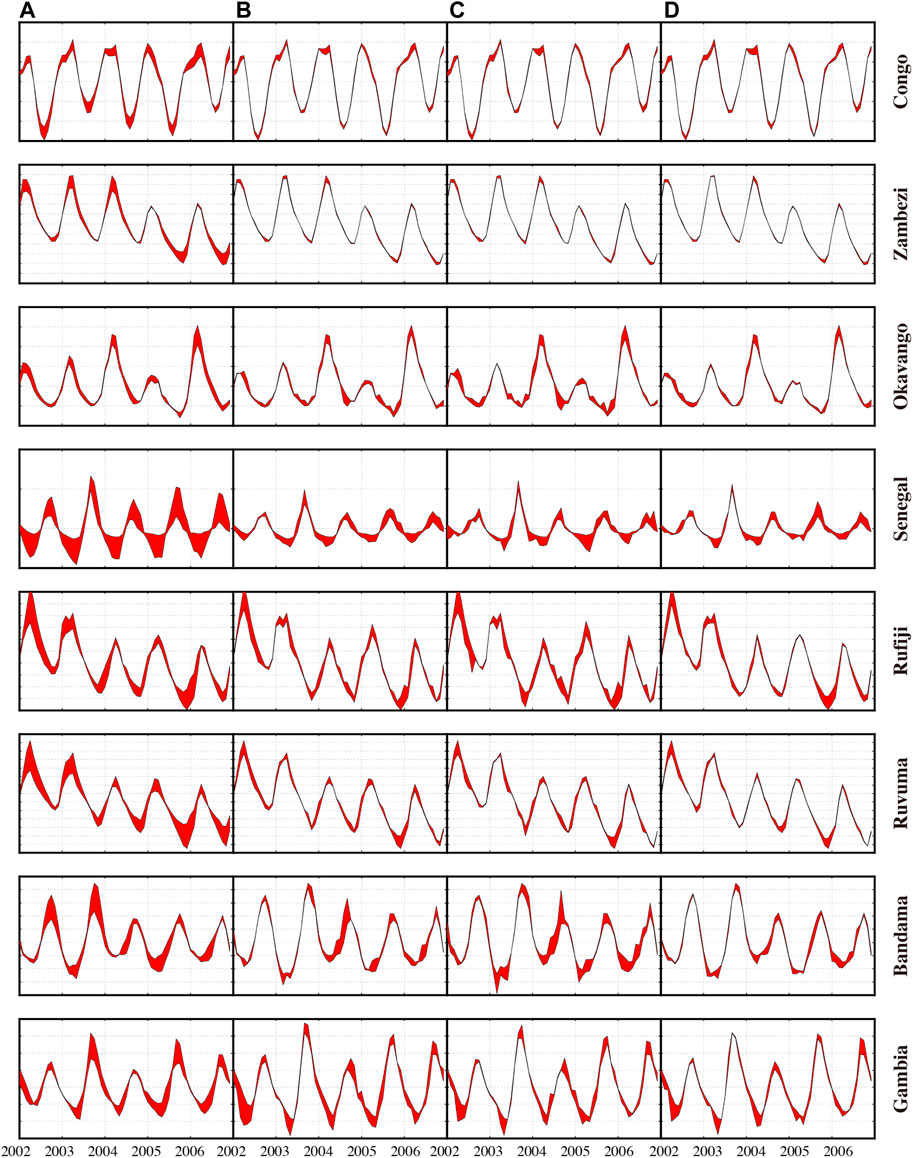
FIGURE 8. Fill plots for different approaches over eight Africa river basins: (A) Gaussian filters; (B) forward modeling method with simulated GRACE observations; (C) improved forward modeling method with simulated GRACE observations; (D) improved forward modeling method with simulated GRACE Follow-On observations. The ordinate of each subplot is different. The amount of red is the differences between the true time series and the result from corresponding approach. Thus, less red means better performance.
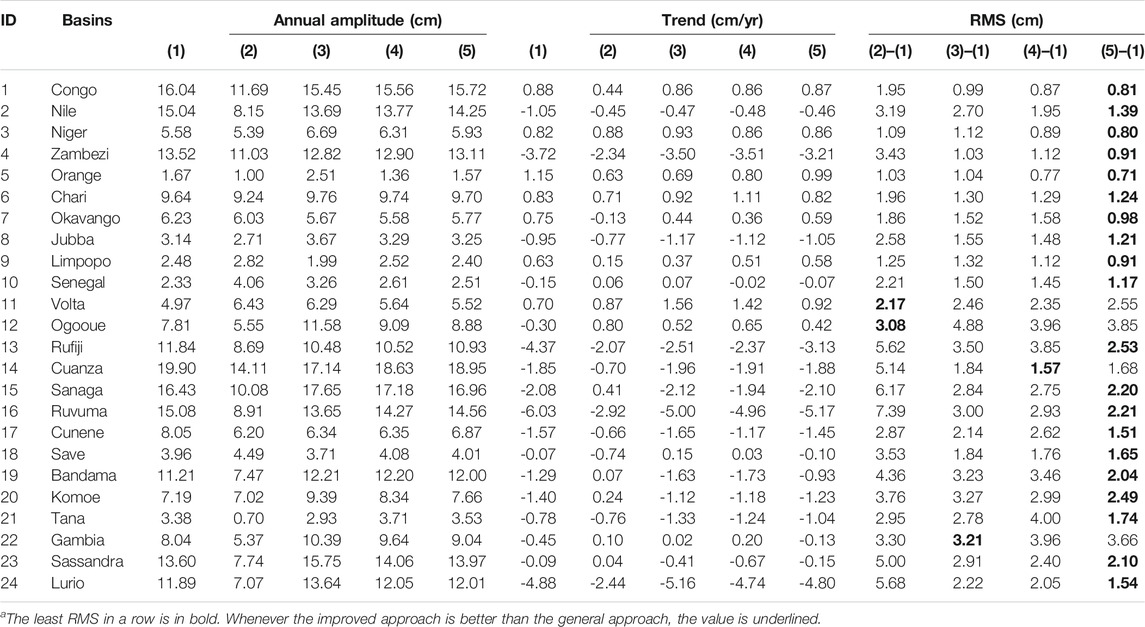
TABLE 4. Annual amplitudes (cm), trends (cm/yr), and RMS (cm) of 24 basins over Africa derived from different processing procedures: (1) true signals derived from ESM HIS model; (2) simulated GRACE data after 500 km Gaussian filtering; (3) simulated GRACE data after applying general forward-modeling method; (4) simulated GRACE data after applying improved forward-modeling method; (5) simulated GRACE Follow-On data after applying improved forward-modeling methoda.
GRACE Total Water Storage Changes
GRACE mission has provided unique measurements to determine water storage variations. In this section, the results derived from various GRACE datasets are presented to validate the performance of the improved forward modeling method. The datasets during 2006–2010 are used, and the cross-comparisons are implemented via different metrics. Figure 9 and Figure 10 respectively display the annual amplitudes and trends, and the corresponding statistics in river basin domains are listed in Table 5. For clarity, the fill plots are presented in Figure 11 to show the gap between our improved forward modeling method and other methods, while the scatter plots are presented in Figure 12 to show the relationship of annual amplitudes (and trends) among different GRACE datasets.
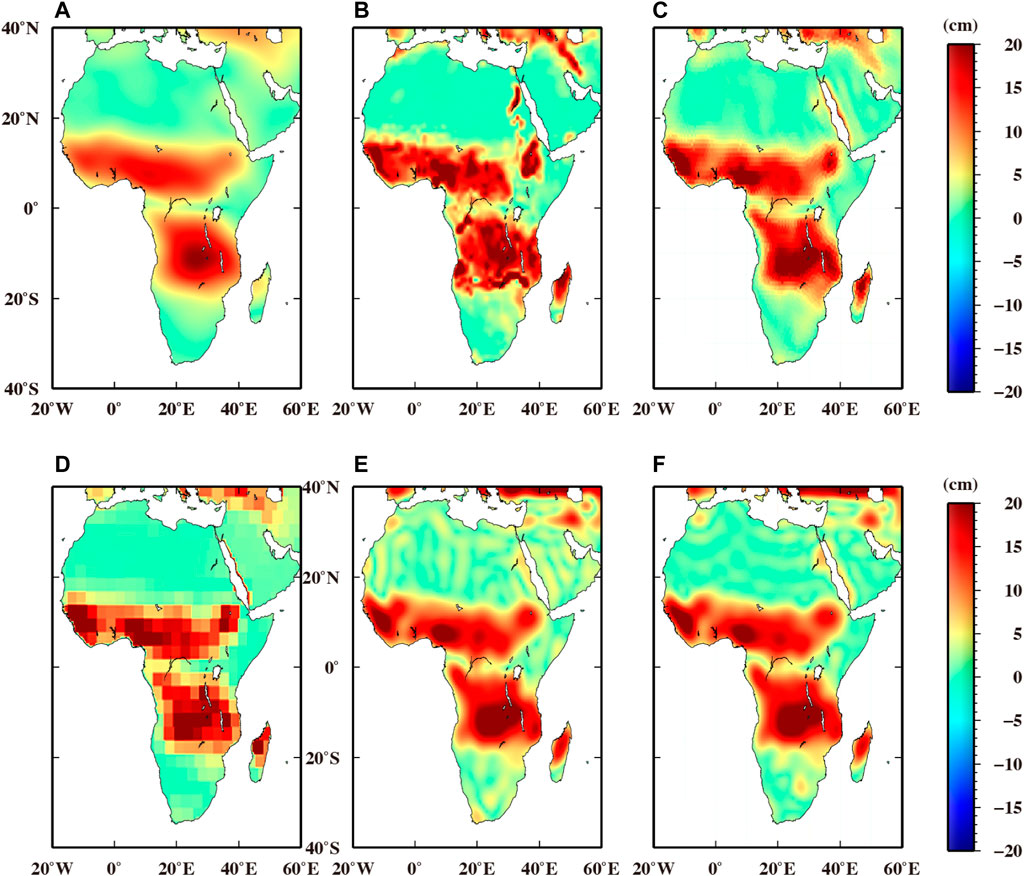
FIGURE 9. Annual amplitudes (cm) derived from different solutions: (A) CSR Tellus mass grids, (B) CSR Tellus Mass Grid with scale factor, (C) CSR mascon solution, (D) JPL mascon solution, (E) general forward modeling method, (F) improved forward modeling method.
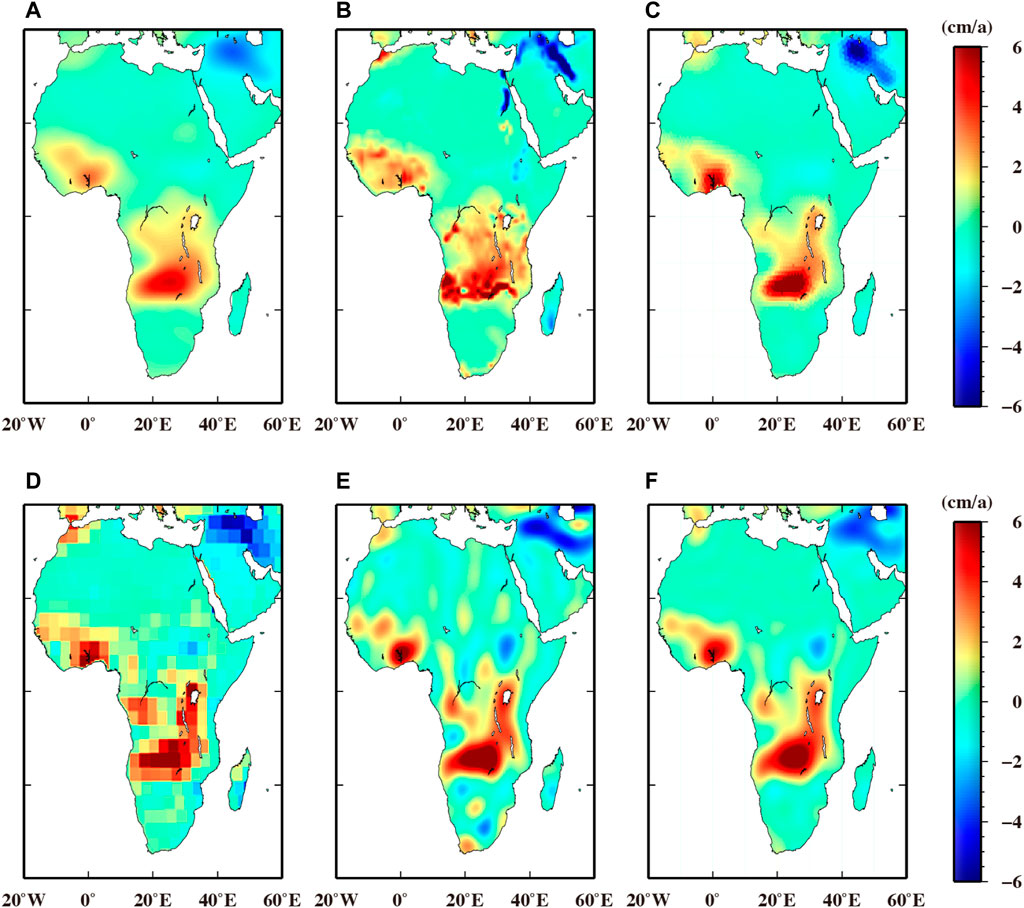
FIGURE 10. Trends (cm/a) derived from different solutions: (A) CSR Tellus Mass Grid, (B) CSR Tellus Mass Grid with scale factor, (C) CSR mascon solution, (D) JPL mascon solution, (E) general forward modeling method, (F) improved forward modeling method.

TABLE 5. Annual amplitudes (cm), trend (cm/yr), and RMS (cm) of 24 river basins over Africa derived from different solutions: (1) CSR Tellus Mass Grid without scale factor, (2) CSR Tellus Mass Grid with scale factor, (3) CSR mascon solution, (4) JPL mascon solution, (5) general forward modeling method, (6) improved forward modeling methoda.
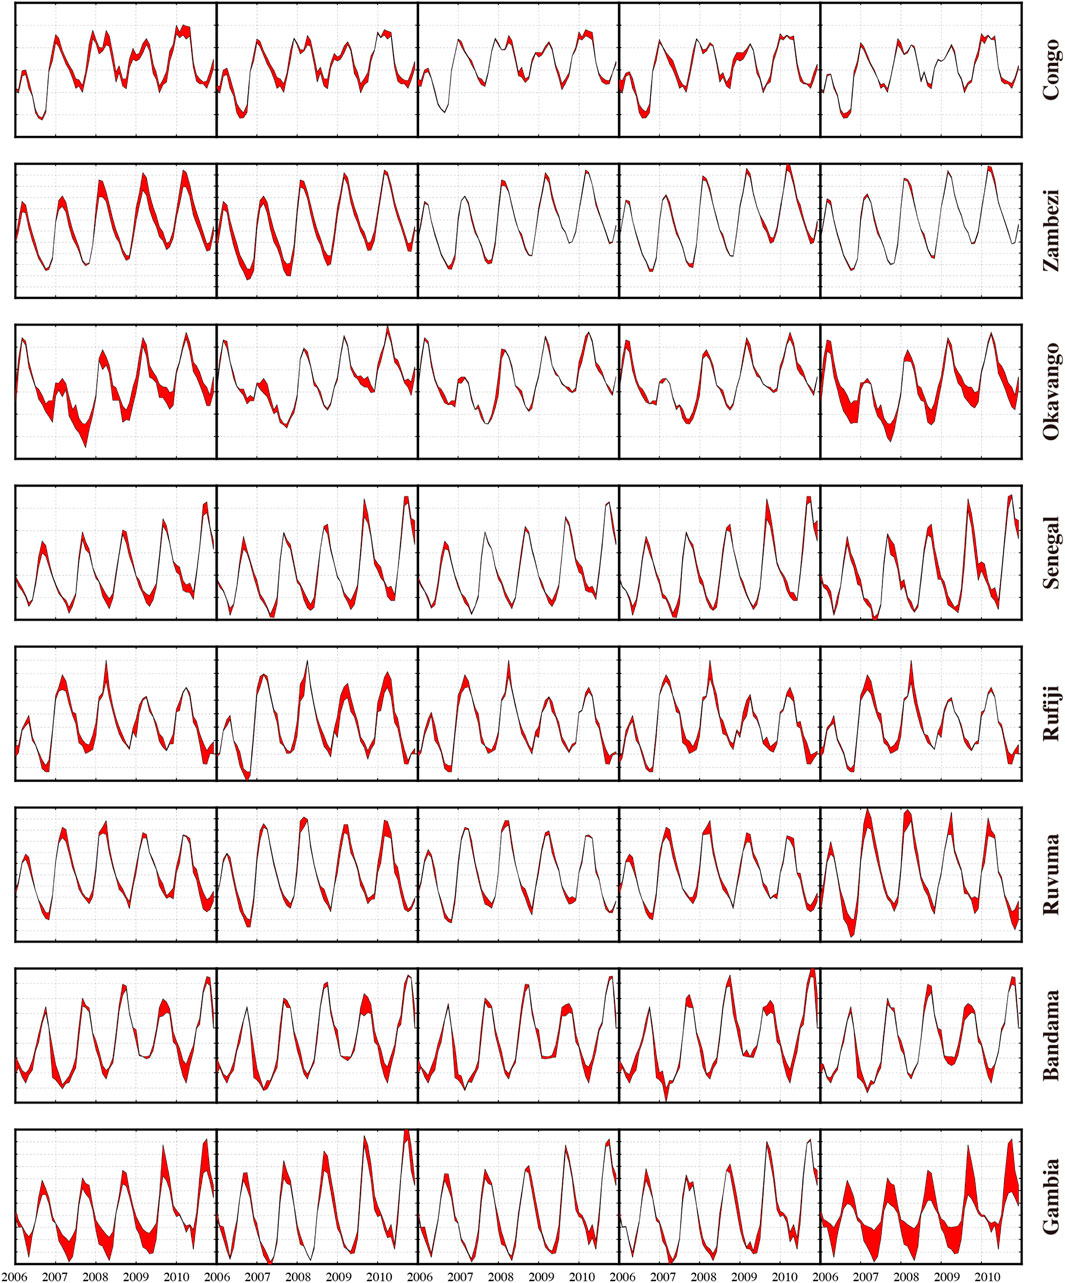
FIGURE 11. Fill plots to illustrate the gap between the time series derived from improved forward modeling method ant that from different approaches over eight Africa river basins: (1) CSR Tellus Mass Grid without scale factor, (2) CSR Tellus Mass Grid with scale factor, (3) CSR mascon solution, (4) JPL mascon solution, (5) general forward modeling method. The ordinate of each subplot is different. The amount of red is the differences between the result from improved forward modeling method and that from corresponding approach. Thus less red means better agreement with improved forward modeling method.
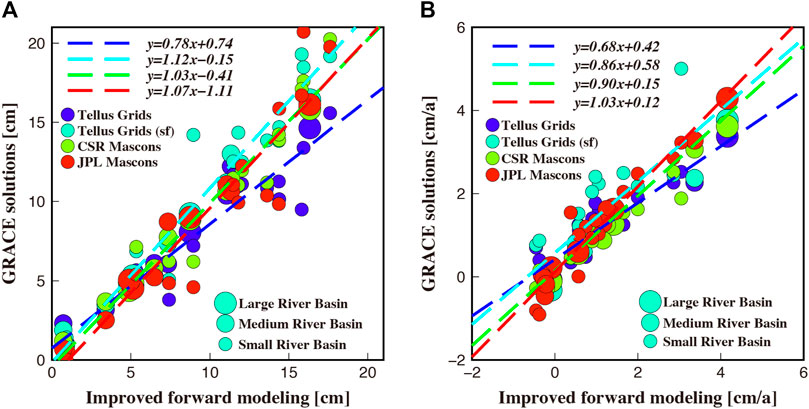
FIGURE 12. Scatter plots of annual amplitudes (A) and trends (B) for the comparisons of improved forward modeling and other GRACE datasets. The GRACE datasets include CSR Tellus grids, CSR Tellus grids with scale factor, CSR mascons, and JPL mascons. The regression lines are determined with 95% confidence bounds.
Based on these cross-comparison results, the key points are summarized as follows: (1) The maps of annual amplitudes and trends present general similar distribution among solutions with some notable differences. (2) Compared with the CSR Tellus mass grids without scale factors, the ones with scale factors present more similar temporal signals with the rest of the GRACE datasets. It indicates the good efficiency of scale factors in restoring temporal signals. (3) Time series in Figure 11 present relative larger gaps between scaled GRACE Tellus mass grids and our solution than those between mascon solutions (both CSR mascon solution and JPL mascon solution) and our solution. As the scale factors in CSR Tellus mass grids are obtained via prior hydrological models, the uncertainties of scale factors derived from such a model-dependent approach need to be carefully evaluated. (4) Annual amplitudes (or trends) from the improved forward modeling method average 22% (or 32%) higher than those for CSR Tellus grids without scale factors (slope 0.78 and 0.68 in Figure 12). It demonstrates that, if no restoring procedure is applied, there will be a significant underestimation of annual amplitudes and trends in terms of EWHs. (5) Compared with the results derived from general forward model method, significant improvements are obtained by improved forward modeling method (Figure 9, Figure 10, and Table 5). The most significant improvements are observed in the small river basin such as Gambia, which presents as largest RMS in Table 5 and largest gaps in Figure 11. (6) According to Figure 9 and Figure 10, the temporal signals distributions of improved forward modeling method have a good agreement with those of CSR mascon solution. The reason for this agreement is likely that these two methods are both purely estimated by GRACE information, and no external model or data are considered. (7) In terms of annual amplitudes, the best consistency is found between mascon solutions (both CSR mascon solution and JPL mascon solution) and the solution derived from the improved forward modeling method. The slopes of the regression lines in Figure 12 and RMSs in Table 5 also support this conclusion. Mascon grids are directly estimated with GRACE observations but not estimated from solutions in SHCs, and there is no need to apply any post processing procedures to these solutions. Therefore, the consistency here also demonstrates the good performance of the improved forward-modeling method in restoring temporal signals.
Potential Improvement With GRACE Follow-On Data
GRACE Follow-On mission was successfully launched on May 22, 2018. Due to the breakdown of accelerometer in one satellite, the current GRACE Follow-On mission has similar performance as GRACE in retrieving temporal signals. With the progress of GRACE Follow-On data processing, we believe that the GRACE Follow-On mission can fix this problem and provide more accurate accelerometer observations. Since the performance of forward modeling method in GRACE data processing was analyzed in the previous section, we will not do the repetitive work for GRACE Follow-On data. Instead, the simulated observation data of GRACE Follow-On mission are used here to discuss its potential improvement in determining total water storage variations. Figure 3 shows the geoid height errors of GRACE Follow-On solutions. As expected, the noise levels of GRACE Follow-On data present roughly 2 times improvements when compared with simulated GRACE data. The reason is that the laser ranging system is implemented in GRACE Follow-On mission, which performs two to three orders of magnitudes better than the microwave ranging system in GRACE mission. The limited improvement of GRACE Follow-On solutions is mainly due to the background force model errors (Loomis et al., 2012; Elsaka et al., 2014; Zhou et al., 2016).
To assess the performance in spatial domain, Figure 13 presents the RMS residuals in terms of EWHs. It is calculated by removing the annual and seasonal temporal signals from original EWHs, which is commonly used to evaluate the noise level of time-variable gravity models. In unfiltered condition, GRACE Follow-On data is still corrupted by north-south stripe errors as GRACE data. The reason is that their north-south tracking configuration lacks measurement information in cross-track direction. A clear improvement exists between GRACE data and GRACE Follow-On data in Figure 13. It is also supported by the mean RMSs over oceans, which are respectively 15.6 and 8.6 cm for GRACE data and GRACE Follow-On data in unfiltered condition, and respectively 2.4 and 1.5 cm in 300 km Gaussian filtering condition. We therefore envision that the application of GRACE Follow-On mission will present roughly 2 times improvements in temporal signal determination.
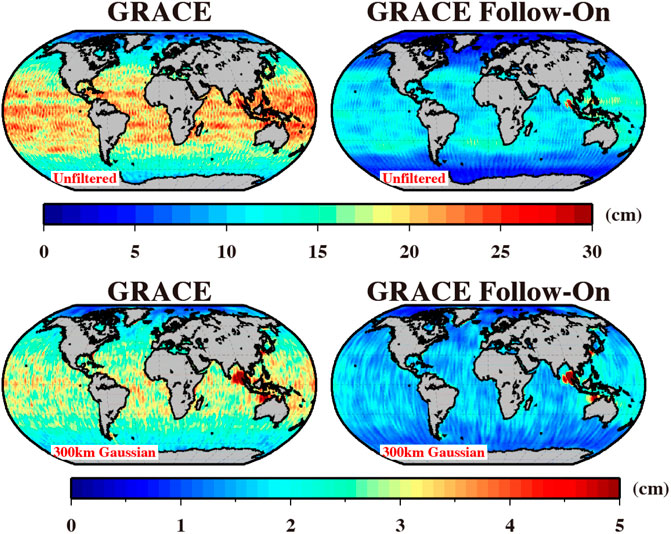
FIGURE 13. RMS residuals of simulated GRACE and GRACE Follow-On mission. Both unfiltered and 300 km Gaussian filtered solutions are displayed.
The performance of forward modeling method is also assessed with GRACE Follow-On solutions. As seen in Figure 8, a slight improvement is observed in the fill plots of GRACE Follow-On data, when compared with those of GRACE data. The most significant improvements are found over four small river basins, including Rufiji, Ruvuma, Bandama, and Gambia. It is also supported by the statistics in Table 4. These results demonstrate the potential improvements of GRACE Follow-On mission in detecting smaller size of temporal signals than GRACE mission. Figure 14 presents the scatter plots for the comparison of true signals and different simulated solutions. In case of GRACE data, forward modeling method brings the corresponding solutions into alignment with the true signals, increasing the slope from 0.57 to 0.94 for annual amplitudes, and from 0.50 to 0.86 for trends. Compared with the filtered results, the results after applying improved forward modeling method indicate average improvements of 37% for annual amplitudes and 36% for trends. In addition, the restored signals derived from GRACE Follow-On data are less scattered than those of GRACE data, especially for small river basins. As a result, the slopes of regression lines increase from 0.94 to 0.96 for annual amplitudes, and from 0.86 to 0.91 for trends. The statistical results of improved forward modeling method indicate an average improvement of 39% for annual amplitudes and 41% for trends, when compared with those of 500 km Gaussian filtering. We also provide the RMS in Table 4 to compare the performance of all approaches. Overall the performance of GRACE Follow-On is better than those of GRACE. The results derived from Figure 14 and Table 4 also demonstrate the potential improvement of forward modeling method in determining terrestrial water storage variations via GRACE Follow-On mission, especially over small river basins.

FIGURE 14. Scatter plots of annual amplitudes (A) and trends (B) for the comparisons of true signals and solutions via different processing procedures: (a) simulated GRACE data after 500 km Gaussian filtering, (b) simulated GRACE data after applying improved forward-modeling method, (c) simulated GRACE Follow-On data after applying improved forward-modeling method. The regression lines are determined with 95% confidence bounds.
Conclusion
An improved forward modeling method is proposed to restore the temporal signals during GRACE/GRACE Follow-On data processing. The performance of this method in estimating terrestrial water storage over Africa is assessed in terms of both annual amplitudes and long-term trends.
In noise-free condition, it is clear that the forward modeling method can successfully reduce the leakage errors derived from spatial filters. In the spectral domain, the forward modeling estimates are almost 100% of true signals. However, slight biases in terms of EWHs are observed along the coastline of Africa. An improved forward modeling method is then developed, and it successfully reduces these biases along the coastline. The good performances in both spectral domain and spatial domain demonstrate the rigidity and rationality of reducing leakage errors by improved forward modeling method.
A simulation environment is setting to the true observation environment of GRACE mission as realistic as possible, and the simulated temporal gravity field models are then determined. In such a noise-contaminated case, the performance of forward modeling method is seriously affected by observation errors. To alleviate these errors, a constraint forward modeling is then implemented. The spatial distributions of restored signals, in terms of annual amplitudes and trends, as well as time series and statistics in basin domains, demonstrate the better performance of improved forward modeling method. The average improvements of 24 basins over Africa are roughly 37% for annual amplitudes and 36% for trends, when compared with the cases before applying improved forward modeling method. The potential improvements of GRACE Follow-On mission are also evaluated. The new satellite mission is expected to bring 2 times improvements in terms of the noise level of temporal gravity solutions, when compared with GRACE data. The improved forward modeling method also brings about 39% improvement for annual amplitudes and 41% improvement for trends. Moreover, the results derived from improved forward modeling method show good agreement with the true time series in terms of annual amplitude, trend, and RMS. As no external model is used during this processing procedure, it demonstrates that our improved forward modeling method can successfully retrieve temporal signal as a model-independent approach.
GRACE-derived terrestrial water storage estimations lack direct ground-based observations for independent validation. To assess the performance of improved forward modeling method, several GRACE datasets (including CSR Tellus grids, CSR mascon grids, and JPL mascon grids) are used for cross-comparison. The spatial distributions of restored signals, in terms of annual amplitudes and trends, as well as time series and statistics in basin domains, are in good agreements with those of GRACE datasets. Comparing with unscaled CSR Tellus grids, the better consistencies are clearly obtained in the results of scaled grids, which highlights the importance of restoring temporal signals after filtering. In addition, the scatter plots of annual amplitudes and trends are particularly aligned between the solutions via improved forward modeling method and those of mascon solutions (CSR mascon and JPL mascon), when compared with those of CSR Tellus grids with scale factors. The scaled CSR Tellus grids are derived from model-dependent approach, whereas mascon solutions and our solution are independent from the prior model. The better consistency between the model-independent approaches indicates that applying model-dependent approach for restoring temporal signals still needs to be carefully evaluated. Meanwhile, since the newly released CSR and JPL mascon products offer several advantages in reducing leakage errors, and these good agreements increase confidence of improved forward modeling method in processing GRACE data.
Data Availability Statement
The original contributions presented in the study are included in the article/Supplementary Material, further inquiries can be directed to the corresponding authors.
Author Contributions
HZ designed the study, performed the experiments and wrote the manuscript; MD and PW checked the performance of this method and revised manuscript; MW, LT, and SX provided some technical advices and revised the manuscript; ZL designed the study, analyzed the experimental results and revised the manuscript.
Funding
This work is mainly supported by the National Natural Science Foundation of China (No. 41931074, 42074018, 42061134007, 42004071, 41704012), the National Key Research and Development Program of China (No. 2018YFC1503503, 2018YFC1503504) and the Fundamental Research Funds for the Central Universities (No. 2019kfyXJJ).
Conflict of Interest
The authors declare that the research was conducted in the absence of any commercial or financial relationships that could be construed as a potential conflict of interest.
Publisher’s Note
All claims expressed in this article are solely those of the authors and do not necessarily represent those of their affiliated organizations, or those of the publisher, the editors, and the reviewers. Any product that may be evaluated in this article, or claim that may be made by its manufacturer, is not guaranteed or endorsed by the publisher.
Supplementary Material
The Supplementary Material for this article can be found online at: https://www.frontiersin.org/articles/10.3389/feart.2021.796723/full#supplementary-material
References
Andam-Akorful, S. A., Ferreira, V. G., Awange, J. L., Forootan, E., and He, X. F. (2015). Multi-model and Multi-Sensor Estimations of Evapotranspiration over the Volta basin, West Africa. Int. J. Climatol. 35, 3132–3145. doi:10.1002/joc.4198
Anyah, R. O., Forootan, E., Awange, J. L., and Khaki, M. (2018). Understanding Linkages between Global Climate Indices and Terrestrial Water Storage Changes over Africa Using GRACE Products. Sci. Total Environ. 635, 1405–1416. doi:10.1016/j.scitotenv.2018.04.159
Bandikova, T., Meyer, U., Klinger, B., Tregoning, P., Flury, J., and Mayer-Gurr, T. (2014). “Improved star Camera Attitude Data and Their Effect on the Gravity Field,” in Proceedings of the GRACE science team meeting, Potsdam, Germany, 29 Sep 2014 (Potsdam, Germany: German Research Centre for Geosciences).
Carrère, L., Lyard, F., Cancet, M., Guillot, A., and Roblou, L. (2012). “FES2012: A New Global Tidal Model Taking Advantage of Nearly 20 Years of Altimetry,” in Proceedings of meeting "20 Years of Altimetry, Venice, September, 2012.
Chao, B. F., and Gross, R. S. (1987). Changes in the Earth's Rotation and Low-Degree Gravitational Field Induced by Earthquakes. Geophys. J. Int. 91 (3), 569–596. doi:10.1111/j.1365-246x.1987.tb01659.x
Chao, N., Luo, Z., Wang, Z., and Jin, T. (2017). Retrieving Groundwater Depletion and Drought in the Tigris-Euphrates Basin between 2003 and 2015. Groundwater 56 (5), 770–782. doi:10.1111/gwat.12611
Chao, N., Wang, Z., Jiang, W., and Chao, D. (2016). A Quantitative Approach for Hydrological Drought Characterization in Southwestern China Using GRACE. Hydrogeology J. 24 (4), 1–11. doi:10.1007/s10040-015-1362-y
Chen, J., Li, J., Zhang, Z., and Ni, S. (2014). Long-term Groundwater Variations in Northwest India from Satellite Gravity Measurements. Glob. Planet. Change 116 (1), 130–138. doi:10.1016/j.gloplacha.2014.02.007
Chen, J. L., Wilson, C. R., Li, J., and Zhang, Z. (2015). Reducing Leakage Error in GRACE-observed Long-Term Ice Mass Change: A Case Study in West Antarctica. J. Geod 89, 925–940. doi:10.1007/s00190-015-0824-2
Chen, J. L., Wilson, C. R., and Tapley, B. D. (20132015). Contribution of Ice Sheet and Mountain Glacier Melt to Recent Sea Level Rise. Nat. Geosci 6 (7), 549–552. doi:10.1038/ngeo1829
Dobslaw, H., Bergmann-wolf, I., Dill, R., Forootan, E., Klemann, V., Kusche, J., et al. (2015). The Updated ESA Earth System Model for Future Gravity mission Simulation Studies. J. Geodesy 89 (5), 1–9. doi:10.1007/s00190-014-0787-8
Dobslaw, H., Bergmann-wolf, I., Forootan, E., Dahle, C., Mayer-Gürr, T., Kusche, J., et al. (2016). Modeling of Present-Day Atmosphere and Ocean Non-tidal De-aliasing Errors for Future Gravity mission Simulations. J. Geod 90, 423–436. doi:10.1007/s00190-015-0884-3
Dutt Vishwakarma, B., Devaraju, B., and Sneeuw, N. (2016). Minimizing the Effects of Filtering on Catchment Scale GRACE Solutions. Water Resour. Res. 52, 5868–5890. doi:10.1002/2016wr018960
Elsaka, B., Raimondo, J.-C., Brieden, P., Reubelt, T., Kusche, J., Flechtner, F., et al. (2014). Comparing Seven Candidate mission Configurations for Temporal Gravity Field Retrieval through Full-Scale Numerical Simulation. J. Geod 88, 31–43. doi:10.1007/s00190-013-0665-9
Flechtner, F., Neumayer, K.-H., Dahle, C., Dobslaw, H., Fagiolini, E., Raimondo, J.-C., et al. (2016). What Can Be Expected from the GRACE-FO Laser Ranging Interferometer for Earth Science Applications? Surv. Geophys. 37, 453–470. doi:10.1007/s10712-015-9338-y
Folkner, W. M., Williams, J. G., and Boggs, D. H. (2013). The Planetary and Lunar Ephemeris DE421. IPN Prog. Rep. 42-178, 1–37.
Forootan, E., Rietbroek, R., Kusche, J., Sharifi, M. A., Awange, J. L., SchmidtOmondi, M. P., et al. (2014). Separation of Large Scale Water Storage Patterns over Iran Using GRACE, Altimetry and Hydrological Data. Remote Sensing Environ. 140, 580–595. doi:10.1016/j.rse.2013.09.025
Gerlach, C., Flury, J., Frommknecht, B., Flechtner, F., and Rummel, R. (20052004). “GRACE Performance Study and Sensor Analysis,” in Proceedings of the Joint CHAMP/GRACE Science Meeting (Potsdam, Germany: GeoForschungsZentrum Potsdam), 6-8, 1–6.
GuoDuan, J. Y. X., Duan, X. J., and Shum, C. K. (2010). Non-isotropic Gaussian Smoothing and Leakage Reduction for Determining Mass Changes over Land and Ocean Using GRACE Data. Geophys. J. Int. 181, 290–302. doi:10.1111/j.1365-246x.2010.04534.x
Jekeli, C. (1981). “Alternative Methods to Smooth the Earth’s Gravity Field,” in Scientific Report (Columbus, OH, USA: The Ohio State University), 327.
Jin, S., and Zou, F. (2015). Re-estimation of Glacier Mass Loss in Greenland from GRACE with Correction of Land-Ocean Leakage Effects. Glob. Planet. Change 135, 170–178. doi:10.1016/j.gloplacha.2015.11.002
Kusche, J., Schmidt, R., Petrovic, S., and Rietbroek, R. (2009). Decorrelated GRACE Time-Variable Gravity Solutions by GFZ, and Their Validation Using a Hydrological Model. J. Geod 83 (10), 903–913. doi:10.1007/s00190-009-0308-3
Landerer, F. W., and Swenson, S. C. (2012). Accuracy of Scaled GRACE Terrestrial Water Storage Estimates. Water Resour. Res. 48, W04531. doi:10.1029/2011wr011453
Lezzaik, K., Milewski, A., and Mullen, J. (2018). The Groundwater Risk index: Development and Application in the Middle East and North Africa Region. Sci. Total Environ. 628-629, 1149–1164. doi:10.1016/j.scitotenv.2018.02.066
Long, D., Longuevergne, L., and Scanlon, B. R. (2015). Global Analysis of Approaches for Deriving Total Water Storage Changes from GRACE Satellites. Water Resour. Res. 51, 2574–2594. doi:10.1002/2014wr016853
Long, D., Pan, Y., Zhou, J., Chen, Y., Hou, X., Hong, Y., et al. (2017). Global Analysis of Spatiotemporal Variability in Merged Total Water Storage Changes Using Multiple GRACE Products and Global Hydrological Models. Remote Sensing Environ. 192, 198–216. doi:10.1016/j.rse.2017.02.011
Long, D., Yang, Y., Wada, Y., Hong, Y., Liang, W., Chen, Y., et al. (2015b). Deriving Scaling Factors Using a Global Hydrological Model to Restore GRACE Total Water Storage Changes for China's Yangtze River Basin. Remote Sensing Environ. 168, 177–193. doi:10.1016/j.rse.2015.07.003
Loomis, B. D., Nerem, R. S., and Luthcke, S. B. (2012). Simulation Study of a Follow-On Gravity mission to GRACE. J. Geod 86, 319–335. doi:10.1007/s00190-011-0521-8
Ndehedehe, C. E., Awange, J. L., Corner, R. J., Kuhn, M., and Okwuashi, O. (2016). On the Potentials of Multiple Climate Variables in Assessing the Spatio-Temporal Characteristics of Hydrological Droughts over the Volta Basin. Sci. Total Environ. 557-558, 819–837. doi:10.1016/j.scitotenv.2016.03.004
Ni, S., Chen, J., Wilson, C., and Hu, X. (2017). Long-term Water Storage Changes of Lake Volta from GRACE and Satellite Altimetry and Connections with Regional Climate. Remote Sensing 9 (8), 842. doi:10.3390/rs9080842
Oki, T., and Sud, Y. C. (1998). Design of Total Runoff Integrating Pathways (TRIP)-A Global River Channel Network. Earth Interact. 2, 1–37. doi:10.1175/1087-3562(1998)002<0001:dotrip>2.3.co;2
Pail, R., Gruber, T., and Fecher, T.GOCO Project Team (2016). The Combined Gravity Model GOCO05c. Potsdam, Germany: GFZ Data Services.
Pan, Y., Zhang, C., Gong, H., Yeh, P. J.-F., Shen, Y., Guo, Y., et al. (2017). Detection of Human-Induced Evapotranspiration Using GRACE Satellite Observations in the Haihe River basin of China. Geophys. Res. Lett. 44, 190–199. doi:10.1002/2016GL071287
Petit, G., and Luzum, B. (2010). IERS Conventions, 2010, 36. Frankfurt, France: Bureau International Des Poids Et Measures Sevres (France), IERS Technical Note.
Pokhrel, Y. N., Fan, Y., Miguez-Macho, G., Yeh, P. J.-F., and Han, S.-C. (2013). The Role of Groundwater in the Amazon Water Cycle: 3. Influence on Terrestrial Water Storage Computations and Comparison with GRACE. J. Geophys. Res. Atmos. 118, 3233–3244. doi:10.1002/jgrd.50335
Ran, J., Ditmar, P., Klees, R., and Farahani, H. H. (2018). Statistically Optimal Estimation of Greenland Ice Sheet Mass Variations from GRACE Monthly Solutions Using an Improved Mascon Approach. J. Geod 92 (3), 299–319. doi:10.1007/s00190-017-1063-5
Reager, J. T., Gardner, A. S., Famiglietti, J. S., Wiese, D. N., Eicker, A., and Lo, M.-H. (2016). A Decade of Sea Level Rise Slowed by Climate-Driven Hydrology. Science 351 (6274), 699–703. doi:10.1126/science.aad8386
Rodell, M., Famiglietti, J. S., Wiese, D. N., Reager, J. T., Beaudoing, H. K., Landerer, F. W., et al. (2018). Emerging Trends in Global Freshwater Availability. Nature 557, 651–659. doi:10.1038/s41586-018-0123-1
Savcenko, R., and Bosch, W. (2012). EOT11a - Empirical Ocean Tide Model from Multi-mission Satellite Altimetry. Munich: DGFI, 89.
Save, H., Bettadpur, S., and Tapley, B. D. (2016). High-resolution CSR GRACE RL05 Mascons. J. Geophys. Res. Solid Earth 121, 7547–7569. doi:10.1002/2016jb013007
Scanlon, B. R., Zhang, Z., Save, H., Sun, A. Y., Müller Schmied, H., van Beek, L. P. H., et al. (2018). Global Models Underestimate Large Decadal Declining and Rising Water Storage Trends Relative to GRACE Satellite Data. Proc. Natl. Acad. Sci. USA 115 (6), E1080–E1089. doi:10.1073/pnas.1704665115
Scanlon, B. R., Zhang, Z., Save, H., Wiese, D. N., Landerer, F. W., Long, D., et al. (2016). Global Evaluation of New GRACE Mascon Products for Hydrologic Applications. Water Resour. Res. 52, 9412–9429. doi:10.1002/2016wr019494
Seyoum, W. M. (2018). Characterizing Water Storage Trends and Regional Climate Influence Using GRACE Observation and Satellite Altimetry Data in the Upper Blue Nile River Basin. J. Hydrol. 566, 274–284. doi:10.1016/j.jhydrol.2018.09.025
Sheard, B. S., Heinzel, G., Danzmann, K., Shaddock, D. A., Klipstein, W. M., and Folkner, W. M. (2012). Intersatellite Laser Ranging Instrument for the GRACE Follow-On mission. J. Geod 86 (12), 1083–1095. doi:10.1007/s00190-012-0566-3
Swenson, S., and Wahr, J. (2006). Post-processing Removal of Correlated Errors in GRACE Data. Geophys. Res. Lett. 33, L08402. doi:10.1029/2005gl025285
Tangdamrongsub, N., Han, S.-C., Decker, M., Yeo, I.-Y., and Kim, H. (2018). On the Use of the GRACE normal Equation of Inter-satellite Tracking Data for Estimation of Soil Moisture and Groundwater in Australia. Hydrol. Earth Syst. Sci. 22, 1811–1829. doi:10.5194/hess-22-1811-2018
Tourian, M. J., Reager, J. T., and Sneeuw, N. (2018). The Total Drainable Water Storage of the Amazon River Basin: a First Estimate Using GRACE. Water Resour. Res. 54 (6). doi:10.1029/2017wr021674
Wahr, J., Molenaar, M., and Bryan, F. (1998). Time Variability of the Earth's Gravity Field: Hydrological and Oceanic Effects and Their Possible Detection Using GRACE. J. Geophys. Res. 103 (B12), 30205–30229. doi:10.1029/98jb02844
Watkins, M. M., Wiese, D. N., Yuan, D.-N., Boening, C., and Landerer, F. W. (2015). Improved Methods for Observing Earth's Time Variable Mass Distribution with GRACE Using Spherical Cap Mascons. J. Geophys. Res. Solid Earth 120, 2648–2671. doi:10.1002/2014jb011547
Wiese, D. N., Landerer, F. W., and Watkins, M. M. (2016). Quantifying and Reducing Leakage Errors in the JPL RL05M GRACE Mascon Solution. Water Resour. Res. 52, 7490–7502. doi:10.1002/2016wr019344
Wu, Y., Li, H., and Zou, Z. B. (2015). Investigation of Water Storage Variation in the Heihe River Using the Forward-Modeling Method. Chin. J. Geophys. 58, 3507–3516.
Yang, P., Xia, J., Zhan, C., Qiao, Y., and Wang, Y. (2017). Monitoring the Spatio-Temporal Changes of Terrestrial Water Storage Using GRACE Data in the Tarim River basin between 2002 and 2015. Sci. Total Environ. 595, 218–228. doi:10.1016/j.scitotenv.2017.03.268
Yao, C., Luo, Z., Wang, H., Li, Q., and Zhou, H. (2016). GRACE-derived Terrestrial Water Storage Changes in the Inter-basin Region and its Possible Influencing Factors: A Case Study of the Sichuan Basin, China. Remote Sensing 8, 444. doi:10.3390/rs8060444
Zhou, H., Luo, Z., Tangdamrongsub, N., Zhou, Z., He, L., Xu, C., et al. (2018a). Identifying Flood Events over the Poyang Lake Basin Using Multiple Satellite Remote Sensing Observations, Hydrological Models and In Situ Data. Remote Sensing 10 (713), 1–21. doi:10.3390/rs10050713
Zhou, H., Luo, Z., Wu, Y., Li, Q., and Xu, C. (2016). Impact of Geophysical Model Error for Recovering Temporal Gravity Field Model. J. Appl. Geophys. 130, 177–185. doi:10.1016/j.jappgeo.2016.04.004
Zhou, H., Luo, Z., Zhou, Z., Li, Q., Zhong, B., Lu, B., et al. (2018b). Impact of Different Kinematic Empirical Parameters Processing Strategies on Temporal Gravity Field Model Determination. J. Geophys. Res. Solid Earth 123, 10,252–10,276. doi:10.1029/2018jb015556
Zhou, H., Luo, Z., Zhou, Z., Zhong, B., and Hsu, H. (2017). HUST-Grace2016s: A New GRACE Static Gravity Field Model Derived from a Modified Dynamic Approach over a 13-year Observation Period. Adv. Space Res. 60, 597–611. doi:10.1016/j.asr.2017.04.026
Keywords: GRACE (gravity recovery and climate experiment), GRACE follow-on, forward modeling method, terrestrial water storage, leakage errors elimination
Citation: Zhou H, Dai M, Wang P, Wei M, Tang L, Xu S and Luo Z (2022) Assessment of GRACE/GRACE Follow-On Terrestrial Water Storage Estimates Using an Improved Forward Modeling Method: A Case Study in Africa. Front. Earth Sci. 9:796723. doi: 10.3389/feart.2021.796723
Received: 17 October 2021; Accepted: 08 December 2021;
Published: 03 February 2022.
Edited by:
Shuanggen Jin, Shanghai Astronomical Observatory (CAS), ChinaCopyright © 2022 Zhou, Dai, Wang, Wei, Tang, Xu and Luo. This is an open-access article distributed under the terms of the Creative Commons Attribution License (CC BY). The use, distribution or reproduction in other forums is permitted, provided the original author(s) and the copyright owner(s) are credited and that the original publication in this journal is cited, in accordance with accepted academic practice. No use, distribution or reproduction is permitted which does not comply with these terms.
*Correspondence: Hao Zhou, emhvdWhAaHVzdC5lZHUuY24=; Zhicai Luo, emNsdW9AaHVzdC5lZHUuY24=