 Xiaomeng Li1,2
 Ruifen Zhan
 Yuqing Wang
94% of researchers rate our articles as excellent or good
Learn more about the work of our research integrity team to safeguard the quality of each article we publish.
Find out more
ORIGINAL RESEARCH article
Front. Earth Sci., 23 December 2021
Sec. Atmospheric Science
Volume 9 - 2021 | https://doi.org/10.3389/feart.2021.795186
This article is part of the Research TopicLandfalling Tropical Cyclones: Physical Processes, Forecasting and ImpactsView all 26 articles
Tropical cyclone (TC) intensification over marginal seas, especially rapid intensification (RI), often poses great threat to lives and properties in coastal regions and is subject to large forecast errors. It is thus important to understand the characteristics of TC intensification and the involved key factors affecting TC intensification over marginal seas. In this study, the 6-hourly TC best-track data from Shanghai Typhoon Institute of China Meteorological Administration, ERA-Interim reanalysis data, and TRMM satellite rainfall products are used to analyze and compare the climatological characteristics and key factors of different intensification stratifications over the marginal seas of China (MSC) and the western North Pacific (WNP) during 1980–2018. The statistical results show that TC intensification over the MSC is more likely to occur when TCs experience relatively large intensities, weak vertical wind shear, small translation perpendicular to the coastline, relatively high fullness, strong upper-level divergence, low-level relative vorticity, and high inner-core precipitation rate. The box difference index method is used to quantify the relative contributions of these factors to TC RI. Results show that the initial (relative) intensity contributes the most to TC RI over both the MSC and the WNP. The inner-core precipitation rate and translation perpendicular to the coastline are of second importance to TC RI over the MSC, while both vertical wind shear and TC fullness are crucial to TC RI over the WNP. These findings may help understand TC activity over the MSC and provide a basis for improving intensity prediction of TCs in the MSC.
It is important to understand the characteristics of tropical cyclone (TC) intensification and the involved key factors affecting TC intensification over marginal seas, since TCs that intensify in the coastal regions often pose a more serious threat. Most previous studies have qualitatively examined the environmental factors influencing rapid intensification (RI) of TCs over the SCS or the MSC. This study focuses on a quantitative study about the influence of the TC internal and environmental factors on TC intensification and RI over all marginal seas of China, including the SCS. Results indicate that the RI occurrence over the MSC strongly depends on the characteristics of the TC itself, such as its intensity, inner-core precipitation rate and the degree of axisymmetry, and its motion component toward the coastline. In addition, the threshold of each factor at the time of the onset of RI over the MSC is also identified. These findings may help understand TC activity over the MSC and provide a basis for improving intensity prediction of TCs in the MSC.
Tropical cyclone (TC) intensification in marginal seas, especially rapid intensification (RI), is a critical and difficult problem in the operational forecast of TCs. It poses a serious threat to the lives and property in coastal regions. For instance, Supertyphoon Rammasun (1409) experienced two unexpectedly RI periods in the near-coastal regions of the central Philippines and the eastern China, respectively, causing at least 206 deaths and more than $6.5 billion in economic loss. It is, thus, important to understand the characteristics of TC intensification and the key factors affecting TC intensification in marginal seas. This cannot only help disaster prevention and mitigation but also reduce unnecessary preparedness caused by fault alarms.
Previous studies have stressed the importance of the inner-core process and the interaction between the TC circulation and both the underlying ocean and the large-scale environmental field to TC intensification and intensity changes (Wang, 2002a; Wang, 2002b; Wang and Wu, 2004). Sea surface temperature (SST) is a key in determining the surface enthalpy flux from the underlying ocean to the atmosphere, providing the energy for TC intensification and maintenance (Gao et al., 2016). SST also primarily determines the maximum potential intensity (MPI) of a TC (Emanuel, 1995; Emanuel, 1997; Emanuel, 1988; Holland, 1997). In recent studies, Wang et al. (2021a, b) have demonstrated that TC intensification rate depends predominantly on the MPI and, thus, SST. In addition to SST, the upper ocean heat content (TCHP), the sea temperature averaged in a depth of 0–100 m, the depth of ocean temperature of 26°C isotherm, and the TC-induced ocean cooling may also affect TC intensification and maintenance (Lin et al., 2008; Wada, 2015; Miyamoto et al., 2017; Fudeyasu et al., 2018).
The environmental atmospheric conditions have been found to play key roles in affecting TC intensification and intensity (Wu and Cheng, 1999; Bosart et al., 2000; Hong et al., 2000; Emanuel et al., 2004; Wang and Wu, 2004). The statistical results have shown that TC RI occurs in favorable environmental conditions, including weak vertical wind shear (VWS), strong upper-tropospheric divergence, high mid-lower tropospheric relative humidity (RH), and high convective available potential energy and TCHP (Kaplan and Demaria, 2003; Hendricks et al., 2010; Kaplan et al., 2010; Shu et al., 2012; Wang et al., 2015). Wang et al. (2015) found that the environmental VWS between 300 and 1,000 hPa is more representative than the commonly used VWS between 200 and 850 hPa in suppressing TC intensification in the western North Pacific (WNP).
In addition to the environmental conditions, TC structure also has an important impact on TC intensification. Xu and Wang (2015, 2018) used the radius of maximum wind (RMW), the radius of 34-kt wind (AR34), and the outer-core wind skirt parameter (DR34 = AR34−RMW) to characterize the storm size and found that RI occurs only in a relatively narrow range of parameter space in TC intensity and both inner- and outer-core sizes. Guo and Tan (2017) proposed the concept of TC fullness (TCF), which is defined as the ratio of the extent of the outer-core wind skirt to the outer-core size of a TC (TCF = DR34/AR34). They found that the correlation between TC intensity and fullness is stronger than other measures that only contain a single size parameter. Some other studies have also indicated the importance of convective processes in TC intensity change. For example, convective bursts in the eyewall are shown to play important roles in the onset of RI (Chen and Zhang, 2013; Wang and Wang, 2014). Previous studies have also revealed that TC intensity change rate is linearly correlated with the departures in the inner-core precipitation, and RI TCs usually correspond to relatively high core precipitation rates (Gao and Chiu, 2010; Su et al., 2020).
The marginal seas of China (MSC), including the Bohai Sea, the Yellow Sea, the East China Sea, and the South China Sea (SCS), are extremely vulnerable to TC activity, especially to RI TCs. Most previous studies have focused on RI over the SCS. Liang et al. (2020) indicated that most of RI cases over the SCS occur in the post-monsoon season, during which the mid-latitude westerly trough often reaches the northern SCS and the southwest monsoon flow retreats to the southern SCS but is still strong (Chen et al., 2015). Among various environmental conditions, VWS, low-level convergence, and low-level moist convergence are particularly important (Hu and Duan, 2016). A recent study also emphasized the role of fast storm translation speed and high TC intensification potential north of the storm center at the previous 24 h in TC RI over the SCS (Chen et al., 2021). Some studies have also examined TC RI over the MSC as a whole. It has been shown that the environmental conditions in the RI composite over the MSC exhibit weak VWS, plentiful moisture transport, strong low-level convergence and ascending motion, all being favorable for TC RI (Huang and Lei, 2010; Zheng et al., 2016). Chen et al. (2014) have compared the differences in intensity characteristics between Supertyphoons Rammasun (1409) and Damrey (0518) and found that weak downstream vertical shear of zonal wind, and high temperature in the northern SCS were key factors to the RI of the two supertyphoons.
Most previous studies have qualitatively examined the environmental factors influencing RI of TCs over the SCS or the MSC. A systematic analysis and quantitative investigation on TC intensification rate (IR) over the MSC and its relationship with the environmental factors and the TC metrics itself have not yet been conducted. Therefore, the main objectives of this study are 1) to compare the climatological characteristics of TC intensification and RI events over the MSC and the WNP; 2) to determine the key factors that affect TC IR over the MSC and the WNP; 3) to quantify the relative contributions of the associated factors to TC RI based on the box difference index (BDI) method and identify the threshold of each factor at the time of the onset of RI over the MSC.
The 6-hourly TC best-track data during 1980–2018 used in this study were obtained from the Shanghai Typhoon Institute of China Meteorological Administration (CMA), which consist of TC central location (longitude and latitude), maximum 2-min mean sustained surface wind speed (Vmax), and minimum central sea level pressure. Based on the TC best-track data, RMW, TC intensity change, and translation speed were calculated. We calculated translation components parallel and perpendicular to the coastline closest to the TC center, SPDx and SPDy, respectively. The 6-hourly TC size data were also from the CMA (Lu et al., 2017), in which the AR34 data were used in this study. Here, we mainly focused on TC activity over the MSC. For comparison, TC activity over the WNP was also examined. The MSC is defined as the areas inside the 24-h cordon according to TC Operation and Service Criterion of China Meteorological Administration (2012), while the WNP is defined as the region 0–40°N, 127–180°E excluding the MSC, as shown in Figure 1. Only TCs with Vmax greater than 17.2 m s−1 were considered in our analysis, and the data for offshore distance ≤50 km were removed to avoid the land effect.
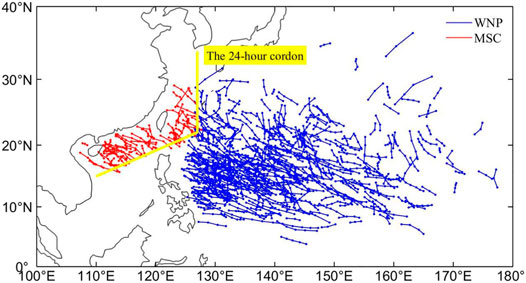
FIGURE 1. The ranges of the western North Pacific (WNP) and the marginal seas of China (MSC), and the tracks of the tropical cyclone (TC) rapid intensification (RI) cases during 1980–2018. The red tracks are RI TC cases over the MSC, and the blue are those over the WNP. The yellow line is the 24-h cordon, which distinguishes the MSC and the WNP.
The 24-h intensity changes are often used to define TC RI over the WNP and the North Atlantic (Kaplan and Demaria, 2003; Shu et al., 2012). Considering the relatively short duration of TCs in the MSC before making landfall and the size of RI samples, here 12-h intensity changes are considered as in previous studies (Yan, 1996; Zheng et al., 2016). According to the 12-h TC intensity change (
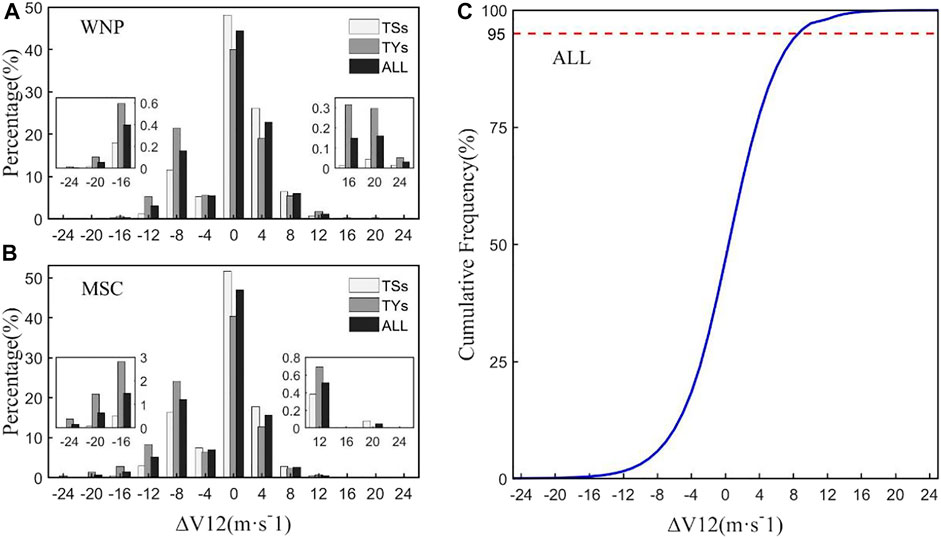
FIGURE 2. (A, B) The frequency and (C) cumulative frequency distributions of 12-h intensity change
The environmental factors were calculated using ERA-Interim reanalysis data with a 1 × 1° horizontal resolution and 37 vertical pressure levels. Following Kurihara et al. (1993), the environmental fields including winds, vorticity, divergence, relative humidity were filtered to remove all disturbances with wavelengths less than 1,000 km. We calculated the correlation between the 12-h TC IR and VWS between two given pressure levels over the WNP and the MSC during 1980–2018. We found that the deep-layer shear between 300 and 850 hPa is more representative than the shear between any other two pressure levels in affecting TC intensity in both the WNP and the MSC, which is consistent with the findings of Wang et al. (2015). Therefore, the environmental VWS between 300 and 850 hPa is used as VWS in our following analysis.
In addition, the core precipitation rate and TC fullness were considered as potential factors to study the influence of the TC inner-core size on its intensity change. The core precipitation rate was calculated based on surface precipitation taken from the Tropical Rainfall Measuring Mission (TRMM) 3B42 precipitation product (Huffman et al., 2007), with a 3-h temporal resolution and 0.25 × 0.25° spatial resolution from 1998 to 2018. TC fullness was calculated based on the TC best-track data and TC size data mentioned above.
The TC MPI was calculated using the algorithm of Bister and Emanuel (2002), which is expressed as
where
The box difference index (BDI) method (Fu et al., 2012) was used to distinguish the differences between the two sets of factor samples in the TC RI cases and non-RI cases and to rank the importance of the factors. The BDI was given by
where
The factor threshold for the onset of RI was determined following Hu and Duan (2016). First, the Kolmogorov–Smirnov (KS) test method was used to determine whether the factor X obeys a normal distribution (Yap and Sim, 2011). Second, the threshold range of the factor X was determined based on its average value
where
During 1980–2018, there were a total of 1,012 TCs, with 4,897 intensification cases and 960 RI cases over the WNP and 1,261 intensification cases and 142 RI cases in the MSC (Figure 1). Figure 2 shows the frequency and cumulative frequency distributions of 12-h intensity change (
We further statistically analyzed the TC IR over the MSC. Table 1 shows the IR distribution of the 1,261 TC intensification cases stratified by intensity category over the MSC. We can see that TSs accounted for the higher proportion of all intensification cases by 71.05%, and TYs for the lower proportion by 28.95%. Among the different IR ranges, the proportion is the highest in the range of 4–8 m s−1 (12 h)−1 with 55.83%. For TYs, the frequency of RI cases among the intensification cases is the highest, with 15.34%, followed by TSs with 9.60%. This strongly indicates that the RI cases over the MSC depend on the TC intensity.
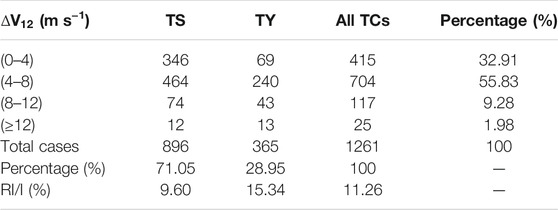
TABLE 1. The distribution of 12-h intensity change (
Figures 3A–D present the monthly frequency of all intensification cases and RI cases, and their proportions to total cases and all intensification cases over the WNP and the MSC, respectively. Over the WNP (Figures 3A, C), the TC intensification and RI mostly occurred in July-October, with the peak for intensification cases in August and for RI cases in September, respectively (Figure 3A). The proportions of intensification cases to total TC cases do not show significant difference in 12 months, while the monthly proportion of the frequency of RI cases to all intensification cases exhibits the peak in November (Figure 3C). In contrast, over the MSC (Figures 3B, D), the TC intensification and RI mainly occurred in July–September, with the peak in September (Figure 3C). This may be due to the active southwest monsoon in the MSC during this period (Hu and Duan, 2016). The monthly proportions decrease rapidly in November and December (Figure 3D). Figures 3E–H show interannual variabilities of the frequency of all intensification cases and its proportions to the frequency of all TC intensity changes over the WNP and the MSC, respectively. A prominent feature is a significant upward trend in the frequency of TC intensification cases over the MSC, from 21 cases per year in 1980 up to more than 42 cases per year in 2018, namely, with a doubling in 39 years (Figure 3F). In contrast, the trend in the frequency of TC intensification cases over the WNP during 1980–2018 is not significant. Similar to the frequency of TC intensification cases over the MSC, the ratio of the intensification cases to all cases over both the WNP and the MSC also shows a robust increasing trend (Figures 3G, H). The ratio over the WNP increased from 34% to 47% (Figure 3G), and from 19% to 39% over the MSC (Figure 3H) during 1980–2018. This indicates that the frequency and probability of TC intensification over the MSC is increasing, which may pose greater challenges to operational forecasting and a more serious threat to coastal areas of China.
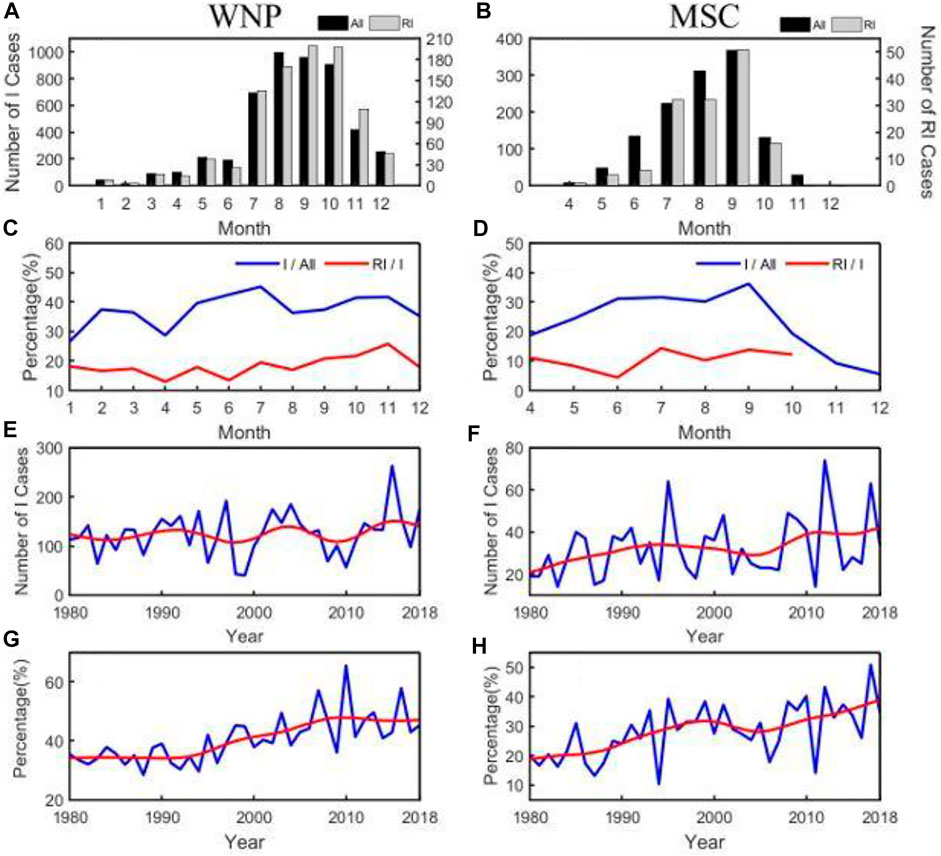
FIGURE 3. The monthly frequencies of all intensification (black) and RI (gray) cases (A,B) and their proportions (%) to the frequency of all TC cases (blue) and all intensification (red) cases (C,D), and the interannual variability of TC intensification frequency (blue) (E,F) and its proportions to the freuqency of all TC intensity changes (blue) (G,H) over the WNP (A,C,E,G) and the MSC (B,D,F,H). E–H The red curves indicate after a 5-point smoothing.
Figure 4 shows the spatial distributions of the frequency of all TC intensification cases and the maximum IR in the two sub-basins. Most of the intensification cases over the WNP occurred east of the Philippines (10°–25°N, 125°–155°E), centered in the region 10°–20°N, 130°–140°E. Over the MSC, the intensification cases mostly occurred in the northern SCS and the East China Sea, with a maximum in the central and eastern SCS (15°–20°N, 110°–120°E) and second maximum in the east coasts of the northern Philippines and Taiwan. In contrast, the positions of the maximum IR are widely distributed. The two maximum areas are located east of the northern Philippines (15°–20°N, 125°–135°E) with the maximum 40 m s−1 (12 h)−1 and over the southern East China Sea with the peak 20 m s−1 (12 h)−1, respectively. Note that intensification cases with IR greater than 10 m s−1 (12 h)−1 occurred along the China coast.
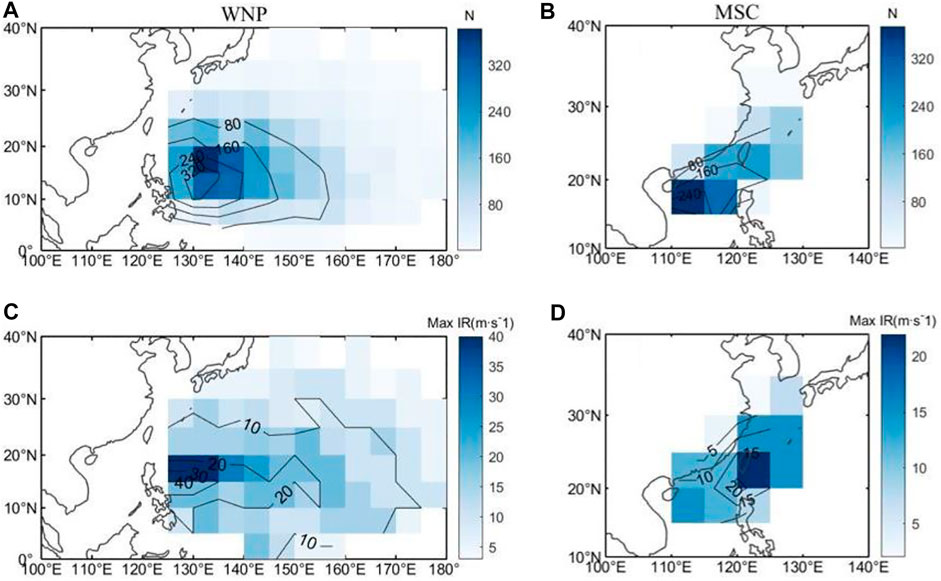
FIGURE 4. Spatial distributions of frequency of (A,B) all intensification cases and (C,D) maximum intensification rate (Max IR; m s−1) in each 5°×5° grid box over the WNP (A,C) and the MSC (B,D). IR, TC in intensification rate.
TC intensification often occurs in a favorable environment. Based on previous studies, potential factors affecting TC intensity change over the WNP and the MSC include climatology and persistence factors, large-scale environmental factors, ocean forcing factors, and TC structure factors (Table 2). In the following, we discuss these factors over the MSC. The corresponding factors over the WNP are also examined for a comparison.
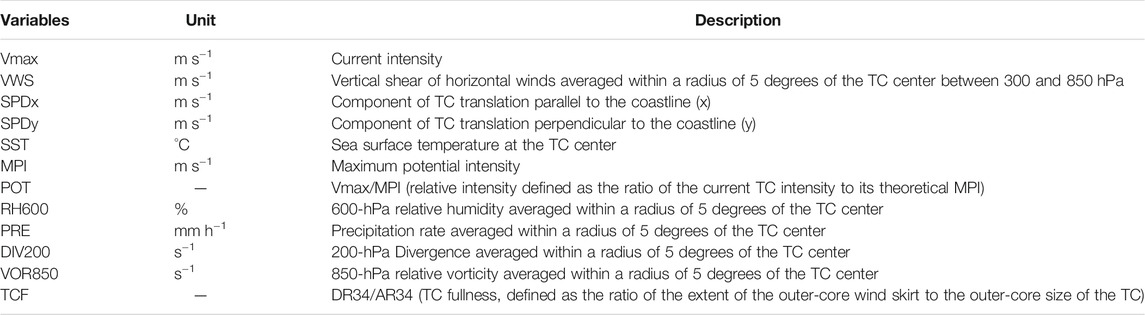
TABLE 2. List of the factors (their unit and description) analyzed in this study.
Figure 5 shows the scatter diagrams of TC IR against TC intensity (Vmax), relative intensity (the ratio of Vmax to its theoretical MPI abbreviated as POT), TCF, and environmental VWS between 300 and 850 hPa over the WNP and the MSC, respectively, together with their corresponding fitted 50th and 95th percentiles of IRs. TC IR shows an approximately linear dependence on Vmax, with a positive correlation over both sub-basins (Figures 5A, B), with the correlation coefficients of 0.36 and 0.28, respectively. It can be seen from the fitted 95th percentile curve that over the WNP (Figure 5A), the TC IR increases with the increase of Vmax initially and peaks at Vmax of around 40 ms−1, and then decreases with increasing TC intensity afterward, which is consistent with the results of Xu and Wang (2018). Over the MSC, the IR-Vmax relationship is similar to that over the WNP, except that the IR peaks at Vmax of 35 ms−1 (Figure 5B). Since the 95th percentile of IR can roughly represent RI, the results suggest that TCs with Vmax of 40–45 m s−1 over the WNP and Vmax of 30–35 m s−1 over the MSC are the most conducive to the occurrence of TC RI. We further examined the relationship between TC IR and TC relative intensity, which represents how far the current TC intensity is from its MPI. The IR also shows an approximately positive correlation with POT. For the fitted 95th percentile curve, when POT < 0.45, the IR increases with the increase of POT, reaches the peak at POT = 0.45 and then decreases with increasing POT over the WNP (Figure 5C). However, the IR reaches the peak when POT = 0.35 over the MSC (Figure 5D). This indicates that when the intensity of a TC reaches 45% (35%) of its corresponding MPI, the TC has the greatest potential to intensify and, thus, is favorable for RI in the WNP (MSC). The IR over the WNP is highly correlated with TCF, but IR does not linearly depend on TCF over the MSC. In fact, when the TCF < 0.7, TC IR increases with increasing TCF, but decreases with TCF when TCF > 0.7 over the MSC, suggesting that the TCF between 0.6 and 0.8 is the most conducive to TC RI (Figure 5F). In general, consistent with previous studies, there is a negative correlation between VWS and TC IR. Namely, the environmental VWS significantly suppresses the occurrence of TC RI over the MSC.
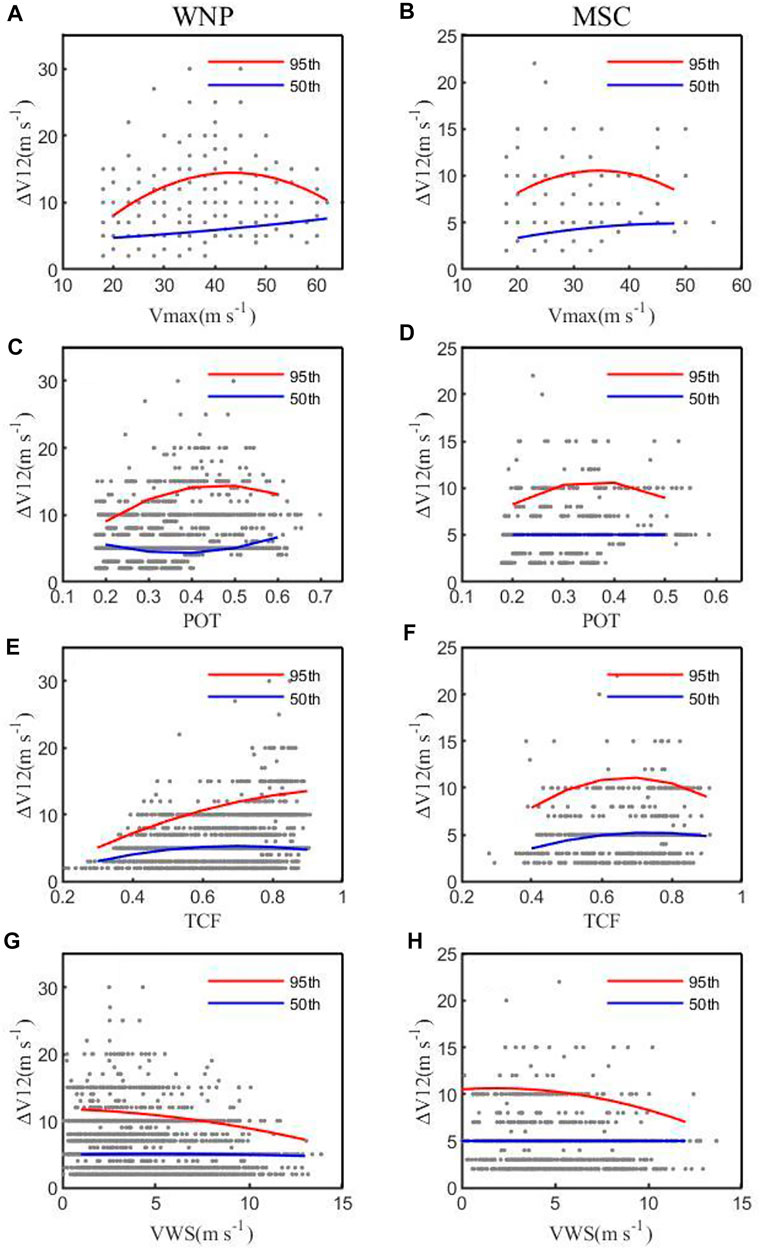
FIGURE 5. Scatter diagrams of TC intensification rate (IR) against (A,B) Vmax (m s−1), (C,D) POT, (E,F) TCF, and (G,H) VWS between 300 and 850 hPa (m s−1) over (A,C,E,G) the WNP and (B,D,F,H) the MSC. The red and blue curves are the 95th and 50th percentiles of IR for the given storm intensity, respectively, for the corresponding sample sizes. POT, the ratio of Vmax to its theoretical MPI; TCF, TC fullness; VWS, vertical wind shear.
We further divided the intensity changes into four categories as listed in Table 3. They are weakening cases with ∆V12 ≤ −4 m s−1, neutral cases with 0 < ∆V12 < 4 m s−1, intensifying cases with 4 m s−1 < ∆V12 < 8 m s−1, and rapidly intensifying cases with ∆V12 ≥ 8 m s−1. Here, we compare the differences in various factors listed in Table 2 among the four intensity change categories. Figure 6 shows the box plots of Vmax, POT, TCF, VWS, SPDy, and 200-hPa divergence in the four intensity change categories for TCs over the WNP and the MSC, respectively. The two-sided Student’s test is used to examine whether the differences between RI and non-RI (including neutral and intensifying categories) are statistically significant. There are large differences in these factors between the weakening and intensifying composites over the WNP and the MSC. Weakening TCs correspond to larger Vmax, POT, TCF, VWS, and SPDy, and smaller upper-level divergence than all other categories. This indicates that intense TCs with strong VWS, rapid SPDy and weak upper-level divergence are prone to weakening, and they are close to their corresponding theoretical MPI.
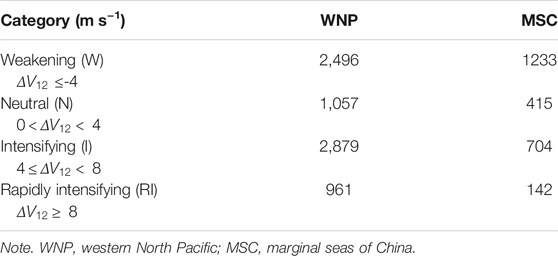
TABLE 3. Intensity change categories, definitions, and sample sizes for TCs over the WNP and the MSC, respectively.
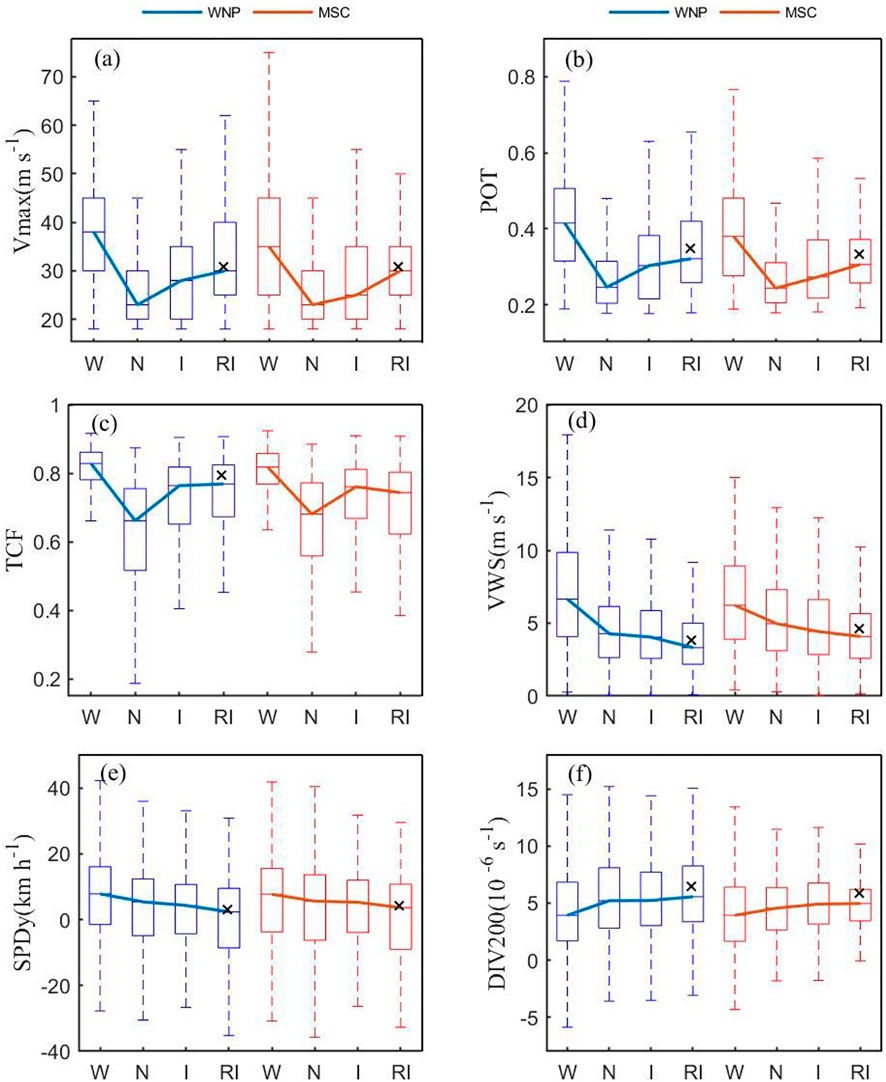
FIGURE 6. Box plots and median lines of (A) Vmax (m s−1), (B) POT, (C) TCF, (D) VWS (m s−1), (E) SPDy (m s−1), and (F) 200 hPa divergence (DIV200, 10–6 s−1) for different TC intensification rates over the WNP (A,C,E) and the MSC (B,D,F). The blue represents WNP, and the red represents MSC. “×” shows differences between RI and non-RI being statistically significant above 95% confidence level based on the two-sided Student’s t test. SPDy, slow moving component perpendicular to the coastline.
Factors important to the three intensity change categories over the MSC show similar characteristics to those over the WNP except for TCF (Figure 6). Vmax, POT, 200-hPa divergence increase, while VWS and SPDy decrease from neutral to RI. TCF in the weakening composites has the largest median value exceeding 0.8, and the median in the other three composites is between 0.6 and 0.8. TCF over the WNP generally increases from the neutral to RI, but the increase from the intensifying composite to RI composite is relatively small. However, TCF over the MSC shows a change from increasing to decreasing, with a slightly smaller TCF in the RI composite than in the intensifying composite. This leads to the statistically insignificant difference in TCF between the RI and non-RI composites over the MSC. These results indicate that a TC over the MSC has the potential to intensify rapidly when it is embedded in the favorable environment with small VWS, slow-moving component perpendicular to the coastline (SPDy), and strong upper-level divergence, and has a relatively large Vmax but far from its MPI.
In general, a fast-moving TCs tend to develop large inner-core asymmetries, which is often unfavorable for TC RI (Peng et al., 1999; Wang and Wu, 2004). Meanwhile, the slow-moving TCs could reduce the intensification of a strong TC due to SST cooling induced by ocean upwelling and turbulent mixing and, thus, unfavorable for TC intensification. However, in the MSC, the ocean temperature is often well mixed compared with the open tropical oceans. As a result, slow translation toward the coastline (small SPDy) often leads insignificant SST cooling and even causes coastal warming in some cases and, thus, favorable for RI (Zhang et al., 2019). In addition, the strong upper-level divergent environment can provide a favorable “pumping” effect, which is conducive to the occurrence of TC RI (Mei and Yu, 2016).
We further examined the spatial distribution of the composite 600-hPa relative humidity and 850-hPa vertical relative vorticity for the four intensity change categories over the MSC (Figure 7). Note that the TC vortex has been removed as mentioned in the Data and methods section, As expected, the weakening composite shows the driest in the northwest quadrant and near the TC core among all intensity change composites (Figures 7A–D). However, there is little difference in the mid-level relative humidity for three intensifying composites, which is different from those over the WNP where the RI composite is slightly moister than both the intensifying and neutral composites (Hendricks et al., 2010), but similar to those over the SCS (Hu and Duan, 2016). The weakening composite shows the background relative vorticity in similar magnitudes to the intensifying and the RI composites, while the neutral composite has the smallest relative vorticity in the TC core (Figures 7E–H). The large background vorticity still occurs in the weakening composite likely because considerable weakening cases are embedded in monsoon gyres with relatively large positive vorticity over the WNP, as documented by Liang et al. (2018) and more recently by Song et al. (2021). In contrast, the neutral composite TCs are often in their slow intensification stage with relatively low intensification rate, and the background circulations are often stable and unfavorable for either RI or weakening of TCs. The RI composite is quite similar to the intensifying composite in terms of the spatial structure and magnitude of the background vorticity. Note that part of the positive vorticity in the composite could be due to the deficiency in the vortex filtering algorithm used. The RI cases could be more likely to be embedded in monsoon trough with relatively high background vorticity over the WNP but are at their intermediate intensity as previously documented based on observations (Xu and Wang, 2015; Xu and Wang, 2018) and recent theoretical studies (Wang et al., 2021a; Wang et al., 2021b). However, the weakening cases often occur after TCs pass their lifetime maximum intensity and, thus, are at relatively high intensity with large size, leading to the remnant of the low wavenumber component of the TC vortex in the filtered field. These results are in general consistent with the frequency distributions of TC intensity for the four intensity change categories shown in Figure 6A and also similar to those found for TCs over the WNP by Hendricks et al. (2010). This suggests that although the mid-level relative humidity and low-level relative vorticity are important for TC intensification, they could not be considered as critical factors affecting TC RI because they are strongly dependent on TC intensity itself.
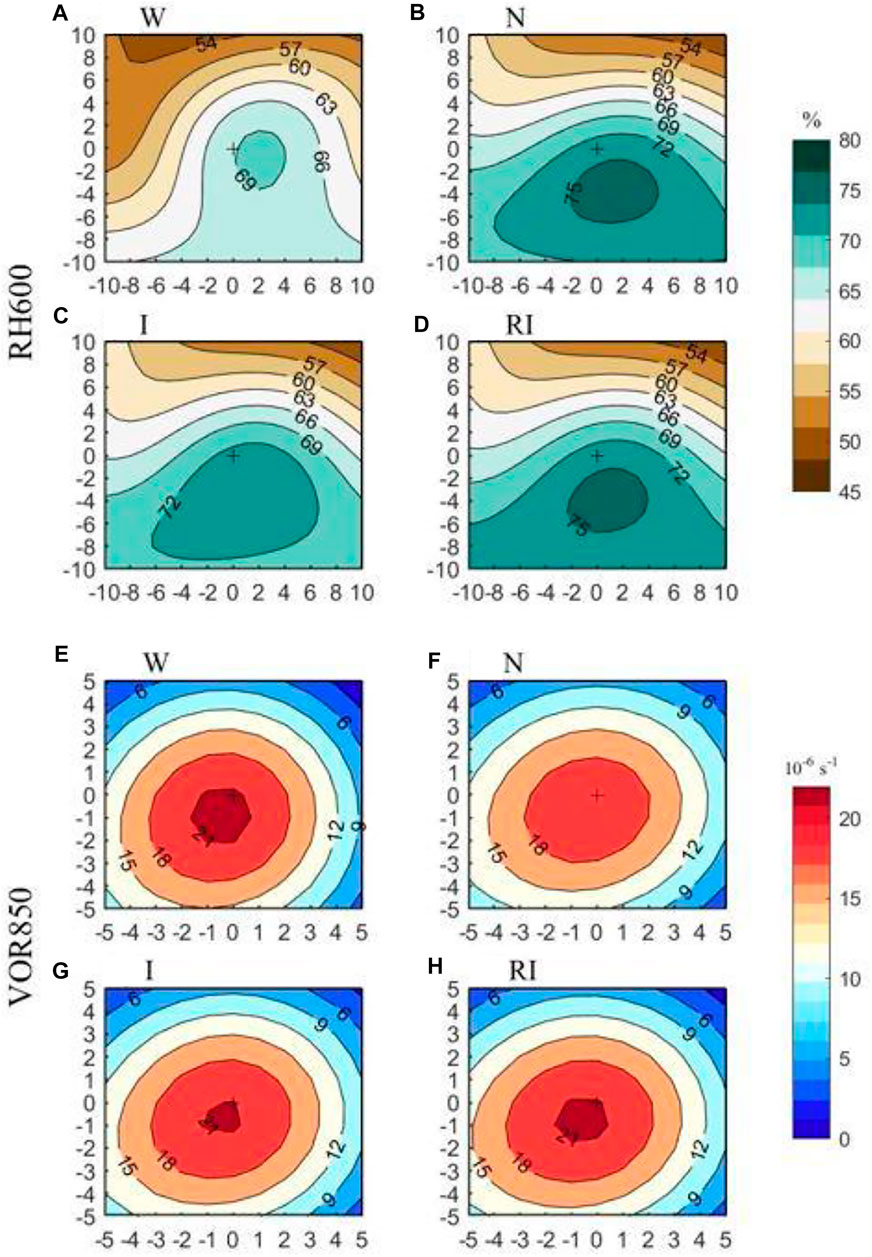
FIGURE 7. The composites of (A–D) 600-hPa relative humidity (RH600, %) and (E–H) 850-hPa relative vorticity (VOR850, 10–6 s−1) for four intensity change categories over the MSC described in Table 3. In each category, the top-left panel is the weakening (W) composite, the top-right panel is the neutral (N) composite, the bottom-left panel is the intensifying (I) composite, and the bottom-right panel is the rapidly intensifying (RI) composite. “+” represents the TC center, and the horizontal and vertical coordinates are the latitude and longitude (°) to the TC center.
Finally, we examined the spatial distributions of the composite SST and precipitation rate for each of the intensity change categories over the MSC (Figure 8). There is a remarkable meridional SST gradient across the TC center in all categories with cold to the north and warm to the south (Figures 8A–D). The meridional SST gradient is the largest in the weakening TC composite while smallest in the RI composite. The SST near the TC center increases monotonously from weakening (27.6°C) to RI composites (28.6°C) over the MSC, consistent with that over the WNP (Hendricks et al., 2010). This is mainly because most RI cases occurred in the tropics, while the weakening cases often moved out of the deep tropics. Unlike SST, the TC core precipitation rate tends to be the least in neutral composite and the most in intensifying and RI composites (Figures 8E–H), again likely related to TC intensity (Cecil and Zipser, 1999; Hoshino and Nakazawa, 2007). Nevertheless, the composite inner-core precipitation rate shows a more axisymmetric structure in the RI composite while a more asymmetric structure in the weakening composites than in all other intensity change composites.
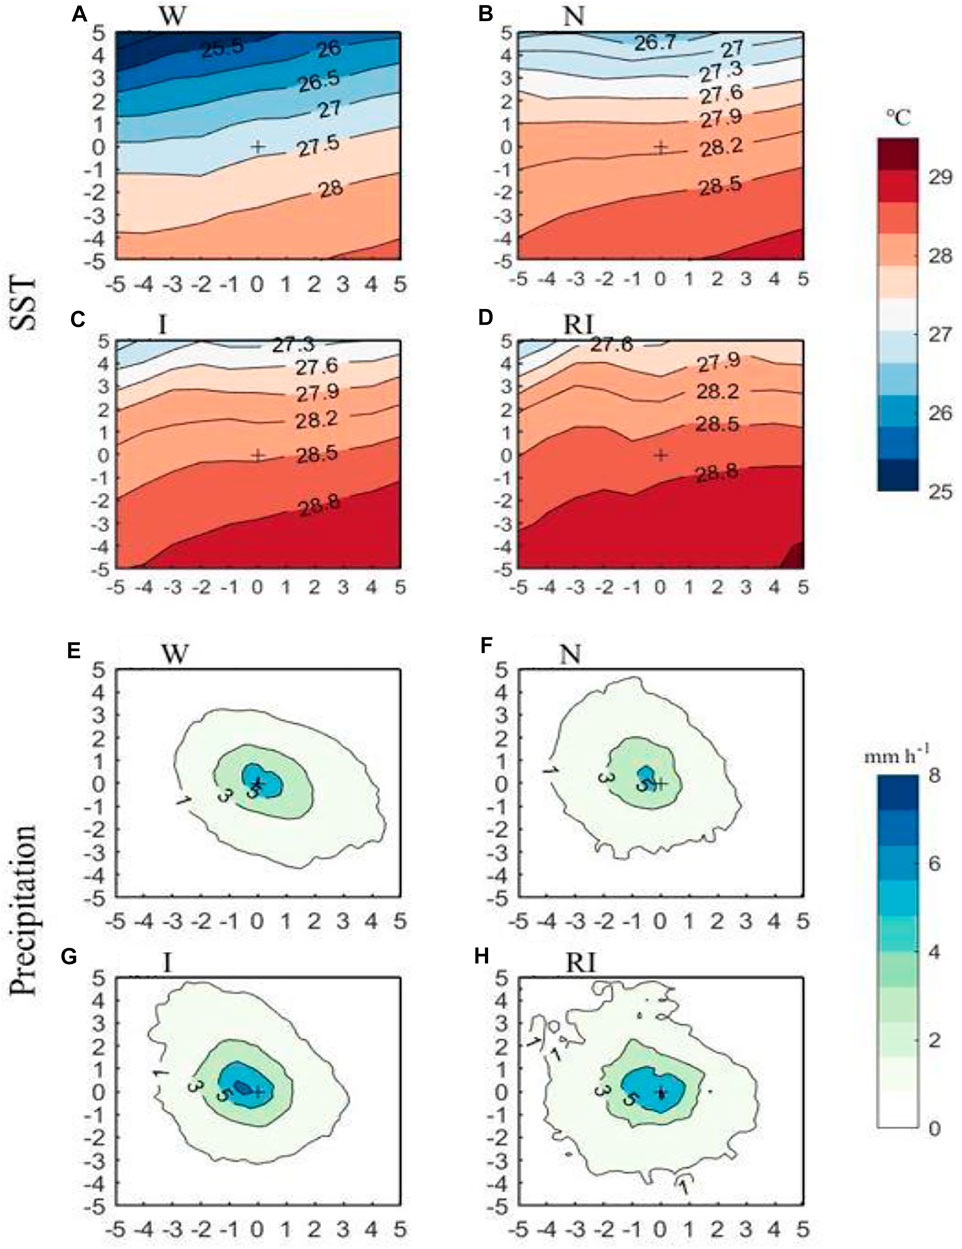
FIGURE 8. As in Figure7, but for (A–D) sea surface temperature (SST) in °C and (E–H) precipitation rate in mm h−1.
The above analyses demonstrate that TC intensification over the MSC is more likely to occur when TCs have relatively large and relative intensities, small translation component perpendicular to the coastline, and high core precipitation rate, and are embedded in an environment with warm SST, weak vertical wind shear, and strong upper-level divergence. Especially, TC relative intensity, VWS, 200-hPa divergence, and axisymmetric inner-core structure are key factors affecting TC RI over the MSC. However, we note that these factors might not be independent of each other and their relative importance is different. Therefore, it is important to examine the relative importance of these factors and their thresholds in determining TC RI over the MSC, which will be discussed in the next section.
The BDI method described earlier in the Method section is used to quantify the relative importance of factors to TC RI over the MSC, including TC persistent factors (Vmax, POT, SPDy), environmental factors [SST, VWS, middle-level relative humidity (RH600), low-level vorticity at 850 hPa (VOR850), and upper-level divergence (DIV200)], and TC structure factors (TCF and precipitation rate, PRE). For a comparison, the corresponding factors affecting TC RI over the WNP are also discussed.
Figure 9 shows the relative importance of all abovementioned factors to RI over the WNP and the MSC, respectively. The results show that the most important factors distinguishing RI and non-RI cases over the WNP are POT, Vmax, and VWS with the BDI values 0.28, 0.27, and −0.13, respectively, followed by TCF (0.10), SPDy (−0.08), DIV200 (0.07), SST (0.07), PRE (0.06), VOR850 (0.06), and RH600 (0.002). For the MSC, the most important factors distinguishing RI and non-RI cases are Vmax, POT, core PRE with the BDI values being 0.18, 0.17, and 0.13, respectively, followed by SPDy (−0.12), VWS (−0.11), TCF (0.09), SST (0.07), DIV200 (0.06), VOR850 (0.03), and RH600 (0.02). Compared with the environmental factors, Vmax and POT contribute greater to TC RI over both the MSC and the WNP, which is consistent with the results shown in Figure 6. More interestingly, PRE and SPDy play a key role in TC RI over the MSC, while VWS and TCF are two critical factors to TC RI over the WNP. This suggests that TC RI over the MSC is more likely related to the TC itself and the coastal air-sea interaction implied by the slow translation component perpendicular to the coastline. It is also shown that the impacts of low-level vorticity and mid-level relative humidity on RI are not significant over the MSC, which is consistent with the results shown in Figure 7.
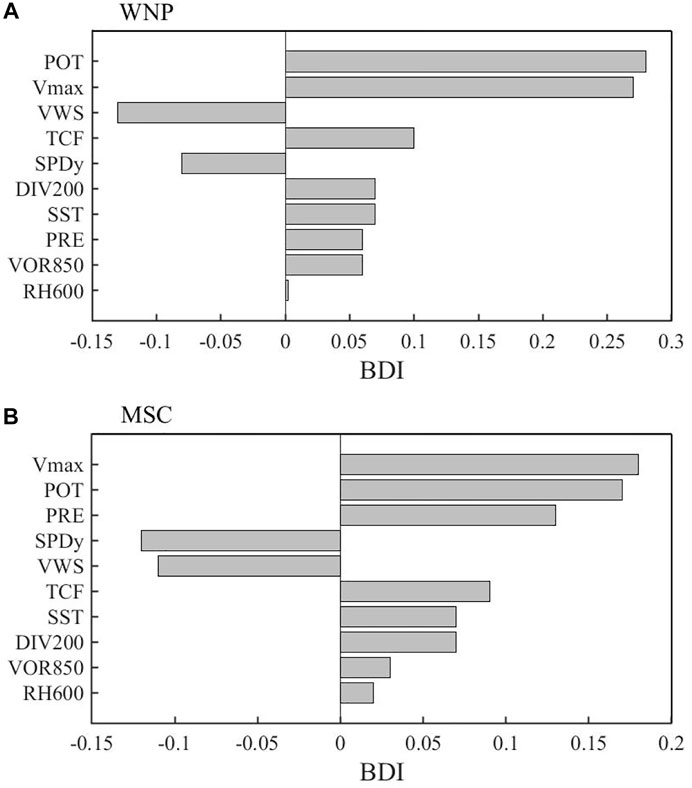
FIGURE 9. Key factors in the TC RI and their corresponding box difference index (BDI) values over (A) the WNP and (B) the MSC. The factors have been ordered based on the BDI absolute value.
Finally, the threshold determination method is applied to calculate the threshold of each factor triggering the onset of RI and the corresponding RI probability, with the results shown in Table 4. Vmax and POT have a greater probability to the RI occurrence than other factors over the MSC. Vmax greater than 33.45 m s−1 and POT greater than 0.35 are especially conducive to TC RI occurrence, with the RI probabilities of 16.23% and 16.20%, respectively, which is consistent with the results in Figure 9. When the precipitation rate and TCF meet the thresholds of PRE ≥ 1.87 mm h−1 and TCF ≥ 0.58, the probabilities of RI occurrence are also relatively large, reaching 14.39% and 13.61%, respectively. The rest in order are VWS (≤5.02 m s−1), SPDy (≤14.84 km h−1), upper-level divergence (≥7.35 s−1), and SST (≥28.57°C), with the RI probabilities of 12.47%, 11.84%, 11.74%, and 11.39%, respectively. Note that although high SST is considered as favorable underlying surface conditions, SST does not show a high probability to RI occurrence, also consistent with the insignificant contribution shown in Figure 9B and previous studies (Hendricks et al., 2010; Hu and Duan, 2016).
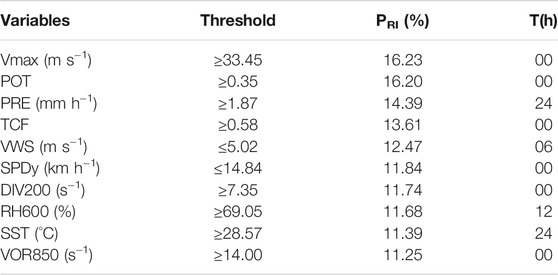
TABLE 4. The threshold of each factor, the corresponding RI probability, and the lead time for TC RI over the MSC.
It is also interesting to see whether a factor is meaningful for forecasting or, alternatively, whether a factor has any leading signal. As we see from Table 4, the factors with the earliest signal are PRE and SST with a leading time of 24 h, followed by VWS with the leading time of 6 h, but other factors seem to show no leading signals. These results indicate that when Vmax, POT, PRE, and TCF meet the thresholds, it is most beneficial for the TC RI over the MSC, and other factors are often secondary and partly associated with the consequence of TC intensity change. In terms of prediction, only the inner-core precipitation rate, SST, mid-level RH, and VWS show good lead time signal and, thus, meaningful for TC RI prediction over the MSC.
In this study, we have compared the climatological characteristics of TC intensification and RI over the MSC and the WNP, and determined the key factors that affect TC IR and RI over the MSC based on the best-track TC data, ERA-Interim global reanalysis, and TRMM precipitation products during 1980–2018. Particularly, we have quantified the relative contributions of various factors to TC RI based on the box difference index (BDI) method and identified the threshold of each factor at the time of the RI onset over the MSC.
The statistical results show that strong TCs have relatively lower (higher) frequency of intensification with IR less than (greater than) 12 m s−1 (12 h)−1 than weak TCs, but they often have faster weakening rates. The frequency of RI is higher for strong TCs than for weak TCs, indicating that TC RI over the MSC strongly depends on the intensity of the TC itself. Furthermore, TC intensification and RI show a distinct seasonal variation over the WNP and the MSC. Over the WNP, TC intensification and RI mostly occurred in July–October, with the peaks for intensification in August and for RI in September, respectively. In contrast, over the MSC, TC intensification and RI mainly occurred in July–September, both with the peak in September. It is worth noting that both the frequency of the intensifying cases and the ratio of the intensifying cases to all cases over the MSC show an increasing trend during 1980–2018. A similar trend has also been found in a recent study by Liu et al. (2021). If the trend continues, it may impose increasing challenges to forecasting and warning associated with landfalling TCs over China coast.
We have also analyzed and evaluated the climatological and persistence factors, large-scale environmental factors, ocean forcing factors, and TC structure factors that affect TC intensity changes over the MSC. Results from correlation and composite analyses demonstrate that TC intensification over the MSC is more likely to occur when a TC has relatively large initial and relative intensities, weak VWS, small TC translation component perpendicular to the coastline, relatively high TCF, strong upper-level divergence, warm SST and high core precipitation rate. A comparison of all these factors with TC RI indicates that Vmax and POT contribute the greatest to TC RI over both the MSC and the WNP among all factors examined. More interestingly, both PRE and SPDy are of the second importance to TC RI over the MSC, while both VWS and TCF are crucial to TC RI over the WNP. Furthermore, when Vmax, POT, precipitation rate, and TCF meet the thresholds with Vmax ≥ 33.45 m s−1, POT ≥ 0.35, PRE ≥ 1.87 mm h−1, and TCF ≥ 0.58, the probabilities of RI occurrence over the MSC are relatively large. In addition, precipitation rate, SST, and VWS show good leading signal to TC RI occurrence over the MSC.
Compared with previous studies (Chen et al., 2015; Hu and Duan, 2016; Liang et al., 2020), this study has focused on TC intensification and RI over all marginal seas of China, including the SCS. In addition, the TC internal factors including TCF and precipitation rate, and the translation component perpendicular to the coastline have also been analyzed. Both qualitative and quantitative analysis results indicate that the RI occurrence over the MSC strongly depends on the characteristics of the TC itself, such as its intensity, inner-core precipitation rate, the degree of axisymmetry, and its motion component toward the coastline. Although high SST is favorable for TC intensification, its effect on TC RI is not statistically significant, consistent with previous studies (Hendricks et al., 2010; Hu and Duan, 2016).
Finally, we should point out that more factors, such as the upper ocean heat content (TCHP), atmospheric moisture transport flux, and the upper-tropospheric momentum flux, could also affect TC intensity change and RI, and can be examined in future studies. In addition, it should be noticed that some key factors discussed in this study are not independent of each other but are interrelated. How the independency may affect the results discussed in this study is unknown. Therefore, it is necessary to find a better algorithm that can provide a more accurate estimate of relative importance of key factors in future studies. Nevertheless, the findings in this study provide a basis for future research to improve the understanding and forecasting of TC intensity change in the MSC.
The original contributions presented in the study are included in the article/Supplementary Material, further inquiries can be directed to the corresponding author.
RZ developed the main idea. XL performed the analysis of observations. XL and RZ wrote the manuscript. YW and JX provided critical feedback. YW helped shape the research and manuscript.
This study is supported by the National Key R&D Program of China (2017YFC1501604) and the National Natural Science Foundation of China (41730960, 41875114, and 41875057).
The authors declare that the research was conducted in the absence of any commercial or financial relationships that could be construed as a potential conflict of interest.
The handling Editor declared a past co-authorship with one of the authors, JX.
All claims expressed in this article are solely those of the authors and do not necessarily represent those of their affiliated organizations, or those of the publisher, the editors, and the reviewers. Any product that may be evaluated in this article, or claim that may be made by its manufacturer, is not guaranteed or endorsed by the publisher.
Bister, M., and Emanuel, K. A. (2002). Low Frequency Variability of Tropical Cyclone Potential Intensity 1. Interannual to Interdecadal Variability. J.‐Geophys.‐Res. 107 (D24), 4801. doi:10.1029/2001jd000776
Bosart, L. F., Velden, C. S., Bracken, W. E., Molinari, J., and Black, P. G. (2000). Environmental Influences on the Rapid Intensification of Hurricane Opal (1995) over the Gulf of Mexicofluences on the Rapid Intensification of Hurricane Opal (1995) over the Gulf of Mexico. Monthly Weather Rev. 128, 322–325. doi:10.1175/1520-0493(2000)128<0322:eiotri>2.0.co;2
Cecil, D. J., and Zipser, E. J. (1999). Relationships between Tropical Cyclone Intensity and Satellite-Based Indicators of Inner Core Convection: 85-GHz Ice-Scattering Signature and Lightning. Mon. Wea. Rev. 127, 103–123. doi:10.1175/1520-0493(1999)127<0103:rbtcia>2.0.co;2
Chen, H., and Zhang, D.-L. (2013). On the Rapid Intensification of Hurricane Wilma (2005). Part II: Convective Bursts and the Upper-Level Warm Core. J. Atmos. Sci. 70, 146–162. doi:10.1175/jas-d-12-062.1
Chen, J., Sun, H., Gao, A., Lin, Z., and Huang, M. (2014). Comparative Analysis of Intensity Changes between Super Typhoons Rammasun (1409) and Damrey (0518) during the Period of Entering the Beibu Gulf. Torrential Rain Disasters 33, 392–400. [in Chinese, with English abstract]. doi:10.3969/j.issn.1004-9045.2014.04.012
Chen, X., Wang, Y., and Zhao, K. (2015). Synoptic Flow Patterns and Large-Scale Characteristics Associated with Rapidly Intensifying Tropical Cyclones in the South China Sea. Mon. Weather Rev. 143, 64–87. doi:10.1175/mwr-d-13-00338.1
Chen, Y., Gao, S., Li, X., and Shen, X. (2021). Key Environmental Factors for Rapid Intensification of the South China Sea Tropical Cyclones. Front. Earth Sci. 8, 609727. doi:10.3389/feart.2020.609727
China Meteorological Administration (2012). Tropical Cyclone Operation and Service Criterion (Fourth Version). Beijing: China Meteorological Press, 92.
Emanuel, K. A. (1995). Sensitivity of Tropical Cyclones to Surface Exchange Coefficients and a Revised Steady-State Model Incorporating Eye Dynamics. J. Atmos. Sci. 52, 3969–3976. doi:10.1175/1520-0469(1995)052<3969:sotcts>2.0.co;2
Emanuel, K. A. (1997). Some Aspects of hurricane Inner-Core Dynamics and Energetics. J. Atmos. Sci. 54, 1014–1026. doi:10.1175/1520-0469(1997)054<1014:saohic>2.0.co;2
Emanuel, K. A. (1988). The Maximum Intensity of Hurricanes. J. Atmos. Sci. 45, 1143–1155. doi:10.1175/1520-0469(1988)045<1143:tmioh>2.0.co;2
Emanuel, K., DesAutels, C., Holloway, C., and Korty, R. (2004). Environmental Control of Tropical Cyclone Intensity. J. Atmos. Sci. 61, 843–858. doi:10.1175/1520-0469(2004)061<0843:ecotci>2.0.co;2
Fei, R., Xu, J., Wang, Y., and Yang, C. (2020). Factors Affecting the Weakening Rate of Tropical Cyclones over the Western North Pacific. Mon. Weather Rev. 148, 3693–3712. doi:10.1175/mwr-d-19-0356.1
Fu, B., Peng, M. S., Li, T., and Stevens, D. E. (2012). Developing versus Nondeveloping Disturbances for Tropical Cyclone Formation. Part II: Western North Pacific. Mon. Wea. Rev. 140, 1067–1080. doi:10.1175/2011mwr3618.1
Fudeyasu, H., Ito, K., and Miyamoto, Y. (2018). Characteristics of Tropical Cyclone Rapid Intensification over the Western North Pacific. J. Clim. 31, 8917–8930. doi:10.1175/jcli-d-17-0653.1
Gao, S., and Chiu, L. S. (2010). Surface Latent Heat Flux and Rainfall Associated with Rapidly Intensifying Tropical Cyclones over the Western North Pacific. Int. J. Remote Sensing 31, 4699–4710. doi:10.1080/01431161.2010.485149
Gao, S., Zhai, S., Chiu, L. S., and Xia, D. (2016). Satellite Air-Sea Enthalpy Flux and Intensity Change of Tropical Cyclones over the Western North Pacific. J. Atmos. Sci. 55, 425–444. doi:10.1175/jamc-d-15-0171.1
Guo, X., and Tan, Z.-M. (2017). Tropical Cyclone Fullness: A New Concept for Interpreting Storm Intensity. Geophys. Res. Lett. 44, 4324–4331. doi:10.1002/2017gl073680
Hendricks, E. A., Peng, M. S., Fu, B., and Li, T. (2010). Quantifying Environmental Control on Tropical Cyclone Intensity Change. Mon. Weather Rev. 138, 3243–3271. doi:10.1175/2010mwr3185.1
Holland, G. J. (1997). The Maximum Potential Intensity of Tropical Cyclones. J. Atmos. Sci. 54, 2519–2541. doi:10.1175/1520-0469(1997)054<2519:tmpiot>2.0.co;2
Hong, X., Chang, S. W., Raman, S., Shay, L. K., and Hodur, R. (2000). The Interaction between Hurricane Opal (1995) and a Warm Core Ring in the Gulf of Mexico. Mon. Wea. Rev. 128, 1347–1365. doi:10.1175/1520-0493(2000)128<1347:tibhoa>2.0.co;2
Hoshino, S., and Nakazawa, T. (2007). Estimation of Tropical Cyclone's Intensity Using TRMM/TMI Brightness Temperature Data. J. Meteorol. Soc. Jpn. 85, 437–454. doi:10.2151/jmsj.85.437
Hu, H., and Duan, Y. (2016). Analysis of Environmental Variables of Rapidly Intensifying Tropical Cyclones in the South China Sea. J. Trop. Meteorol. 32, 299–310. [in Chinese, with English abstract]. doi:10.16032/j.issn.1004-4965.2016.03.002
Huang, R., and Lei, X. (2010). Comparative Analysis of the Influence of Environment Field on Rapid Intensifying and Weakening of Tropical Cyclones over Offshore Waters of China. J. Trop. Meteorol. 26, 129–137. doi:10.3969/j.issn.1004-4965.2010.02.001 [in Chinese, with English abstract]
Huffman, G. J., Bolvin, D. T., Nelkin, E. J., Wolff, D. B., Adler, R. F., Gu, G., et al. (2007). The TRMM Multisatellite Precipitation Analysis (TMPA): Quasi-Global, Multiyear, Combined-Sensor Precipitation Estimates at fine Scales. J. Hydrol. 8, 38–55. doi:10.1175/jhm560.1
Kaplan, J., DeMaria, M., and Knaff, J. A. (2010). A Revised Tropical Cyclone Rapid Intensification index for the Atlantic and Eastern North Pacific Basins. Wea. Forecast. 25, 220–241. doi:10.1175/2009waf2222280.1
Kaplan, J., and Demaria, M. (2003). Large-scale Characteristics of Rapidly Intensifying Tropical Cyclones in the North Atlantic basin. Wea. Forecast. 18, 1093–1108. doi:10.1175/1520-0434(2003)018<1093:lcorit>2.0.co;2
Kurihara, Y., Bender, M. A., and Ross, R. J. (1993). An Initialization Scheme of hurricane Models by Vortex Specification. Mon. Wea. Rev. 121, 2030–2045. doi:10.1175/1520-0493(1993)121<2030:aisohm>2.0.co;2
Liang, J., Wu, L., and Gu, G. (2018). Rapid Weakening of Tropical Cyclones in Monsoon Gyres over the Tropical Western North Pacific. J. Clim. 31, 1015–1028. doi:10.1175/JCLI-D-16-0784.1
Liang, M., Zhong, X., Xu, J., and Xu, F. (2020). Sudden Changes in Tropical Cyclone Intensity in South China Sea from 1960 to 2017. J. Guangdong Ocean Uni. 40, 83–91. [in Chinese, with English abstract]. doi:10.3969/j.issn.1673-9159.2020.03.011
Lin, I.-I., Wu, C.-C., Pun, I.-F., and Ko, D.-S. (2008). Upper-Ocean Thermal Structure and the Western North Pacific Category 5 Typhoons. Part I: Ocean Features and the Category 5 Typhoons' Intensification. Mon. Wea. Rev. 136, 3288–3306. doi:10.1175/2008mwr2277.1
Liu, Q., Song, J., and Klotzbach, P. J. (2021). Trends in Western North Pacific Tropical Cyclone Intensity Change before Landfall. Front. Earth Sci. 9, 780353. doi:10.3389/feart.2021.780353
Lu, X., Yu, H., Yang, X., and Li, X. (2017). Estimating Tropical Cyclone Size in the Northwestern Pacific from Geostationary Satellite Infrared Images. Remote Sensing 9, 728. doi:10.3390/rs9070728
Mei, Y., and Yu, J. (2016). Effect of Environment Field on Rapid Intensification Process of Tropical Cyclones over the Western North Pacific. J. Atmos. Sci. 36, 770–778. [in Chinese, with English abstract]. doi:10.3969/2016jms.0006
Miyamoto, Y., Bryan, G. H., and Rotunno, R. (2017). An Analytical Model of Maximum Potential Intensity for Tropical Cyclones Incorporating the Effect of Ocean Mixing. Geophys. Res. Lett. 44, 5826–5835. doi:10.1002/2017gl073670
Peng, M. S., Jeng, B.-F., and Williams, R. T. (1999). A Numerical Study On Tropical Cyclone Intensification. Part I: Beta Effect And Mean Flow Effect. J. Atmos. Sci. 56, 1404–1423. doi:10.1175/1520-0469(1999)056<1404:ansotc>2.0.co;2
Shu, S., Ming, J., and Chi, P. (2012). Large-scale Characteristics and Probability of Rapidly Intensifying Tropical Cyclones in the Western North Pacific basin. Wea. Forecast. 27, 411–423. doi:10.1175/waf-d-11-00042.1
Song, K., Tao, L., and Gao, J. (2021). Rapid Weakening of Tropical Cyclones in Monsoon Gyres over the Western North Pacific: A Revisit. Front. Earth Sci. 9, 688613. doi:10.3389/feart.2021.688613
Su, H., Wu, L., Jiang, J. H., Pai, R., Liu, A., Zhai, A. J., et al. (2020). Applying Satellite Observations of Tropical Cyclone Internal Structures to Rapid Intensification Forecast with Machine Learning. Geophys. Res. Lett. 47. doi:10.1029/2020gl089102
Wada, A. (2015). Verification of Tropical Cyclone Heat Potential for Tropical Cyclone Intensity Forecasting in the Western North Pacific. J. Oceanogr. 71, 373–387. doi:10.1007/s10872-015-0298-0
Wang, H., and Wang, Y. (2014). A Numerical Study of Typhoon Megi (2010). Part I: Rapid Intensification. Mon. Wea. Rev. 142, 29–48. doi:10.1175/mwr-d-13-00070.1
Wang, Y., Li, Y. L., and Xu, J. (2021b). A New Time-dependent Theory of Tropical Cyclone Intensification. J. Atmos. Sci. 78, 3855–3865. doi:10.1075/jas-d-21-0169.110.1175/jas-d-21-0169.1
Wang, Y., Li, Y. L., Xu, J., Tan, Z. T., and Lin, Y. L. (2021a). The Intensity-Dependence of Tropical Cyclone Intensification Rate in a Simplified Energetically Based Dynamical System Model. J. Atmos. Sci. 78, 2033–2045. doi:10.1175/jas-d-20-0393.1
Wang, Y., Rao, Y., Tan, Z.-M., and Schönemann, D. (2015). A Statistical Analysis of the Effects of Vertical Wind Shear on Tropical Cyclone Intensity Change over the Western North Pacific. Mon. Weather Rev. 143, 3434–3453. doi:10.1175/mwr-d-15-0049.1
Wang, Y. (2002a). Vortex Rossby Waves in a Numerically Simulated Tropical Cyclone. Part I: Overall Structure, Potential Vorticity, and Kinetic Energy Budgets*. J. Atmos. Sci. 59, 1213–1238. doi:10.1175/1520-0469(2002)059<1213:vrwian>2.0.co;2
Wang, Y. (2002b). Vortex Rossby Waves in a Numerically Simulated Tropical Cyclone. Part II: The Role in Tropical Cyclone Structure and Intensity Changes*. J. Atmos. Sci. 59, 1239–1262. doi:10.1175/1520-0469(2002)059<1239:vrwian>2.0.co;2
Wang, Y., and Wu, C.-C. (2004). Current Understanding of Tropical Cyclone Structure and Intensity Changes ? a Review. Meteorol. Atmos. Phys. 87, 257–278. doi:10.1007/s00703-003-0055-6
Wu, C.-C., and Cheng, H.-J. (1999). An Observational Study of Environmental Influences on the Intensity Changes of Typhoons Flo (1990) and Gene (1990) Fluences on the Intensity Changes of Typhoons Flo (1990) and Gene (1990). Mon. Wea. Rev. 127, 3003–3031. doi:10.1175/1520-0493(1999)127<3003:aosoei>2.0.co;2
Xu, J., and Wang, Y. (2015). A Statistical Analysis on the Dependence of Tropical Cyclone Intensification Rate on the Storm Intensity and Size in the North Atlantic. Wea. Forecast. 30, 692–701. doi:10.1175/waf-d-14-00141.1
Xu, J., and Wang, Y. (2018). Dependence of Tropical Cyclone Intensification Rate on Sea Surface Temperature, Storm Intensity, and Size in the Western North Pacific. Wea. Forecast. 33, 523–537. doi:10.1175/waf-d-17-0095.1
Yan, J. (1996). Climatological Characteristics of Rapidly Intensifying Tropical Cyclones over the Offshore of China. J. Appl. Meteorol. Sci. 1, 28–35.
Yap, B. W., and Sim, C. H. (2011). Comparisons of Various Types of Normality Tests. J. Stat. Comput. Simulation 81, 2141–2155. doi:10.1080/00949655.2010.520163
Zhang, Z., Wang, Y., Zhang, W., and Xu, J. (2019). Coastal Ocean Response and its Feedback to Typhoon Hato (2017) over the South China Sea: A Numerical Study. J. Geophys. Res. Atmos. 124, 13731–13749. doi:10.1029/2019jd031377
Keywords: tropical cyclones, rapid intensification, marginal seas, relative contribution, internal factor
Citation: Li X, Zhan R, Wang Y and Xu J (2021) Factors Controlling Tropical Cyclone Intensification Over the Marginal Seas of China. Front. Earth Sci. 9:795186. doi: 10.3389/feart.2021.795186
Received: 14 October 2021; Accepted: 22 November 2021;
Published: 23 December 2021.
Edited by:
Kun Zhao, Nanjing University, ChinaReviewed by:
Si Gao, Sun Yat-sen University, ChinaCopyright © 2021 Li, Zhan, Wang and Xu. This is an open-access article distributed under the terms of the Creative Commons Attribution License (CC BY). The use, distribution or reproduction in other forums is permitted, provided the original author(s) and the copyright owner(s) are credited and that the original publication in this journal is cited, in accordance with accepted academic practice. No use, distribution or reproduction is permitted which does not comply with these terms.
*Correspondence: Ruifen Zhan, emhhbnJmQGZ1ZGFuLmVkdS5jbg==, b3JjaWQub3JnLzAwMDAtMDAwMS03MjA5LTA5MDQ=
Disclaimer: All claims expressed in this article are solely those of the authors and do not necessarily represent those of their affiliated organizations, or those of the publisher, the editors and the reviewers. Any product that may be evaluated in this article or claim that may be made by its manufacturer is not guaranteed or endorsed by the publisher.
Research integrity at Frontiers
Learn more about the work of our research integrity team to safeguard the quality of each article we publish.