 Liu Er-hu1
 Xu Jin-ze
94% of researchers rate our articles as excellent or good
Learn more about the work of our research integrity team to safeguard the quality of each article we publish.
Find out more
ORIGINAL RESEARCH article
Front. Earth Sci., 23 December 2021
Sec. Economic Geology
Volume 9 - 2021 | https://doi.org/10.3389/feart.2021.793293
This article is part of the Research TopicAdvancements of Phase Behavior and Fluid Transport in Petroleum ReservoirsView all 10 articles
The productivity equation of a gas well is, in the final analysis, an expression that describes the relationship between the production of a gas well and its bottom-hole flowing pressure. There are two kinds of productivity equations in common use at present: binomial productivity equation and exponential productivity equation. Combined with the modified isochronal well test, the test data are interpreted, and it is found that the open flow rates calculated by the two productivity equations are basically the same when the pressure difference at the test point is large, and the deviation of the exponential productivity equation is large when the pressure difference at the test point is small. Using binomial productivity equation and modifying isochronous well test, we established the single-point deliverability formula for the Jingbian sector of the Yan’an gas field. The field experience formula and production data are used to verify it. Their average errors are 2.59% and 7.12%, respectively; and the coincidence rate of productivity evaluation is 90%. The one-point productivity formula established has high precision and is suitable for productivity analysis of gas wells in paleozoic reservoirs in the Jingbian sector of the Yan’an gas field. This paper provides insights into the one-point productivity evaluation and its future application in the gas field.
The productivity of a gas well is mainly controlled by reservoir geological conditions (Li et al., 2001; Tang et al., 2004; Fu et al., 2021). During the development of gas field, it is of great significance to predict the productivity and analyze the performance dynamics, which is the basis of developing fields efficiently. During the development of gas field, productivity analysis is the most important method to predict the productivity, study the performance dynamics, and understand the characteristics of gas zones (Nowrouzi et al., 2020). The key gas production zone in the Jingbian sector of the Yan’an gas field is the Xiagumawu formation, which shows the features of low porosity, low permeability, and high heterogeneity. With the time being of production, wells with low productivity continue to appear (Yan et al., 2021), which leads to the slow recovery of shut-in pressure of gas wells; this further brings difficulty to the evaluation of single-well productivity. The one-point well test method only requires stable production and flowing pressure under one single-well constraint (Wakabayashi and McGouldrick, 2020), which is applied in China widely. The one-point method can significantly reduce the workload of well tests, reduce the burden of production, and provide theoretical evidence for the production allocation based on the gas productivity equations.
Based on the stable condition proposed by O’Dell and Mill (O’dell, 1967) in 1965, a simplified method to calculate the gas productivity was proposed. Until 1995, Xiong (Yu et al., 1996) introduced the concept of unstable seepage and proposed the modification on the gas well analysis. In 1987, Chen et al. (2017) presented a simple method to determine the absolute open flow of gas wells. In 1992, Chen (1990) further proposed a series of one-point productivity formulas based on 16 gas wells in China. In 2004, Qin and Li (Bin et al., 2005) studied the gas production dynamics and built the oil–gas two-phase flow model and distribution of reservoir parameters. At the same time, Tang et al. proposed the back-pressure isochronal well test methodology to better evaluate the productivity of low-permeability gas wells. In 2005, Huang et al. (2005) studied the reservoir stratigraphy and seepage characteristics and established the productivity calculation model for gas wells in dual porous media. In 2011, Zhang et al. (2011) applied Saphir well test software to perform the analysis for well test data in seven wells in the Chuanxi area and corrected the coefficients of the one-point empirical formula. In 2013, Zhong et al. (2013) employed reservoir simulation to derive the “one-point” productivity formula for the Sulige gas field and correct the coefficients. In 2015, Zhao et al. (2015a) utilized the well test data in the Daniudi gas field to perform the revision for coefficients in one-point formula and established models for different formations. In 2018, Liang et al. (2018) applied the one-point production method into low-perm and low-porosity gas wells in Donghai and shrunk the well test time.
The Jingbian sector of Yan’an field is located in the middle of the Yishan slope in Ordos Basin. The main oil formation is Mawu1+2. The reservoir exhibits the characteristics of low porosity, low permeability, and high heterogeneity with developed valleys. The development of grooves is closely related to the paleogeomorphology, paleocurrent, and paleokarst of carbonates. The phenomenon indicates a west-height and east-low trend in paleogeomorphology with toppling toward the southeast (Figure 1). The relative height difference is less than 70 m, and the average gradient of the slope is not greater than 0.001. The west is a coast during the sedimentation, and the surface water flows from the west to the east. The groove is mainly affected by the erosion of linear water and the gap of formations. As the main channel for the depletion of groundwater, the west of the groove is the water source, and the east is the water sink. It exhibits a “V” shape and follows the principle of erosion into the source. The direction of extension of the groove is in agreement with the direction of the paleocurrent. Many grooves are developed in the internal gas reservoirs, which exhibits the parallel distribution. The study area started production in December 2016. Until now, 300 gas wells have been in production, and the cumulative gas production is 3.65 billion cubic meters. With the continuation of production, some wells show the trend of low production and low efficiency (Figure 2), which leads to a slow recovery of pressure after shut-in. These bring many challenges to production evaluations.
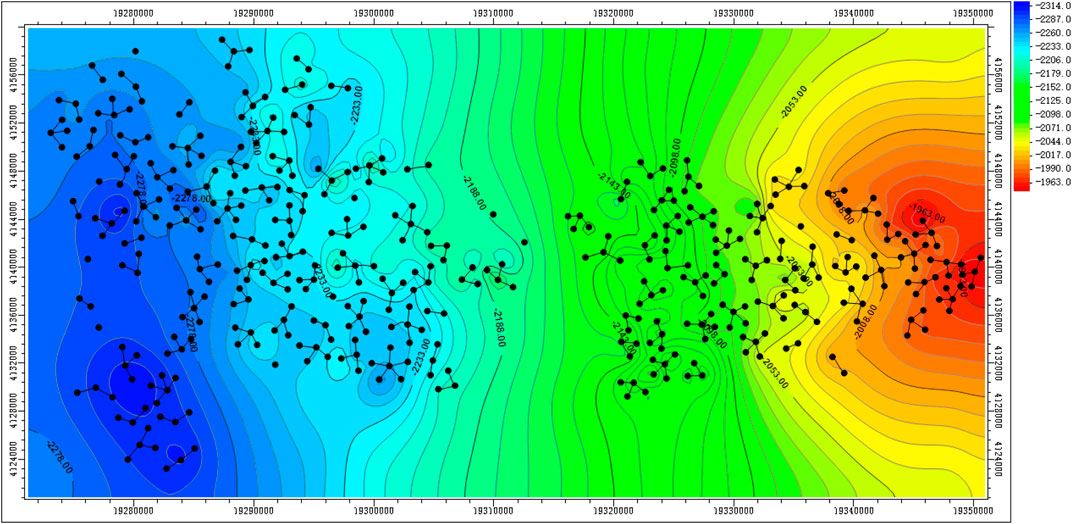
FIGURE 1. Tectonic map of the top surface of reservoir formation.
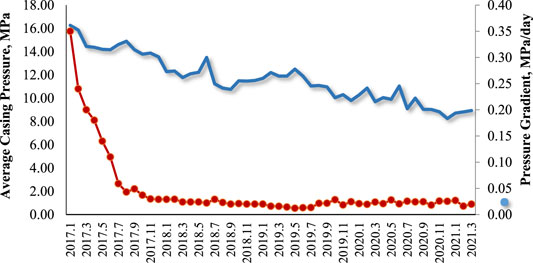
FIGURE 2. Pressure profile of gas wells in the Jingbian sector (blue, average casing pressure; red, pressure gradient).
The key objective of the one-point well test method is to apply the appropriate productivity equation (Sun et al., 2020) to provide the reference for evaluating early-stage gas well production, which further satisfies the management requirement of fields (Zhao et al., 2017). The key workflow in this study is to compare different one-point methods and summarize their advantages and disadvantages. After that, the most appropriate one-point method is selected, and its usability is validated. The key innovation of this study is to evaluate different one-point methodologies based on physics and mathematics, and their applications are also discussed in depth.
The binomial productivity model and the exponential productivity model are the most popular types to apply one-point methods into the evaluation of productivity. The binomial one-point productivity model is derived based on the flow equation, phase behavior equation, and mass balance equation under a certain boundary condition, which has higher accuracy and a wider application range. The exponential productivity model is dependent on an empirical formula for certain fields and formations, which has relatively low applicability.
The binomial productivity equation is based on the high-velocity Darcy’s flow around gas wells (Du et al., 2022). It assumes the laminar flow in pores far away from the wells. However, when the gas flows into the bottom of wells, the seepage velocity significantly increases with a smaller flow radius. In this case, the turbulent flow exists, and the non-Darcy equation is applied to describe the flow mechanism. In the practice of gas field, it is difficult to find the pure laminar flow, and the non-Darcy is essential to be applied into gas-well evaluation. In the following paragraphs, the binomial productivity models under steady, pseudo-steady, and non-steady states will be introduced and discussed. The main difference between stead and non-steady is whether the pressure and flow rate are time dependent. The choice of different states should be dependent on the field observation of the relationship between time, pressure, and flow rate.
Considering Darcy’s flow and non-Darcy’s flow (Al Rbeawi, 2020; Li and Chen, 2020), the one-point model is established based on mass balance equation and equation and state, and the boundary condition is defined as
Eq. 1 can be further simplified as follows:
where
In the formula above, the average properties of the gas are determined based on average pressure and temperature. In Eq. 2, the first item
The boundary condition is set up as
Eq. 3 can be further simplified as follows:
where
In Eq. 4,
The gas flow state is unsteady when the pressure wave does not arrive at the boundary during the early stage of production (Zhao et al., 2015b), which can be regarded as the seepage characteristics in infinite formation. The productivity equation is shown as follows:
Equation can be further simplified as follows:
where
In Eq. 6,
Based on the derivation above, it can be seen that the productivity of gas wells satisfies the binomial format under unstable, pseudo-state, and state states. However, the coefficients have different definitions.
An exponential productivity model is proposed based on the relationship between production and pressure difference, which is based on massive practice in the specified field as follows:
where
The exponent n shows the degree of non-Darcy flow. If n equals 1, it indicates the complete Darcy’s flow. If n equals 0.5, it is a complete turbulent flow.
The gas well of J53-1 is taken as an example for the application of the one-point method. Table 1 shows the well test data, and four well modes are applied to correct the isochronal well test, which are located at 30.3, 28.4, 26.4, and 24.0 MPa.

TABLE 1. Correction of isochronal well test data table of well J53-1.
Based on the data in Table 1, the exponential and binomial productivity equations can be obtained as follows:
Figure 3 shows the inflow performance relationship curves based on the models. In the range of well tests, the difference between binomial and exponential curves is small. Out of the range of well tests, there are some deviations between the two inflow performance relationship curves, but the difference is pretty small.
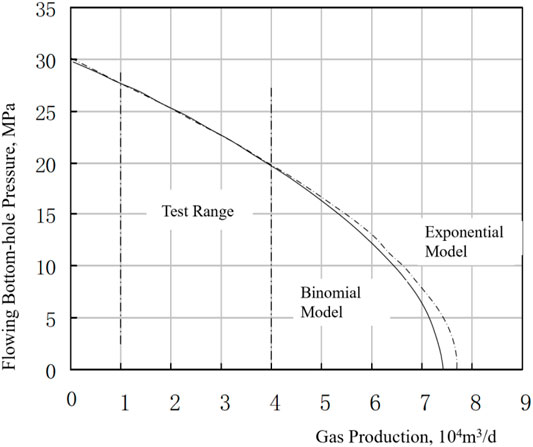
FIGURE 3. Comparison of inflow performance relationship curves produced by different productivity equations.
Based on the equations, the absolute open flow can be obtained as follows.
Based on Eqs 10, 11, it is shown that the absolute open flow rate is pretty similar based on exponential and binomial equations, and the relative difference is only 2.8%. The square pressure difference for J53-1 is 439.15 MPa2, which achieves 43% of the square pressure difference of the formation. The maximum production of 3.5041 × 10⁴ m3/day exceeds the half rate of absolute open flow. This indicates that if the pressure difference in different work modes is large, the difference of productivity between binomial and exponential models is small.
The gas well of J32-1 is taken as an example in this case. Table 2 shows the well test data, and four well modes are applied to correct the isochronal well test, which are located at 3.2, 5.3, 7.2, and 9.2 MPa. The square pressure difference for J53-1 is 114.65 MPa2, which is only 10% of the square pressure difference of the formation.
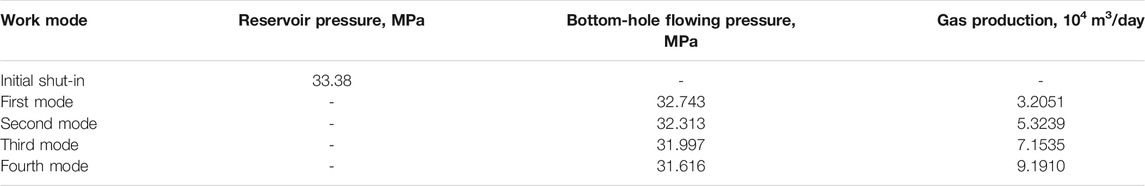
TABLE 2. Correction of isochronal well test data table of well Jing 32-1.
Based on Table 2, the binomial and exponential productivity equations are obtained as follows.
The absolute open flow is thus calculated as follows.
The equations above indicate that the relative difference of absolute open flow is 14.8%, which has a big difference. Figure 4 shows the difference of inflow performance relationship curves, which indicates that the difference is small within the well test range but big outside of the well test range. While using this chart in the field, the maximum value by the exponential model and the minimum model is able to generate a range to determine the bottom-hole pressure.
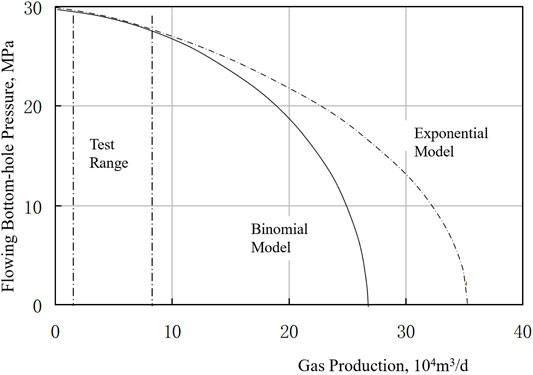
FIGURE 4. Comparison of inflow performance relationship curves produced by different productivity equations.
Based on the study, this paper establishes the one-point productivity model based on the binomial productivity equation, which has wider applicability for different states (steady, pseudo-steady, and non-steady). The production of gas wells in the Jingbian sector is under the pseudo-steady state. Thus, the proposed model is based on the pseudo-steady binomial productivity equation.
Eq. 4 can be further established to the one-point model to calculate the absolute open flow, as follows:
where α is the one-point coefficient
Four work modes are taken based on a corrected isochronal well test, and the time periods are as 4, 8, 12, 16, 20, and 24 h. Thus, the one-point characteristic parameters are obtained as Table 3.
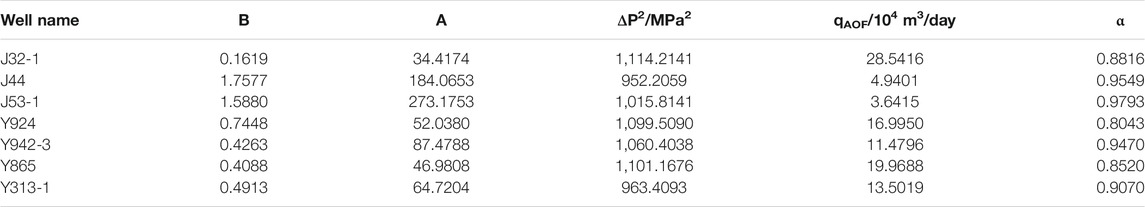
TABLE 3. Calculation result of productivity characteristic parameter of single-well and single-point deliverability formula.
The average value of α is obtained as 0.9037 from Table 3. Thus, the one-point productivity model in the Jingbian sector of the Yan’an gas field is as follows:
Regarding the established one-point productivity model, only a stable production and a related pressure are needed to obtain the absolute open flow.
Case study 1 is based on seven early-stage wells from the Jingbian sector as shown in Table 4. The established one-point model is compared with an empirical formula for the Xiagu formation in the Jingbian sector. The empirical formula to calculate the absolute open flow based on correlation is as follows (Shah et al., 2020):
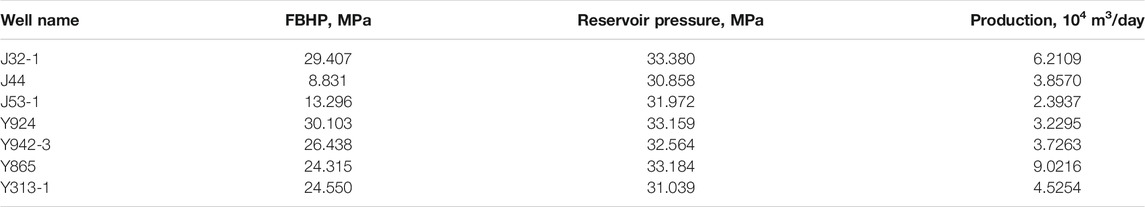
TABLE 4. Data of stability test point of paleozoic gas reservoir in Jingbian sector of Yan’an gas field.
Table 5 indicates that the average relative difference based on the one-point model is only 2.59%, which is much lower than the value of 7.58% from the empirical formula.
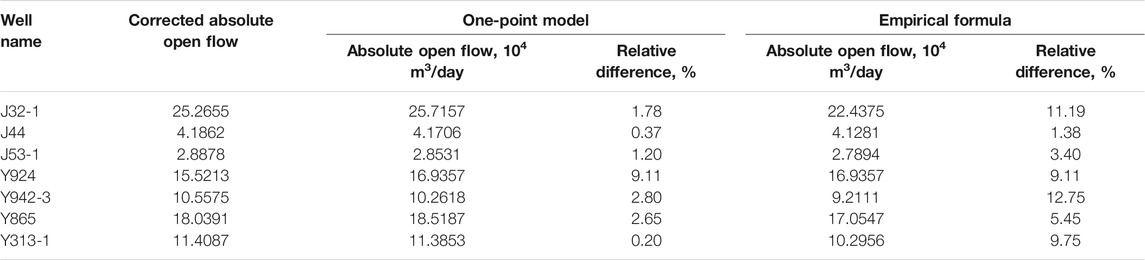
TABLE 5. Comparison of two single-point deliverability formulas.
More production data can be obtained after the gas wells are in production. In this case, 10 late-stage wells after pressure build-up test in the Xiagu formation are selected to perform the analysis as shown in Table 6.
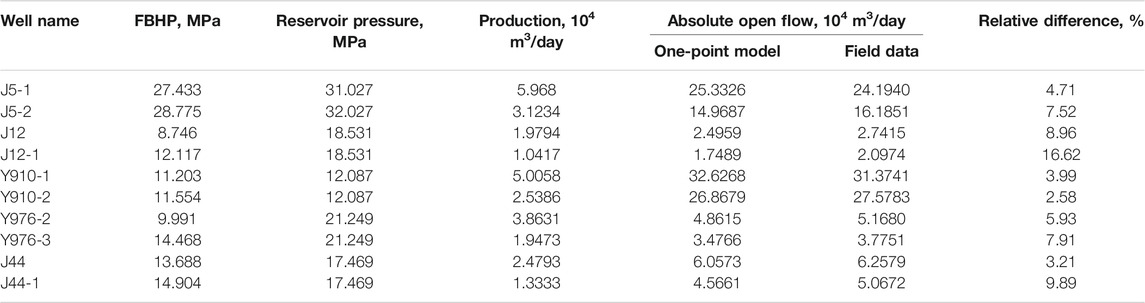
TABLE 6. Comparison of productivity calculated by production data and productivity calculated by single-point method.
Table 6 indicates that the average relative difference is about 7.12% for late-stage wells, considering the standard is that the relative difference is less than 10%. The rate of success to apply the one-point model in this case is 90%.
Overall, the one-point model has a high accuracy to evaluate the gas productivity in the Xiagu formation of the Jingbian sector. Eq. 17 can be a typical model to evaluate the gas production in the study area. The limitation of this model is not able to consider complex geological conditions such as shales or faults. It is suggested to combine with reservoir simulation if this model applies information of complex conditions.
This paper studies gas productivity based on the one-point model in the Jingbian sector. The following conclusions can be drawn:
1) When the pressure difference is big between different work modes, the absolute open flow from the binomial equation and that from the exponential equation are very similar. While the difference is small, a big relative difference will be observed between the two methods.
2) The one-point model is established based on a pseudo-steady binomial equation with the average characteristic coefficient of 0.9037 in the Jingbian sector. Compared with the empirical formula, the one-point model indicates a higher accuracy to match corrected absolute open flow. Besides, the one-point model also shows high accuracy for late-stage gas wells. The established model can be widely applied in the study area.
The original contributions presented in the study are included in the article/Supplementary Material. Further inquiries can be directed to the corresponding author.
LE-h, LY-y, and GL-j are responsible for the design of the model. ZD-s and LX are responsible for the writing of the manuscript. XJ-z is responsible for the improvement of the English language.
The authors would like to acknowledge the National Natural Science Foundation of China (No. 51804257, No. 52004220, No. 51934005, and No. 51874242) and Open Fund of State Key Laboratory of Oil and Gas Reservoir Geology and Exploitation (Chengdu University of Technology) (PLC20210316).
Authors LE-h, LY-y, and GL-j were employed by company Shanxi Yanchang Petroleum (Group) Co., Ltd.
The remaining authors declare that the research was conducted in the absence of any commercial or financial relationships that could be construed as a potential conflict of interest.
All claims expressed in this article are solely those of the authors and do not necessarily represent those of their affiliated organizations, or those of the publisher, the editors, and the reviewers. Any product that may be evaluated in this article, or claim that may be made by its manufacturer, is not guaranteed or endorsed by the publisher.
Al Rbeawi, S. (2020). Analysing and Characterising Horizontal Well Performance in Rectangular Closed Gas Reservoirs Considering Non-darcy Flow Conditions. Ijogct 24 (3), 345–376. doi:10.1504/ijogct.2020.10028649
Bin, Q., Li, X., and Cheng, S. (2005). Oil/gas Percolation Performance of Condensate Reservoirs under Effect of High Velocity Flow [J]. Nat. Gas Industry 2, 136–139+19. doi:10.3321/j.issn:1000-0976.2005.02.044
Chen, Y., Guo, E., Peng, Z., Wang, M., and Zhou, Y. (2017). Derivation of Productivity Formulas for Horizontal wells in Anisotropic Fault-Block Reservoirs. Acta Petrolei Sinica 38 (12), 1420. doi:10.7623/syxb201712009
Chen, Y. (1990). Standardization on the Curves of Permeability and Capillary Pressure. Exp. Pet. Geology. 12 (1), 64–70.
Du, X., Zhang, Y., Zhou, C., Su, Y., Li, Q., Li, P., et al. (2022). A Novel Method for Determining the Binomial Deliverability Equation of Fractured Caved Carbonate Reservoirs. J. Pet. Sci. Eng. 208, 109496. doi:10.1016/j.petrol.2021.109496
Fu, J., Su, Y., Li, L., Wang, W., Wang, C., and Li, D. (2021). Productivity Model with Mechanisms of Multiple Seepage in Tight Gas Reservoir. J. Pet. Sci. Eng., 109825. doi:10.1016/j.petrol.2021.109825
Huang, Q., Sun, L., Li, S., Yang, S., and Yang, H. (2005). Correct Prediction of Gas Well Productivity for Condensate Gas Reservoirs with Low Permeability. Nat. Gas Industry (11).
Li, J., and Chen, C. (2020). Numerical Simulation of the Non-darcy Flow Based on Random Fractal Micronetwork Model for Low Permeability sandstone Gas Reservoirs. Geofluids 2020, 1–9. doi:10.1155/2020/8884885
Li, X., Huang, B., and Hu, Y. (2001). The Establishment and Application of Binomial Deliverability Equation for Horizontal Gas Well. J. Can. Pet. Technology 42 (10). doi:10.2118/2001-081
Liang, B., Tan, X., Jiao, S., Peng, S., Zhang, L., and Duan., Y. (2018). "single-point"productivity Equation for Fractured Gas wells in Low-Porosity and Low-Permeability Reservoirs,east china Sea. Well Test. 27 (2), 73–78. doi:10.19680/j.cnki.1004-4388.2018.02.012
Nowrouzi, I., Mohammadi, A. H., and Manshad, A. K. (2020). Effect of a Synthesized Anionic Fluorinated Surfactant on Wettability Alteration for Chemical Treatment of Near-Wellbore Zone in Carbonate Gas Condensate Reservoirs. Pet. Sci. 17 (6), 1655–1668. doi:10.1007/s12182-020-00446-w
O'dell, H. G. (1967). Successfully Cycling a Low-Permeability, High-Yield Gas Condensate Reservoir. J. Pet. Technology 19 (01), 41–47.
Shah, M. S., Khan, M. H. R., Rahman, A., and Butt, S. (2020). Production Optimization in Well-6 of Habiganj Gas Field, Bangladesh: a Prospective Application of Nodal Analysis Approach. J. Petrol. Explor Prod. Technol. 10, 3557–3568. doi:10.1007/s13202-020-00908-2
Sun, H., Meng, G., and Cao, W. (2020). Applicable Conditions of the Binomial Pressure Method and Pressure-Squared Method for Gas Well Deliverability Evaluation. Tianranqi Gongye/Natural Gas Industry 40 (1), 69–75. doi:10.1016/j.ngib.2020.01.007
Tang, J., Ma, X., Jiao, C., and Fan, L. (2004). A New Testing Method of Gas Well Potential:backpressure Isochronal Test. Nat. Gas Geosci. 15 (5), 540–544.
Wakabayashi, D., and McGouldrick, M. (2020). Innovative High Efficiency Oil Burner Proves to Solve Many Environmental Challenges in Well Test Applications. OnePetro. In International Petroleum Technology Conference. doi:10.2523/iptc-19734-ms
Yan, H., Jia, A., Meng, F., Xia, Q., Xu, W., Feng, Q., et al. (2021). Comparative Study on the Reservoir Characteristics and Development Technologies of Two Typical Karst Weathering-Crust Carbonate Gas Reservoirs in China. Geofluids 2021, 1–19. doi:10.1155/2021/6631006
Ying, L., Wang, J., and Li, A. (2021). Effect of Non-darcy Seepage on Productivity of Tight Gas reservoirIOP Conference Series: Earth and Environmental Science. IOP Publishing 859 (No. 1), 012067. doi:10.1088/1755-1315/859/1/012067
Yu, X., Lei, S., Liangtian, S., and Shilun, L. (1996). A New Method for Predicting the Law of Unsteady Flow through Porous Medium on Gas Condensate Well. OnePetro. In SPE Gas Technology Symposium. doi:10.2118/35649-ms
Zhang, J., Mu, X., and Qiu, L. (2011). Correction for Well Testing Formula of "one point" Production Testing in Chuanxi Deep Layer. Well Test. 20 (5), 19–20.
Zhao, X., Jiang, B., Zhang, S., Liu, J., and Xu, Q. (2017). Main Controlling Factors of Productivity and Development Strategy of Cbm wells in Block 3 on the Eastern Margin of Ordos basin. Acta Petrol. Sinica 38 (11), 1310–1319. doi:10.7623/syxb201711010
Zhao, X., Rui, Z., Liao, X., and Zhang, R. (2015). A Simulation Method for Modified Isochronal Well Testing to Determine Shale Gas Well Productivity. J. Nat. Gas Sci. Eng. 27, 479–485. doi:10.1016/j.jngse.2015.08.035
Zhao, Z., Li, Z., Lai, F., and Wu, W. (2015). Study of Single-point Testing Time for Tight Gas of Fractured Horizontal wells. Well Test. 24 (1), 1–3.
Keywords: productivity equation, gas field, modified isochronal test, one-point deliverability formula, open flow
Citation: Er-hu L, Yang-yang L, Li-jun G, De-sheng Z, Xiong L and Jin-ze X (2021) On the One-Point Model for the Productivity Evaluation in Jingbian Sector of Yan’an Gas Field. Front. Earth Sci. 9:793293. doi: 10.3389/feart.2021.793293
Received: 11 October 2021; Accepted: 26 November 2021;
Published: 23 December 2021.
Edited by:
Jing Wang, China University of Petroleum, ChinaReviewed by:
Jinghong Hu, China University of Geosciences, ChinaCopyright © 2021 Er-hu, Yang-yang, Li-jun, De-sheng, Xiong and Jin-ze. This is an open-access article distributed under the terms of the Creative Commons Attribution License (CC BY). The use, distribution or reproduction in other forums is permitted, provided the original author(s) and the copyright owner(s) are credited and that the original publication in this journal is cited, in accordance with accepted academic practice. No use, distribution or reproduction is permitted which does not comply with these terms.
*Correspondence: Zhou De-sheng, ZHpob3VAeHN5dS5lZHUuY24=
Disclaimer: All claims expressed in this article are solely those of the authors and do not necessarily represent those of their affiliated organizations, or those of the publisher, the editors and the reviewers. Any product that may be evaluated in this article or claim that may be made by its manufacturer is not guaranteed or endorsed by the publisher.
Research integrity at Frontiers
Learn more about the work of our research integrity team to safeguard the quality of each article we publish.