 Qingying Cheng1
 Haoze Li
 Bingxiang Huang
 Zheng Sun
- 1Jiangsu Key Laboratory of Fire Safety in Urban Underground Space, China University of Mining and Technology, Xuzhou, China
- 2State Key Laboratory of Coal Resources and Safe Mining, China University of Mining and Technology, Xuzhou, China
A complex fracture network is composed of many similar structures. The migration law of proppant at each structure is the core and basic content of the migration law of proppant in complex fracture network, and there is little research. In this study, the EulerianEulerian method (TEM) is used to analyze the migration and distribution characteristics of solid–liquid two phases at the fracture corner according to different corner types of the fracture network. The results show that the migration characteristics of proppant in the corner area can be divided into the corner anomaly area, buffer area, and stability area; the influence of the turning angle on proppant migration is mainly concentrated at the corner and in the range of 4 times the fracture width after turning. The probability of sand plugging at the corner of the “Y → T” fracture is lower than that of “L → l”, higher than that of the “X → +” wing branch fracture, and lower than that of the main fracture. At the corner of the fracture network, after the solid flow turns, the proppant will form a high sand area on the side of the impact fracture surface, then rebound back to the fracture, form a sand-free area on the other side, and form a high-velocity core in the refraction interval. At the corner of the “L → l” fracture, there are one high sand area, one non-sand area, two low-velocity areas, and one high-velocity area; there are three low-velocity areas, two sand-free areas, and one high sand area at the corner of the “Y → T” fracture; at the corner of the “X → +” fracture, there is a high sand area and no sand-free area, and the flow velocity of the main fracture is much greater than that of the wing branch fracture.
Introduction
Coalbed methane is mainly composed of methane. Each unit of combustion produces less carbon dioxide than coal and oil. It does not produce ash and release toxic and harmful gases. It is a clean energy (Bustin and Clarkson, 1998; Song and Elsworth, 2018; Wang and Elsworth, 2018). The development of coalbed methane can reduce the content of coalbed methane and internal gas pressure; greatly reduce the probability of gas outburst, gas explosion, coal and gas outburst accidents; and effectively ensure the safe and efficient production of coal mines. Meanwhile, methane and carbon dioxide are the two main gases causing the greenhouse effect (Zachos et al., 2001; Parmesan and Yohe, 2003; Zachos et al., 2008), in which the impact of methane on the greenhouse effect is 20 times that of carbon dioxide (Mooney et al., 1987; Gorham, 1991), and the instability of methane in the air is much higher than that of carbon dioxide, which may produce greater side effects (Mooney et al., 1987). Moreover, in the process of coal seam mining, due to the low concentration of gas drainage, some mines directly discharge low-concentration gas into the air, aggravating the “greenhouse effect.” Therefore, the development and utilization of coalbed methane has a certain positive significance to alleviate the “greenhouse effect.” These advantages show that CBM has good development prospects and is expected to become an important part of the future energy structure.
In order to improve the exploitation efficiency of coalbed methane, hydraulic fracturing (Huang et al., 2011; Lv et al., 2012), CO2 phase change fracturing (Colmenares and Zoback, 2007; Xu et al., 2017), nitrogen fracturing (Cai et al., 2015; Qin et al., 2017), and other methods are often used to transform the coal seam, activate the internal bedding and cleat of the coal seam, and form a complex fracture network system penetrating each other. The key of fracturing technology is to form fractures with high conductivity (Li et al., 2021). However, under the action of closure stress, the coal seam fracture is easy to close. Therefore, in order to ensure that the fracture is open after the pumping stops and backflow, and increase the duration of effective fracture opening, proppant needs to be added to the fracture to support the fracture to maintain the fracture conductivity (Li et al., 2020). The migration and distribution of proppant is one of the core technologies to maintain fracture opening (Yan et al., 2016; Guo et al., 2017; Zheng et al., 2017; Wang et al., 2018).
In the project site, due to the formation of fracture network system after fracturing, the migration law of proppant is complex, and effective real-time observation means have not been developed. In order to observe the migration and distribution characteristics of proppant in fractures, the laboratory test and numerical simulation are often used. The laboratory test can observe the distribution characteristics of proppant in the fracture network after the test by tomography (3D XRM) (Liu and Sharma, 2005; Huang B. X. et al., 2019; Yatin et al., 2020) or establish a simple fracture network system through the transparent glass to observe the proppant migration process in the fracture (Bandara et al., 2020). However, the aforementioned two methods have some shortcomings. The former can only observe or simulate the final distribution characteristics of proppant in real fractures, while the latter has a simple fracture network, the fracture shape is non-actual fracture shape, the fracture surface is smooth or uniform roughness, and the reservoir filtration is not considered.
Numerical methods have been widely used because of their advantages of evolvable flow details that are difficult to obtain from experiments and revealing the internal flow mechanism of solid–liquid two phases (Blais et al., 2017; Peng et al., 2019). During proppant migration, there are multiple phases such as solid phase, liquid phase, and even gas, and there are multiple fields such as pore fracture field, stress field, seepage field, and temperature field. Numerical simulation often simplifies the actual situation. At present, the commonly used numerical simulation methods for proppant migration are divided into E-L (Eulerian–Lagrangian) method (Akhshik et al., 2015; Wang et al., 2019) and E-E (Eulerian–Eulerian) method (Xiong et al., 2021). The E-L method regards fluid as the continuous phase and solid particles as a discrete phase for modeling and calculation. Common model calculation methods mainly include discrete particle method (DPM) (Zhang et al., 2017) and the computational fluid dynamics discrete element method (CFD-DEM) (Patankar et al., 2000; Chen et al., 2012; Hu et al., 2021); The E-E method regards fluid and solid particles as continuous phases penetrating each other for simulation. The common model calculation method is a two-fluid model (TEM). Compared with the E-L method, the E-E method requires less calculation and has relatively low requirements for computer configuration. It allows the effective modeling of large-scale systems with a large number of particles, which is conducive to the application to the actual engineering scale. Therefore, the E-E method is widely used in the research field of proppant migration and distribution.
At present, the numerical research on the law of proppant migration and distribution mainly focuses on the flow law in non-permeable simple fractures, and the research on the law of proppant migration in complex fracture network is less. A complex fracture network is composed of many similar structures. The migration law of proppant at each structure is the core and basic content of the migration law of proppant in complex fracture network, and there is little research. The basic law of proppant migration and distribution at the corner of the fracture network has the positive significance for proppant selection and fluid attribute setting and provides theoretical guidance for safe and efficient exploitation of coalbed methane. Therefore, it is necessary to clarify the migration law of proppant at different fracture corners, so as to deeply analyze the migration and distribution characteristics of proppant in the fracture network. This study mainly focuses on the migration and distribution of proppant at the corner of the horizontal fracture network and uses the E-E method (TEM) to analyze the migration and distribution characteristics of proppant at the corner of the horizontal fracture network in the coal seam.
Fracturing Fracture Morphology of Coal Seam
According to a large number of coal fracturing tests, it shows that the main fracture and wing branch fracture are formed by fracturing in the coal seam. The expansion and extension of the main fracture and wing branch fracture are integrated with the bedding and cleat system in the coal seam to form a complex fracture network structure. According to the local characteristics of the fracture network structure, the fracture network structure can be divided into multiple simple structures, and its morphology is mainly divided into “L → l” (Zhao et al., 2019), “Y → T” (Chen et al., 2019; Cheng et al., 2020), and “X → +” (Ai et al., 2018; Tan et al., 2011, 2019). The fracturing fracture network morphology often presents three types of combined states (Figure 1).
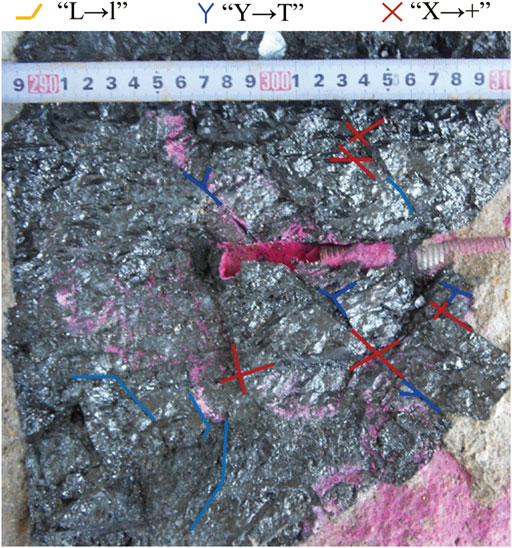
FIGURE 1. Fracture network.
Mathematical Model of Proppant Migration in Fracture
Geometric Model
Based on the contents of section 2, the fracture corner can be divided into three types: “L → l,” “Y → T,” and “X → +.” In order to facilitate the research, the angle of “L → l” type corner is divided into 0°, 30°, 45°, 60°, 90°, and 135°, and a total of eight measuring lines L1 ∼ L8 are set in the model for analysis; the angle of the “Y → T” type corner is divided into 30°, 45°, 60°, 90°, and 135°, and a total of twelve measuring lines L1 ∼ L12 are set in the model for analysis; the angle of “X → +” type corner is divided into 30°, 45°, 60°, and 90°, and a total of sixteen measuring lines L1 ∼ L16 are set in the model for analysis. The geometric models of “L → L,” “Y → T,” and “X → +” when the angle is 45° are shown in Figure 2.
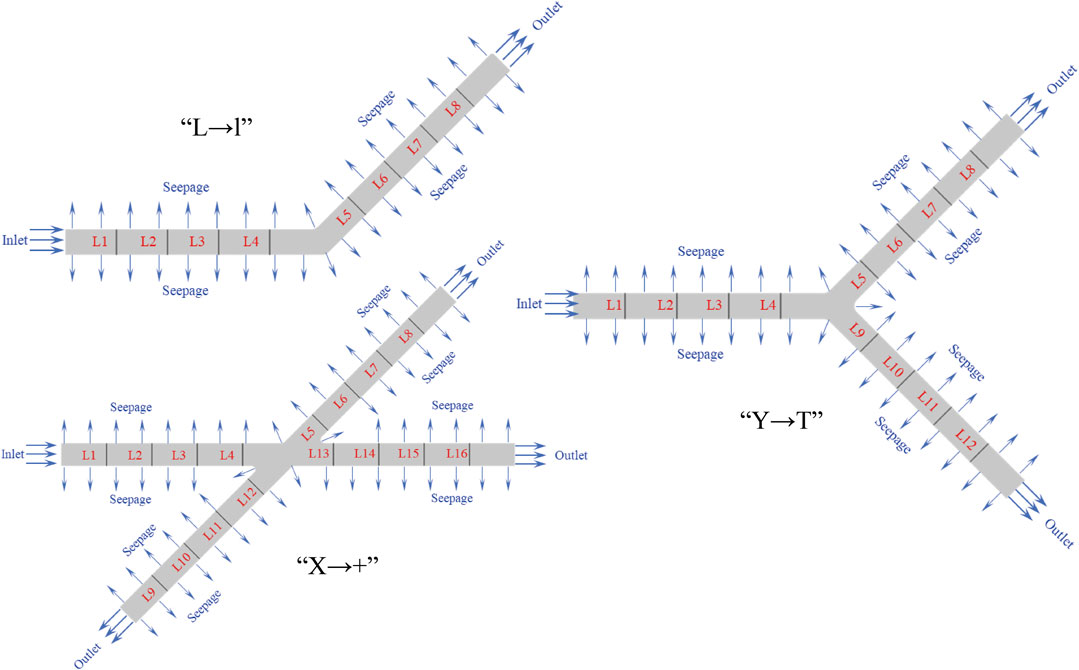
FIGURE 2. Geometric models of “L → L,” “Y → T,” and “X → +” when the angle is 45°.
Basic Assumptions
The E-E method is used to study the proppant migration and distribution characteristics in the water pressure fracture of the coal seam. The collision between solid particles is considered in the simulation process. In order to study this goal, the following assumptions are made for the model: 1) the proppant particle size in the fracture is uniform; 2) the mass transfer between the fracture surface and the solid fluid is ignored; 3) the influence of bubbles on proppant migration is not considered; 4) the material transfer between two-phase flow is zero; and 5) the skeleton is a rigid body without deformation.
Governing Equations
Mass Balance
Assuming that there is no mass transfer between two phases, the mass conservation equation can be expressed as follows (Zhang et al., 2020):
where
Momentum Balance
The momentum equation of liquid phase and dispersed phase is (Van Wachem et al., 2001) as follows:
where p is the mixing pressure, assuming that the two-phase pressures are equal, Pa; ρg is the solid density, kg/m3; ρy is the density of liquid phase, kg/m3; τg is the viscous stress tensor of solid phase, Pa; τy is the viscous stress tensor of liquid phase, Pa; ps is the solid pressure, Pa; g is the gravitational acceleration tensor, m/s2; Fm is the momentum transfer phase between phases, Fmy is the force tensor of other relative liquid phases, Fmg is the force tensor of other relative solid phases, N/m3; F is any other volume force tensor, N/m3; μy is the dynamic viscosity of the liquid, Pa·s; μg is the dynamic viscosity of the solid, Pa·s; and I is the unit tensor.
Dispersed Phase Viscosity
The dynamic viscosity of the two-phase mixture is not easy to obtain. Based on experience and analysis, the researchers obtained that the viscosity of the mixture is a function of the dispersion volume fraction, which can be expressed as follows (Enwald et al., 1996):
where
Phase to Phase Momentum Transfer
Considering the particles, droplets, or bubbles in the fluid flow, it is affected by multiple forces, such as resistance, added mass force, and lift. The most important force is resistance, especially in fluids containing highly concentrated dispersed solids. Therefore, the resistance in the momentum equation is expressed as follows (Ergun, 1952; Wen and Yu, 1966):
where β is the drag coefficient; Uslip is the slip velocity between phases, m/s; dg is the diameter of solid particles, m; and Cd is the drag coefficient of a single solid particle. Cd is a function of Reynolds number (Re), which is calculated by using the Schiller–Naumann relationship (Gidaspow, 1994):
Solid Pressure
Solid pressure simulates particle interaction due to collision and friction between particles. The solid pressure model adopts the basic assumption of gradient diffusion (Enwald et al., 1996):
Darcy’s Law
Considering the filtration of liquid phase on the fracture surface and not the filtration of solid phase, Darcy’s law is adopted to obtain the filtration rate of liquid phase as follows (Fan et al., 2019):
where u is the Darcy velocity tensor, m/s;
Initial Parameters and Solution Settings
The physical parameters required in the numerical simulation of sand-carrying fluid migration in fractures are shown in Table 1. The parameters in Table 1 are assigned to the control equation, and then iterative calculation is carried out. The calculation process lasts for 600 ms.
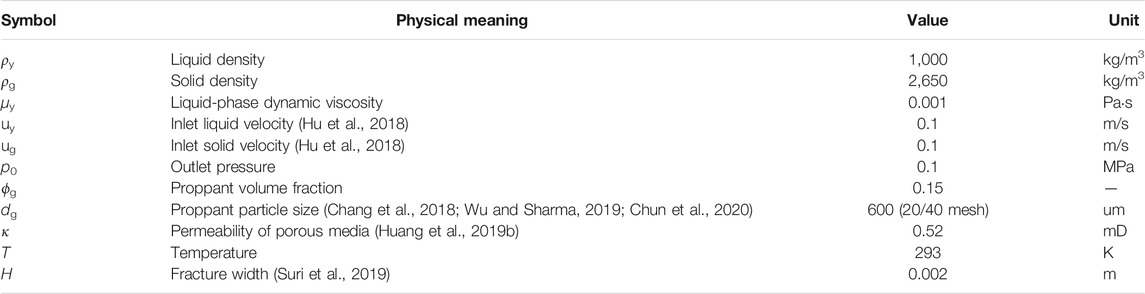
TABLE 1. Model parameter setting.
Results and Analysis
This section will analyze the migration law and distribution characteristics of solid–liquid two phases at the fracture corner from three aspects: proppant volume fraction distribution characteristics, proppant velocity distribution characteristics, and liquid-phase velocity distribution characteristics at the fracture corner.
Proppant Migration Characteristics at the Corner of “L → l” Fracture
The distribution characteristics of proppant volume fraction of proppant migration at the corner of “L → l” fracture are summarized in Figure 3. As shown in Figure 3A, when the rotation angle is 0°, the proppant gradually migrates to the fracture depth. In the front section of proppant migration, the middle volume fraction is high, and the volume fraction on both sides is low and is symmetrically distributed along the centerline. When the rotation angle is 30°, the proppant will hit the right fracture surface when it reaches the rotation angle, resulting in the decrease in proppant migration speed. With the passage of time, a high–volume fraction proppant distribution area will be formed at the corner. At 400 ms, the high–volume fraction area tends to be stable, and the proppant will refract and migrate forward after hitting the right fracture surface. At 400 ms, the high–volume fraction region tends to be stable, the proppant refracts and moves forward after hitting the right fracture surface, and a proppant void is formed in the left fracture surface region between incident and refraction, and the volume fraction of proppant in this void is close to 0. With the passage of time, the migration of proppant gradually changed into the form of high/middle volume fraction and symmetrical low volume fraction along the midline (400 ms). When the angle is 45°, the proppant strikes the lower surface of the fracture, part of the proppant flows back to the inlet direction, forming a larger high–volume fraction region at the corner of the lower surface of the fracture, and the width of the high–volume fraction region of the proppant moving forward increases. When the rotation angle is 60°, the backflow of proppant is more significant, and the area of high–volume fraction proppant at the rotation angle increases, but the width of high–volume fraction proppant moving forward decreases, and the proppant empty area increases compared with 45°. When the rotation angle is 90°, a triangular-like high–volume fraction region is formed at the rotation angle, the width of the high–volume fraction region of proppant moving forward is further reduced, and the range of proppant void is further increased. When the rotation angle is 135°, the proppant migration produces new changes. First, the proppant migrates to the fracture and migrates directly perpendicular to the fracture surface, forming a high-volume integral sand area at the fracture surface. Then the proppant flows back along the wall and converges with the proppant migrating forward to form a high–volume fraction proppant with the same fracture width. As the proppant dose moving forward decreases, the time required for proppant migration to change to the original form increases (500 ms). At the same time, the flow area of the liquid phase at the corner is compressed. The high–volume fraction proppant at the 135° corner is very easy to cause fracture plugging.
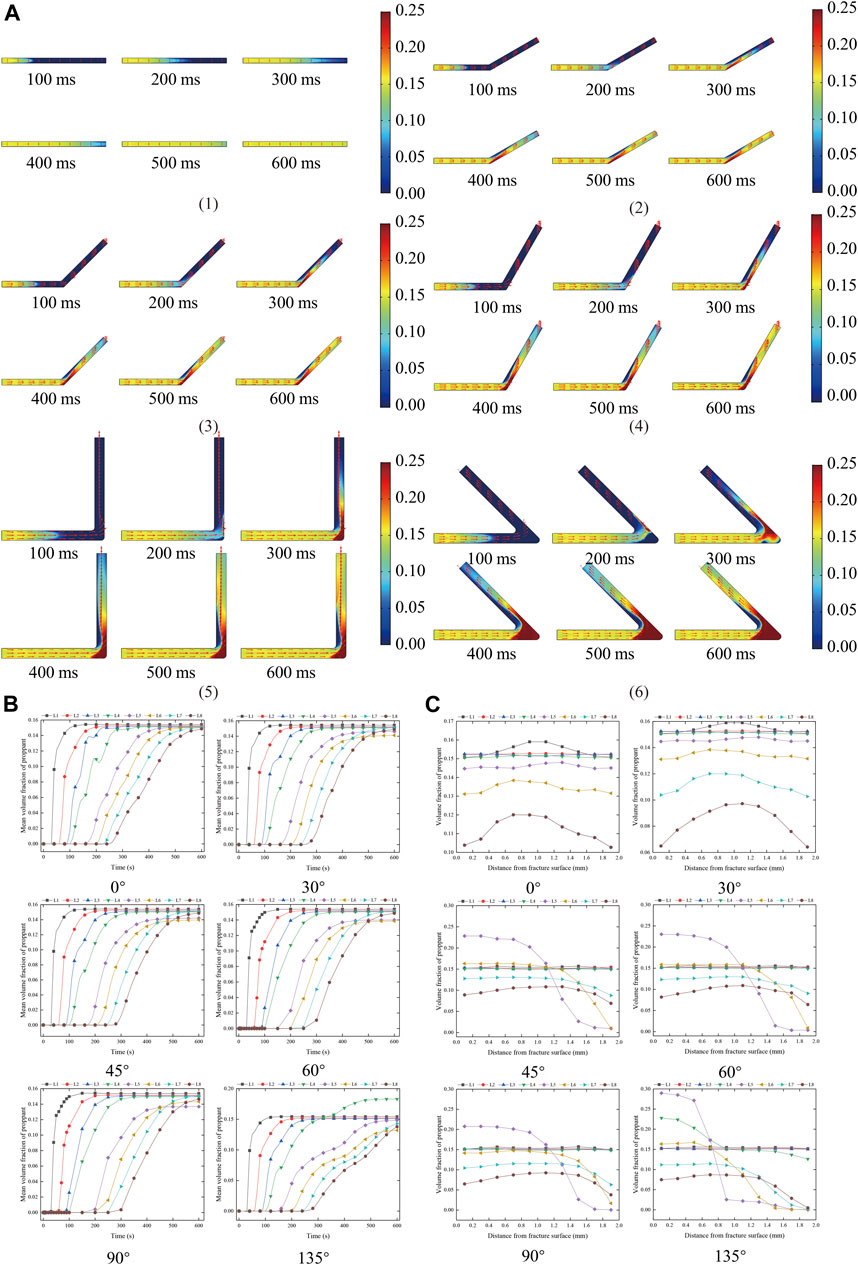
FIGURE 3. Distribution characteristics of proppant volume fraction at the corner of “L → l.” (A) Distribution characteristics of proppant volume fraction at the corner of “L → l” fracture. (1) 0°, (2)30°, (3) 45°, (4) 60°, (5) 90°, (6) 135°. (B) The distribution of mean proppant volume fraction of each measuring line at different times at the corner of “L → l.” (C) Distribution of proppant volume fraction of each measuring line at the corner of “L → l” at 400 ms.
The mean proppant volume fraction of each measuring line at different times of the “L → l” fracture corner is summarized in Figure 3B. As shown in Figure 3B, in the proppant volume fraction stabilization stage, with the increase in the corner angle, the average proppant volume fraction not reaching the corner is close to the initial proppant volume fraction. When the angle of rotation is not greater than 90°, the mean value of the proppant volume fraction after turning for a certain distance (L7 and L8) is close to the initial proppant volume fraction, while the mean value of proppant volume fraction at the fracture corner and the area just passing through the fracture corner changes greatly. When the rotation angle is not greater than 60°, the mean proppant volume fraction of L5 and L6 gradually decreases by about 6%, and the mean proppant volume fraction of L5 is greater than L6; when the angle is 90°, the mean volume fraction of L6 is greater than L5; when the rotation angle is 135°, the average proppant volume fraction of L4 increases by about 20%, the average proppant volume fraction of L5 is close to the initial volume fraction, and the average proppant volume fraction of L6 decreases by about 10%. This is due to the backflow of proppant in the corner area, which increases the volume fraction at the corner inlet, and the backflow reduces the total amount of proppant moving forward.
The distribution of proppant volume fraction of each measuring line at 400 ms for “L → l” fracture is summarized in Figure 3C. As shown in Figure 3C, when the proppant moves through the corner, the proppant volume fraction near the right fracture surface increases, and the proppant volume fraction on the left fracture surface decreases. With the increase in migration distance, the proppant volume fraction near the right fracture surface gradually decreases, the proppant volume fraction near the left fracture surface gradually increases, and the proppant volume fraction of L5 and L6 survey lines is close to 0, indicating that this area is in the proppant empty area.
The distribution characteristics of proppant velocity at the corner of “L → l” are summarized in Figure 4. As shown in Figure 4A, with the passage of time, the average proppant migration velocity of L1 ∼ L4 survey lines shows rapid increase → slow decrease → tend to be stable. The farther away from the entrance, the longer the proppant migration velocity reaches the peak; the average proppant migration velocity of L5 and L6 survey lines is gradually increase → gradually decrease → slowly increase → tend to be stable. In the stable stage, the proppant migration velocity of L6 survey line is greater than that of the inlet section, and that of L5 survey line is less than that of the inlet section; the average proppant migration velocity of L7 and L8 survey lines is as follows: rapid increase → slow increase → rapid increase → slow decrease → tend to be stable. The peak time of L7 and L8 survey lines is slightly later than the trough time of L5 and L6 survey lines. With the increase in the angle of rotation angle, the trough points of the average proppant migration velocity of L5 and L6 measuring lines gradually decrease. It can be seen from Figure 4B that the velocity distribution of proppant in the fracture is “slow at both ends and fast in the middle.” At 400 ms, when the angle is not greater than 90°, the peak point of proppant migration velocity shifts to the right fracture surface with the increase in the angle. When the angle is greater than 90°, the peak value of proppant migration velocity before turning shifts to the left fracture surface, the peak value of proppant migration velocity after steering shifts to the right fracture surface, and the migration area increases.
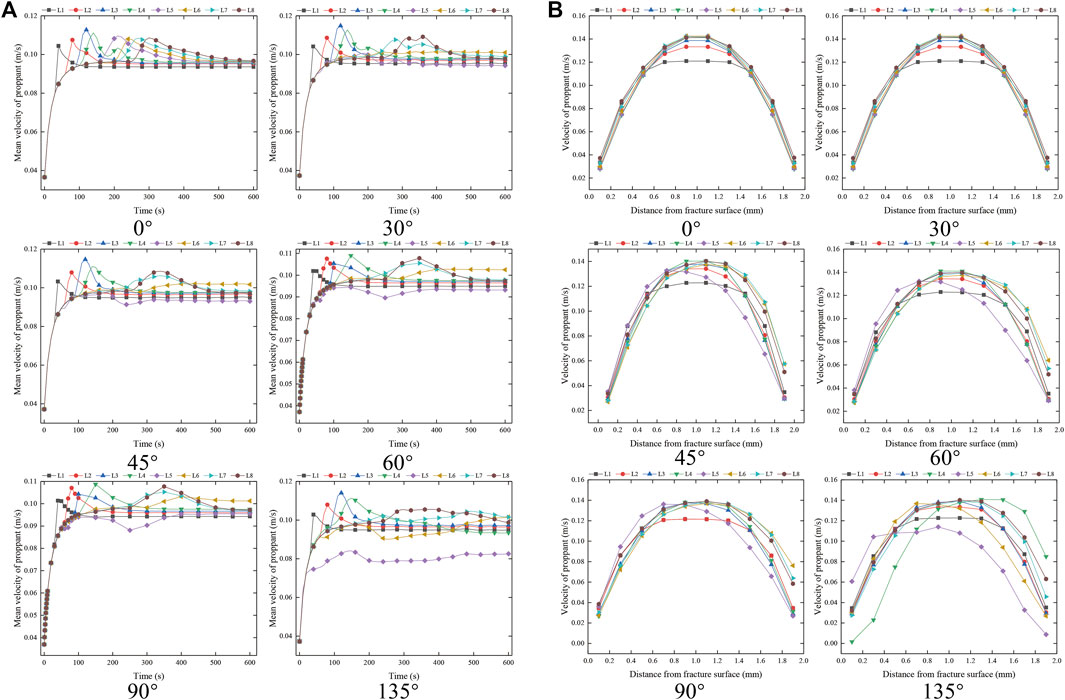
FIGURE 4. Proppant velocity distribution characteristics at the corner of “L → l.” (A) Distribution of mean proppant velocity of each measuring line at different times at the corner of “L → l.” (B) Proppant velocity distribution of each measuring line at the corner of “L → l” at 400 ms.
The distribution characteristics of liquid-phase velocity at the corner of “L → l” fracture are summarized in Figure 5. As shown in Figure 5A, when the liquid phase migrates to the corner, the migration space is compressed, a high-speed fluid is formed in the central area, and a low-speed area appears on both sides. With the increase in the rotation angle, the low-speed region of the liquid phase gradually increases, and the low-speed region of the right fracture region is greater than that of the left fracture region. According to Figure 5B and Figure 5C, when the rotation angle is not greater than 90°, the liquid-phase mean velocity remains stable and the manifold is stable. The velocity shifts to the right fracture surface in a short area after passing the rotation angle and then remains stable again; when the turning angle is greater than 135°, the mean velocity of the liquid phase increases gradually at the turning angle, the velocity peak before turning is close to the left fracture surface, and the velocity peak after turning is also offset to the left fracture surface. This shows that the turning area near the right fracture surface is mainly the proppant distribution area, and the liquid-phase volume velocity is close to 0. The increase in the proppant area will increase the probability of fracture plugging.
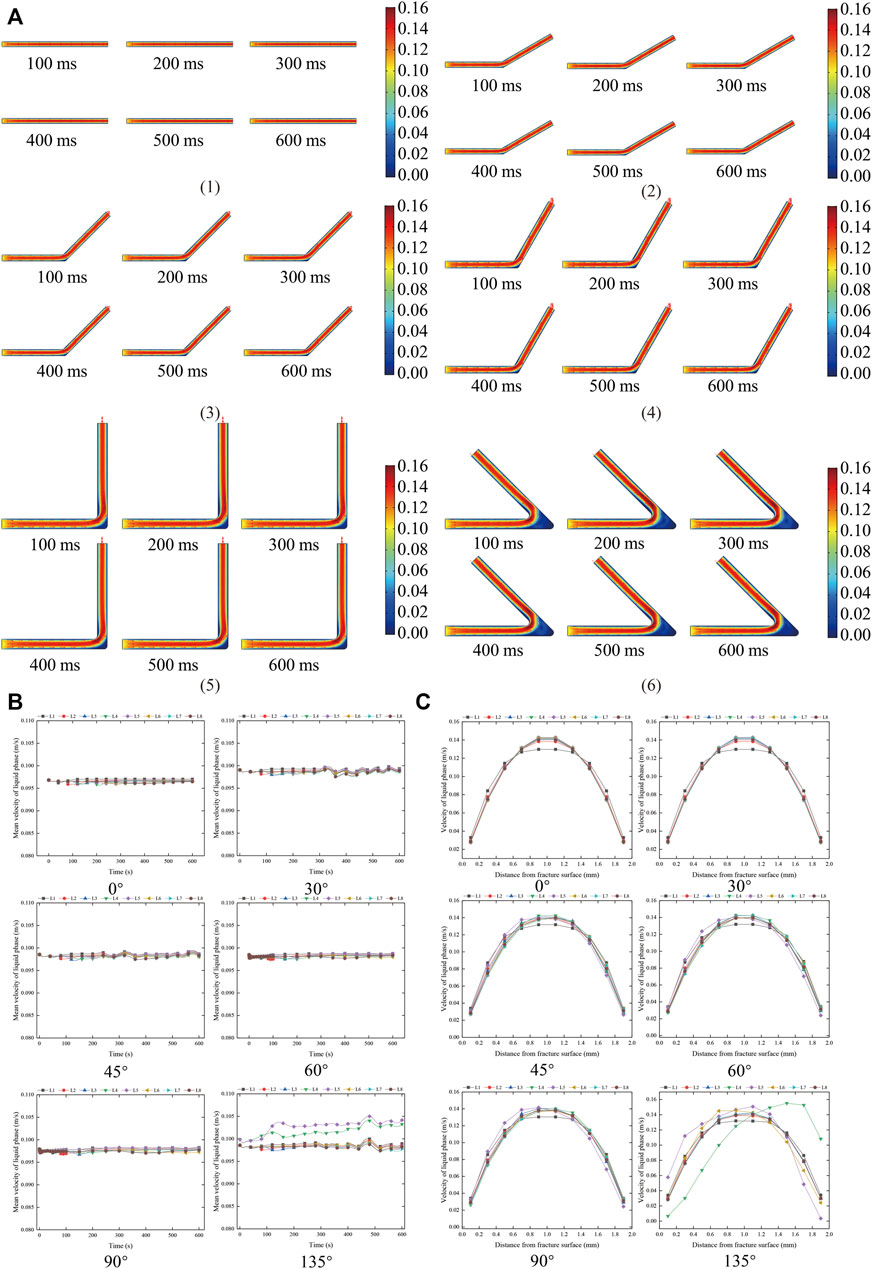
FIGURE 5. Distribution characteristics of liquid-phase velocity at the corner of “L → l.” (A) The characteristics of liquid-phase velocity distribution at the corner of “L → l.” (1) 0°, (2)30°, (3) 45°, (4) 60°, (5) 90°, (6) 135°. (B) Distribution of mean liquid-phase velocity of each survey line at different times at the corner of “L → l.” (C) Liquid-phase velocity distribution of each measuring line at the corner of “L → l” at 400 ms.
To sum up, at the corner of “L → l,” the proppant empty area will be formed on the left fracture surface, and the proppant area with high volume fraction will be formed on the right fracture surface. The migration speed of the continuous phase in the two areas is low, and the velocity in the center of the continuous phase between the two areas is fast. With the increase in the angle of the corner, the volume fraction of proppant on the right side of the fracture corner gradually increases, the proppant return flow gradually increases, the high–volume fraction proppant area at the corner gradually increases, and the width of the high–volume fraction proppant area moving forward reaches the maximum when the corner is 45°. When the angle is greater than 90°, the width of the area with high volume fraction at the angle is similar to the fracture width, which is easy to cause fracture blockage. A sand-free area with volume fraction close to “0” is formed on the left side of the fracture. The area width and area gradually increase with the increase in the angle. With the passage of time, the proppant migration velocity before steering is as follows, rapid increase → slow decrease → tend to be stable; corner, gradually increase → gradually decrease → slowly increase → tend to be stable; after steering, rapidly increase → slowly increase → rapidly increase → slowly decrease → tend to be stable.
Proppant Migration Characteristics at the Corner of “Y → T” Fracture
The distribution characteristics of proppant volume fraction at the corner of “Y → T” fracture are summarized in Figure 6. As shown in Figure 6, since the fracture is in the “Y → T” shape, at the fracture corner, the two-phase fluid will impact the corner position, and the proppant volume fraction at the corner increases. With the increase in the corner angle, the high–volume fraction area of proppant at the corner increases. When the proppant enters the turned fracture, it first migrates forward along the right fracture, and then gradually fills the whole fracture width. Two sand-free areas are formed in the corner area. With the increase in the corner angle, the sand-free area gradually increases. Because the shape is symmetrical up and down, the volume fraction of proppant flowing to the two wing branch fractures is equal. After turning, after a certain distance (L6 and L9 in Figure 6B,C), the dispersed phase manifold gradually becomes regionally stable, forming a fluid approximately symmetrical along the midline. When the angle is greater than 90°, the high–volume fraction area of proppant at the corner is obviously smaller than the “L → l" fracture, which is not easy to cause fracture blockage. It is easy to know from Figure 6B,C that with the passage of time, the farther away from the inlet, the slower the average increase rate of proppant volume fraction and the longer the time required to stabilize. After turning, the proppant volume fraction near the right fracture surface is high, gradually decreases along the direction perpendicular to the fracture surface, and the proppant volume fraction on the left fracture surface is close to 0.
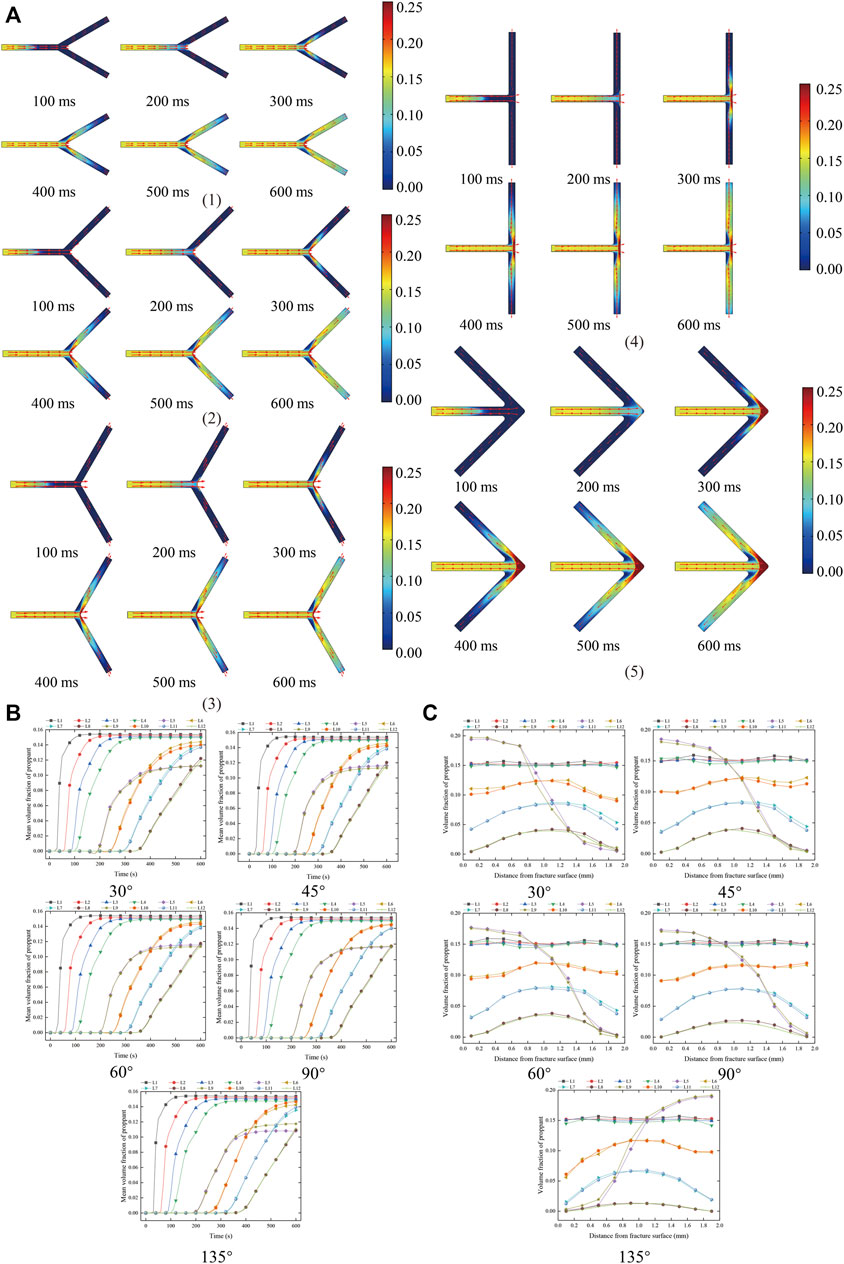
FIGURE 6. Distribution characteristics of proppant volume fraction at the corner of “Y → T.” (A) Distribution characteristics of proppant volume fraction at the corner of “Y → T” fracture. (1) 30°, (2) 45°, (3) 60°, (4) 90°, (5) 135°. (B) The distribution of mean proppant volume fraction of each measuring line at different times at the corner of “Y → T.” (C) Distribution of proppant volume fraction of each measuring line at the corner of “Y → T” at 400 ms.
The distribution characteristics of proppant velocity at the corner of “Y → T” fracture are summarized in Figure 7. As shown in Figure 7, the proppant migration velocity in the wing branch fracture is lower than that in the main fracture, and the proppant migration velocity of each wing branch fracture accounts for about 1/2 of the main fracture. The distribution characteristics of proppant migration velocity in the main fracture are similar to those of the “L → l” fracture. The migration law in the wing branch fracture is rapid increase → slow increase → tend to be stable. After turning, the peak position of proppant migration velocity tends to the right fracture, which is more obvious than the “L → l” fracture.
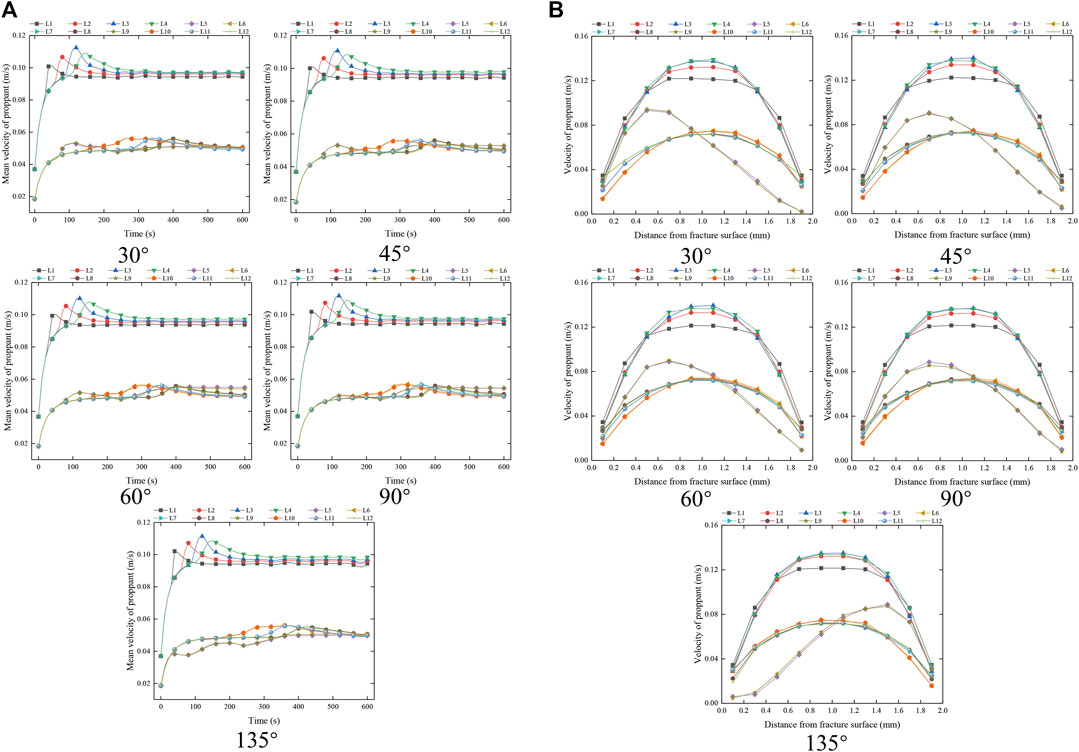
FIGURE 7. Proppant velocity distribution characteristics at the corner of “Y → T.” (A) Distribution of mean proppant velocity of each measuring line at different times at the corner of “Y → T.” (B) Proppant velocity distribution of each measuring line at the corner of “Y → T” at 400 ms.
The distribution characteristics of liquid-phase velocity at the corner of “Y → T” fracture are summarized in Figure 8. As shown in Figure 8, when the steering angle is not greater than 90°, the liquid-phase manifold basically remains unchanged with the passage of time, and the flow velocity in the wing branch fracture is 1/2 of the main fracture. After turning, the tendency of the peak value of liquid migration velocity to the right fracture is more obvious than that of “L → l” fracture, and the peak velocity is about 1.2 times that of the other survey lines of the wing branch fracture. With the increase in the fracture angle, the fluid forms two small low-velocity regions on the left side of the wing branch fracture and a large low-velocity region on the right side of the fracture. When the steering angle is greater than 90°, the velocity of the liquid phase just entering the secondary fracture is slightly higher after steering.
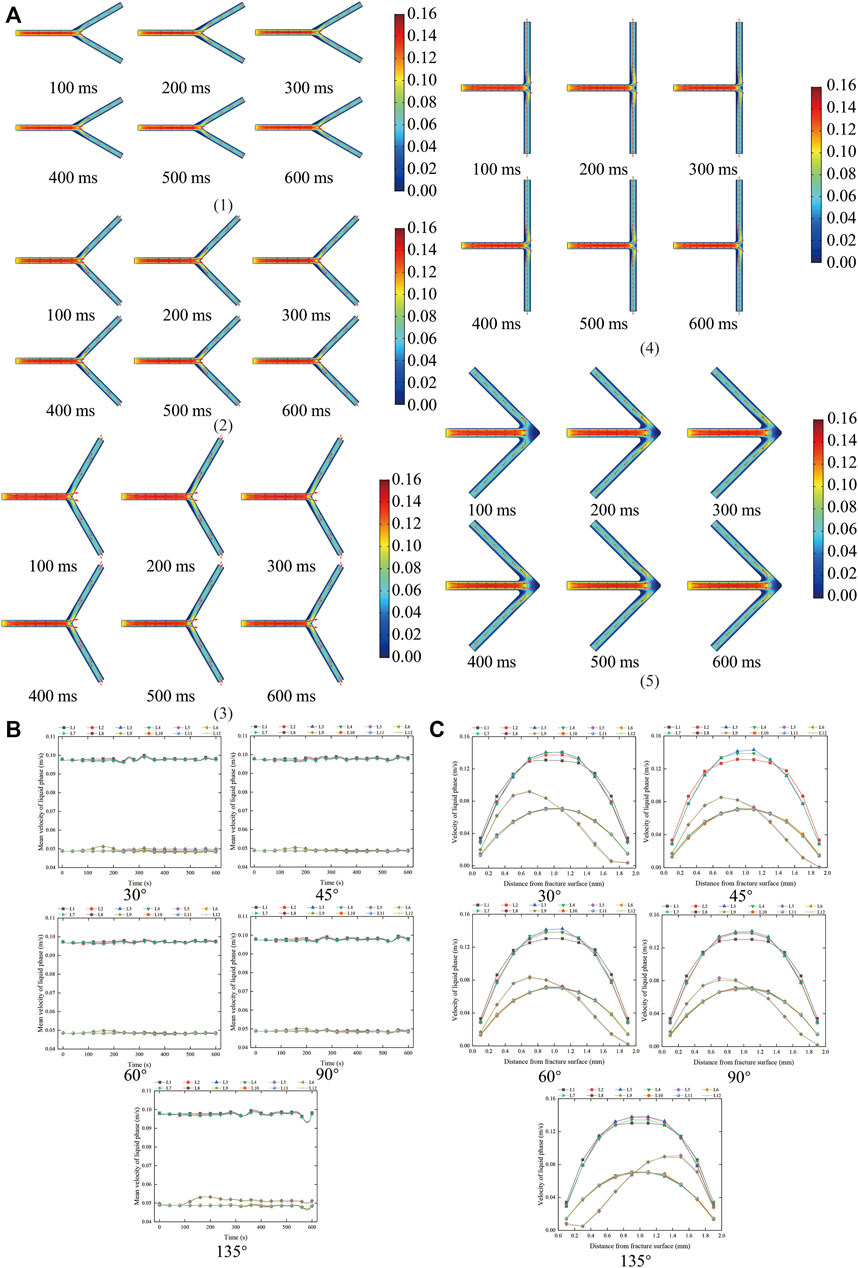
FIGURE 8. Distribution characteristics of liquid-phase velocity at the corner of “Y → T.” (A) The characteristics of liquid-phase velocity distribution at the corner of “Y → T.” (1) 30°, (2) 45°, (3) 60°, (4) 90°, (5) 135°. (B) Distribution of mean liquid-phase velocity of each survey line at different times at the corner of “Y → T.” (C) Liquid-phase velocity distribution of each measuring line at the corner of “Y → T” at 400 ms.
To sum up, the migration law of proppant in the “Y → T” fracture is that the migration velocity of proppant and continuous phase in the wing branch fracture is reduced by 1/2 of the main fracture, and three low-velocity regions, two sand-free regions, and a large high-volume-fraction region are formed at the corner. Due to the increase in secondary fractures, sand plugging will be less than “L → l.”
Proppant Migration Characteristics at the Corner of “X → +” Fracture
The distribution characteristics of proppant volume fraction at the corner of “X → +” fracture are summarized in Figure 9. As shown in Figure 9, when proppant migrates from the main fracture (1# fracture) to the corner of “X → +” fracture, it will first deflect to the secondary fracture (3# fracture) at an obtuse angle with the migration direction and then migrate to the main fracture (4# fracture). When passing through the intersection, the proppant dose entering the main fracture (4# fracture) > the proppant dose at an acute angle with the proppant migration direction (2# fracture) > the proppant dose at an obtuse angle with the migration direction (3# fracture). With the increase in the angle, the difference between the proppant integral number of 2# fracture and 3# fracture becomes smaller and smaller. When just passing through the intersection, the volume fraction of proppant in 4# fracture increases to form a high concentration support and area. With the passage of time, the volume fraction of proppant in 4# fracture is greater than that in 1# fracture. This is because the volume fraction of proppant in 4# fracture flows to 2#, 3# fracture is greater than that of proppant, resulting in an increase of 20% in the volume fraction of proppant in 4# fracture, which is easier to block the fracture. The form of proppant entering the secondary fracture is similar to that of “L → l” fracture. The total amount of proppant in the fracture is 4# fracture >1# fracture >2# fracture >3# fracture. The time required for proppant volume fraction to reach the stable stage is 3# fracture >2# fracture >4# fracture >1# fracture.
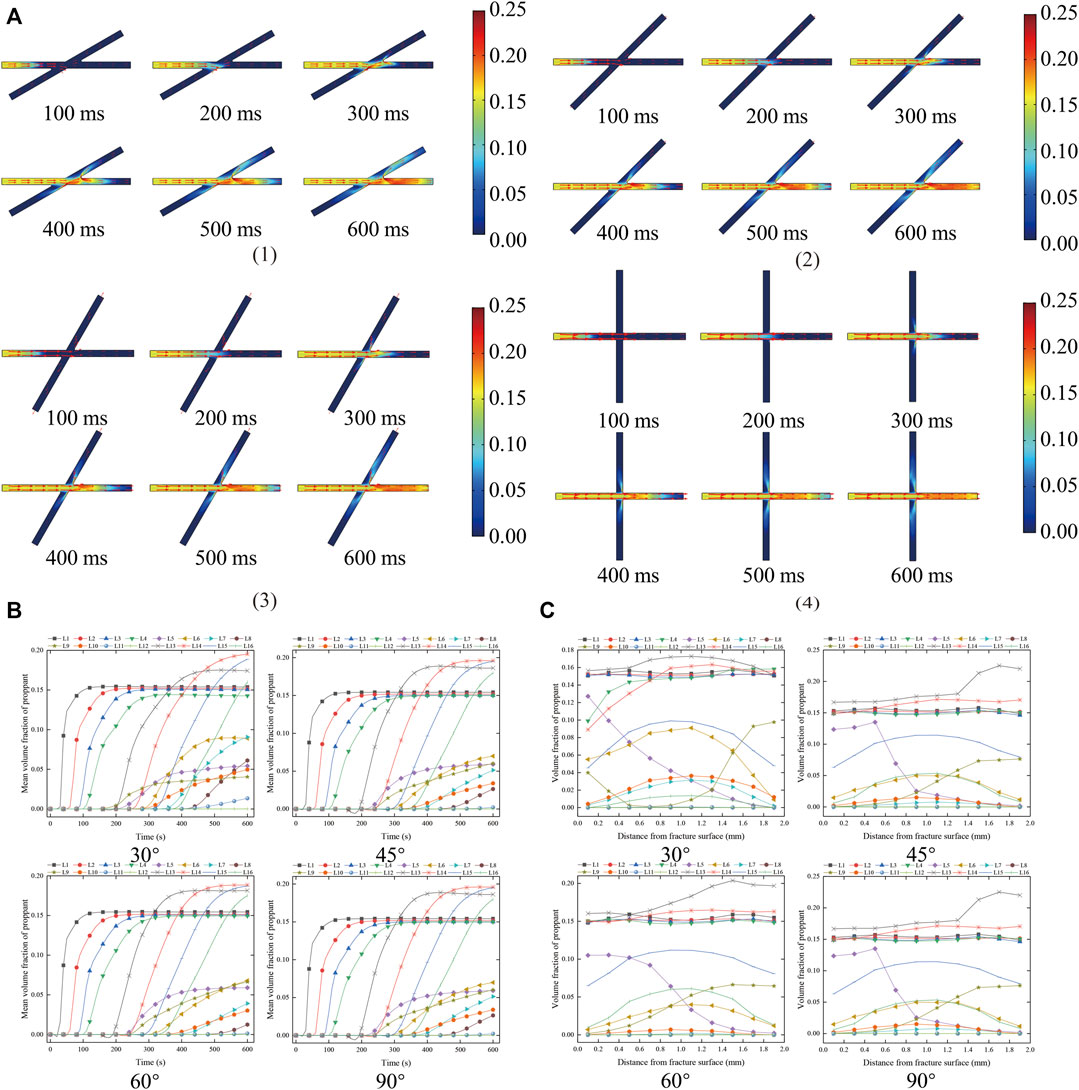
FIGURE 9. Distribution characteristics of proppant volume fraction at the corner of “X → +.” (A) Distribution characteristics of proppant volume fraction at the corner of “X → +” fracture. (1) 30°, (2) 45°, (3) 60°, (4) 90°. (B) The distribution of mean proppant volume fraction of each measuring line at different times at the corner of “X → +.” (C) Distribution of proppant volume fraction of each measuring line at the corner of “X → +” at 400 ms.
The distribution characteristics of proppant velocity at the corner of “ X → +” fracture are summarized in Figure 10. As shown in Figure 10, the proppant migration velocity is as follows: 1# fracture >4# fracture >3# fracture >2# fracture. With the increase in the fracture angle, the proppant migration velocity in each secondary fracture decreases discretely, and the proppant migration velocity in the same secondary fracture is almost the same. With the passage of time, the 1# proppant migration velocity in the fracture shows rapid increase → slow decrease → tend to be stable; The proppant migration velocity in 2# fracture shows that it increases rapidly → increases slowly → tends to be stable; the proppant migration velocity in 3# fracture shows as follows: slow decrease → tend to be stable; the proppant migration velocity in 4# fracture shows that it increases rapidly → tends to be stable. In the stable stage, the migration velocity of 2# fracture proppant is about 38% of that of 1# fracture; the migration velocity of proppant in 3# fracture is about 10% of that in 1# fracture; the migration velocity of proppant in 4# fracture is about 58% of that in 1# fracture.
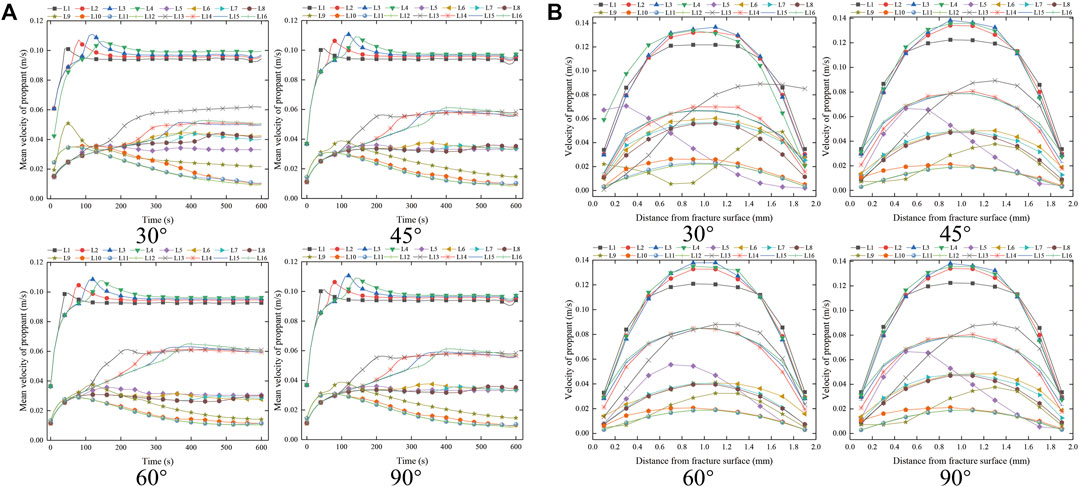
FIGURE 10. Proppant velocity distribution characteristics at the corner of “X → +.” (A) Distribution of mean proppant velocity of each measuring line at different times at the corner of “X → +.” (B) Proppant velocity distribution of each measuring line at the corner of “X → +” at 400 ms.
The distribution characteristics of liquid-phase velocity at the corner of “ X → +” fracture are summarized in Figure 11. As shown in Figure 11, the liquid-phase velocity is 1# fracture >4# fracture >3# fracture >2# fracture. With the increase of fracture angle, the dispersion of liquid-phase migration velocity in each secondary fracture decreases, and the liquid-phase migration velocity in the same secondary fracture is almost the same. With the passage of time, the 1# liquid velocity in the fracture tends to be stable; the velocity of liquid phase in 2# fracture increases slowly at first and then tends to be stable; the velocity of liquid phase in 3# fracture decreases gradually and then tends to be stable; the velocity of liquid-phase migration in 4# fracture increases gradually and then tends to be stable. In the stable stage, the liquid velocity of 2# fracture is about 25% of that of 1# fracture; the liquid-phase velocity of 3# fracture is about 10% of that of 1# fracture; the liquid velocity of 4# fracture is about 58% of that of 1# fracture.
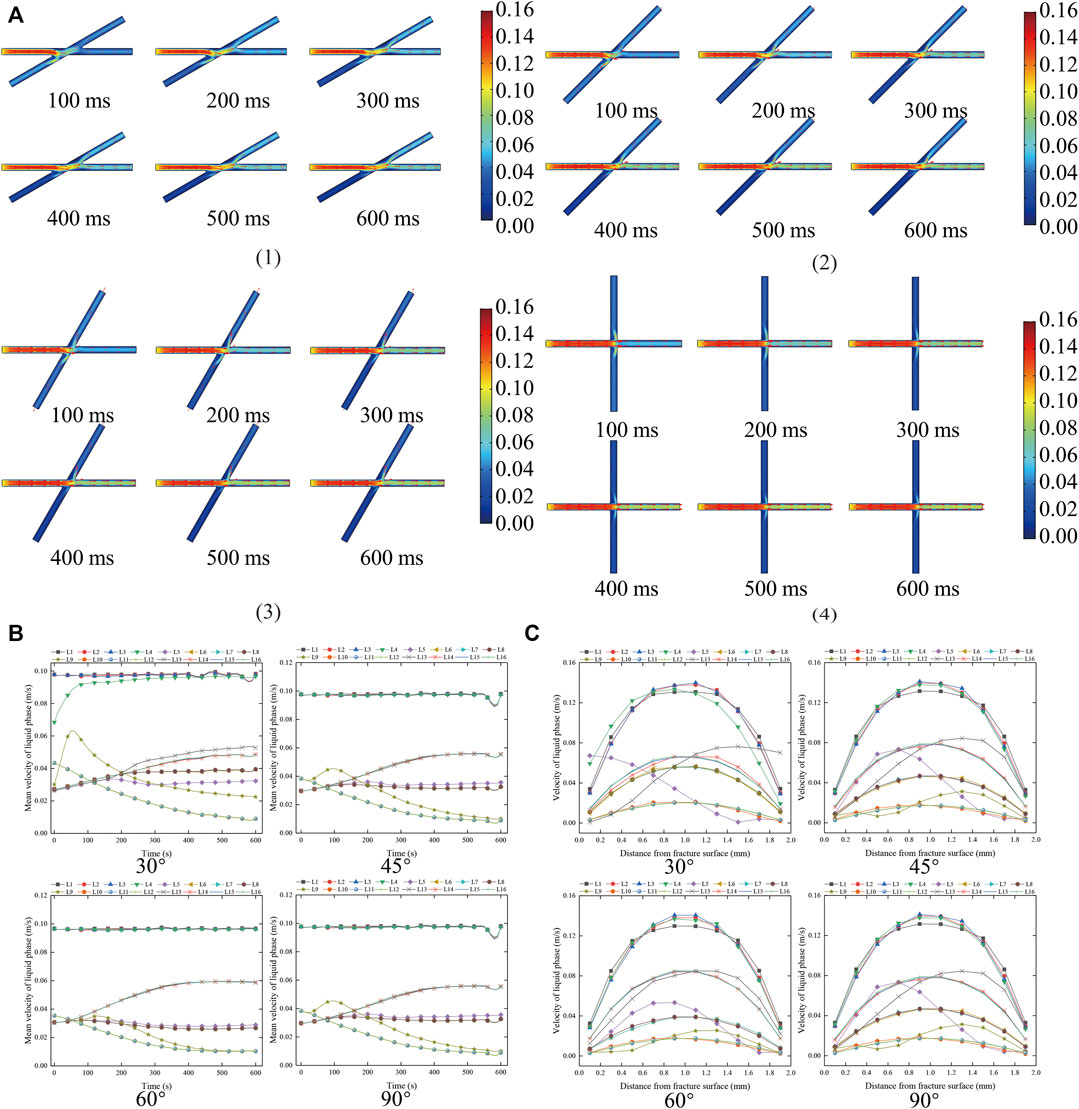
FIGURE 11. Distribution characteristics of liquid-phase velocity at the corner of “X → +.” (A) The characteristics of liquid-phase velocity distribution at the corner of “X → +.” (1) 30°, (2) 45°, (3) 60°, (4) 90°. (B) Distribution of mean liquid-phase velocity of each measuring line at different times at the corner of “X → +.” (C) Liquid-phase velocity distribution of each measuring line at the corner of “X → +” at 400 ms.
In conclusion, no sand-free zone is formed in the “X → +” fracture, and the volume fraction of 4# fracture proppant is increased by 20%; the total amount of proppant in the fracture is given as follows: 4# fracture >1# fracture >2# fracture >3# fracture; the time required for proppant volume fraction to reach the stable stage is 3# fracture >2# fracture >4# fracture >1# fracture; the two-phase migration velocities are 1# fracture >4# fracture >3# fracture >2# fracture.
Characteristics and Basic Laws of Proppant Migration at Fracture Corner
According to 4.1–4.3, the migration characteristics of proppant and liquid phase at the corners of “L → l”, “Y → T,” and “X → +” fractures are mainly manifested in the areas of high-volume-fraction of proppant, empty area, high and low speed of liquid phase, etc. The details of each type of 45° (400 ms) are summarized in Figure 12. As shown in Figure 12, there is a high-volume-fraction proppant area at the fracture corner, and there is a sand-free area in “L → l” and “Y → T” types. The probability of blockage at the corner of “Y → T” fracture is lower than that of “L → l”; compared with the “X → +” type 2# and 3# fractures, the probability of blockage is higher, while the probability of blockage is lower than that of 4# fracture. The migration characteristics of proppant in the corner area can be divided into three areas: corner anomaly area, buffer area, and stability area. The influence of rotation angle on proppant migration is mainly concentrated at the rotation angle and in the range of 4 times the fracture width after steering. When the proppant migration exceeds 4 times the fracture width, the influence of rotation angle on proppant migration law can be ignored.
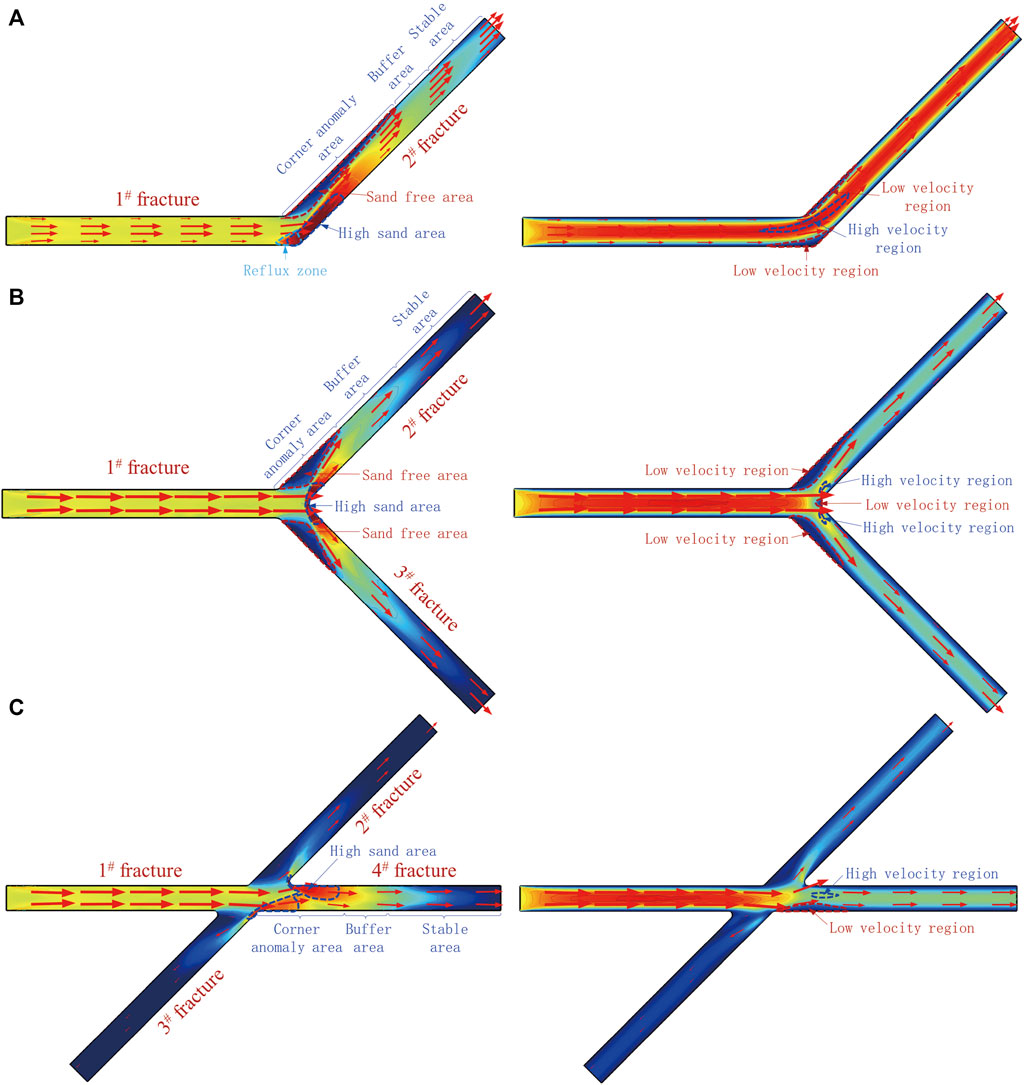
FIGURE 12. Proppant migration and distribution characteristics at fracture corner. (A) “L → l” (B) “Y → T” (C) “X → +.”
The characteristics and basic laws of proppant migration of fracture corners provide theoretical guidance for the migration and distribution of proppant for coalbed methane exploitation and have guiding significance for high-efficiency coalbed methane production.
Conclusion
In this study, the E-E method (TEM) is used to analyze the migration and distribution characteristics of solid–liquid two phases at the fracture corner in detail through the three aspects of proppant volume fraction distribution, proppant velocity distribution, and liquid-phase velocity distribution at the fracture corner. The main conclusions are as follows:
1) The migration characteristics of proppant in the corner area can be divided into corner anomaly area, buffer area, and stability area; the influence of the turning angle on proppant migration is mainly concentrated at the corner and in the range of 4 times the fracture width after turning. When the proppant migration exceeds 4 times the fracture width, the influence of corner on the proppant migration law can be ignored.
2) The probability of sand plugging at the corner of “Y → T” fracture is lower than that of “L → l,” higher than that of “X → +” wing branch fracture, and lower than that of the main fracture.
3) At the corner of the fracture network, after the solid flow turns, the proppant will form a high sand area on the side of the impact fracture surface, then rebound back to the fracture, form a sand-free area on the other side, and form a high-velocity core in the refraction interval.
4) At the corner of the “L → l” fracture, there are one high sand area, one non-sand area, two low-velocity areas, and one high-velocity area; there are three low-velocity areas, two sand-free areas, and one high sand area at the corner of “Y → T” fracture; at the corner of “X → +” fracture, there is a high sand area and no sand-free area, and the flow velocity of the main fracture is much greater than that of the wing branch fracture.
Data Availability Statement
The original contributions presented in the study are included in the article/Supplementary Materials, further inquiries can be directed to the corresponding author.
Author Contributions
QC contributed to funding acquisition and supervision; HL helped with simulation, data analysis, and manuscript drafting; BH designed methodology; XZ assisted with supervision; ZS carried out simulation; XJ performed data analysis; and HeL performed simulation.
Conflict of Interest
The authors declare that the research was conducted in the absence of any commercial or financial relationships that could be construed as a potential conflict of interest.
Publisher’s Note
All claims expressed in this article are solely those of the authors and do not necessarily represent those of their affiliated organizations, or those of the publisher, the editors, and the reviewers. Any product that may be evaluated in this article, or claim that may be made by its manufacturer, is not guaranteed or endorsed by the publisher.
Acknowledgments
The research is supported by the Fundamental Research Funds for the Central Universities (2019XKQYMS25).
References
Ai, C., Li, X.-X., Zhang, J., Jia, D., and Tan, W.-J. (2018). Experimental Investigation of Propagation Mechanisms and Fracture Morphology for Coalbed Methane Reservoirs. Pet. Sci. 15 (4), 815–829. doi:10.1007/s12182-018-0252-z
Akhshik, S., Behzad, M., and Rajabi, M. (2015). CFD-DEM Approach to Investigate the Effect of Drill Pipe Rotation on Cuttings Transport Behavior. J. Pet. Sci. Eng. 127, 229–244. doi:10.1016/j.petrol.2015.01.017
Bandara, K. M. A. S., Ranjith, P. G., and Rathnaweera, T. D. (2020). Laboratory-scale Study on Proppant Behaviour in Unconventional Oil and Gas Reservoir Formations. J. Nat. Gas Sci. Eng. 78, 103329. doi:10.1016/j.jngse.2020.103329
Blais, B., Bertrand, O., Fradette, L., and Bertrand, F. (2017). CFD-DEM Simulations of Early Turbulent Solid-Liquid Mixing: Prediction of Suspension Curve and Just-Suspended Speed. Chem. Eng. Res. Des. 123, 388–406. doi:10.1016/j.cherd.2017.05.021
Bustin, R. M., and Clarkson, C. R. (1998). Geological Controls on Coalbed Methane Reservoir Capacity and Gas Content. Int. J. Coal Geol. 38 (1), 3–26. doi:10.1016/s0166-5162(98)00030-5
Cai, C., Li, G., Huang, Z., Tian, S., Shen, Z., and Fu, X. (2015). Experiment of Coal Damage Due to Super-cooling with Liquid Nitrogen. J. Nat. Gas Sci. Eng. 22, 42–48. doi:10.1016/j.jngse.2014.11.016
Chang, O., Kinzel, M., Dilmore, R., and Wang, J. Y. (2018). Physics of Proppant Transport through Hydraulic Fracture Network. J. Energ Resour-asme. 140, 329123. doi:10.1115/1.4038850
Chen, J., Li, X., and Cao, H. (2019). Experimental Investigation of Coal-like Materials for Hydraulic Fracturing Based on Fluid-Solid Interaction. J. Nat. Gas Sci. Eng. 69, 102928. doi:10.1016/j.jngse.2019.102928
Chen, X., Zhong, W., Sun, B., Jin, B., and Zhou, X. (20122012). Study on Gas/solid Flow in an Obstructed Pulmonary Airway with Transient Flow Based on CFD-DPM Approach. Powder Tech. 217, 252–260. doi:10.1016/j.powtec.2011.10.034
Cheng, Q., Huang, B. X., Huang, B., Zhao, X., Chen, S. L., Li, H. Z., et al. (2020). Numerical Investigation on the Mechanism of Rock Directional Fracturing Method Controlled by Hydraulic Fracturing in Dense Linear Multiholes. Shock and Vibration 2020 (21), 1–10. doi:10.1155/2020/6624047
Chun, T., Li, Y., and Wu, K. (2020). Comprehensive Experimental Study of Proppant Transport in an Inclined Fracture. J. Pet. Sci. Eng. 184, 106523. doi:10.1016/j.petrol.2019.106523
Colmenares, L. B., and Zoback, M. D. (2007). Hydraulic Fracturing and Wellbore Completion of Coalbed Methane wells in the Powder River Basin, Wyoming: Implications for Water and Gas Production. Bulletin 91 (1), 51–67. doi:10.1306/07180605154
Enwald, H., Peirano, E., and Almstedt, A.-E. (1996). Eulerian Two-phase Flow Theory Applied to Fluidization. Int. J. Multiphase Flow 22, 21–66. doi:10.1016/s0301-9322(96)90004-x
Fan, M., McClure, J., Han, Y. H., Ripepi, N., Westman, E., Gu, M., et al. (2019). Using an experiment/simulation-integrated Approach to Investigate Fracture-Conductivity Evolution and Non-darcy Flow in a Proppant-Supported Hydraulic Fracture. SPE J. 24 (4), 1912–1928. doi:10.2118/195588-pa
Gorham, E. (1991). Northern Peatlands: Role in the Carbon Cycle and Probable Responses to Climatic Warming. Ecol. Appl. 1 (2), 182–195. doi:10.2307/1941811
Guo, J., Wang, J., Liu, Y., Chen, Z., and Zhu, H. (2017). Analytical Analysis of Fracture Conductivity for Sparse Distribution of Proppant Packs. J. Geophys. Eng. 14, 599–610. doi:10.1088/1742-2140/aa6215
Hu, X., Wu, K., Song, X., Yu, W., Tang, J., Li, G., et al. (2018). A New Model for Simulating Particle Transport in a Low-Viscosity Fluid for Fluid-Driven Fracturing. Aiche J. 64 (9), 3542–3552. doi:10.1002/aic.16183
Hu, X., Yang, Z., and Chen, Y. (2021). Fluid-driven Particle Transport Patterns in a Confined Geometry, Effect of Flow Velocity and Particle Concentration. J. Nat. Gas Sci. Eng. 92. doi:10.1016/j.jngse.2021.103998
Huang, B., Liu, C., Fu, J., and Guan, H. (2011). Hydraulic Fracturing after Water Pressure Control Blasting for Increased Fracturing. Int. J. Rock Mech. Mining Sci. 48 (6), 976–983. doi:10.1016/j.ijrmms.2011.06.004
Huang, B. X., Li, H. Z., Cheng, Q. Y., and Zhao, X. L. (2019a). Compaction and Embedment Characteristics of Proppant in Hydraulic Fractures of Coal Seams. Nat. Gas Industry 39, 48–54. doi:10.3787/j.issn.1000-0976.2019.04.006
Huang, H., Babadagli, T., Li, H. A., Develi, K., and Wei, G. (2019b). Effect of Injection Parameters on Proppant Transport in Rough Vertical Fractures: An Experimental Analysis on Visual Models. J. Pet. Sci. Eng. 180, 380–395. doi:10.1016/j.petrol.2019.05.009
Li, H., Huang, B., Cheng, Q., Zhao, X., Chen, B., and Zhao, L. (2021). Mechanism of Single Proppant Pressure Embedded in Coal Seam Fracture. Energy Fuels 35 (9), 7756–7767. doi:10.1021/acs.energyfuels.0c04360
Li, H., Huang, B., Cheng, Q., and Zhao, X. (2020). Optimization of Proppant Parameters for CBM Extraction Using Hydrofracturing by Orthogonal Experimental Process. J. Geophys. Eng. 17 (3), 493–505. doi:10.1093/jge/gxaa009
Liu, Y., and Sharma, M. M. (2005). SPE Annual Technical Conference and Exhibition. Dallas, Texas, 9–12. October. SPE-96208-MS. doi:10.2118/96208-msEffect of Fracture Width and Fluid Rheology on Proppant Settling and Retardation, an Experimental Study
Lv, Y., Tang, D., Xu, H., and Luo, H. (2012). Production Characteristics and the Key Factors in High-Rank Coalbed Methane fields: A Case Study on the Fanzhuang Block, Southern Qinshui Basin, China. Int. J. Coal Geology. 96-97, 93–108. doi:10.1016/j.coal.2012.03.009
Mooney, H. A., Vitousek, P. M., and Matson, P. A. (1987). Exchange of Materials between Terrestrial Ecosystems and the Atmosphere. Science 238 (4829), 926–932. doi:10.1126/science.238.4829.926
Parmesan, C., and Yohe, G. (2003). A Globally Coherent Fingerprint of Climate Change Impacts across Natural Systems. Nature 421 (6918), 37–42. doi:10.1038/nature01286
Patankar, N. A., Singh, P., Joseph, D. D., Glowinski, R., and Pan, T.-W. (2000). A New Formulation of the Distributed lagrange Multiplier/fictitious Domain Method for Particulate Flows. Int. J. Multiphase Flow 26 (9), 1509–1524. doi:10.1016/s0301-9322(99)00100-7
Peng, Z., Galvin, K., and Doroodchi, E. (2019). Influence of Inclined Plates on Flow Characteristics of a Liquid-Solid Fluidised Bed: A CFD-DEM Study. Powder Tech. 343, 170–184. doi:10.1016/j.powtec.2018.11.047
Qin, L., Zhai, C., Liu, S., Xu, J., Yu, G., and Sun, Y. (2017). Changes in the Petrophysical Properties of Coal Subjected to Liquid Nitrogen Freeze-Thaw - A Nuclear Magnetic Resonance Investigation. Fuel 194, 102–114. doi:10.1016/j.fuel.2017.01.005
Song, C., and Elsworth, D. (2018). Strengthening Mylonitized Soft-Coal Reservoirs by Microbial Mineralization. Int. J. Coal Geology. 200, 166–172. doi:10.1016/j.coal.2018.11.006
Suri, Y., Islam, S. Z., and Hossain, M. (2019). A New CFD Approach for Proppant Transport in Unconventional Hydraulic Fractures. J. Nat. Gas Sci. Eng. 70, 102951. doi:10.1016/j.jngse.2019.102951
Tan, P., Jin, Y., Hou, B., Yuan, L., and Xiong, Z. (2011). Experimental Investigation of Hydraulic Fracturing for Multi-type Unconventional Gas Co-exploitation in Ordos Basin. Arab J. Sci. Eng. 44 (12), 10503–10511. doi:10.1007/s13369-019-03974-9
Tan, P., Jin, Y., Yuan, L., Xiong, Z.-Y., Hou, B., Chen, M., et al. (2019). Understanding Hydraulic Fracture Propagation Behavior in Tight sandstone-coal Interbedded Formations: an Experimental Investigation. Pet. Sci. 16 (1), 148–160. doi:10.1007/s12182-018-0297-z
van Wachem, B. G. M., Schouten, J. C., van den Bleek, C. M., Krishna, R., and Sinclair, J. L. (2001). Comparative Analysis of CFD Models of Dense Gas-Solid Systems. Aiche J. 47 (5), 1035–1051. doi:10.1002/aic.690470510
Wang, J., and Elsworth, D. (2018). Role of Proppant Distribution on the Evolution of Hydraulic Fracture Conductivity. J. Pet. Sci. Eng. 166, 249–262. doi:10.1016/j.petrol.2018.03.040
Wang, X., Yao, J., Gong, L., Sun, H., Yang, Y., Zhang, L., et al. (2019). Numerical Simulations of Proppant Deposition and Transport Characteristics in Hydraulic Fractures and Fracture Networks. J. Pet. Sci. Eng. 183, 106401. doi:10.1016/j.petrol.2019.106401
Wang, Z., Pan, J., Hou, Q., Niu, Q. H., Niu, Q., Tian, J., et al. (2018). Changes in the Anisotropic Permeability of Low-Rank Coal under Varying Effective Stress in Fukang Mining Area, China. Fuel 234, 1481–1497. doi:10.1016/j.fuel.2018.08.013
Wen, C. Y., and Yu, Y. H. (1966). Mechanics of Fluidization. Chem. Eng. Prog. Symp. Ser. 62, 100–110. doi:10.1016/S0032-0633(98)00014-2
Wu, C. H., and Sharma, M. M. (2019). Modeling Proppant Transport through Perforations in a Horizontal Wellbore. SPE J. 4 (24), 1777–1789. doi:10.2118/179117-pa
Xiong, W., Shen, K., Ba, Q., Liu, Y., and Zhou, H. (2021). A Liquid-Solid Model to Optimize the Application of Friction Reducers for Hydraulic Fracturing/cutting in the Underground Coal Mine. Energy Sci Eng 9 (9), 1568–1582. doi:10.1002/ese3.930
Xu, J., Zhai, C., Liu, S., Qin, L., and Wu, S. (2017). Pore Variation of Three Different Metamorphic Coals by Multiple Freezing-Thawing Cycles of Liquid CO2 Injection for Coalbed Methane Recovery. Fuel 208, 41–51. doi:10.1016/j.fuel.2017.07.006
Yan, X., Huang, Z., Yao, J., Song, W., Li, Y., and Gong, L. (2016). Theoretical Analysis of Fracture Conductivity Created by the Channel Fracturing Technique. J. Nat. Gas Sci. Eng. 31, 320–330. doi:10.1016/j.jngse.2016.03.038
Yatin, S., Sheikh, Z. L., and Mamdud, H. (2020). Effect of Fracture Roughness on the Hydrodynamics of Proppant Transport in Hydraulic Fractures. J. Nat. Gas Sci. Eng. 80, 103401.
Zachos, J. C., Dickens, G. R., and Zeebe, R. E. (2008). An Early Cenozoic Perspective on Greenhouse Warming and Carbon-Cycle Dynamics. Nature 451 (7176), 279–283. doi:10.1038/nature06588
Zachos, J., Pagani, M., Sloan, L., Thomas, E., and Billups, K. (2001). Trends, Rhythms, and Aberrations in Global Climate 65 Ma to Present. Science 292 (5517), 686–693. doi:10.1126/science.1059412
Zhang, G., Li, M., and Gutierrez, M. (2017). Numerical Simulation of Proppant Distribution in Hydraulic Fractures in Horizontal wells. J. Nat. Gas Sci. Eng. 48, 157–168. doi:10.1016/j.jngse.2016.10.043
Zhang, Q., Zhu, W., Liu, W., Yue, M., and Song, H. (2020). Numerical Simulation of Fractured Vertical Well in Low-Permeable Oil Reservoir with Proppant Distribution in Hydraulic Fracture. J. Pet. Sci. Eng. 195, 107587. doi:10.1016/j.petrol.2020.107587
Zhao, H., Wang, X., and Liu, Z. (2019). Experimental Investigation of Hydraulic Sand Fracturing on Fracture Propagation under the Influence of Coal Macrolithotypes in Hancheng Block, China. J. Pet. Sci. Eng. 175, 60–71. doi:10.1016/j.petrol.2018.12.031
Keywords: coal seam, fracture network, corner, proppant migration, distribution characteristics
Citation: Cheng Q, Li H, Huang B, Zhao X, Sun Z, Jiao X and Li H (2021) Migration and Distribution Characteristics of Proppant at the Corner of Horizontal Fracture Network in Coal Seam. Front. Earth Sci. 9:792232. doi: 10.3389/feart.2021.792232
Received: 10 October 2021; Accepted: 04 November 2021;
Published: 25 November 2021.
Edited by:
Zhiyuan Wang, China University of Petroleum (Huadong), ChinaReviewed by:
Pei Li, China Coal Research Institute (China), ChinaLing Chen, Texas A and M University, United States
Copyright © 2021 Cheng, Li, Huang, Zhao, Sun, Jiao and Li. This is an open-access article distributed under the terms of the Creative Commons Attribution License (CC BY). The use, distribution or reproduction in other forums is permitted, provided the original author(s) and the copyright owner(s) are credited and that the original publication in this journal is cited, in accordance with accepted academic practice. No use, distribution or reproduction is permitted which does not comply with these terms.
*Correspondence: Haoze Li, bGloYW96ZUBjdW10LmVkdS5jbg==