 Xuelong Hu
 Minke Duan1,2,3*
- 1School of Mining Engineering, Anhui University of Science and Technology, Huainan, China
- 2Key Laboratory of Safety and High-efficiency Coal Mining, Ministry of Education, Anhui University of Science and Technology, Huainan, China
- 3State Key Laboratory of Mining Response and Disaster Prevention and Control in Deep Coal Mines, Anhui University of Science and Technology, Huainan, China
- 4State Key Laboratory of Coal Resources and Safe Mining, China University of Mining and Technology, Xuzhou, China
- 5Metallurgical Mines’ Association of China, Beijing, China
Elucidating and understanding the dynamic fracture characteristics of rocks play an essential role in the application of rock engineering and geophysics. In this study, based on a self-developed dynamic damage model, a rock notched semi-circle bend test with the Split Hopkinson Pressure Bar technique is numerically simulated. The study focuses on three aspects including damage evolution, energy evolution, and failure mode of rock under different loading velocities. From the simulated results, the following conclusions can be conducted: 1) the damage range increases gradually with the increase of loading velocity; 2) the crack propagates to the loading point along the symmetry axis of the samples under different loading velocities; 3) the loading velocity has an important influence on the failure mode of straight notch semi-circular marble, whose mechanism can be explained by that the local high strain rate leads to the obvious randomness and uncertainty of crack activation in rock; and 4) the energy evolution of notched semi-circle bend is vitally affected by loading velocity, and the deformation and the failure process of straight notch semicircular marble under dynamic loading can be divided into five stages according to the ratio of internal energy to total energy. The beneficial findings may provide some references in practice design from engineering problems.
Introduction
Studying and understanding the dynamic fracture characteristics of rocks under different loading rates are of great significance for the application of rock engineering and geophysics, and there are many researchers to make efforts in the fracture characteristics of rocks (Dai et al., 2016; Du et al., 2020; Du et al., 2021; Wei et al., 2021; Xia and Yao 2015).
At present, there are many methods to measure rock fracture characteristics (Zhang and Zhao 2013 Yao and Xia 2019), including wedge-loaded compact tension (WLCT) (Klepaczko et al., 1984), notched semi-circle bend (NSCB) (Chong and Kuruppu 1984), short rod (SR) (Franklin et al., 1988), single edge notched bending (SENB) (Tang and Xu 1990), cracked straight through Brazilian disc (CSTBD) (Kourkoulis and Markides 2014; Nakano et al., 1994), holed-notched cylinder fracture (HNCF) (Wei et al., 2018a; Wei et al., 2018b), three-point chevron bend (CB) (Zhou et al., 2009), cracked chevron notched Brazilian disc (CCNBD) (Dai et al., 2010), cracked chevron notched semi-circle bend (CCNSCB) (Dai et al., 2011), and double cleavage drilled compression (DCDC) (Wang et al., 2016). Compared with other methods, the NSCB method has incomparable advantages (Yao and Xia 2019): 1) the notch of the specimen is straight, which is convenient for the preparation of specimen; 2) in the placement process of the specimen, only two support points of the specimen need to be aligned on the bar side, which simplifies the specimen alignment; and 3) the size of the specimen is so small that it can expedite the dynamic force balance. Because of its merits, the NSCB method was recommended to determine the dynamic fracture characteristics of rocks by the international society for rock mechanics and rock engineering (ISRM) in 2012 (Zhou et al., 2012), and then determine the static type I fracture characteristics of rocks by ISRM in 2014 (Kuruppu et al., 2014). Therefore, the NSCB method is the only ISRM suggested method to determine the static and dynamic mode I fracture toughness of rocks.
So far, the research on rock dynamic fracture behaviors based on the NSCB method has mostly focused on the following aspects: 1) measurement of rock dynamic fracture toughness and crack propagation velocity, for example, Chen et al. (2009) proposed a method to simultaneously measure dynamic fracture parameters such as fracture propagation toughness and fracture velocity using a semi-circular bend technique, and Zhao et al. (2017) studied the influence of bedding angle and loading rate on the initiation fracture toughness of coal using NSCB method; 2) obtaining rock displacement and strain field using the digital image correlation (DIC) technology (Zhang and Zhao 2013; Zhang and Zhao 2014; Gao et al., 2015a; Gao et al., 2015b; Xing et al., 2017); 3) fracture characteristics of deep rock (Yin et al., 2014; Chen et al., 2016; Yao et al., 2019; Li et al., 2020), and 4) the influence of heat, moisture anisotropy, and other factors on rock dynamic fracture characteristics (Yin et al., 2012; Dai et al., 2013; Dai and Xia 2013; Yao et al., 2017; Xu et al., 2018; Zhou et al., 2018; Cai et al., 2018; Wei, et al., 2018c; Shi et al., 2019; Cai et al., 2020a; Cai, et al., 2020b; Wei et al., 2021). Due to the limitation of the measurement technology, there is still a lack of in-depth understanding of the damage evolution law, energy evolution law, and mechanical mechanism of the failure mode in the deformation and the failure process of NSCB rock specimens. Thus, based on a rock dynamic damage model, this study numerically simulates the rock dynamic NSCB test, in order to study the damage evolution law, mechanical mechanism, and energy evolution law of rock under different loading rates.
Experiment Setup
Brief Introduction of Dynamic Notched Semi-Circle Bend Experiment
The NSCB method was originally proposed by Chong and Kuruppu (1984) to determine mode I fracture toughness, which has been widely used all over the world. The dynamic NSCB test combines the notched semicircle bend (NSCB) test and Split Hopkinson Pressure Bar (SHPB) technique, and the schematic diagram of dynamic NSCB test device is shown in Figure 1. The test device is mainly composed of an air gun, strike bar, incident bar, transmission bar, strain gauge, and oscilloscope. The standard rock sample is semicircular, with a radius of 25 mm and a thickness of 20 mm. The length and width of the straight cutting notch are 5 and 0.6 mm, respectively. The span of the support point is 2S = 33.3 mm. Under quasi-static loading, the stress intensity factor of the sample can be expressed as follows (Chong and Kuruppu 1984):
where
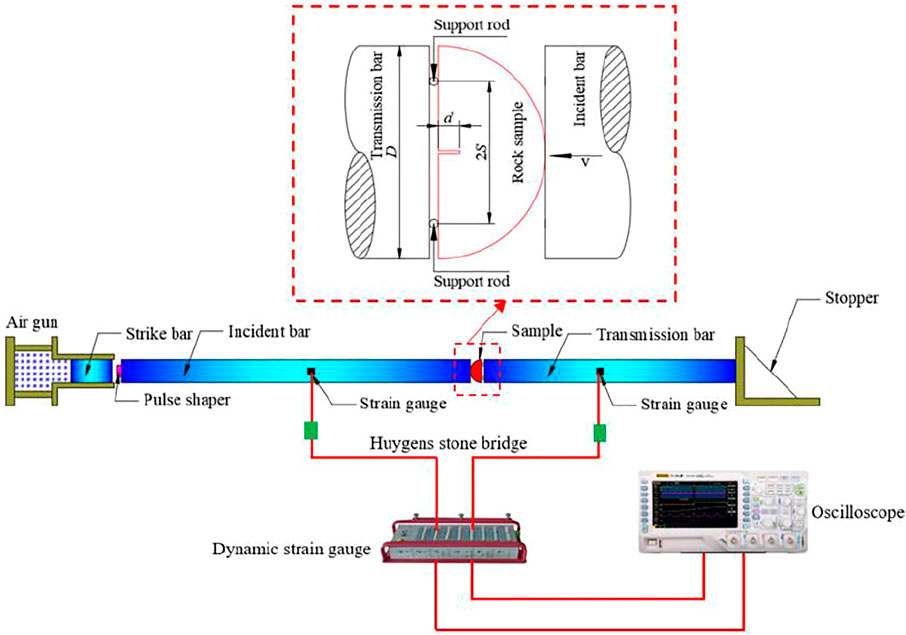
FIGURE 1. Schematic diagram of the dynamic NSCB test device.
Under dynamic loading, the force exerted on the sample turns into a time-dependent force, namely, P(t), then the dynamic stress intensity factor can be expressed as follows (Zhang and Zhao 2013):
Setup of the Finite Element Model
According to the above brief introduction of the NSCB test, the established numerical model is the same as the experiment. The contact between the rock sample and the incident bar and the contact between the rock and the support bar are through the keyword “contact_2D_AUTOMATIC_SURFACE_TO_SURFACE_ID.” The numerical model adopts 2D solid162 element, which is meshed into 15,917 elements in total.
Material Model of Numerical Simulation
The mechanical behaviors of rock are characterized by a self-developed dynamic damage model. The model takes unified strength theory as the strength criterion and considers hardening behaviors, tension-compression damage, and Lode angle effect as well as strain rate effect. The strength criterion of the model can be expressed as
where a is the ratio of tensile strength to compressive strength, b is the selected parameter which can reflect the influence of the intermediate principal stress on the material failure, φ is the internal friction angle, ω is the damage variable, κ is the yield strength, I1 is the first invariant of the stress tensor, J2 is the second invariant of the deviatoric stress tensor, θ is the Lode angle, and J3 is the third invariant of the deviatoric stress tensor.
In the above formula, κ can be expressed as
where DIF is the dynamic increase factor, β0 is the initial yield threshold for plastic hardening, βm is the maximum yield threshold for plastic hardening, b1 is the parameter describing the rate of hardening, and γp is the generalized plastic shear strain.
And
where P* is the standardized hydrostatic pressure, P* = P/σc, P is the actual hydrostatic pressure, σc is the uniaxial compressive strength of rock materials, T* is the standardized tensile strength, T* = σt/σc, σt is the uniaxial tensile strength of rock materials, D1 and D2 are the damage constants of rock materials, p1 is the hydrostatic pressure, α represents the rock tensile damage parameter, A and B are the strain rate parameters,
The relationship between P and volumetric strain μ can be divided into three stages: linear elastic stage, transition stage, and compaction stage, as shown in Figure 2.
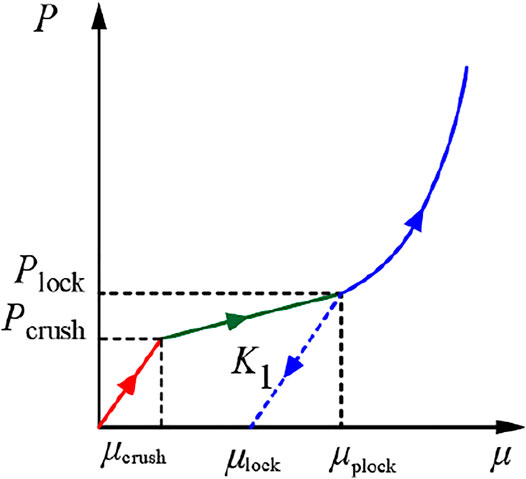
FIGURE 2. Relationship between P and μ. In linear elastic stage (0 ≤ μ < μcrush), P can be expressed as.
In the transition stage (μcrush≤μ<μplock), P can be expressed as
In the compaction stage (μ > μplock), P can be expressed as
where K is the volume modulus; Pcrush is the hydrostatic pressure when the rock reaches its elastic limit; μcrush is the volumetric strain corresponding to P=Pcrush; Plock is the hydrostatic pressure when the rock is compacted; μlock is the volumetric strain corresponding to P=Plock; μlock is the plastic deformation that occurs when the rock is compacted; K1, K2, and K3 are rock material parameters; and
The mechanical parameters of Fangshan marble are listed in Table 1. The rigid model is used to simulate the incident bar and transmission bar, which are made of 40Cr steel, and the parameters of bars are listed in Table 2.
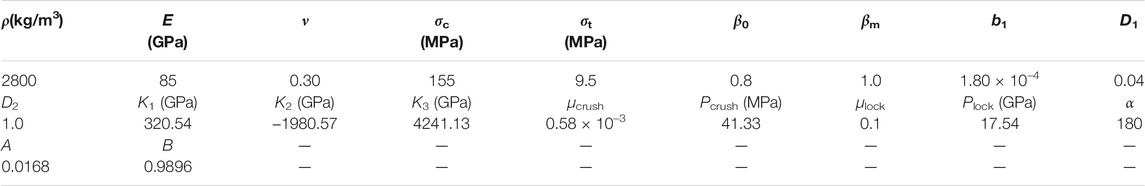
TABLE 1. Model parameters of Fangshan marble.
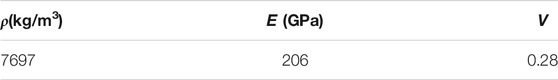
TABLE 2. Mechanical parameters of 40Cr steel.
Scheme Design of Numerical Notched Semi-Circle Bend Test and Validation
Because this study focuses on the failure mode and energy evolution of rock under different loading rates, the initial velocities of 0.01 m/s, 1.0 m/s, 2.0 m/s, and 3.0 m/s are applied to the incident bar. In order to ensure the validity and correctness of numerical the NSCB test, numerical simulation was carried out with an initial velocity of 2.25 m/s from the experiment conducted by Zhang and Zhao (2013). As the finite element method is based on continuum mechanics and cannot show the process of rock crack propagation, the element deletion technology is adopted in this study; that is, when the element state reaches a threshold, the element is deleted and a failure crack is formed in the visual effect. According to the damage mechanics, when the damage of rock materials accumulates to a certain extent, the rock materials will fail. Therefore, this study uniformly selects the damage variable of the element as the basis for judging the deletion of the element. Based on the comparison between numerical simulation results and experimental results, the damage threshold is set as 0.8; that is, when the damage of rock is greater than or equal to 0.8, the rock will fail and crack.
Figure 3 shows the comparison between numerical simulation results and experimental one of crack tip position. It can be seen that the numerical simulation value of the time when the crack tip reaches the same position is larger than the test value, which is due to the different loading modes of the initial velocity in the numerical simulation and the test. The initial velocity in the numerical simulation is directly applied to the incident bar, while the initial velocity in the test is loaded to the incident bar to improve computational efficiency. There is a pulse shaper between the strike bar and the incident bar, which prolongs the rise time of the incident wave, resulting in a condition where the crack initiation time of the straight notch is later than that of the straight notch in the numerical simulation. Although there are some differences between the numerical results and the experimental value when the crack tip reaches the same position, the time interval of the same length of crack propagation is relatively close; that is, the crack propagation speed is relatively consistent, so the reliability of the numerical simulation results can be determined.
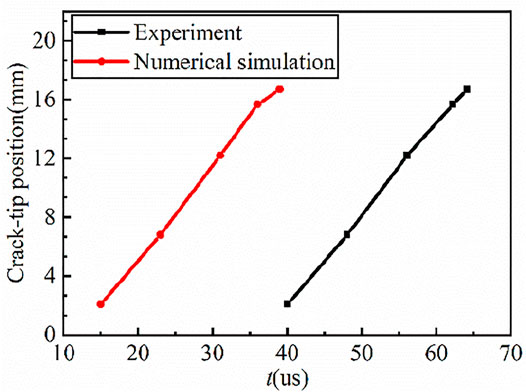
FIGURE 3. The comparison between numerical simulation results and experimental one of crack tip position.
Figure 4 shows the comparison between the numerical simulation results and the experimental results of the crack propagation process with the initial velocity of 2.25 m/s. From this figure, it can be seen that the crack starts from the notch tip and propagates along the symmetrical pumping direction of the NSCB sample to the loading point. The numerical simulation results of the crack propagation process are consistent with the experimental results.
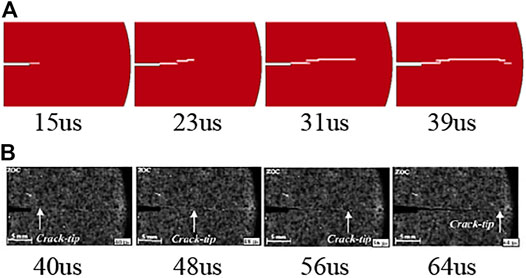
FIGURE 4. The comparison between numerical simulation results and experimental results of crack propagation process. (A) Numerical simulation, (B) Experiment Zhang and Zhao (2013).
Results and Discussions
For the purpose of this study, the effects of loading velocities on the damage evolution law, failure characteristics, and energy evolution law of marble are analyzed and discussed below.
Damage Evolution Law of Marble Under Different Loading Rates
Figure 5 shows the final distribution of damage of NSCB rock samples under different loading velocities. From the figure, the damage is distributed along the symmetry axis of the rock samples. The damage distribution of the rocks under dynamic loading is obviously different from that under quasi-static loading. The damage distribution of the rocks under quasi-static loading is in a straight line, while the damage evolves not only to the loading point but also to the direction perpendicular to the symmetrical axis under dynamic loading. With the increase of loading velocity, the damage range of rock samples increases gradually.
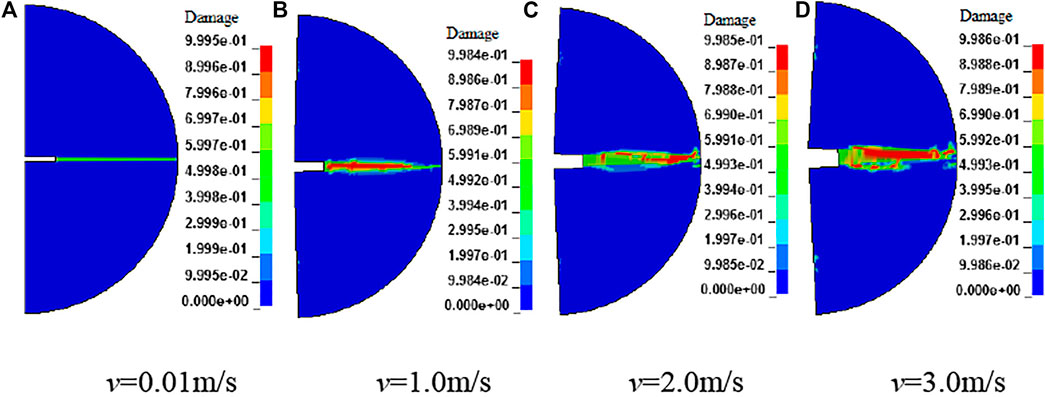
FIGURE 5. Final damage distribution of NSCB rock samples under different loading velocities. Failure characteristics of marble under different loading velocities. (A) v=0.01m/s, (B) v=1.0m/s, (C) v=2.0m/s, (D) v=3.0m/s.
Figure 6 shows the final failure mode of NSCB rock samples under different loading velocities. It can be seen from the figure that the rock samples crack from the notch and expand along their symmetrical axial to loading point under different loading velocities, indicating that the notch plays a leading role in the crack propagation direction, which is in good agreement with the test results conducted by Zhang and Zhao (2013). With the increase of loading velocity, the flatness of crack becomes smaller and smaller, and indicates that with the increase of loading velocity, the stability of crack propagation to the loading point becomes worse and worse. This is because Fangshan marble is a rock material with a strong strain rate effect, and its failure is closely related to its dynamic strength. From the meso point of view, the dynamic strength induced by strain rates of different internal parts of the rocks is different under dynamic loading, resulting in notable randomness and uncertainty in the activation of cracks inside the rock, and this randomness is stronger and stronger with the increase of the strain rate, which activates more cracks inside the rock.
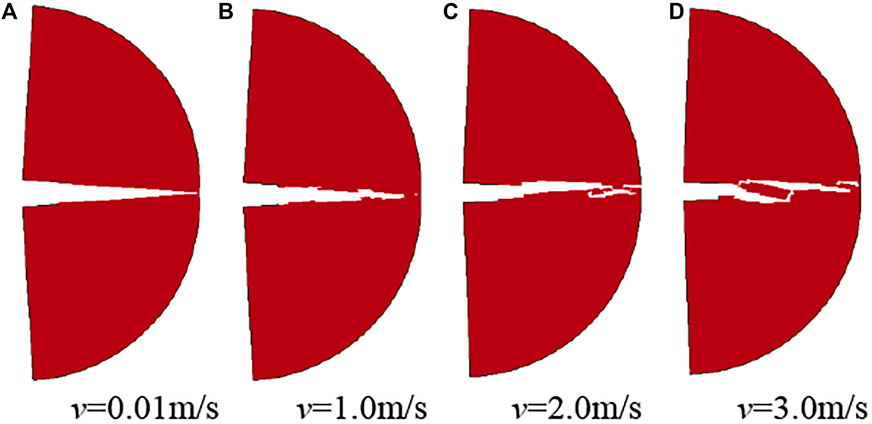
FIGURE 6. Final failure mode of NSCB rock samples under different loading velocities. Energy evolution law of NSCB rock samples under different loading velocities. (A) v=0.01m/s, (B) v=1.0m/s, (C) v=2.0m/s, (D) v=3.0m/s.
Figure 7 shows the time history curves of rock energy under different loading velocities. The total energy comes from the incident bar. According to the law of energy conservation, the total energy is equal to the sum of internal energy and kinetic energy. Internal energy is mainly used for rock deformation, damage, and failure, and kinetic energy is mainly used for rock movement. It can be obtained from the figure that the total energy of rocks under different loading velocities has the same evolution trend, which first increases gradually and then tends to have a stable value. The change of kinetic energy under different loading velocities has the same trend, which first increases gradually and then tends to be stable. The internal energy of rocks under different loading velocities also has the same trend, which first increases gradually, then decreases gradually after reaching the maximum value, and finally tends to a stable value. The stable value of internal energy increases with the increase of loading velocity. Combined with the previous analysis, it can be found that the stable value of internal energy can reflect the damage range of rocks under different loading velocities. The total energy, kinetic energy, and internal energy of rocks increase with the increase of loading velocities, but at the initial stage, the internal energy is greater than the kinetic energy.
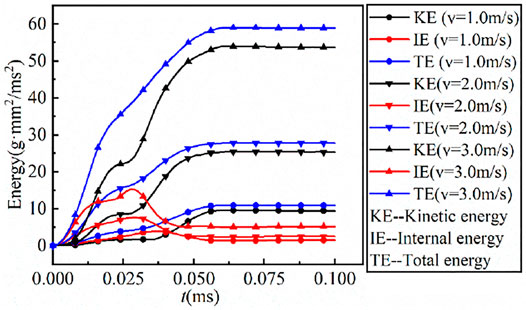
FIGURE 7. Time history curves of rock energy under different loading velocities.
Figure 8 shows the time history curves of rock energy under quasi-static and dynamic loading. It can be concluded from the figure that the evolution law of rock energy under quasi-static loading is notably different from that of rock energy under dynamic loading. Under quasi-static loading, the kinetic energy of the rock at the initial stage is almost zero, which indicates that the total energy is basically transformed into the internal energy of the rock. The internal energy of the rock at the later stage is zero, indicating that the damage range of the rock is very small after the rock fails along the axis of symmetry. Under dynamic loading, the internal energy and kinetic energy of the rock increase gradually in the initial stage, and tend to be stable in the later stage. This stability value of internal energy is greater than that under quasi-static condition, indicating that the local high strain rate under dynamic loading can cause a wider range of damage.
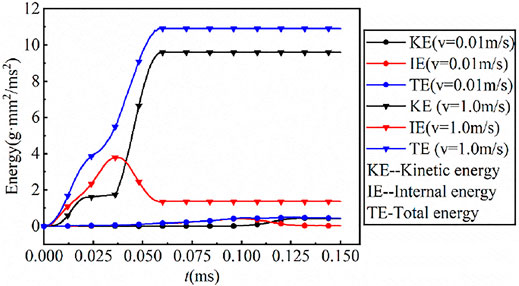
FIGURE 8. Time history curves of rock energy under quasi-static and dynamic loading.
Figure 9 shows the time history curve of the ratio of internal energy to total energy of NSCB rock samples under different loading velocities. The ratio of internal energy to total energy can reflect the evolution law of energy in the process of rock deformation, damage, and failure. It can be seen that the ratio of internal energy to total energy has a similar evolution law under different loading velocities. The greater the loading velocity, the smaller the maximum value of the ratio of internal energy to total energy, indicating that a higher proportion of internal energy can be obtained by rocks at a lower loading velocity. According to the energy ratio, the process from rock deformation to failure can be divided into five stages, and it is illustrated by taking the initial loading velocity of 1.0 m/s as an example, that is, OA, AB, BC, CD, and DE. In the OA stage, the energy ratio increases sharply in a very short time, and the internal energy of the rock sample increases sharply. This stage is the collision stage between the incident bar and rock sample. In the AB stage, the energy ratio decreases rapidly. At this stage, the rock sample begins to move, the kinetic energy and internal energy increase, and the increase rate of kinetic energy is greater than that of internal energy. In the BC stage, the energy ratio begins to increase gradually. At this stage, the rock sample begins to crack from B and the crack extends to the loading point, but the crack does not reach the loading point, the kinetic energy and internal energy increase, and the increase rate of internal energy is greater than that of kinetic energy. In the CD stage, the energy ratio decreases gradually. At this stage, due to the increase of crack length, the constraint of the rock sample decreases, the kinetic energy of the rock sample increases rapidly, and the internal energy of rock increases first and then decreases. In the DE stage, the crack tip reaches the loading point, the crack penetrates, the internal energy exists inside the samples in the form of plastic deformation energy remaining unchanged, and the kinetic energy tends to be stable.
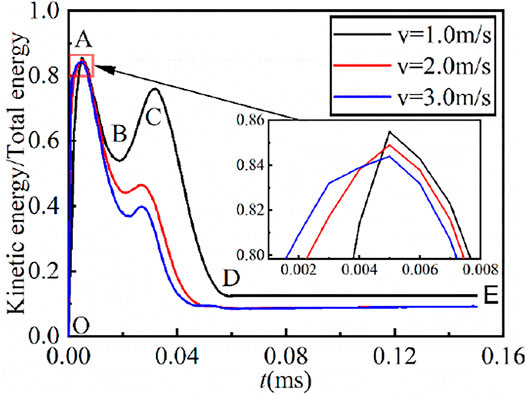
FIGURE 9. Time history curve of the ratio of internal energy to total energy of NSCB rock samples under different loading velocities.
Conclusion
Based on a self-developed dynamic damage model for rocks and element deletion technology, the NSCB test is numerically simulated, and the following conclusions are drawn in this study:
1) In the NSCB test, the loading velocity has an important influence on the damage of rock samples. With the increase of loading velocity, the damage range increases gradually.
2) The loading velocity has an important influence on the failure mode of straight notch semi-circular marble. With the increase of loading velocity, the flatness of cracks becomes worse and worse, and the stability of crack propagation becomes worse and worse. This is because the local high strain rate leads to the obvious randomness and uncertainty of crack activation in rocks.
3) Under different loading velocities, the evolution trends of total energy, kinetic energy, and internal energy of straight notch semicircular marble are similar. The damage range of marble can be evaluated by the stable value of internal energy. The larger the stable value is, the larger the damage range of marble is.
4) The energy evolution of marble under dynamic loading is obviously different from that under quasi-static loading. Under quasi-static loading, the total energy of marble in the initial stage is basically transformed into internal energy, and the internal energy of marble in the later stage is almost zero. Under dynamic loading, in addition to some of the total energy of marble in the initial stage being transformed into internal energy, some of it is also transformed into kinetic energy. The stable value of internal energy in the later stage is much greater than 0, indicating that a larger damage range can be caused under dynamic loading.
5) According to the ratio of internal energy to total energy, the deformation and failure process of straight notch semicircular marble under dynamic loading can be divided into five stages, namely, at the first stage, the energy ratio increases rapidly, and the rock sample collides with the incident rod at this stage; at the second stage, the energy ratio decreases rapidly, the rock sample begins to move, the kinetic energy and internal energy increase, and the increase rate of kinetic energy is greater than that of internal energy; at the third stage, the rock sample begins to crack and the crack extends to the loading point, but the crack does not reach the loading point. Both kinetic energy and internal energy increase, and the increase rate of internal energy is greater than that of kinetic energy; at the fourth stage, the energy ratio decreases gradually, the crack propagates further, the constraint of rock samples decreases, the kinetic energy increases, and the internal energy first increases and then decreases; at the final stage, the energy ratio is stable, the crack penetrates at this stage, the internal energy exists in the form of plastic deformation energy, and the kinetic energy tends to be stable (Friedman et al., 1972, Hu 2020, Rossmanith et al., 1997).
Data Availability Statement
The data supporting the conclusion of this article will be made available by the first author, without undue reservation.
Author Contributions
XH contributed to conceptualization, methodology, software, data curation, validation, writing—original draft, and funding acquisition. MD contributed to data curation, writing—review and editing, and funding acquisition. MT contributed to supervision, writing—review and editing, and funding acquisition. XZ contributed to writing—review and editing, and funding acquisition. MZ contributed to funding acquisition and writing—review and editing. WX contributed to writing—review and editing.
Funding
This work was supported by the University natural science research project of Anhui province (KJ2020A0324 and KJ2020A0325), Natural science foundation of Anhui province (1908085QE186), The open research fund of the state key laboratory of coal resources and safe mining (SKLCRSM21KF007), Talent introduction research start-up fund of Anhui university of science and technology (13200364 ), Collaborative innovation project of Universities in Anhui Province (GXXT-2020-056)and National natural science foundation of China (52074007 and 52074008), which are gratefully acknowledged.
Conflict of Interest
The authors declare that the research was conducted in the absence of any commercial or financial relationships that could be construed as a potential conflict of interest.
Publisher’s Note
All claims expressed in this article are solely those of the authors and do not necessarily represent those of their affiliated organizations, or those of the publisher, the editors, and the reviewers. Any product that may be evaluated in this article, or claim that may be made by its manufacturer, is not guaranteed or endorsed by the publisher.
References
Cai, X., Zhou, Z. L., Ma, D., Du, X. M., Chen, L., Wang, H. Q., et al. (2018). Water Saturation Effects on Dynamic Fracture Behavior of sandstone. Int. J. Rock. Mech. Mining. Sci. 114, 46–61. doi:10.1016/j.ijrmms.2018.12.014
Cai, X., Zhou, Z., Zang, H., and Song, Z. (2020a). Water Saturation Effects on Dynamic Behavior and Microstructure Damage of sandstone: Phenomena and Mechanismsffects on Dynamic Behavior and Microstructure Damage of sandstone: Phenomena and Mechanisms. Eng. Geology. 276, 105760. doi:10.1016/j.enggeo.2020.105760
Cai, X., Zhou, Z., Tan, L., Zang, H., and Song, Z. (2020b). Fracture Behavior and Damage Mechanisms of sandstone Subjected to Wetting-Drying Cycles. Eng. Fracture Mech. 234, 107109. doi:10.1016/j.engfracmech.2020.107109
Chen, R., Li, K., Xia, K., Lin, Y., Yao, W., and Lu, F. (2016). Dynamic Fracture Properties of Rocks Subjected to Static Pre-load Using Notched Semi-circular bend Method. Rock. Mech. Rock. Eng. 49 (10), 3865–3872. doi:10.1007/s00603-016-0958-4
Chen, R., Xia, K., Dai, F., Lu, F., and Luo, S. N. (2009). Determination of Dynamic Fracture Parameters Using a Semi-circular bend Technique in Split Hopkinson Pressure Bar Testing. Eng. Fracture Mech. 76 (9), 1268–1276. doi:10.1016/j.engfracmech.2009.02.001
Chong, K. P., and Kuruppu, M. D. (1984). New Specimen for Fracture Toughness Determination for Rock and Other Materials. Int. J. Fract. 26 (2), R59–R62. doi:10.1007/BF01157555
Dai, F., Chen, R., and Xia, K. (2010). A Semi-circular bend Technique for Determining Dynamic Fracture Toughness. Exp. Mech. 50 (6), 783–791. doi:10.1007/s11340-009-9273-2
Dai, F., Xia, K., and Nasseri, M. H. B. (2013). Micromechanical Model for the Rate Dependence of the Fracture Toughness Anisotropy of Barre Granite. Int. J. Rock Mech. Mining Sci. 63, 113–121. doi:10.1016/j.ijrmms.2013.08.011
Dai, F., and Xia, K. W. (2013). Laboratory Measurements of the Rate Dependence of the Fracture Toughness Anisotropy of Barre Granite. Int. J. Rock Mech. Mining Sci. 60, 57–65. doi:10.1016/j.ijrmms.2012.12.035
Dai, F., Xia, K., Zheng, H., and Wang, Y. X. (2011). Determination of Dynamic Rock Mode-I Fracture Parameters Using Cracked Chevron Notched Semi-circular bend Specimen. Eng. Fracture Mech. 78 (15), 2633–2644. doi:10.1016/j.engfracmech.2011.06.022
Dai, F., Xu, Y., Zhao, T., Xu, N.-w., and Liu, Y. (2016). Loading-rate-dependent Progressive Fracturing of Cracked Chevron-Notched Brazilian Disc Specimens in Split Hopkinson Pressure Bar Tests. Int. J. Rock Mech. Mining Sci. 88, 49–60. doi:10.1016/j.ijrmms.2016.07.003
Du, K., Li, X., Tao, M., and Wang, S. (2020). Experimental Study on Acoustic Emission (AE) Characteristics and Crack Classification during Rock Fracture in Several Basic Lab Tests. Int. J. Rock Mech. Mining Sci. 133, 104411. doi:10.1016/j.ijrmms.2020.104411
Du, K., Li, X., Wang, S., Tao, M., Li, G., and Wang, S. (2021). Compression-shear Failure Properties and Acoustic Emission (AE) Characteristics of Rocks in Variable Angle Shear and Direct Shear Tests. Measurement 183, 109814. doi:10.1016/j.measurement.2021.109814
Franklin, J. A., Sun, Z., Atkinson, B. K., Meredith, P. G., and Bobrov, G. F. (1988). Suggested Methods for Determining the Fracture Toughness of Rock. Int. J. Rock. Mech. Mining. Sci. 25 (2), 71–96. doi:10.1016/0148-9062(88)91871-2
Friedman, M., Handin, J., and Alani, G. (1972). Fracture-surface Energy of Rocks. Int. J. Rock Mech. Mining Sci. Geomechanics Abstr. 9 (6), 757–764. doi:10.1016/0148-9062(72)90034-4
Gao, G., Huang, S., Xia, K., and Li, Z. (2015a). Application of Digital Image Correlation (DIC) in Dynamic Notched Semi-circular bend (NSCB) Tests. Exp. Mech. 55 (1), 95–104. doi:10.1007/s11340-014-9863-5
Gao, G., Yao, W., Xia, K., and Li, Z. (2015b). Investigation of the Rate Dependence of Fracture Propagation in Rocks Using Digital Image Correlation (DIC) Method. Eng. Fracture Mech. 138, 146–155. doi:10.1016/j.engfracmech.2015.02.021
Hu, X. L. (2020). Study of Rock Dynamic Damage Model Based on Unified Strength Theory. PhD thesis. Beijing: University of Science and Technology Beijing.
Klepaczko, J. R., Bassim, M. N., and Hsu, T. R. (1984). Fracture Toughness of Coal under Quasi-Static and Impact Loading. Eng. Fracture Mech. 19 (2), 305–316. doi:10.1016/0013-7944(84)90025-0
Kourkoulis, S. K., and Markides, C. F. (2014). Fracture Toughness Determined by the Centrally Cracked Brazilian-disc Test: Some Critical Issues in the Light of an Alternative Analytic Solution. Matls. Perf. Charact. 3 (3), 20130056–20130086. doi:10.1520/MPC20130056
Kuruppu, M. D., Obara, Y., Ayatollahi, M. R., Chong, K. P., and Funatsu, T. (2014). ISRM-suggested Method for Determining the Mode I Static Fracture Toughness Using Semi-circular bend Specimen. Rock. Mech. Rock. Eng. 47 (1), 267–274. doi:10.1007/s00603-013-0422-7
Li, Y., Dai, F., Wei, M., and Du, H. (2020). Numerical Investigation on Dynamic Fracture Behavior of Cracked Rocks under Mixed Mode I/II Loading. Eng. Fracture Mech. 235, 1–17. doi:10.1016/j.engfracmech.2020.107176
Lim, I. L., Johnston, I. W., and Choi, S. K. (1993). Stress Intensity Factors for Semi-circular Specimens under Three-point Bending. Eng. Fracture Mech. 44, 363–382. doi:10.1016/0013-7944(93)90030-v
Nakano, M., Kishida, K., Yamauchi, Y., and Sogabe, Y. (1994). Dynamic Fracture Initiation in Brittle Materials under Combined Mode I/II Loading. J. Phys. IV France 04 (C8), C8–C695. doi:10.1051/jp4:19948106
Rossmanith, H. P., Daehnke, A., Nasmillner, R. E. K., Kouzniak, N., Ohtsu, M., and Uenishi, K. (1997). Fracture Mechanics Applications to Drilling and Blasting. Fatigue. Fract. Eng. M. 20 (11), 1617–1636. doi:10.1111/j.1460-2695.1997.tb01515.x
Shi, X., Yao, W., Liu, D. A., Xia, K., Tang, T., and Shi, Y. (2019). Experimental Study of the Dynamic Fracture Toughness of Anisotropic Black Shale Using Notched Semi-circular bend Specimens. Eng. Fracture Mech. 205, 136–151. doi:10.1016/j.engfracmech.2018.11.027
Tang, C., and Xu, X. (1990). A New Method for Measuring Dynamic Fracture Toughness of Rock. Eng. Fract. Mech. 35 (1-3), 783–791. doi:10.1016/0013-7944(90)90162-A
Wang, Q., Ni, M., Zhang, C., and Li, L. (2016). Clarification of Formulas for Stress Intensity Factor for DCDC Specimens. Int. J. Fract. 201 (2), 249–250. doi:10.1007/s10704-016-0144-4
Wei, M.-D., Dai, F., Xu, N.-W., Liu, Y., and Zhao, T. (2018a). A Novel Chevron Notched Short Rod bend Method for Measuring the Mode I Fracture Toughness of Rocks. Eng. Fracture Mech. 190, 1–15. doi:10.1016/j.engfracmech.2017.11.041
Wei, M.-D., Dai, F., Zhou, J.-W., Liu, Y., and Luo, J. (2018b). A Further Improved Maximum Tangential Stress Criterion for Assessing Mode I Fracture of Rocks Considering Non-singular Stress Terms of the Williams Expansion. Rock. Mech. Rock. Eng. 51, 3471–3488. doi:10.1007/s00603-018-1524-z
Wei, M.-D., Dai, F., Liu, Y., Xu, N.-W., and Zhao, T. (2018c). An Experimental and Theoretical Comparison of CCNBD and CCNSCB Specimens for Determining Mode I Fracture Toughness of Rocks. Fatigue Fract Eng. Mater. Struct. 41, 1002–1018. doi:10.1111/ffe.12747
Wei, M., Dai, F., Liu, Y., Li, A., and Yan, Z. (2021). Influences of Loading Method and Notch Type on Rock Fracture Toughness Measurements: From the Perspectives of T-Stress and Fracture Process Zone. Rock. Mech. Rock. Eng. 54, 4965–4986. doi:10.1007/s00603-021-02541-9
Xia, K., and Yao, W. (2015). Dynamic Rock Tests Using Split Hopkinson (Kolsky) Bar System - A Review. J. Rock Mech. Geotechnical Eng. 7 (1), 27–59. doi:10.1016/j.jrmge.2014.07.008
Xing, H. Z., Zhang, Q. B., Braithwaite, C. H., Pan, B., and Zhao, J. (2017). High-speed Photography and Digital Optical Measurement Techniques for Geomaterials: Fundamentals and Applications. Rock. Mech. Rock. Eng. 50 (6), 1611–1659. doi:10.1007/s00603-016-1164-0
Xu, Y., Zhang, J. C., Yao, W., and Xia, K. W. (2018). Experimental Study of Dynamic Fracture Energy Anisotropy of Granitic Rocks. Chin. J. Rock. Mech. Eng. 37 (S1), 3231–3238.
Yao, W., and Xia, K. (2019). Dynamic Notched Semi-circle bend (NSCB) Method for Measuring Fracture Properties of Rocks: Fundamentals and Applications. J. Rock Mech. Geotechnical Eng. 11 (5), 1066–1093. doi:10.1016/j.jrmge.2019.03.003
Yao, W., Xia, K., and Zhang, T. (2019). Dynamic Fracture Test of Laurentian Granite Subjected to Hydrostatic Pressure. Exp. Mech. 59 (2), 245–250. doi:10.1007/s11340-018-00437-4
Yao, W., Xu, Y., Liu, H.-W., and Xia, K. (2017). Quantification of Thermally Induced Damage and its Effect on Dynamic Fracture Toughness of Two Mortars. Eng. Fracture Mech. 169, 74–88. doi:10.1016/j.engfracmech.2016.11.018
Yin, T., Li, X., Xia, K., and Huang, S. (2012). Effect of thermal Treatment on the Dynamic Fracture Toughness of Laurentian Granite. Rock. Mech. Rock. Eng. 45 (6), 1087–1094. doi:10.1007/s00603-012-0240-3
Yin, Z. Q., Ma, H. F., Ma, H. F., Hu, Z. X., and Zou, Y. (2014). Effect of Static - Dynamic Coupling Loading on Fracture Toughness and Failure Characteristics in Marble. J. Eng. Sci. Tech. Rev. 7 (2), 169–174. doi:10.25103/jestr.072.25
Zhang, Q. B., and Zhao, J. (2013). Determination of Mechanical Properties and Full-Field Strain Measurements of Rock Material under Dynamic Loads. Int. J. Rock Mech. Mining Sci. 60 (8), 423–439. doi:10.1016/j.ijrmms.2013.01.005
Zhang, Q. B., and Zhao, J. (2014). Quasi-static and Dynamic Fracture Behaviour of Rock Materials: Phenomena and Mechanisms. Int. J. Fract. 189 (1), 1–32. doi:10.1007/s10704-014-9959-z
Zhao, Y., Gong, S., Hao, X., Peng, Y., and Jiang, Y. (2017). Effects of Loading Rate and Bedding on the Dynamic Fracture Toughness of Coal: Laboratory Experiments. Eng. Fracture Mech. 178, 375–391. doi:10.1016/j.engfracmech.2017.03.011
Zhou, X. P., Yang, H. Q., and Zhang, Y. X. (2009). Rate Dependent Critical Strain Energy Density Factor of Huanglong limestone. Theor. Appl. Fracture Mech. 51 (1), 57–61. doi:10.1016/j.tafmec.2009.01.001
Zhou, Y. X., Xia, K., Li, X. B., Li, H. B., Ma, G. W., Zhao, J., et al. (2012). Suggested Methods for Determining the Dynamic Strength Parameters and Mode-I Fracture Toughness of Rock Materials. Int. J. Rock Mech. Mining Sci. 49 (1), 105–112. doi:10.1016/j.ijrmms.2011.10.004
Keywords: numerical simulation, notched semi-circle bend test, dynamic damage model, stain rate, energy evolution, failure mode
Citation: Hu X, Duan M, Tu M, Zhang X, Zhang M and Xu W (2022) Numerical Simulation of Rock Dynamic NSCB Test Based on a Self-Developed Dynamic Damage Model. Front. Earth Sci. 9:791180. doi: 10.3389/feart.2021.791180
Received: 08 October 2021; Accepted: 31 December 2021;
Published: 25 January 2022.
Edited by:
Kun Du, Central South University, ChinaReviewed by:
Mingdong Wei, Nanyang Technological University, SingaporeXin Cai, Central South University, China
Copyright © 2022 Hu, Duan, Tu, Zhang, Zhang and Xu. This is an open-access article distributed under the terms of the Creative Commons Attribution License (CC BY). The use, distribution or reproduction in other forums is permitted, provided the original author(s) and the copyright owner(s) are credited and that the original publication in this journal is cited, in accordance with accepted academic practice. No use, distribution or reproduction is permitted which does not comply with these terms.
*Correspondence: Minke Duan, ZHVhbm1pbmtlQGF1c3QuZWR1LmNu