- School of Geography and Tourism, Shaanxi Normal University, Xi’an, China
The Sahara Desert is the largest source of dust on Earth, and has a significant impact on global atmospheric changes. Wind is the main dynamic factor controlling the transport and intensity of dust in the Sahara Desert. This study comprehensively analyzed the spatial and temporal variation in the wind regime of the Sahara Desert from 1980 to 2019 using data from 17 meteorological stations to improve awareness of global atmospheric changes and the intensity of regional aeolian activities. All wind speed parameters decreased from northwest to southeast. While there were significant differences in the trends of temporal variation in wind speed among the different regions, there was an overall decreasing trend across the Sahara Desert, with an average wind speed of 0.09 m s−1 10 a−1. This decrease was closely related to wind frequency. The easterly, westerly, and northerly winds dominated, with more complex wind direction in the northern region. Seasonal differences in wind direction were observed in all regions. The wind direction frequency of wind speeds >6 m s−1 exceeded those with wind speeds <6 m s−1 in the western and northern regions, whereas other regions showed an opposite pattern. The highest drift potential (DP) and resultant drift potential (RDP) were found in the western and northern regions, and during spring and winter. There was a trend of decreasing annual variation in DP and RDP in all regions. The directional variability (RDP/DP) indicated mostly intermediate and high variability in wind direction. Resultant drift direction (RDD) indicated that a mainly southwest wind direction. No apparent trends in temporal variation in RDD and RDP/DP were observed. Total DP was strongly influenced by DP and the magnitude and frequency of strong winds in the prevailing wind direction. No strong correlation between wind regimes and dune types was observed in this desert, indicating the complexity of factors affecting dune morphology.
1 Introduction
Desert areas account for approximately one third of the Earth’s surface. Wind is the main atmospheric circulation factor and is a dynamic condition driving the formation of deserts (Lancaster, 1995; Livingstone and Warren, 1996; Dong et al., 2009). The Sahara Desert is the Earth’s largest desert, and the greatest provider of global atmospheric dust due to its arid climate, strong aeolian activity, and widely distributed aeolian sediments (Kottek et al., 2006; Tanaka and Chiba, 2006). The Sahara Desert has a significant impact on changes to global atmospheric environment, global soil sediment cycling, and the ecological environment of the African and the Atlantic coasts (Haywood et al., 2003; Jickells et al., 2005; Maher et al., 2010; Yu et al., 2015). Therefore, the study of changes in the near-surface wind regimes of the Sahara Desert is of practical significant. To date, there have been relatively few reports on the wind environment of the Sahara Desert, which have mainly focused on two aspects: 1) the relationship between the wind environment and dune types, dune distribution patterns, and sand transport (Moulin et al., 1997; Prospero, 1999; Prospero and Lamb, 2003; Hereher, 2010; Taniguchi et al., 2012; Hereher, 2014; Hamdan et al., 2016; Gao and Qu, 2018; Hereher, 2018; Lamancusa and Wagstrom, 2019; Pan, 2020; Hu et al., 2021); 2) the connection between wind speed and dust emissions, precipitation, wind shear index, aerosol optical depth, and the effect of wind speed on wind energy resources (Knippertz and Todd., 2010; Boudia et al., 2013; Kim et al., 2017; Matthew and Ayoola, 2020; Pan, 2020; Qiao, 2020; Di et al., 2021). In addition, these studies mostly focused on local areas within the Sahara Desert, and there have been few studies of wind environment of the entire desert. For example, Hu et al. (2021) analyzed the wind regimes in the western Sahara Desert using data from the ERA5 reanalysis assimilated dataset. Their results suggest the presence of significant spatial variations in wind regimes in this region, and that spatial patterns of dune morphology are closely correlated with the wind regimes and sand availability. Hereher (2018) analyzed the wind environment in the Egyptian desert based on the wind data of twelve meteorological stations. The results of their study showed a good correlation between wind regimes and dune types in this region. Shi et al. (2020) analyzed the wind regimes in the regions of coexisting dunes in the Sahara Desert. The aforementioned studies also mainly focused on variations in wind speed and wind direction over short time periods. For example, Zhou et al. (2015) analyzed the spatial and temporal variation in the wind speed and wind direction of the Mauritania region of the Sahara Desert. Farouk et al. (2011) and Boudia et al. (2013) recalculated the wind speed in the Algerian region using measured data. Matthew and Ayoola (2020) studied the spatial distribution of wind speed and the relationship between wind speed and precipitation in western Africa. There have been relatively few studies on the overall wind regimes of the Sahara Desert over long time periods. In particular, there has been little analysis of the drift potential and related parameters. Further knowledge on these parameters is needed to further studies on the intensity of aeolian activity and aeolian geomorphological patterns.
The present study analyzed the temporal and spatial changes in the wind speed, wind direction, drift potential and related variables in the Sahara Desert from 1980 to 2019 using wind data collected by 17 meteorological stations. Using the results, the possible reasons for the changes and the relationship between the wind regime and the dune types were explored. The results of current study can improve awareness of variations in the wind regime and can provide a theoretical basis for exploring the evolution of aeolian geomorphology in the Sahara Desert. The results of the current study are also of relevance for providing a scientific basis for the evaluation of the intensity of aeolian activity, measures to control and mitigate aeolian hazards, and the reasonable utilization of wind energy resources in the Sahara Desert.
2 Physiographic Setting
The Sahara Desert (10°N–35°N, 17°33′W–40°E) stretches across northern Africa. The desert is bounded by the Mediterranean Sea to the north and the Sudanese Plateau to the south. It stretches to the Atlantic Ocean and the Red Sea to the west and east, respectively (Figure 1). The Sahara Desert is the world’s largest desert, with an area of ∼900 × 104 km2, accounting for almost one-third of the area of Africa (Qiao, 2020). The dominant dune types in the desert are barchan, linear, and transverse dunes, and star and reticulate dunes are also found in some areas. The desert is characterized by strong aeolian activity and ∼58% of global dust emissions originate from the desert, with this dust distributed across both in the ocean and land (Tanaka and Chiba, 2006). The Sahara Desert has a typical tropical desert climate of a prevailing downdraft and arid climate, regulated throughout the year by the subtropic anticyclone zone. The annual average temperature of the Sahara Desert exceeds 20°C. The maximum ground temperature of 50°C occurs in the central desert during July, with temperature gradually decreasing towards the near seaside. Annual average precipitation of the desert is less than 100 mm, with most rainfall occurring in April to September, and rainfall decreasing from south to north and coast to inland (Liu et al., 1988). The soil types of the Sahara Desert include red, brown-red, brown, grey-yellow, meadow, and meadow swamp soils. The low vegetation cover of the desert is found only in a scattered distribution near mountains, oases, low-lying areas, and dry streambeds, and is dominated by the drought-tolerant plants such as Acacia tree, Palm and Date palm (Yuan, 2003).
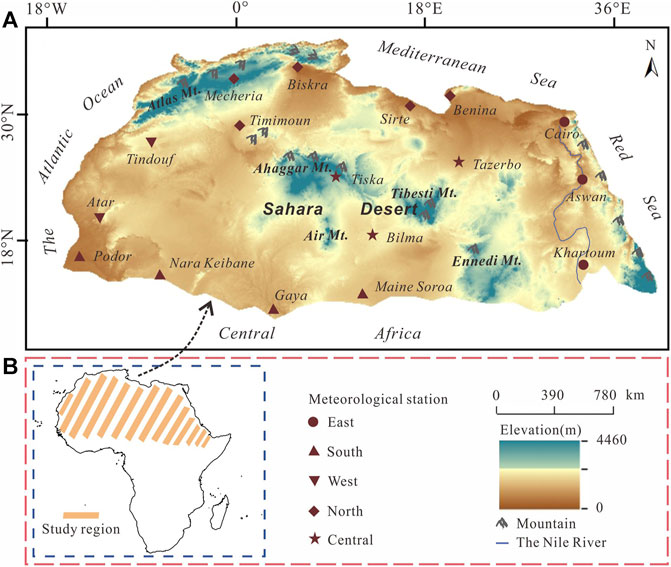
FIGURE 1. Geographical location of the Sahara Desert. (A) Distribution of meteorological stations in the Sahara Desert. (B) The site of the Sahara Desert in Africa.
3 Data and Methods
The present study used data measured by 17 meteorological stations scattered throughout the Sahara Desert to cover as much of the desert area as possible (Figure 1). The daily wind data of each station were retrieved from the Integrated Surface Database (ISD) of the National Oceanic and Atmospheric Administration (NOAA) National Climatic Data Center (NCDC, http://gis.ncdc.noaa.gov/maps/ncei/cdo/hourly). The obtained wind data of at least 40-years duration were continuous and accurate. The wind data included daily average wind speed and wind direction, measured at height from the ground of 10 m. The wind speed measurements obtained at 03:00, 09:00, 15:00, and 21:00 local time were averaged to obtain the daily mean wind speed. The present study selected data from 1980 to 2019 to ensure continuity and consistency among the stations. To study seasonality, the data were divided into four seasons, with spring, summer, autumn and winter extending from March to May, June to August, September to November, and December to February, respectively. The Sahara Desert has a wide areas and the wind environment is different in the local regions. To obtain a more in-depth and logical comparative analysis of the wind environment in the Sahara Desert, it is necessary to divide the region into subregions. The 17 stations were assigned into five subregions based on geographic orientation. In previous studies, Plateau Mountain regions such as the Ahaggar Mountain, Air Mountain, Tibesti Mountain were classified as the central region of the Sahara Desert (16°N–26°N, 3°E–23°E) (Pan, 2020). This paper takes this central region as the central point, defines East (10°N–35°N, 23°E–40°E), South (10°N–16°N, 17°W–40°E), West (16°N–26°N, 17°W–3°E), North (26°N–35°N, 17°W–23°E), Central (16°N–26°N, 3°E–23°E) (Figure 1).
The changes in the wind environment were described mainly by the mean wind speed. Mean wind speed was characterized using three variables (Table. 1): 1) total wind speed, which refers to all wind speeds measured during the entire study period; 2) sand-driving wind speed, indicating wind with sufficient speed to mobilize sand; 3) frequency of sand-driving wind (wind frequency), representing the proportion of time across the entire study period that sand-driving wind was recorded.
The evaluation variables were calculated according to the methods of Fryberger and Dean (1979) and were used to evaluate the wind energy environment. These variables included drift potential (DP), resultant drift potential (RDP), resultant drift direction (RDD), and directional variability (RDP/DP). The values of DP and RDP were calculated directly based on the four original wind speed observations.
In Eq. 1, U represents wind speed (knots) at 10 m height from the ground, Ut represents threshold wind velocity (knots) at 10 m height from the ground, and t refers to the number of occurrences of wind speed V as a percentage of the total number of observations. Field measures of threshold wind velocity were not available. Therefore, the present study adopted the widely accepted threshold wind velocity of 6 m/s (Bagnold, 1941; Fryberger and Dean, 1979; Sherman et al., 2013).
DP refers to the relative rate of drift over a certain period, and was used to indicate the potential for each wind direction to transport sediment and to reflect the main sediment transport directions. RDP indicates the net drift potential and was obtained by vector summation of the values of DP from all directions. RDD reflects the direction in which sand was transported by wind. RDP/DP indicates directional variability and drift direction. These variables are typically represented by a wind rose diagram, with the size of the arrow representing the relative value of DP in that direction. More detail on the calculation and classification methods used can be found in Fryberger and Dean (1979) and Zhang et al. (2015).
4 Results
4.1 Spatial and Temporal Variation in Wind Speed
4.1.1 Spatial Variation in Wind Speed
Wind speed strongly affects the intensity of aeolian activity and dune morphology (Wu, 2010). Three wind speed variables, namely total wind speed, sand-driving wind speed, and wind frequency, are of importance for assessing the intensity of aeolian activity. Analysis of the annual mean wind speed data, indicated significant regional differences in the three wind speed variables, with the values of these variables generally decreasing from northwest to southeast (Table.1).
Total wind speed and wind frequency in the western region exceeded that in the central region, whereas there was no significant difference in sand-driving wind speed between the western and central regions. This indicates that the sand-driving wind speed does not fully reflect the overall changes in wind speed. In addition, besides for in the southern area, the maximum values of all wind speed variables generally occurred during spring, whereas the minimum values of the different variables occurred across different seasons. The minimum sand-driving wind speeds occurred during summer and autumn, whereas the minimum total wind speed and wind frequency were observed in autumn. In general, there was relatively consistent seasonal variation in wind frequency and total wind speed, whereas there were differences in seasonal variation in sand-driving wind speed. This suggests that the magnitude of the total wind speed may be closely related to variation in the wind frequency.
4.1.2 Temporal Variation in Wind Speed
There were obvious decreasing trends in the overall wind speed variables from 1980 to 2019 (Figure 2A). However, the trend in three wind speed variables varied among the desert regions (Figures 2B–F). More specifically, trends of decreasing total wind speed were observed in the eastern, southern, and central regions, with the largest rate of decrease observed in the southern region (0.39 m s−1 10a−1). The western and northern regions showed slightly increasing trends in total wind speed, with the maximum rate of increase in wind speed noted the northern region (0.15 m s−1 10a−1). Besides for the southern region, total wind speed decreased from 1980 to 2001, after which it showed a fluctuating increase from 2001 to 2019. The maximum rate of increase in total wind speed occurred in the central region (0.81 m s−1 10a−1); decreasing trends in sand-driving wind speed appeared in the eastern, western and central regions, with the greatest rate of increase in the central region (0.36 m s−1 10a−1). Trends of increasing sand-driving wind speed were evident in the southern and northern regions, with that in the southern region more significant (0.2 m s−1 10a−1). Besides for in the eastern region, annual variation in sand-driving wind speed showed an opposite trend to total wind speed, with an increasing trend from 1980 to 1999 and a significantly decreasing trend from 2000 to 2019, with the largest rate of decrease in the southern region (0.76 m s−1 10a−1). However, the annual trend in wind frequency was generally consistent with that of total wind speed.
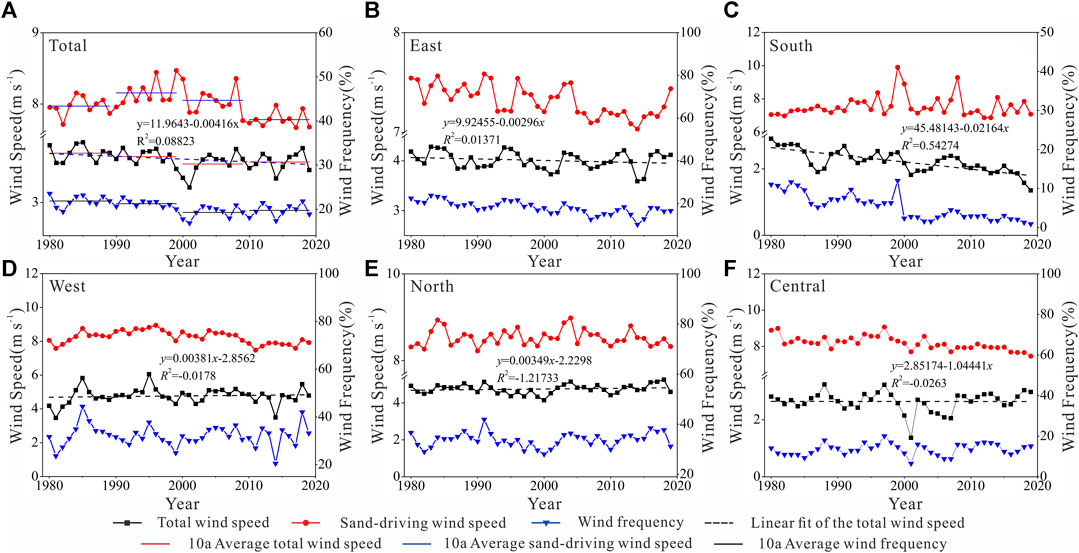
FIGURE 2. The temporal variations of wind speed variables (1980–2015) in various regions of the Sahara Desert.
The seasonal variation in the total wind speed across the entire desert showed a significant decreasing trend (Figures 3A–D), with the largest and smallest rates of decrease occurring in spring (0.11 m s−1 10a−1) and summer (0.03 m s−1 10a−1), respectively. However, there were seasonal difference in changes to total wind speed among the different regions. Specifically, there was a decreasing trend in total wind speed across all seasons in the southern region, with the maximum and minimum rates of 0.47 m s−1 10a−1 and 0.3 m s−1 10a−1 occurring in summer and autumn, respectively. There were both increasing and decreasing trends in the seasonal variation in total wind speed in the other regions, occurring during different seasons among the different regions. The greatest and weakest decreasing trends in sand-driving wind speed across the entire desert occurred in spring (0.08 m s−1 10a−1) and summer (0.027 m s−1 10a−1), respectively. However, there were seasonal differences in the trends of sand-driving wind speed among the different regions. There was a decreasing trend in sand-driving wind speed across all seasons in the central region, with the largest and smallest rates of decrease occurring in autumn (0.39 m s−1 10a−1) and spring (0.3 m s−1 10a−1), respectively, whereas there were both increasing and decreasing trends in the other regions. The trends in wind frequency across the entire desert and in each region were generally consistent with those of total wind speed. Although there was a slight increase in wind frequency across all seasons in the 21st century, there remained an overall decreasing trend, with the most obvious rate of decrease in spring and winter.
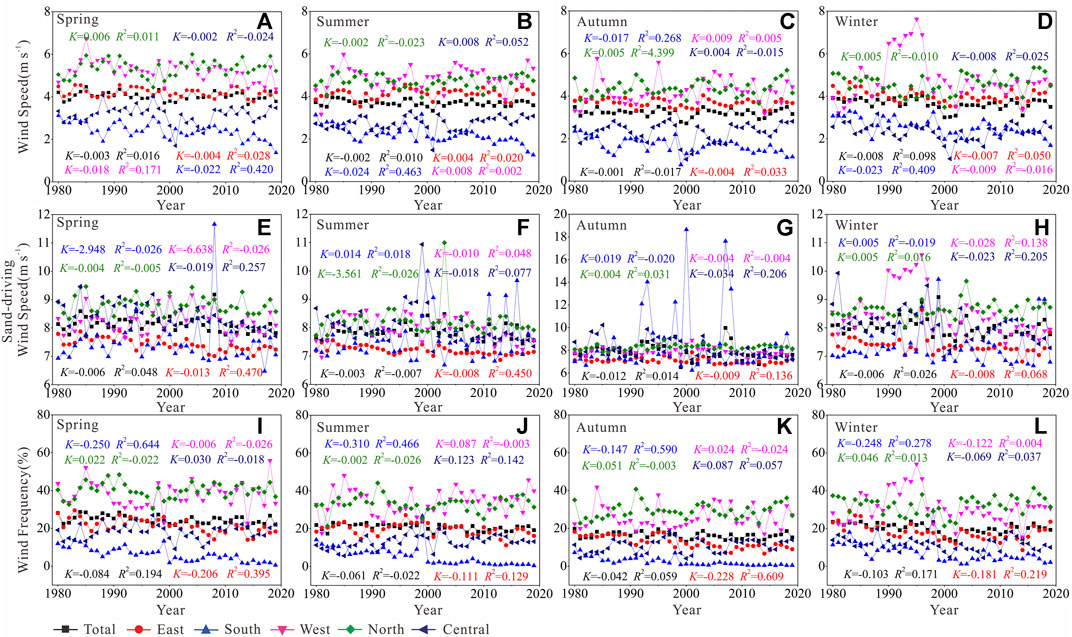
FIGURE 3. Seasonal variations in wind parameters in various regions of the Sahara Desert. R2 represents the regression goodness of fit; K is the slope of the linear regression equation and refers to the trends of wind speed parameters.
4.2 Spatial and Temporal Variation in Wind Regimes
4.2.1 Spatial Variation in Wind Regimes
The wind energy environment varied among the five regions (Figure 4). DP was below 200 VU in the eastern and southern regions, indicating a low wind energy environment in these two regions. DP in the western and northern regions exceeded 400 VU, indicating a high wind energy environment. DP of between 200 and 400 VU in the central region indicated an intermediate wind environment. The spatial variation in RDP was similar to that of DP, and was largest in the western and northern regions. An analysis of RDD showed that the movement of sand from the north to south occurs in a clockwise direction from south-southwest to southwest, whereas movement of sand from the west to east occurs in an anticlockwise direction from west-southwest to southeast. The minimum RDP/DP of less than 0.3 occurred in the northern region, representing complex or obtuse bimodal wind regimes, whereas obtuse and acute bimodal wind regimes occurred in the other regions due to RDP/DP ranging between 0.3 and 0.8.
The present study analyzed the data collected by the 17 meteorological stations to further clarify the desert wind regimes (Figure 5). The station data indicated a high wind energy environment in the western and northern regions, particularly at the Benina station (DP = 1382 VU). Besides for the area monitored by the Khartoum station, a low wind energy environment occurred in the eastern and southern areas, with the smallest at Nara Keibane station (DP = 99 VU). Besides for the region monitored by the Bilma station, an intermediate wind energy environment existed in the central region. Overall, Kriging interpolation of DP clearly indicated a general decreasing trend from northwest to southeast (Figure 4). RDP exceeded 200 VU at all stations in the western and northern regions, with the maximum at the Tindouf station (677 VU), whereas RDP was below 200 VU at all other stations, with the smallest in the southern regions, and particularly at the region monitored by the Gaya station (29 VU). Although RDP/DP ranged between 0.2 and 0.82, most of the stations showed an intermediate and high directional variability. The highest directional variability was observed at the Tiska station, whereas the lowest was measured at the Bilma and Aswan stations. RDD suggested that 71% of sediment transport moves in a southwest direction, with the remainder moving southeast. RDP/DP and RDD indicated relatively consistent variability in wind direction and sand transport direction in this desert.
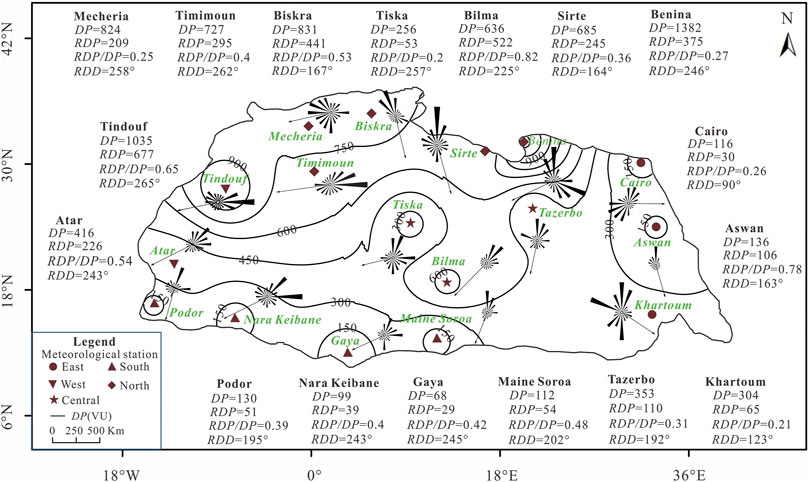
FIGURE 5. Wind regimes at 17 meteorological stations in the Sahara Desert, and the isoline lines of DP values counted by kriging interpolation.
4.2.2 Temporal Variation in Wind Regimes
Wind regime data of all regions indicated that besides for RDP in the western region, DP and RDP in the Sahara Desert decreased from 1980 to 2019 (Figure 6). The change in RDP/DP was the smallest in the northern region, with annual values of 0.26 ± 0.08. A distinct change in RDP/DP occurred in the central region, with an annual value of 0.44 ± 0.2. There were significant increases in RDP/DP in the western and southern regions (R2 = 0.19, p < 0.01 and R2 = 0.04, p < 0.05, respectively), indicating a gradual shift in the directions of sand drift to a single direction. There was a significant decrease in RDP/DP at the central region (R2 = 0.34, p < 0.01), indicating that the direction of sand drift gradually shifted to multiple directions. RDP/DP in the eastern region first increased (R2 = 0.13, p < 0.05) and then decreased (R2 = 0.19, p < 0.01), suggesting a significant change in the direction of sand drift. The minimum change in RDD of 258° ± 11° occurred in the western region. Variation in RDD was moderate in the northern and central regions, at 191° ± 33°and 218° ± 39°, respectively. Variation in RDD was largest in the eastern and southern regions, at 162° ± 44° and 204° ± 42°, respectively, demonstrating that the direction of sand drift in these two regions was more complex.
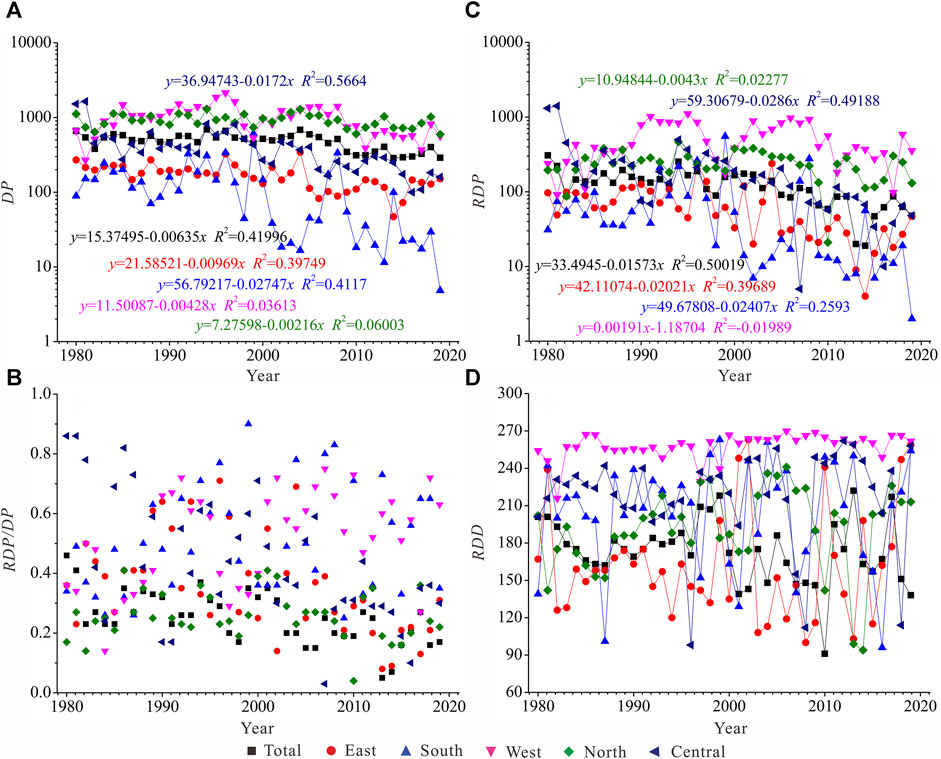
FIGURE 6. Temporal variation of wind environment in different regions of the Sahara Desert from 1980 to 2019.
These variables showed similar changes (Figure 6). For instance, changes to DP in the eastern region showed significant positive correlations with that in the central and northern regions (R2 = 0.51 and 0.42, p < 0.01, respectively) and with that in the western and northern areas (R2 = 0.48, p < 0.01). Besides for variation in RDP/DP in the western region being strongly negatively correlated to that in the central region (R2 = −0.44, p < 0.01), there were no correlations in the variation in RDP/DP among the other regions. There were no significant correlations in RDD and RDP among the regions. These characteristics suggested that there are both differences and similarities in changes in the wind energy environment among the desert regions, with the driving forces of changes to the wind energy environment more similar in the eastern and central regions.
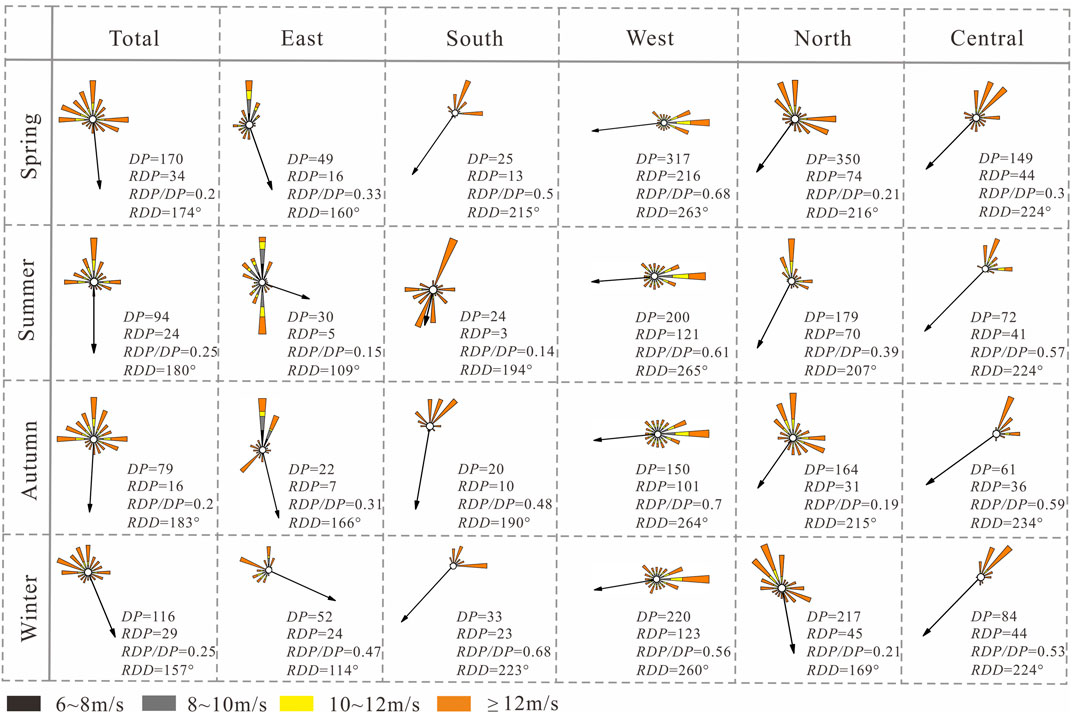
The present study also identified the seasonal variation in the wind regimes of the Sahara Desert (Figure 7). The highest DP and RDP across all seasons occurred in the western and northern regions. Besides for RDP in the western and central regions, the highest DP and RDP were found during spring and winter. There were significant differences in seasonal variation in RDP/DP among the different regions, with the maximum and minimum RDP/DP in the eastern and southern regions occurring in summer and winter, respectively, whereas the maximum and minimum RDP/DP in the northern and central areas occurred during spring and summer, respectively. In addition, the western region is characterized by the lowest and highest RDP/DP values in spring and winter, respectively. Differences in the seasonal variation in RDD were also observed among the different regions. RDD in the eastern regions was characterized as south-southeast during spring and autumn and east-southeast during summer and autumn. RDD in the southern region was characterized as southwest during winter and rotated counterclockwise towards the south by autumn. RDD in the northern region was characterized as southwest during spring and moved counterclockwise towards the south-southeast by winter. RDD was relatively consistent across all seasons in the western and central regions, characterized as east-southeast and southwest, respectively.
4.3 Temporal and Spatial Variation in Wind Direction
4.3.1 Spatial Variation in Wind Direction
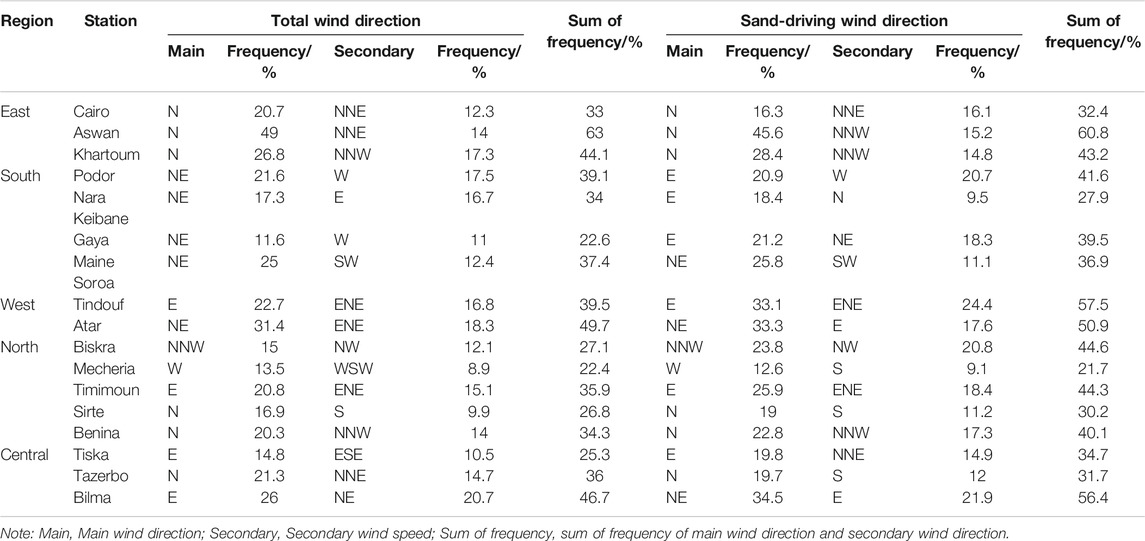
There were obvious differences in wind direction among the different desert regions (Table 2). In terms of total wind directions, northerly wind mainly occurred in the eastern and northern regions, northeasterly wind prevailed in the southern region, easterly and east-northeasterly winds dominated the western region, and easterly wind dominated the central region. In addition, the sum of the main and secondary wind direction frequencies was inversely proportional to the complexity of the wind regimes (Dong, 2011). Therefore, given the smallest sum of the frequencies in the main and secondary wind directions, the wind regimes in the northern region were more complex. The main direction of the sand-driving winds in the eastern region was north, whereas the secondary direction was mainly north-northwest and accounted for a small proportion of all winds. The main direction of the sand-driving wind in the southern region was east, whereas the secondary winds blew towards the north and west. In addition, there was less of a difference between the frequencies of the main and secondary wind directions. The main and secondary directions of the sand-driving wind in the western region were east and east-northeast, respectively, whereas the angle between the main and secondary wind directions was acute. The northern regions showed complex wind directions, featuring almost all wind directions. The main direction of the sand-driving wind in the northern region was north, whereas there were diverse and complex secondary wind directions. The main and secondary direction of the sand-driving winds at the central region were east and north, respectively. In general, besides for at the Mecheria stations, the main wind directions for total wind and sand-driving wind were north, east, or northeast, whereas there were differences in secondary wind direction among the different stations.
4.3.2 Temporal Variation in Wind Direction
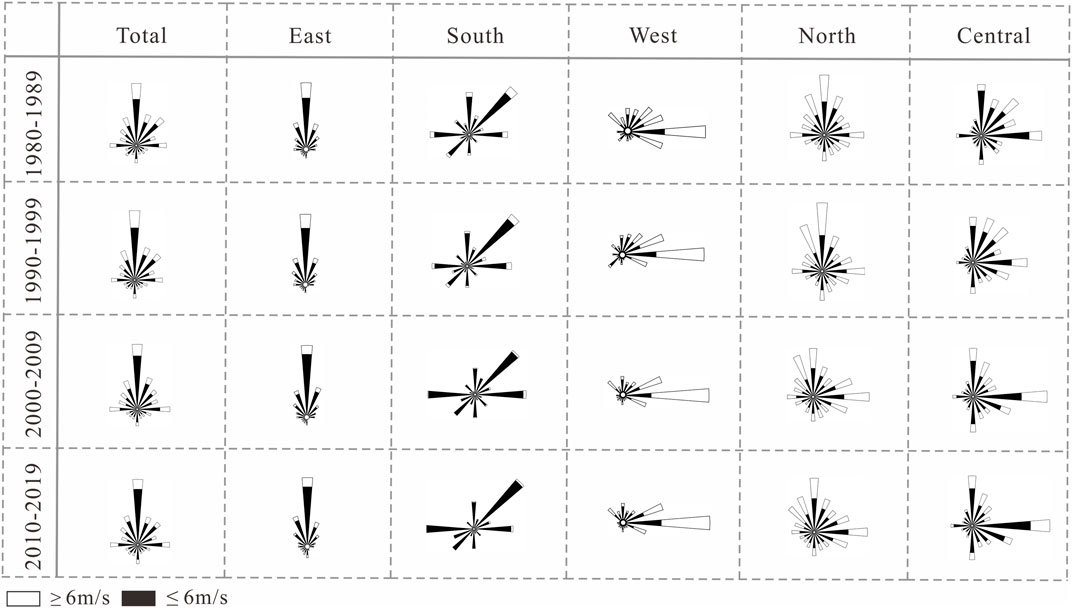
Figure 8 shows the annual variation in wind direction among the regions of the Sahara Desert. In terms of total wind direction, the main wind direction remained consistent over the study period, whereas there were differences in secondary wind direction. The main direction of wind in the eastern region was north, with the frequency of this wind decreasing from 2010 to 2019, whereas the secondary wind directions were north-northeast and north-northwest. The main wind direction in the southern region was northeast and the frequency of this wind direction decreased from 2000 to 2009. In contrast, the secondary wind directions were different among the different study periods. The main and secondary wind directions were east and east-northeast, respectively, and the frequencies of both winds increased from 1980 to 2019. The main direction of wind in the northern region was north and the frequency of this wind direction increased from 1980 to 1999, following which it decreased. In contrast, the secondary wind direction was north-northwest from 1980 to 1999, following which it changed to east. The main wind direction of wind in the central region was east and the frequency of this wind decreased from 1990 to 1999, following which it increased. However, the secondary wind direction was north, besides for during 1990–1999 when it was north-northeast. Besides for in the eastern region, there were differences in the main and secondary directions of sand-driving wind among the different study periods. The main wind direction in the southern region from 1980 to 1999 was northeast, following which it changed to east. In contrast, the secondary wind direction showed an opposite pattern. The main wind direction in the western region was east, whereas the secondary wind direction from 1980 to 1989 was east-southeast, following which it changed to east-northeast. The main wind direction in the northern region from 1980 to 1999 was north, following which it changed to northwest, whereas the secondary wind direction was north-northwest besides for a northly wind from 2010 to 2019. The main wind direction in the central region from 1980 to 1999 was northeast, following which it changed to north and the frequency of this wind direction gradually decreased. The secondary wind direction from 1980 to 1999 was east, following which it changed to north-northeast and north.
Figure 9 shows the seasonal changes in wind direction across all regions of the Sahara Desert. For all wind directions, the main direction of wind in the eastern region was north, whereas the secondary direction in spring and autumn was north-northeast, whereas in summer and winter it was north-northwest. The main direction of wind in the southern region was northeast, besides for during summer when it was west. In addition, there were seasonal differences in the secondary wind direction. The main and secondary wind directions in the western region were east and east-northeast, respectively. The main wind direction in the northern area was north, whereas the secondary wind direction was east, besides during winter. The main wind direction in the central area was east, whereas the secondary wind direction was north, besides for during autumn when it changed to east-southeast. The main and secondary directions of sand-driving wind in the southern region during spring and winter were northeast and east, respectively, whereas they were west and southwest during summer, and east and northeast during autumn, respectively. There were consistent seasonal changes in the main and secondary directions of sand-driving wind and all wind in the eastern and western regions. The main and secondary wind directions in the northern region in spring and winter were north-northwest and north, whereas during summer they were north and east, and during autumn they were north and north-northwest, respectively. The main wind direction in the central region was east, besides for during winter when it was northeast, whereas the secondary wind direction in spring and winter was north, whereas it was north-northeast during summer and autumn.
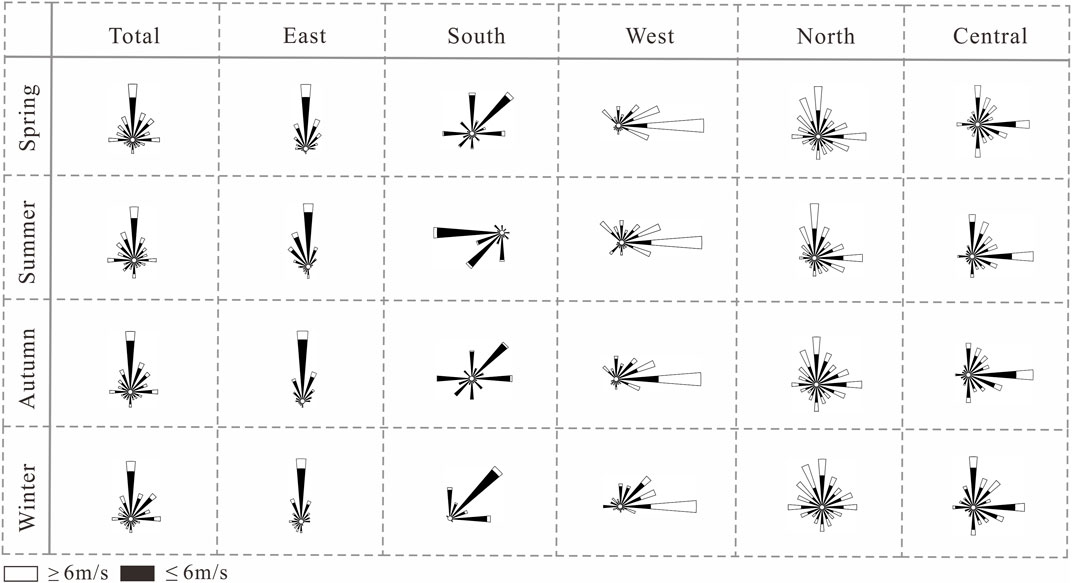
FIGURE 9. Seasonal variation of the wind direction among the different regions in the Sahara Desert.
5 Discussion
5.1 Variation in the Wind Environment
The present study analyzed the near-surface wind regimes of the Sahara Desert using the wind energy environment evaluation method by Fryberger and Dean (1979). The results showed a decreasing trend in mean wind speed from northwest to southeast. Many factors may have contributed to this result. In general, the influence of topography on wind is clear and complex, particularly for wind speed and wind direction (Feng, 2016). The topography relief is a macroscopic indicator that describes the regional topographic features. Therefore, in the present study, the topographic relief features of this desert were obtained by extracting the digital elevation model (DEM) using ArcGIS (Figure 10). A study by Cui et al. (2017) on the wind regimes of the northern deserts of China found that high wind speeds in open and flat terrain, were associated with lower topographic relief. In contrast, the opposite was true for low wind speed, due to the wind blocking effects of geographic obstacles. Figure 10 shows the higher topographic relief and relatively lower mean wind speed in the central and eastern regions of the Sahara Desert, and particularly in the central part. This result can be attributed to the distributed of several mountain ranges in the central and eastern region of the Sahara Desert, resulting in a gradual weakening of the airflow by the blocking effect of the mountains. Higher topographic features are also found around the Mecheria meteorological station in the northern region of the Sahara Desert, although the mean wind speed of this region is relatively high. This result can be attributed to the station falling within a mountain valley, with the pipe effect of the mountains increasing airflow in the area. The relatively higher wind speeds measured by the remaining stations in the northern region and all stations in the western region can be attributed to relatively lower topographic features. Since wind speed in the southern region remains relatively low despite the presence of low topographic features, the wind speed may be more influenced by other factors in this region. Previous studies have suggested that vegetation can effectively reduce and attenuate wind speed to a certain extent (Vautard et al., 2010; Wever, 2012). The southern region of the Sahara Desert is a transition zone between a tropical desert climate and a savannah climate characterized by a humid climate, high humidity, and high vegetation coverage (Qiao, 2020). Therefore, this region has a lower mean wind speed. In summary, the influence of topography on wind speed is complex, with the variation in wind speed often influenced by a combination of multiple factors, such as topography and vegetation cover.
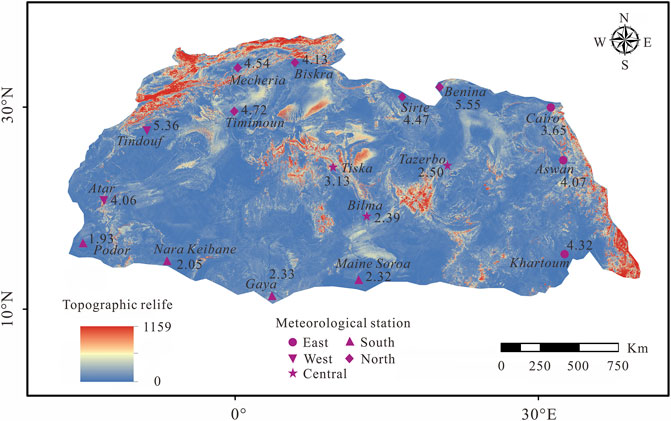
FIGURE 10. The Topographic relief of Sahara Desert (The numbers in the graph are the mean wind speed values).
Annual changes to the mean wind speed showed an overall weakening in the wind environment from 1980 to 2019, decreasing at an average rate of 0.09 m s−1 10a−1. It is also worth noting that the mean wind speed reduced from 1980 to 2000, following which it showed a fluctuating increasing trend (Figure 2). Previous studies have shown that wind speeds decreased in most regions of the world before 2000, although at different rates of decline (Vautard et al., 2010; Wu et al., 2018; Yang et al., 2020). The decreasing trend in wind speed can be generally attributed to variations in the atmospheric temperature, precipitation, dust volume (Mcvicar and Roderick, 2010), surface vegetation coverage and land-use changes (Cui et al., 2018), surface roughness and the effects of human activities (Kim and Paik, 2015; Yang et al., 2020). The rate of decrease in mean wind speed observed in the current study is consistent with the value (0.08 m s−1 10a−1) reported by Wu et al. (2018) for East Asia, South Asia and Europe. This result indicates that the wind speed in coastal regions may have decreased at a similar rate. The reason for the decreases in mean wind speed in the Sahara Desert are complex. For example, previous studies have shown that the dust emissions of the southern part of the desert have decreased from 1982 to 2008. This result has been attributed to a decrease in near-surface wind speed and consequently reduced dust emissions due to an increase in vegetation cover (Kim et al., 2017). This indicates that vegetation cover is an important contributor to the decrease in near-surface wind speed in this region. A study by Zhou et al. (2015) on an area of Mauritania along the western parts of the Sahara Desert identified an increasing trend in precipitation from 1980 to 2000, whereas wind speed exhibited a decreasing trend, indicating that the changes to precipitation were deeply related to wind speed in this region. This result is consistent with the findings of Liu et al. (2019) in the Taklamakan Desert.
In addition, some studies have observed an increase in wind speed after 2000 on a global scale (Turner et al., 2005; Zha et al., 2018). This variation is consistent with our results, suggesting a return to a trend of a strengthening atmospheric circulation. Previous studies have also shown that the temperature in the western Sahara Desert has been gradually increasing after 2000 (Zhou et al., 2015). Rising temperatures can lead to an increase in the differential pressure for wind formation, resulting in an increase in the wind speed. The seasonal changes in the mean wind speed indicated that the maximum and minimum wind speeds occurred during spring and autumn, respectively. This result can be attributed to active cold air during spring, which at high altitude becomes the center of a high pressures zone and the ground is warmed by solar radiation. This results in a strong convective motion between high altitude areas and the ground, thereby strengthening the wind speed at the ground. Furthermore, there was a decreasing trend in wind speed in each season from 1980 to 2019, with the largest rate of decrease occurring in spring (0.11 m s−1 10a−1) (Figure 3). This result is relatively consistent with the findings of Guo et al. (2011) in China, indicating similarities in the seasonal variation of atmospheric circulation at a global scale. In addition, total wind speed varies with changes in wind frequency and the speed of sand-driving wind. The results of linear regression analysis showed a significant positive relationship between total wind speed and the wind frequency (R2 = 0.90, p < 0.05), whereas a weaker relationship was noted between total wind speed and sand-driving wind speed (R2 = 0.18, p > 0.05). Therefore, the wind frequency was the main reason of variation in total wind speed and contributed to spatial variation in total wind speed, consistent with the conclusions of Xu et al. (2006).
The spatial variation in the wind regimes suggested that changes to DP were consistent with the decreases in the wind speed variables from northwest to southeast. This result indicated that the spatial variation of DP was related to the inter-regional differences in wind speed variables. RDD and RDP/DP were relatively consistent among the different desert regions, although they retained some distinct regional characteristics. RDD can be divided into eastern and western regions by the 30°E line of longitude. The RDD of the eastern region was mainly characterized as southeast. This result can be attributed to the eastern region being blocked by narrow mountain ranges and a weakened northeasterly wind, resulting in the region being more heavily influenced by westerly winds and RDD mainly being characterized as southeast. This result was consistent with the findings of Hereher (2018) for Egyptian wind regimes in the eastern Sahara Desert. The RDD of the western regions can be mainly characterized as southwest and west-southwest oriented, and are greatly affected by northeasterly wind. The annual variations in the wind regimes showed a decline in DP from 2010 to 2019 in each region in the desert. The present study found that 81% of the decline in the total DP could be mainly attributed to reduced DP values in three prevailing wind groups namely westerly, easterly, and northerly winds. This indicates that the westerly and northeasterly winds have gradually decreased in recent years, reflecting a possibility that desertification in the desert may be reversed. In addition, previous studies have shown that the variations in DP are strongly related to wind frequency (Cui et al., 2017). In contrast, the annual variation in DP differed from the change in wind frequency, whereas it was generally consistent with the changes in sand-driving wind speed (R2 = 0.80, p < 0.01). This result indicated that a higher wind frequency does not mean a larger DP, whereas DP mainly depended on the strong winds and their frequencies (R2 = 0.81, p < 0.01). The spatial and temporal changes in wind direction revealed that the Sahara Desert is mainly dominated by easterly, westerly and northerly winds. West and southwest winds prevailed in the southern region during summer, whereas the northeast winds dominated in winter. This result can be attributed to the proximity of the southern region to the Equator, the movement of the pressure and wind belts northward in summer, the movement of the southeast winds across the Equator, following which they transition to southwest winds due to the influence of the Coriolis force. The wind direction in the western and northern regions showed that the frequency of sand-driving winds exceeded that of non-sand driving winds, whereas the results for the other regions were contradictory. This phenomenon leads to a greater mean wind speed in the northwestern region than that in other regions to a certain extent. In addition, previous studies have shown that a regional wind direction is strongly correlated with topographic conditions, and the main wind direction can be changed due to geographic obstacles such as mountains and rivers (Li, 2020). The main wind direction in the eastern part of the Sahara Desert was north, which is parallel to the direction of the Nile River. There were differences in the main wind directions among Biskra, Mecheria, and Timimoun stations located in the northern region which may be attributed to the variation in the mountains surrounding those stations. From Fig .1 it can be clearly seen that the mountain range around those stations is different, resulting in a change in the airflow direction, as shown in Tables 1, 2. The main wind direction at the Tazerbo station in the central region was north, whereas that at the Bilma station was east. This difference can possibly be attributed the deflection of airflow as it through the Tibesti Mountain, causing a shift in the wind direction from north to east (Figure 1).
5.2 Wind Regimes and Aeolian Dune Geomorphology
The dune classification system by Livingstone and Warren (1996) indicates the dune types of the Sahara Desert to include barchan dunes, transverse dunes, barchanoid chains, linear dunes, linear ridges, complex linear ridges, complex linear megadunes, star dunes, dendritic dunes and reticulate dunes. Figure 11 shows the main dune types and locations among the regions of the Sahara Desert. Images A and B represent the eastern region; images C and D represent the southern region; images E, F represent the western region; images G, H, I, J, K and L represent the northern region; images M, N, O, and P represent in the central region.
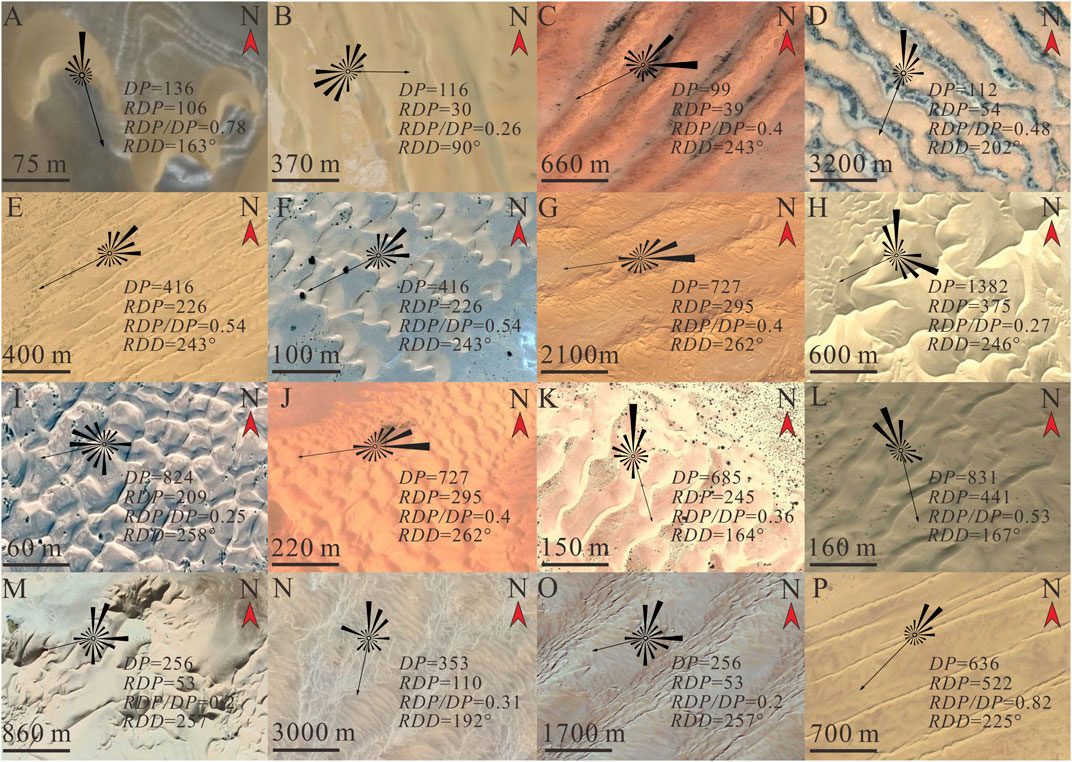
FIGURE 11. Google Earth high-resolution imagery of different dune types at 12 locations in the Sahara Desert. (A) 25°57′15″N, 30°17′31.92″E; (B) 17°9′40″N, 35°2′31″E; (C) 17°2′31″N, 15°19′48″W; (D) 13°13′37″N, 16°18′21.6″E; (E) 20°9′30.5″N, 13°35′43.2″W; (F) 20°53′24″N, 13°27′12″W; (G) 29°10′8.6″N, 2°7′34″W; (H) 29°1′28″N, 20°12′50″E; (I) 31°29′50″N, 0°39′42″E; (J) 29°16′26″N, 0°1′10″E; (K) 30°21′12″N, 18°44′31″E; (L) 34°16′1″N, 6°43′38″E; (M) 25°18′3.6″N,12°9′47″E; (N) 26°43′9″N, 23°11′20″E; (O) 24°16′19.2″N, 12°41′56″E; (P) 18°40′43″N, 13°7′3″E.
The wind regime plays an important role in the formation and development of aeolian dunes. The wind energy environment, the wind direction variability, and the sand-driving wind direction generally correspond with dune types (Wasson and Hyde, 1983; Lancaster, 1994; Lancaster, 1995). Transverse dunes are generally formed by narrowly unimodal wind regimes. Linear dunes are formed by bimodal wind regimes, The variability in wind direction is positively correlated with the complexity of the dune morphology, and wind energy is inversely correlated with the complexity of dune type (Fryberger and Dean, 1979). However, the present study found that the correlation between the dune types and wind energy environment in the Sahara Desert differed from that reported by Fryberger and Dean (1979) to a certain extent, with differences in the eastern and northern regions, whereas the other regions were similar. More specifically, while the northern part of the desert has a high wind energy environment, with dune types including complex linear megadunes, star dunes, reticulate dunes, linear ridges, barchanoid chains and other complex dune types (Figures 11G–L). This result can be attributed to the complex wind regimes and the high variability in wind direction in this region, with larger angle between the main and secondary directions of the sand-driving wind and the lower proportion of the main wind direction. Although the eastern part of the desert is a low wind energy environment, the dune types are mainly simple barchan dunes and linear dunes (Figures 11A,B). A study by Hereher (2018) on the wind environment of the Egyptian desert in the eastern part of the Sahara Desert showed that the desert is a low wind energy environment, except for the southern region, which is more consistent with the findings of the present study. The difference between the results of the study by Hereher (2018), and that of the present study was that linear and transverse dunes are distributed in low wind energy environment and barchan dunes are distributed in high wind energy environment in the Egyptian desert, whereas the present study identified barchan dunes in low wind energy environments. This difference may be due to fewer meteorological stations selected in the present study, with all stations along the eastern edge of the Sahara Desert. Therefore, a lack of data represents a barrier to identifying the relationship between wind environment and dune type in this region. In addition, this result can be attributed to the acute angle between the main and secondary wind directions in the area containing meteorological stations in the current study, as well as the larger proportion of the main wind direction. Therefore, there was a single overall wind direction in the region and the dune types were simpler. The western part of the desert is a high wind energy environment, in which both angles between the main and secondary wind directions are acute and the variability in wind direction is medium and low, with the corresponding dunes characterized as linear dunes and crescent-shaped dunes (Figures 11E,F). Hu et al. (2021) studied the wind environment in the western Sahara Desert and showed that the DP values decrease from northwest to southeast of this region, which is consistent with the results of the present study. In addition, barchan dunes are mainly distributed on the western coastal areas with high DP values, whereas the linear dunes, transverse dunes and barchanoid chains are distributed on the southern edge of the area with low DP values. These findings are also consistent with the results of the present study. The southern part of the desert is a low wind energy environment, and there is a larger angle between the main and secondary wind directions. The complexity of wind direction is higher and the variability in wind direction is medium and high, with the corresponding dune types being barchanoid chains and linear ridges (Figures 11C,D). The central part of the desert is an intermediate wind energy environment. This area has a high and medium variability in wind direction, the larger angle is that between the main and secondary wind, and the acute and obtuse bimodal wind regimes, with the corresponding dune types are complex linear ridges and dendritic dunes (Figures 11N–P). In addition, Dong (2011) found that the correlation between the wind energy environment and dune types in the Kumtag Desert to be consistent with that reported by Fryberger and Dean (1979), and these results contradict those in the current study. This result indicates similarities and differences in the relationship between dune types and wind regimes in different regions of the desert. A higher wind energy environment does not necessarily mean low variability in wind direction and a simple dune morphology. Dune morphology is influenced by the angle between the main and secondary wind direction, and may also be influenced by a combination of factors, such as topography, obstacles, and sand supply.
5.3 Wind Regimes and Sand Emission and Transport
The Sahara Desert is the largest supplier of dust on Earth and has a significant impact on the global climate environment, biogeochemical cycles, and human health (Evan, 2008). Previous studies have shown that wind speed is strongly related to dust aerosol emissions (Kim et al., 2017). The Sahara Desert is an important source of sand in North Africa. During 1997 to 2016, sand emissions in North Africa increased from December, reaching a yearly maximum from June to July and a minimum from October to November (Pan, 2020). This temporal variation in sand emissions is consistent with changes to wind speed in the Sahara Desert, the maximum wind speeds occurring in spring and summer and a minimum in autumn. Therefore, there was a positive correlation between wind speed and sand emission in the Sahara Desert. In addition, increasing mean wind speed generally resulted in increases in wind power density and the availability of wind energy resources (Li, 2013). Therefore, wind energy resources in this desert are also more abundant during spring and summer.
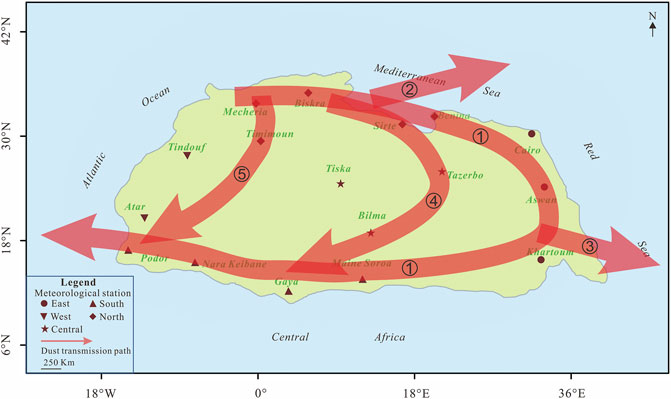
The wind direction can reflect the main transport direction of sand to a certain extent (Lamancusa and Wagstrom, 2019). The northern part of the Sahara Desert is mostly dominated by westerly, northwesterly and north-northwesterly winds. These wind direction characteristics allow the transport of sand from the northwest to the east and to the Mediterranean Sea [routes (1) and (2)]. The eastern part of the desert is dominated by northerly, north-northeasterly, and north-northwesterly winds. Therefore, after the airflow from the northwestern region reaches the eastern region, sand transport will be divided into two branches. The first branch will be transported to the southwestern region by the northeasterly wind [route (1)], whereas the other will be transported towards the Red Sea by the northwesterly wind [route (3)]. The southern part of the desert is dominated by northeasterly wind. Therefore, airflow will be transported westward along the southern region, eventually reaching the Atlantic Ocean and even the southern and southeastern part of the United States [route (1)]. The central part of the desert is dominated by easterly and northerly winds. Therefore, as the airflow from the northwestern region moves eastward to the central region, the sand is also continuously transported westward to the Atlantic Ocean [route (4)]. Dust from the western part of the desert is transported in a southwest direction to the Atlantic Ocean under the influence of the northeasterly wind [route (5)]. The specific routes shown in Figure 12 are more consistent with the North African sand transport routes inferred from dust aerosols by previous studies (Pan, 2020).
6 Conclusion
The present study analyzed the temporal and spatial variations in near-surface wind regimes using data from 17 meteorological stations in the Sahara Desert. In addition, the causes of these variations and the relationship between these changes and the dune types were discussed. These results of the present study can fil the gap in knowledge of the overall wind environment of the Sahara Desert to a certain extent. The conclusions of the study are listed below.
1) There were significant temporal and spatial changes in the wind environment of the Sahara Desert. All wind speed variables decreased from northwest to southeast, and were generally higher in spring and lower in autumn. Wind speed was related to vegetation coverage, obstacles, temperature, precipitation and other factors. Although there were seasonal and regional differences in the annual variation of each wind speed variable, there was an overall significantly decreasing trend. The variation in total wind speed was significantly correlated with the magnitude of the wind frequency.
2) Obviously temporal and spatial changes in DP and related variables were noted. DP and RDP are normally larger at the western and northern regions. RDP/DP was mainly of intermediate and high variability. RDD indicated that winds were mostly towards the southwest. DP and RDP showed a roughly decreasing trend in annual variation and were greater during spring and winter. DP was strongly influenced by the strength of DP and the magnitude and frequency of strong winds on the prevailing wind direction. The values of RDD and RDP/DP showed no obvious changes in temporal trends.
3) The temporal and spatial variations in the wind direction suggested the dominance of easterly, westerly and northerly winds across all regions, with more complex winds in the northern region. The wind direction frequency of wind speeds >6 m s−1 exceeded that of wind speeds <6 m s−1 in the western and northern regions, whereas there were conflicting results for the other regions. The seasonal difference in wind direction in each region may be related to factors such as the movement of baroclinic wind bands and obstacles.
4) No strong correlation between wind regimes and dune types was identified in this desert. The dune morphology is strongly influenced by the angle between the main and secondary wind directions, and may also be affected by a variety of factors such as topography, obstructions, and sediment supply.
5) The maximum dust emissions from this desert occurred during spring and summer, whereas the lowest occurred during autumn. Five dust transport pathways were identified, with three of transporting dust to the Atlantic Ocean, and the remaining two transporting dust to the Mediterranean Sea and Red Sea regions, respectively Dong et al., 2013.
Data Availability Statement
Publicly available datasets were analyzed in this study. This data can be found here: http://gis.ncdc.noaa.gov/maps/ncei/cdo/hourly.
Author Contributions
WS: Formal analysis, Investigation, Writing–original draft, Writing–review and editing. GC, ZB, and FM: Writing–review and editing. ZD: Conceptualization, Methodology, Resources, Supervision, Funding acquisition.
Funding
This study was sponsored by the National Natural Science Foundation (41930641 and 41871008) and the Fundamental Research Funds for the Central Universities (2021TS011).
Conflict of Interest
The authors declare that the research was conducted in the absence of any commercial or financial relationships that could be construed as a potential conflict of interest.
Publisher’s Note
All claims expressed in this article are solely those of the authors and do not necessarily represent those of their affiliated organizations, or those of the publisher, the editors and the reviewers. Any product that may be evaluated in this article, or claim that may be made by its manufacturer, is not guaranteed or endorsed by the publisher.
References
Boudia, S. M., Benmansour, A., Ghellai, N., Benmedjahed, M., and Tabet Hellal, M. A. (2013). Temporal Assessment of Wind Energy Resource at Four Locations in Algerian Sahara. Energ. Convers. Manag. 76, 654–664. doi:10.1016/j.enconman.2013.07.086
Cui, X., Dong, Z., Sun, H., Li, C., Xiao, F., Liu, Z., et al. (2017). Spatial and Temporal Variation of the Near-Surface Wind Environment in the Dune fields of Northern China. Int. J. Climatol 38 (5), 2333–2351. doi:10.1002/joc.5338
Cui, X., Sun, H., Dong, Z., Liu, Z., Li, C., Zhang, Z., et al. (2018). Temporal Variation of the Wind Environment and its Possible Causes in the Mu Us Dunefield of Northern China, 1960-2014. Theor. Appl. Climatol 135, 1017–1029. doi:10.1007/s00704-018-2417-5
Di, W. J., Niu, X. Y., Chen, Z. Q., Liu, J., Wang, X., et al. (2021). North–south Pattern of Dust Aerosols and Their Formation Mechanisms in Sahara Regions. Geochimica 50 (1), 98–109. (in chinese). doi:10.19700/j.0379-1726.2021.01.010
Dong, Z. B., Qian, G. Q., Luo, W. Y., Zhang, Z., Xiao, S., and Zhao, A. (2009). Geomorphological Hierarchies for Complex Mega-Dunes and Their Implications for Mega-Dune Evolution in the Badain Jaran Desert. Geomorphology 106 (3–4), 180–185. doi:10.1016/j.geomorph.2008.10.015
Dong, Z., Qian, G., Lv, P., and Hu, G. (2013). Investigation of the Sand Sea with the Tallest Dunes on Earth: China's Badain Jaran Sand Sea. Earth-Science Rev. 120 (120), 20–39. doi:10.1016/j.earscirev.2013.02.003
Evan, A. T. (2008). Ocean Temperature Forcing by Aerosols across the Atlantic Tropical Cyclone Development Region. Geochem. Geophys. Geosystems 9 (5), 1–11. doi:10.1029/2007gc001774
Farouk, C., Khellaf, A., Belouchrani, A., and Recioui, A. (2011). A Contribution in the Actualization of Wind Map of Algeria. Renew. Sust. Energ. Rev. 15 (2), 993–1002. doi:10.1016/j.rser.2010.11.025
Feng, L. (2016). Numerical Simulation of Wind Field Based on canyon Terrain. Hangzhou, China: Zhejiang sci-tech university, 5–35. (in Chinese).
Fryberger, S. G., and Dean, G. (1979). “Dune Forms and Wind Regime,” in A Study of Global Sand Seas. Editor E. D. Mckee (Washington: US Government Printing Office).
Gao, W., and Qu, W, J. (2018). Spatial-temporal Variation of Aerosol Optical Depth over Africa and Influence of the Azores High on the Trans-Atlantic Dust Transport. J. Mar. Meteorology 38 (4), 81–92. (in chinese). doi:10.19513/j.cnki.issn2096-3599.2018.04.0009
Guo, H., Xu, M., and Hu, Q. (2011). Changes in Near-Surface Wind Speed in China: 1969-2005. Int. J. Climatology 31 (3), 34–358. doi:10.1002/joc.2091
Hamdan, M. A., Refaat, A. A., and Abdel Wahed, M. (2016). Morphologic Characteristics and Migration Rate Assessment of Barchan Dunes in the Southeastern Western Desert of Egypt. Geomorphology 257, 57–74. doi:10.1016/j.geomorph.2015.12.026
Haywood, J. M., Francis, P., Osborne, S., Glew, M., Loeb, N., Highwood, E., et al. (2003). Radiative Properties and Direct Radiative Effect of Saharan Dust Measured by the C-130 Aircraft during SHADE: 1. Solar Spectrum. J. Geophys. Res. 108 (D18), 4–16. doi:10.1029/2002jd002687
Hereher, M. E. (2014). Assessment of Sand Drift Potential along the Nile Valley and Delta Using Climatic and Satellite Data. Appl. Geogr. 55, 39–47. doi:10.1016/j.apgeog.2014.09.004
Hereher, M. E. (2018). Geomorphology and Drift Potential of Major Aeolian Sand Deposits in Egypt. Geomorphology 304, 113–120. doi:10.1016/j.geomorph.2017.12.041
Hereher, M. E. (2010). Sand Movement Patterns in the Western Desert of Egypt: an Environmental Concern. Environ. Earth Sci. 59 (5), 1119–1127. doi:10.1007/s12665-009-0102-9
Hu, Z., Gao, X., Lei, J., and Zhou, N. (2021). Geomorphology of Aeolian Dunes in the western Sahara Desert. Geomorphology 392, 107916. doi:10.1016/j.geomorph.2021.107916
Jickells, T. D., An, Z. S., Andersen, K. K., Baker, A. R., Bergametti, G., Brooks, N., et al. (2005). Global Iron Connections between Desert Dust, Ocean Biogeochemistry, and Climate. Science 308 (5718), 67–71. doi:10.1126/science.1105959
Kim, D., Chin, M., Remer, L. A., Diehl, T., Bian, H., Yu, H., et al. (2017). Role of Surface Wind and Vegetation Cover in Multi-Decadal Variations of Dust Emission in the Sahara and Sahel. Atmos. Environ. 148, 282–296. doi:10.1016/j.atmosenv.2016.10.051
Kim, J. C., and Paik, K. (2015). Recent Recovery of Surface Wind Speed after Decadal Decrease: a Focus on South Korea. Clim. Dyn. 45 (5-6), 1699–1712. doi:10.1007/s00382-015-2546-9
Knippertz, P., and Todd, M. C. (2010). The central West Saharan Dust Hot Spot and its Relation to African Easterly Waves and Extratropical Disturbances. J. Geophys. Res. 115 (D12), 1–14. doi:10.1029/2009jd012819
Kottek, M., Grieser, J., Beck, C., Rudolf, B., and Rubel, F. (2006). World Map of the Köppen-Geiger Climate Classification Updatedfication Updated. Meteorologische Z. 15 (3), 259–263. doi:10.1127/0941-2948/2006/0130
Lamancusa, C., and Wagstrom, K. (2019). Global Transport of Dust Emitted from Different Regions of the Sahara. Atmos. Environ. 214 (116734), 1–10. doi:10.1016/j.atmosenv.2019.05.042
Lancaster, N. (1994). “Dune Morphology and Dynamics,” in Geomorphology of Desert Environments. Editors A. D. Abrahams, and A. J. Parsons (London: Chapman & Hall).
Li, C. (2020). Research on Martian Sand Dunes. Xi’an, China: Shaanxi normal university, 69–84. (in Chinese).
Li, X. Y. (2013). Discussion the Method of Wind Assessment and Site Selection for the Wind Farm. Lanzhou, China: Lanzhou University of Technology. (in Chinese).
Liu, D. S., Jiang, C. Y., and Jia, W. Y. (1988). World Physical Geography. Beijing: Higher Education Press, 192–244. (in Chinese).
Liu, Z., Dong, Z., Zhang, Z., Cui, X., and Xiao, N. (2019). Spatial and Temporal Variation of the Near-Surface Wind Regimes in the Taklimakan Desert, Northwest China. Theor. Appl. Climatol 138, 433–447. doi:10.1007/s00704-019-02824-w
Livingstone, I., and Warren, A. (1996). Aeolian Geomorphology: An Introduction. Singapore: Longman Singapore Publishers.
Maher, B. A., Prospero, J. M., Mackie, D., Gaiero, D., Hesse, P. P., and Balkanski, Y. (2010). Global Connections between Aeolian Dust, Climate and Ocean Biogeochemistry at the Present Day and at the Last Glacial Maximum. Earth Sci. Rev. 99 (1-2), 61–97. doi:10.1016/j.earscirev.2009.12.001
Matthew, O. J., and Ayoola, M. A. (2020). Seasonality of Wind Speed, Wind Shears and Precipitation over West Africa. J. Atmos. Solar-Terrestrial Phys. 207, 105371. doi:10.1016/j.jastp.2020.105371
Mcvicar, T. R., and Roderick, M. L. (2010). Winds of Change. Nat. Geosci 3 (11), 747–748. doi:10.1038/ngeo1002
Moulin, C., Lambert, C. E., Dulac, F., and Dayan, U. (1997). Control of Atmospheric export of Dust from North Africa by the North Atlantic Oscillation. Nature 387, 691–694. doi:10.1038/42679
Pan, L. (2020). The Source Area, Transport and Contribution of Mechanisms to the Total Amount of Dust Aerosols in North Africa. Nanjing, China: Nanjing university of information science and technology, 12–20. (in Chinese).
Prospero, J. M., and Lamb, P. J. (2003). African Droughts and Dust Transport to the Caribbean: Climate Change Implications. Science 302, 1024–1027. doi:10.1126/science.1089915
Prospero, J. M. (1999). Long-term Measurements of the Transport of African mineral Dust to the southeastern United States: Implications for Regional Air Quality. J. Geophys. Res. 104 (D13), 15917–15927. doi:10.1029/1999jd900072
Qiao, H. Y. (2020). Ground-based Remote Sensing of Dust Mass Extinction Efficiency in Africa and Asia. Lanzhou, China; Lanzhou university, 1–51. (in Chinese).
Sherman, D. J., Li, B., Ellis, J. T., Farrell, E. J., Maia, L. P., and Granja, H. (2013). Recalibrating Aeolian Sand Transport Models. Earth Surf. Process. Landforms 38 (2), 169–178. doi:10.1002/esp.3310
Shi, W. K., Dong, Z. B., and Chen, G. X. (2020). Discussion on the Symbiosis of Barchan Dune and Linear Dune: a Case Study from Sahara Desert. J. desert Res. 40 (3), 135–144. (in Chinese). doi:10.7522/j.issn.1000-694X.2019.00112
Tanaka, T. Y., and Chiba, M. A. (2006). Numerical Study of the Contributions of Dust Source Regions to the Global Dust Budget. Glob. Planet. Change 52 (1-4), 88–104. doi:10.1016/j.gloplacha.2006.02.002
Taniguchi, K., Endo, N., and Sekiguchi, H. (2012). The Effect of Periodic Changes in Wind Direction on the Deformation and Morphology of Isolated Sand Dunes Based on Flume Experiments and Field Data from the Western Sahara. Geomorphology 179, 286–299. doi:10.1016/j.geomorph.2012.08.019
Turner, J., Colwell, S. R., Marshall, G. J., Lachlan-Cope, T. A., Carleton, A. M., Jones, P. D., et al. (2005). Antarctic Climate Change during the Last 50 Years. Int. J. Climatol. 25 (3), 279–294. doi:10.1002/joc.1130
Vautard, R., Cattiaux, J., Yiou, P., Thépaut, J.-N., and Ciais, P. (2010). Northern Hemisphere Atmospheric Stilling Partly Attributed to an Increase in Surface Roughness. Nat. Geosci 3 (11), 756–761. doi:10.1038/ngeo979
Wasson, R. J., and Hyde, R. (1983). Factors Determining Desert Dune Type. Nature 304, 337–339. doi:10.1038/304337a0
Wever, N. (2012). Quantifying Trends in Surface Roughness and the Effect on Surface Wind Speed Observations. J. Geophys. Res. 117 (D11), 1–14. doi:10.1029/2011jd017118
Wu, J., Zha, J., Zhao, D., and Yang, Q. (2018). Changes in Terrestrial Near-Surface Wind Speed and Their Possible Causes: an Overview. Clim. Dyn. 51, 2039–2078. doi:10.1007/s00382-017-3997-y
Wu, Z. (2010). Geomorphology of Wind-Drift Sands and Their Controlled Engineering. Beijing, China: Science Press.
Xu, M., Chang, C.-P., Fu, C., Qi, Y., Robock, A., Robinson, D., et al. (2006). Steady Decline of East Asian Monsoon Winds, 1969-2000: Evidence from Direct Ground Measurements of Wind Speed. J. Geophys. Res. 111, D24111. doi:10.1029/2006jd007337
Yang, J., Xia, D., Wang, S., Tian, W., Ma, X., Chen, Z., et al. (2020). Near-surface Wind Environment in the Yarlung Zangbo River basin, Southern Tibetan Plateau. J. Arid Land 12 (6), 917–936. doi:10.1007/s40333-020-0104-8
Yu, H., Chin, M., Bian, H., Yuan, T., Prospero, J. M., Omar, A. H., et al. (2015). Quantification of Trans-Atlantic Dust Transport from Seven-Year (2007-2013) Record of CALIPSO Lidar Measurements. Remote Sensing Environ. 159, 232–249. doi:10.1016/j.rse.2014.12.010
Yuan, G. Y. (2003). The Geographical and Environmental Features of the Sahara in North Africa-Comparison with that in the Taklamakan Desert, 20, 235–239. (In Chinese). doi:10.13866/j.azr.2003.03.016
Zha, J., Wu, J., Zhao, D., and Tang, J. (2018). A Possible Recovery of the Near-Surface Wind Speed in Eastern China during winter after 2000 and the Potential Causes. Theor. Appl. Climatol 136, 119–134. doi:10.1007/s00704-018-2471-z
Zhang, Z., Dong, Z., and Li, C. (2015). Wind Regime and Sand Transport in China's Badain Jaran Desert. Aeolian Res. 17, 1–13. doi:10.1016/j.aeolia.2015.01.004
Keywords: wind environment, variation, dune type, Sahara Desert, North Africa
Citation: Shi W, Dong Z, Chen G, Bai Z and Ma F (2022) Spatial and Temporal Variation of the Near-Surface Wind Environment in the Sahara Desert, North Africa. Front. Earth Sci. 9:789800. doi: 10.3389/feart.2021.789800
Received: 05 October 2021; Accepted: 27 December 2021;
Published: 14 January 2022.
Edited by:
Wei Zhang, Utah State University, United StatesCopyright © 2022 Shi, Dong, Chen, Bai and Ma. This is an open-access article distributed under the terms of the Creative Commons Attribution License (CC BY). The use, distribution or reproduction in other forums is permitted, provided the original author(s) and the copyright owner(s) are credited and that the original publication in this journal is cited, in accordance with accepted academic practice. No use, distribution or reproduction is permitted which does not comply with these terms.
*Correspondence: Zhibao Dong, emJkb25nQHNubnUuZWR1LmNu
 Weikang Shi
 Zhibao Dong*
 Guoxiang Chen

