
95% of researchers rate our articles as excellent or good
Learn more about the work of our research integrity team to safeguard the quality of each article we publish.
Find out more
ORIGINAL RESEARCH article
Front. Earth Sci. , 03 January 2022
Sec. Economic Geology
Volume 9 - 2021 | https://doi.org/10.3389/feart.2021.787057
This article is part of the Research Topic Progress in Exploration, Development and Utilization of Geothermal Energy View all 28 articles
 Yonghui Huang1,2,3
 Yuanzhi Cheng1,2,3*
 Lu Ren4Fei Tian1,2,3
 Sheng Pan5Ke Wang1,2,3Jianwei Wang4Yuexia Dong6
 Yanlong Kong1,2,3*
Assessment of available geothermal resources in the deep oil field is important to the synergy exploitation of oil and geothermal resources. A revised volumetric approach is proposed in this work for evaluating deep geothermal potential in an active oil field by integrating a 3D geological model into a hydrothermal (HT)-coupled numerical model. Based on the analysis of the geological data and geothermal conditions, a 3D geological model is established with respect to the study area, which is discretized into grids or elements represented in the geological model. An HT-coupled numerical model was applied based on the static geological model to approximate the natural-state model of the geothermal reservoir, where the thermal distribution information can be extracted. Then the geothermal resource in each small grid element is calculated using a volumetric method, and the overall geothermal resource of the reservoirs can be obtained by making an integration over each element of the geological model. A further parametric study is carried out to investigate the influence of oil and gas saturations on the overall heat resources. The 3D geological model can provide detailed information on the reservoir volume, while the HT natural-state numerical model addressed the temperature distribution in the reservoir by taking into account complex geological structures and contrast heterogeneity. Therefore, integrating the 3D geological modeling and HT numerical model into the geothermal resource assessment improved its accuracy and helped to identify the distribution map of the available geothermal resources, which indicate optimal locations for further development and utilization of the geothermal resources. The Caofeidian new town Jidong oil field serves as an example to depict the calculation workflow. The simulation results demonstrate in the Caofeidian new town geothermal reservoir that the total amount of geothermal resources, using the proposed calculation method, is found to be 1.23e+18 J, and the total geothermal fluid volume is 8.97e+8 m3. Moreover, this approach clearly identifies the regions with the highest potential for geothermal resources. We believe this approach provides an alternative method for geothermal potential assessment in oil fields, which can be also applied globally.
Due to the increasing market demand for energy, the shortage of conventional fossil fuels, and the concerns regarding the environmental aspects, the exploitation of renewable energy has become the focus of research and keeps gaining attention in recent years. Geothermal energy is a stable, environmentally friendly, and cheap renewable energy source, showing a promising perspective as a conventional fuel substitute. Such energy transition promotes geothermal energy development in oil fields.
Developing geothermal energy in oil fields offers remarkable natural advantages: 1) producing geothermal energy from oil and gas wells is an economically efficient way since drilling costs can be significantly saved. 2) Sufficient data and geological information have been collected from the long-term oil and gas productions, which could minimize the uncertainties and risks in geothermal production.
To achieve an efficient development of geothermal energy in an oil field, a solid knowledge of the overall geothermal resources and their distribution is an indispensable factor. Geothermal resource assessment is a standard practice adopted by the geothermal industry in evaluating a geothermal system and its potential generation capacity. It plays a crucial role in quantifying the amount of available thermal energy for geothermal exploration, providing essential information for further decision making, economical evaluation, and so on. It also serves as a framework for developing a geothermal prospect in a sustainable manner. The success of a geothermal development project relies on a robust resource assessment methodology that can predict, with a lower level of uncertainty, the magnitude of energy that is stored and can be extracted and utilized from a given geothermal reservoir.
The quantification of geothermal resources in oil and gas reservoirs requires subsurface temperature and volume information, which can be a demanding task to accurately assess (Li and Sun, 2014). Common methods for assessing geothermal resource potential include the volumetric “heat in place” method (Muffler and Cataldi, 1978) (i.e., volumetric method), analytical method, and numerical modeling method (Ciriaco et al., 2020). According to Li and Sun (2014), the volumetric method is a suitable approach for the estimation of geothermal resources in oil and gas reservoirs. In the volumetric method, two major aspects must be considered to achieve an accurate assessment of the geothermal resources: first, a good understanding of the geological structure, which includes the identification of the boundaries of a geothermal reservoir, and the volume estimation of the reservoir; and second, inferring the temperature distribution of the geothermal reservoir. Recently, scholars have extended the volumetric method to improve the accuracy of geothermal potential assessment or provide the associated uncertainty estimation of individual parameters. Pocasangre and Fujimitsu (2018) presented a Python-based stochastic library for evaluating geothermal power potential using the volumetric method.
However, previous research to some extent isolated the geothermal resources with the complex geological structure interpretation. With the wide applications of geophysical methods in geothermal explorations and resource assessments, the detailed geological characteristics can be well interpreted. Carrier et al. (2019) proposed new geoelectrical methods to identify thermal groundwater at depth, and the combination of the resistivity and gravity models provides an effective and reliable method for the imaging of shallow geothermal resources. Tian et al. (2020) combined the volumetric method with a microtremor survey, which identifies the specific thickness of the layers for each junior unit. Cheng et al. (2021) constructed a 3D resistivity structure in the hydrothermal (HT) system for setting up the geothermal conceptual models.
Recently, to integrate different sources of geological data, 3D geological modeling is emerging as a comprehensive method. The combination of 3D geological modeling can be used to calculate the volume of a reservoir accurately and automatically and assign values to parameters of each element to achieve an accurate calculation of geothermal reserves. Moreover, 3D geological modeling is helpful to analyze the geothermal geological conditions and realize the visualization of geological structures, especially for regions in which complex geological settings are expected. In recent years, more and more attempts have been made to link the volumetric method to 3D geological modeling. Calcagno et al. (2014) presented an integrated 3D method to estimate the geothermal potential, by taking into account the coherent and well-constraint interpretation of the geological structure. Zhu et al. (2020) created a 3D geological model and then interpolated isothermal surfaces into the model. Finally, the geothermal resource potential can be calculated by the integration of the geological model and the isothermal surfaces.
Besides the detailed 3D geological interpretation, accurate thermal information and 3D thermal model are also of particular importance for geothermal resource assessment. Traditionally, the calculated temperature distribution is based on either the geostatistical interpolation with well-log data or a 1D analytical temperature solution along the depth profiles (Bédard et al., 2020). Although these methods offer a convenient estimation with short computation time, they might lack a physical underpinning, as the influence of comprehensive geological structures and faults and fractures on the thermal distribution cannot be well addressed, which leads to an inaccurate temperature prediction. Numerical modeling serves as an efficient and powerful tool for the computing of the temperature field in the fluid environment as well as useful tools for simulating local temperature distribution in geothermal and their surroundings. Fuchs et al. (2020) presented a 3D numerical crustal temperature model with inverse optimization methodology and analyze the present-day conductive thermal field of the Danish onshore. Gascuel et al. (2020) presented a numerical simulation routine to analyze the information available from a small and sparse dataset to predict temperature distribution at depth for remote sedimentary basins and assess the geothermal resource potential. A novel lithospheric-scale 3D temperature model of the Hungary geothermal reservoir is proposed in Békési et al. (2020) and Békési et al. (2018), in which the observed temperature anomalies can be approximated by updating the thermal properties of the layers through the ensemble smoother with multiple data assimilation techniques.
Upon the considerations, a revised volumetric method is applied for the geothermal resource assessment in oil fields by integrating a 3D geological model with HT-coupled natural-state modeling. A Petrel–OpenGeoSys coupling routine is provided to fulfill the goals. First, a detailed 3D geological model is established via Schlumberger–Petrel, by interpreting the well-log data. A python script is used to convert the GRDECL format exported by Petrel into VTU format, which can be either imported to Paraview for a further post-process or serve as a finite element mesh input to an open-source code OpenGeoSys (OGS) (Kolditz et al., 2012) for numerical simulation. A 3D HT-coupled model is run in OGS until a quasi-equilibrium state is reached. The temperature values are thereby assigned to each grid element of the 3D mesh. Then, the total geothermal resources of the reservoir can be assessed with the revised volumetric method by integrating geothermal resource value over each grid element.
With the help of the geological model, the volume distribution can be obtained, and the thickness of the geothermal formation can also be identified accurately. The integration of 3D geological modeling into the HT numerical simulation could help to analyze the potential and distribution of geothermal resources. By this integration, the study visualizes the local geological structures and isothermal surfaces and identifies the local thermal anomalies. Based on geothermal field analysis, the distribution of resources can be analyzed comprehensively.
The proposed workflow has been applied to a geothermal reservoir in the Caofeidian new town Jidong oil field. It is currently the focus for geothermal exploration and development in the Jidong oil field.
The paper is organized as follows: first, the detailed geological setting is introduced (Section 2). The section is followed by a detailed description of the revised volumetric method (Section 3). In Section 4, the 3D geological model setup and the HT model simulation results in the Caofeidian new town are summarized and presented. The temperature distribution and geothermal resources in this area are characterized. A comprehensive discussion on the calculation results is made thereby. Finally, Section 5 is dedicated to conclusions and gives some perspective outlook of this study.
Jidong oil field is located in the Nanpu Sag. The Nanpu sag is in the northern part of the North China Plain geographically and in the central north of the Bohai Bay Rift Basin tectonically. Lying against the southern margin of the Yanshan platform fold belt to the north, it is a single-faulted ridge sag with a fault in the north and overlap in the south formed by Mesozoic and Cenozoic rifts on the base of the North China platform, covering an area of 1,930 km2 (Lai et al., 2019). The Nanpu sag and the surrounding areas include three sub-sags (i.e., Shichang sub-sag, Linque sub-sag, and Caofeidian sub-sag) and three bulges (i.e., Baigezhuang bulge, Matouying bulge, and Laowangzhuang bulge) (Figure 1).
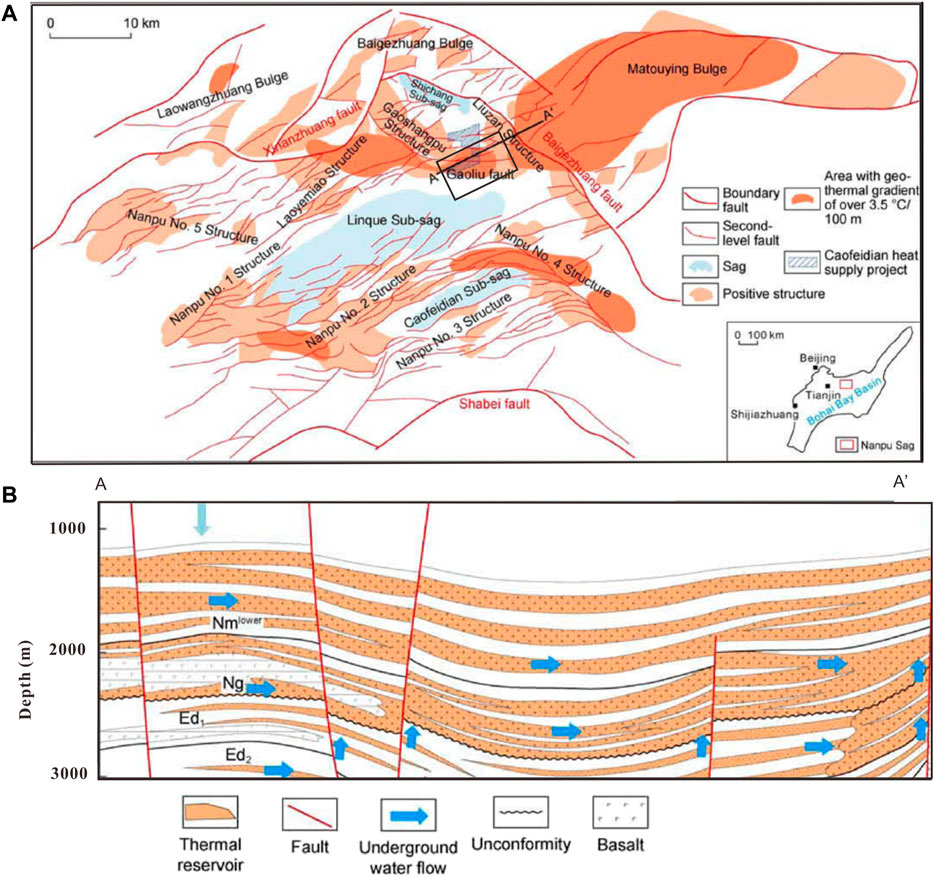
FIGURE 1. (A) The geological map and distribution of geothermal anomalous zones in the Nanpu sag. The location of Caofeidian new town is also labeled as a black rectangle. (B) Cross-section profile of the Caofeidian new town geothermal field [revised from Dong et al. (2021)].
During the late Yanshan Movement–Early Himalayan Movement, as the tectonic stress field in east China shifted from northwest (NW) compression to NW extension, the structural deformations in the Nanpu sag and its surrounding areas were affected by the Tanlu strike–slip fault zone and Zhangjiakou–Penglai strike–slip fault zone, where multiple periods of geological activities resulted in a series of northeast (NE)-trending faults, which imposes dominant controls on geothermal resource distribution. Moreover, the well-developed sedimentary caprock in the Tertiary of the Nanpu sag provides good conditions for the formation of geothermal resources.
Our study is focused on the Caofeidian new town, which is located in the northeast of the Nanpu Sag (as shown in Figure 1). Significant urban development directly forms above the reservoir, indicating large heat demands, heat can be utilized directly above the source with minimal losses in terms of heat transporting. This region is currently the focus of geothermal exploration and development in the Jidong oil field. The pilot projects of geothermal heating supply have been carried out in this area.
Caofeidian geothermal field, as part of the Gaoshangpu–Liuzan geothermal field, is located between the Shichang sub-sag and the Matouying uplift area. According to the seismic interpretation results, the geothermal reservoir of the Caofeidian new town is located in the southern part of the Gaoshangpu–Liuzan structural belt. The northern boundary of the water area is the Gaoliu fault, the east and west boundaries are controlled by the drilling wells within the Caofeidian new town area, and the southern boundary is controlled by the onshore drilling wells, with a total area of 27.85 km2. As faults often serve as fast channels for heat convection and conduction, the geothermal anomaly zones often locate close to the faults (Kong et al., 2020). In this area, geothermal anomaly zones are found distributed on both sides of the Gaoliu fault.
The Nanpu sag is a Tertiary sedimentary lake basin developing on the basement of the Middle Paleozoic. The sedimentary stratigraphy of the Nanpu Sag has been extensively studied mostly through drilling for hydrocarbon exploration. From the top to bottom formations, the Cenozoic sedimentary strata formed in the Nanpu Sag include Quaternary strata, the Minghuazhen (Nm) and Neogene Guantao (Ng) formations, and the Dongying (Ed) and Paleogene Shahejie (Es) formations (Guo et al., 2013). The Minghuazhen and Neogene Guantao Formations throughout the Nanpu sag are deposited in a low-sinuosity fluvial system and a braided fluvial system with well-developed sandstone.
The Nanpu Sag is characterized as the richest oil-bearing basin in northeast China. The sandstones constitute an important reservoir not only for oil and gas deposits but also for geothermal purposes. The Guantao Formation serves as the main geothermal reservoir in the Jidong oil field for bearing relatively high-temperature geothermal water. It also holds a relatively high thickness, which can be as large as 350–600 m. The Guantao Formation is dominated by braided river deposits and interchannel deposits, with sand contents of 60%–70%. It consists of gray-white massive sandstone, glutenite, basic volcanic rock, and thin layers of gray and variegated mudstone.
The Guantao Formation can be divided into 4 members from top to bottom, which correspond to members Ng1, Ng2, Ng3, and Ng4, wherein members Ng1–Ng3 are considered as the main formation for geothermal resource exploitation due to the large thickness and good connectivity. The averaged porosity in the Guantao Formation is approximately 25%–35%, and the permeability ranges between 600 and 2,000 mD.
The Nanpu sag has undergone four stages of rifting since the Cenozoic, and each stage of rifting was accompanied by a magmatic thermal event (Dong et al., 2010). Therefore, the Nanpu sag is often characterized by a relatively high thermal background.
The current heat flow in the Nanpu sag can reach 93.8–100.1 mW/m2, basically comparable with that of Xiongxian County, Hebei (113.9 mW/m2) and Dagang, Tianjin (105.9 mW/m2). The Matouying bulge has a higher heat flow value of 148.9 mW/m2. The heat flow distribution in this area exhibits “high in the bulges and low in the sub-sags.” According to the data information collected from drilling wells, the geothermal gradient at the bottom of the Cenozoic caprock is over 5.0°C/100 m and 8.3°C/100 m at maximum. In the sag area, the geothermal gradient at the bottom of the Cenozoic caprock is lower (3.0–4.0°C/100 m). The geothermal fluid temperature of the Guantao Formation in the Nanpu sag is mostly below 90°C, so these geothermal fields are characterized as low-medium enthalpy geothermal fields.
Forty geothermal wells have been drilled in the Caofeidian new town area as shown in Figure 2. The associated bottom hole pressure (BHP) and bottom hole temperature (BHT) data have been collected and corrected to minimize both drilling disturbance and paleoclimatic variations. It is important to note that the geothermal resource exploration in the Caofeidian new town area is a pilot project and is still in an early stage. Consequently, there are rare equilibrium temperature logging data available, and the measured thermal conductivity data are lacking as well. The corrected BHT data are further applied to calculate the surface heat flow and geothermal gradients. The calculated heat flow in the Caofeidian geothermal field ranges between 50 and 74 mW/m2, while the thermal gradient ranges between 26 and 36°C/100 m. According to the report from previous literature (Jiang et al., 2019), the arithmetic mean thermal conductivity in the Nanpu sag is approximately 2 W/(mK).
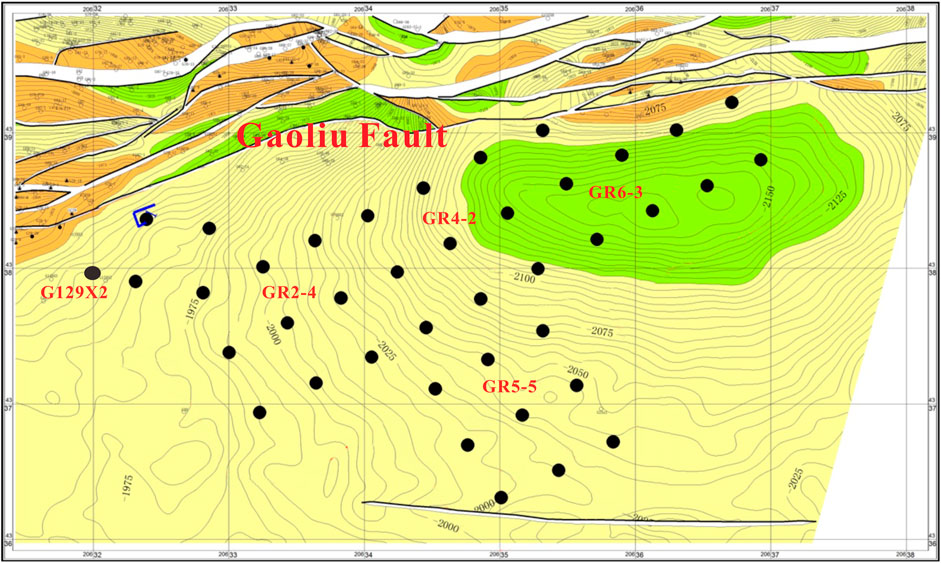
FIGURE 2. The well locations in the study area are labeled by black circles.
In this section, a detailed account is given of the construction of the geological model of the Caofeidian geothermal formation using available well-log data. Petrel software was used as the 3D geological modeling packages to represent the reservoir geology, structure, stratigraphic envelope, reservoir sublayers, and faults in 3D, which further result in the structural and property models. The reservoir volume is discretized into a 3D mesh with elements. For each element, lithofacies and rock properties such as porosity and permeability are assigned.
The 3D geological model can show intuitively the topography and geomorphology, stratum lithology, and spatial variation of geological structures. The relationship between them can be also addressed. In this work, the 3D geological model covers the Minghuazhen and Guantao Formations, i.e., from the top to bottom: Nm3, Ng1, Ng2, Ng3, and Ng4. And the depth of the model ranges from 1,900 to 2,800 m. As members Ng1–Ng3 are the main formations for the geothermal exploration, a special focus has been placed on members Ng1–Ng3.
The first step of the geological model construction is to model the horizon of the Caofeidian geothermal formation with the structural map and the well-log data. Reinterpreted formation tops with well logs (Bédard et al., 2020) are used in this study as the basis for the interpretation of the formation horizons in depth. The surfaces of the Minghuazhen and Guantao Formations are modeled with the formation tops in wells along the depth. The horizons are then interpolated between the wells.
By considering the regional tectonic background of the study area, the characteristics of fault systems and combination patterns of faults were sorted, to make clear the plane and vertical combinations of faults. Subsequently, a stratigraphic framework was built based on the interpreted horizon interfaces and fault model and then a 3D geological structure model in the domain. The 3D faulted model was divided by faults according to the geological structure map.
After the geological structure model is fully set up, the distribution of reservoir properties is described, and a sedimentary facies model is constructed. In this study, a dual modeling approach combining the deterministic and stochastic models is applied to establish the reservoir properties within the data-constrained modeling program.
In this section, an HT-coupled numerical model is performed to characterize the temperature distribution in the Caofeidian geothermal field. The structure and petrophysical property information from the 3D geological model serve as inputs to the numerical model.
The governing equations to describe the HT-coupled model are presented here.
According to the mass conservation of both liquid and solid phases, aqueous fluid flow in porous media can be expressed as
where
The temperature distribution is based on the energy conservation of the solid–fluid mixture assuming local thermal equilibrium between the two phases (Ts = Tf = T):
In the model, faults can be idealized as a 2D parallel plate with a prescribed thickness. The fluid and heat flux should be exchanged between porous medium and faults. To numerically handle these exchanges is to impose continuity conditions of pressure and temperature along the boundary of porous media and faults. The so-called “common node approach” in the finite element method (FEM) is adopted in the model, which is essentially based on the superposition of 2D fault elements onto the elements of the rock matrix. Thus, nodes at fault locations are common nodes that receive contributions from both the rock matrix elements and the fault faces (Blessent et al., 2009). The approach is feasible when faults have higher permeability and the fluid flow within the fault mainly occurs along the fault surfaces.
The governing equations have been implemented in a flexible, object-oriented, FEM-based numerical framework OpenGeoSys-V5 (Kolditz et al., 2012). The discretized linear system is solved using a preconditioned Krylov space solver (BiCGSTAB). A Newton–Raphson iteration scheme is employed for the linearization.
The BHP in (Pa) at each well can be obtained from the well-log data. By assuming the pressure at the top surface (depth = 0 m) is identical to the atmospheric pressure, the gradient of the pressure
where
Then an ordinary Kriging interpolation scheme is performed to get the distribution of the pressure gradient over the entire area of the domain. The experimental variogram is calculated on 40 sampling data at each well, and the variogram was best modeled by a linear function with and a slope of 4.7e−11. Thus, the 3D pressure distribution at each grid element of the 3D geological model can be obtained according to the centroid coordinates of each element following
where
Similarly, we get the temperature initial condition based on the BHT data. No relevant information derived from the well logging indicating the thermal convection is available in this study area. Therefore, a thermal conduction regime is assumed in the model. The temperature distribution can be calculated cell by cell directly in the 3D geological model from the top to bottom using the linear decreasing relationship theory, with the following equation (Bédard et al., 2020):
where
Figure 3 visualizes the initial conditions of pressure and temperature in 3D distribution.
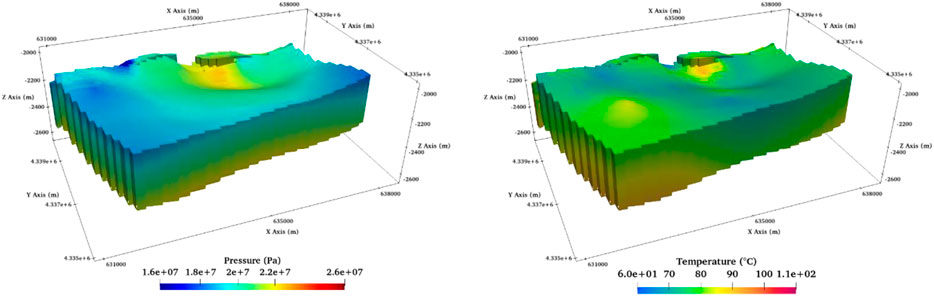
FIGURE 3. The initial conditions of pressure (Pa) and temperature (°C). Note that the figure has been zoomed in on the z-axis by a factor of 4.
For the upper model boundary, we applied a fixed temperature distribution as the Dirichlet boundary condition. For the bottom boundary surface, a Neumann boundary condition is applied to account for the heat flow at this area. The heat flow boundary values vary spatially, as shown in Figure 4. All the lateral boundaries are assumed thermal isolated.
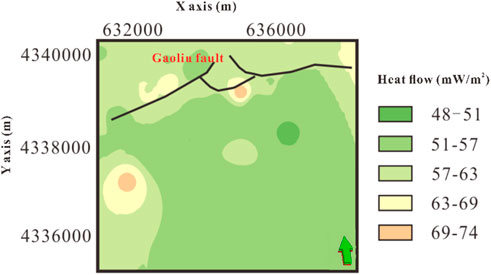
FIGURE 4. The heat flow distribution in the study area.
Variations in the fluid density and viscosity resulting from the temperature and pressure change are accounted for in the simulations with an equation of state according to the International Association for the Properties of Water and Steam (IAPWS) (Wagner and Kretzschmar, 2008).
The numerical model is run until a steady state is reached. The overall time of 10 thousand years was considered sufficiently long for the model to reach a steady state and therefore reflect the natural state of the geothermal reservoir. The varied time step size is applied in the model with the maximum time step size set to 1 thousand years.
After the subsurface temperature was assessed, the estimation of the geothermal resources was then achieved with the 3D model calculating the thermal energy in place or heat volume.
The governing equation of the revised volumetric method on the overall geothermal resources can be written as
where
To summarize the overall workflow, we thus propose a revised volumetric methodology for estimating the geothermal potential by coupling the 3D geological model with the HT numerical simulation.
1) A coherent 3D geological model interpreted based on the field and well data is established by Petrel.
2) The 3D geological model is converted into a mesh in Paraview format, which can be imported to OpenGeoSys software to prepare the HT-coupled numerical model. The thermal and pressure initial and boundary conditions are simultaneously included in the model.
3) The 3D HT model considering the geological structure and thermal properties of the rocks runs until a natural equilibrium state is reached. The natural-state model is validated against the measured temperature logs at different wells.
4) Finally, the geothermal resources on each grid element can be estimated by the volumetric method considering the volume and temperature data assigned to this cell. Then the total geothermal resources are further calculated by integrating each grid element over the whole domain.
Identifying the thickness and the directions of layers among the horizons of this 3D grid was of particular importance to construct the structure framework. Moreover, identifying an estimation of the geothermal resource requires an accurate illustration of layered volumes. Therefore, each unit in the Guantao Formation had been divided into many layers based on the lithological and petrophysical properties. Figure 5A illustrates the layering of the geological model with respect to the Guantao model. It can be observed that Ng1 and Ng2 are relatively thin, which hold thickness at approximately 75–100 m, while Ng3 is rather thicker, which is more than 150 m thick. Ng1 and Ng2 consist of 20 layers; however, Ng3 consists of 40 layers based on the petrophysical properties.
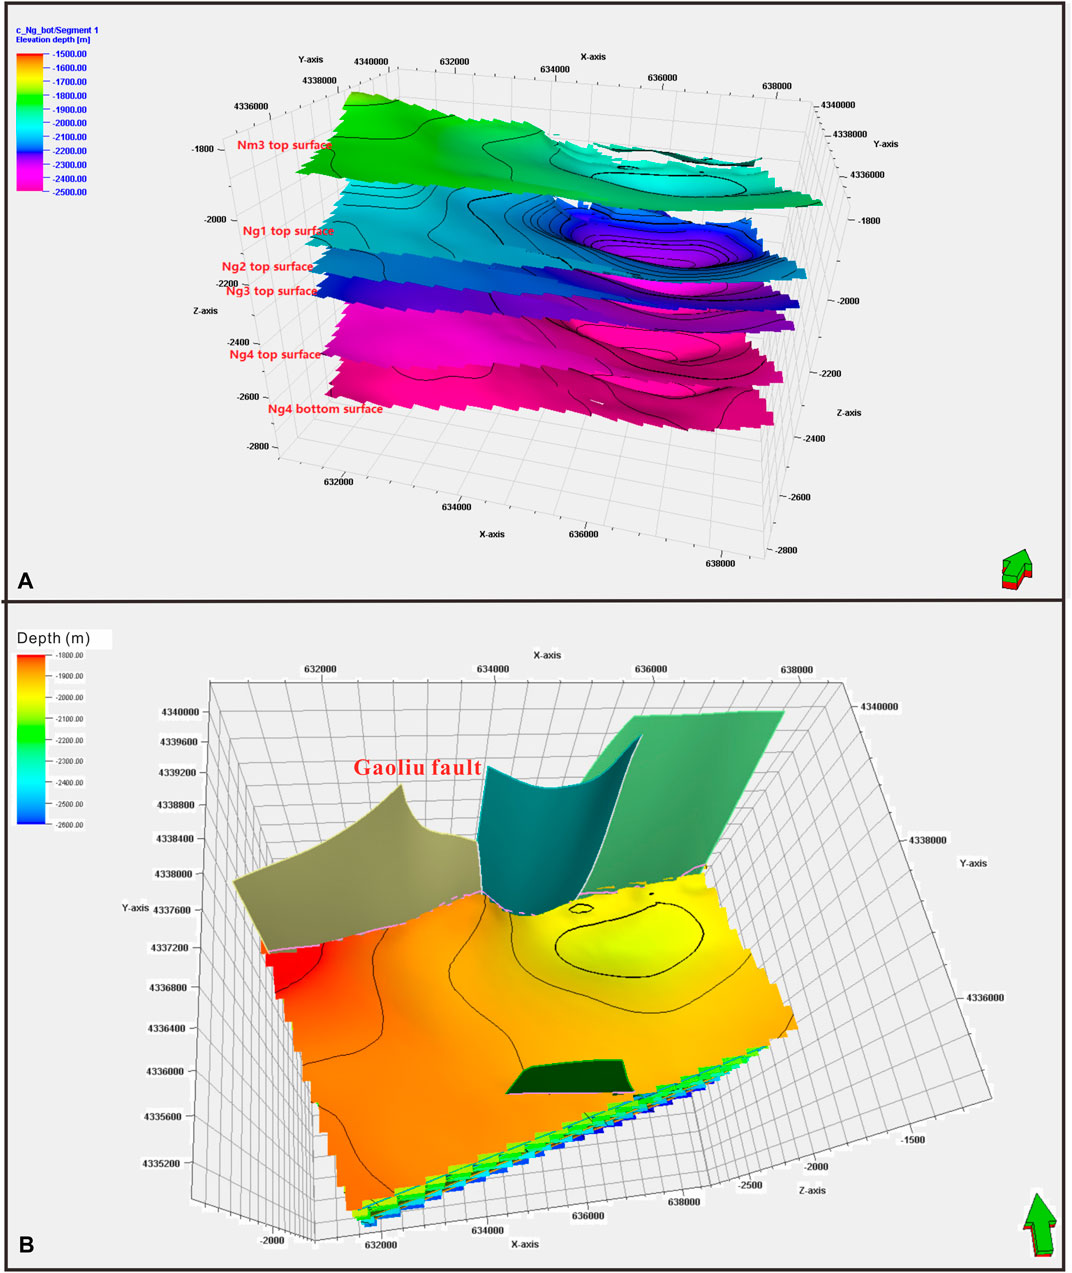
FIGURE 5. Qualitative sketch of the 3D geological model. (A) The geological horizons of Minghuazhen and Guantao Formations (Nm3 and Ng1–Ng4). (B) The geometry of the fault developments in the 3D geological model.
The fault model was the primary step for constructing the structure model with Petrel tools. Special attention has been paid to the Gaoliu fault since it plays the dominant role in this area. The fault polygons that the Petrel software provides are applied in this fault model to characterize each type of vertical fault, diagonal fault, curve fault, and various geometry structure faults. The initial surface is established by applying fault polygon with various stratification planes. Then fault section is corrected by adjusting the fault section. By using the breakpoint data obtained from single well correlations, the position and shape of fault can be conveniently revised and corrected. Figure 5B illustrates the fault model of the study area. The vertical fault polygons lying in the north part represent the Gaoliu fault.
Evaluating reservoir volume and fluid volume highly relies on the determination of its porosity. The porosity model of the Guantao Formation was built based on the outcome result that has been derived from the petrophysical interpretation of wells loggings. In this model, the arithmetic average method is applied to scale up the well logs. The Sequential Gaussian Simulation method was used to distribute the porosity in the model. The porosity occurrence distribution is a concern between 0% and 34.39% of the Guantao Formation with an average porosity value of 10.5%; among these, the averaged porosity for Ng1, Ng2, and Ng3 is approximately 13.6%, 11.1%, and 7.78%, respectively. Figure 6A represents the established 3D porosity model of the Guantao Formation (Ng1–Ng3) in Petrel.
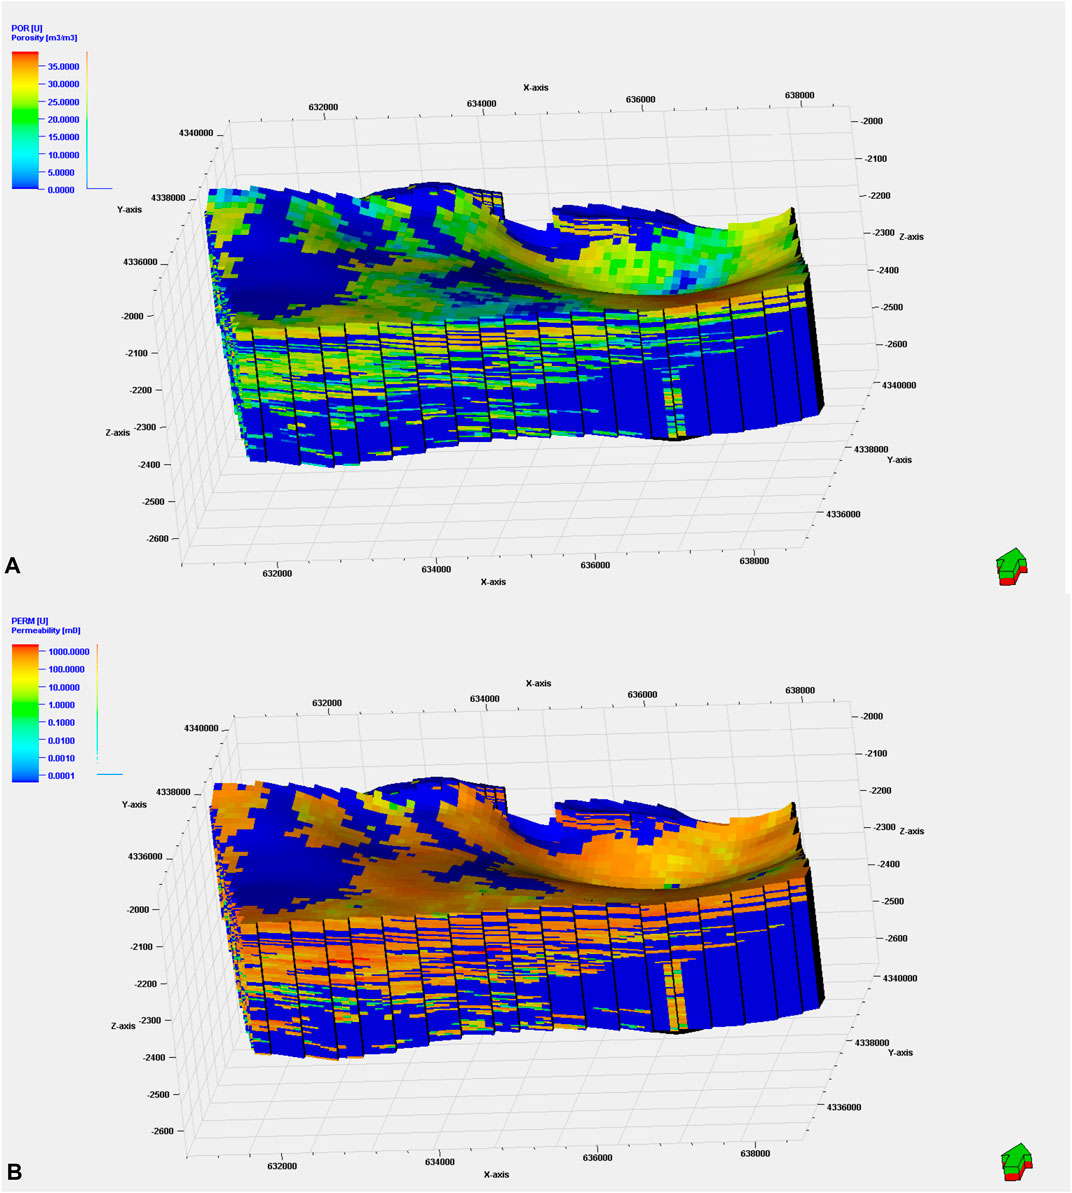
FIGURE 6. (A) The 3D porosity (%) model and (B) the permeability (mD) model for members Ng1–Ng3 of the Guantao Formation. Note that permeability is presented in log scale.
Permeability is an intrinsic parameter for the reservoir rock. Its measures the ease with which a fluid flows through the connecting pore space of the reservoir rock. The reservoir rock permeability is a vital property to determine the orientation movement and flow rate of the reservoir fluid in the formation. In this model, similar to the porosity model, the permeability model is built based on the permeability log generated. The harmonic average method was applied to scale up the well logs. Furthermore, Sequential Gaussian Simulation was used as the geostatistical method to create the permeability model. The permeability model shows that the permeability of the Guantao Formation ranges between 0.017 and 2,382 mD, having an average permeability of 128.37 mD. Among these, the averaged intrinsic permeability for Ng1, Ng2, and Ng3 is approximately 281.3, 221.5, and 126.1 mD, respectively. The outcome value indicated that the Guantao Formation has relatively high permeability. Figure 6B represents the permeability model of the Guantao Formation (Ng1–Ng3).
Figure 7 shows the converted VTU format geological mesh demonstrated in Paraview interface with respect to the porosity and permeability distributions. The converted mesh is composed of 4,506,687 points and 564,000 elements. For each small grid element, it holds a size of 50 m * 50 m * 10 m. The faults are incorporated in the mesh and assumed as vertical. They were implemented in the mesh for modeling the sharp discontinuity in the surface.
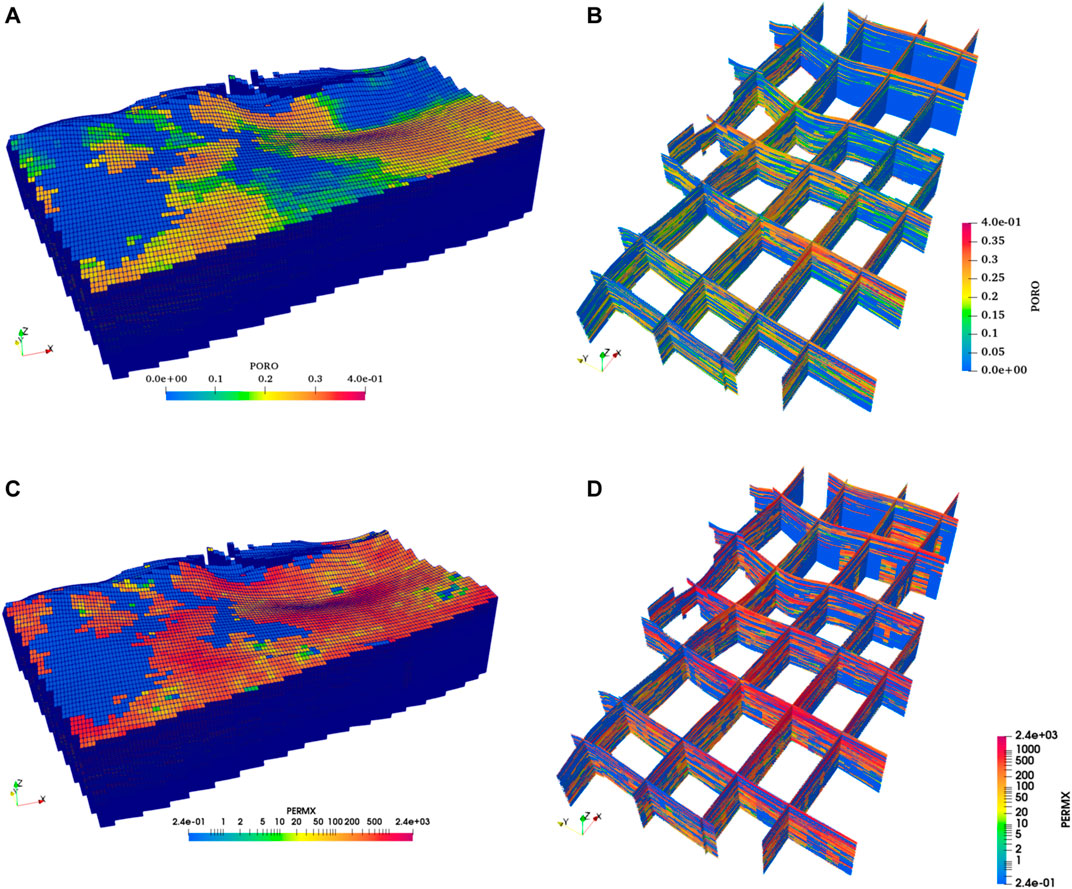
FIGURE 7. The converted mesh with (A) 3D porosity (–) distribution, (B) the cross-section profile of porosity, (C) 3D permeability (mD) distribution, and (D) the cross-section profile of permeability, shown in Paraview. Note that the permeability is presented in log scale.
This section presents the HT simulation results of the natural state of the geothermal reservoir. The natural-state model, with defined parameters and boundary conditions described in Section 3.2, was run with these initial conditions of temperature and pressure for a time span of 1 Ma. The results of the natural-state model were then compared with temperature measurements from different well logs and BHT data. The model was run numerous times during calibration to provide the best match between the simulation and measured static pressure and temperature data.
Temperature observations at different logs were used to quantify the accuracy of the modeled temperatures with independently measured datasets for HT model validation. A good agreement between measured and modeled temperatures is obtained for the HT model (Figure 8). The comparison with both the simulation and measurement temperature datasets consistently leads to the relative temperature errors of less than approximately 2°C.
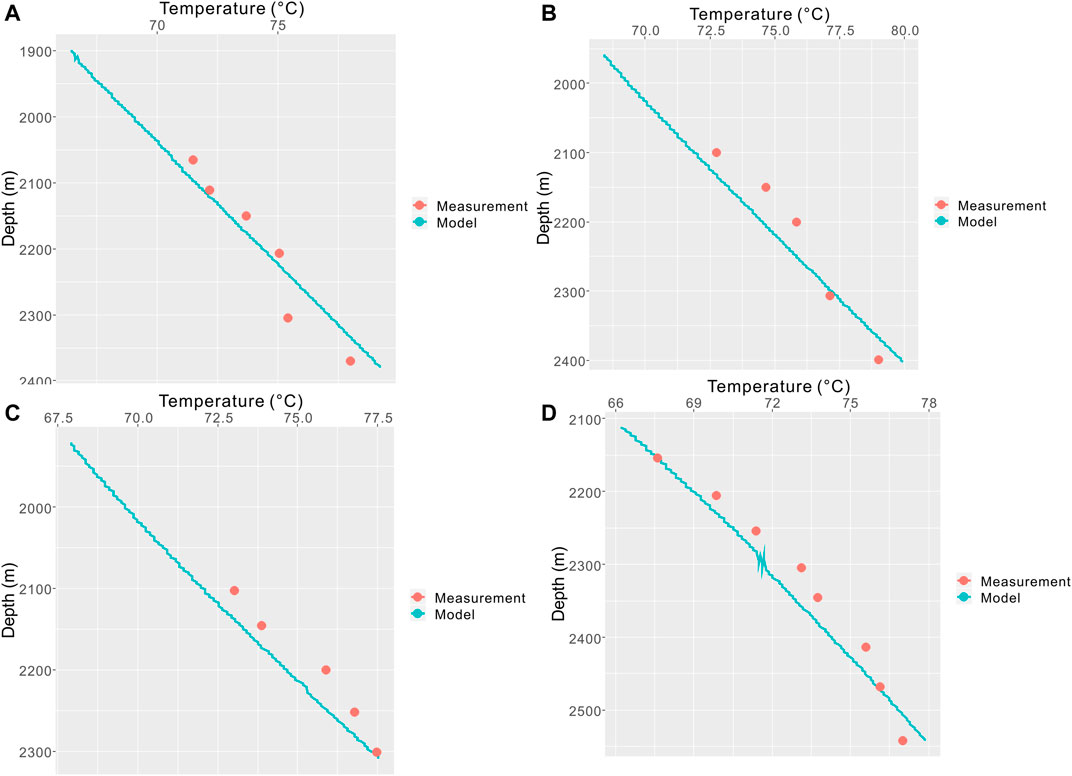
FIGURE 8. Comparison of simulated temperature data with the measured temperature data at different wells. The well locations are shown in Figure 2.
The simulated subsurface temperature field is characterized by significant lateral and vertical spatial variations across the Caofeidian area, reflecting the structural geological differences with large variations in the formation depth and heat flow. A significant geothermal anomaly zone can be found in the vicinity of the Gaoliu fault.
At a depth of 2,000 m (Figure 9A), it is largely located at the bottom formation of the Minghuazhen Formation (Nm). The temperatures range between 65°C and 85°C. Temperatures higher than 80°C can be observed at the middle margin of the Gaoliu fault. Large areas in this layer show temperatures of between 65°C and 75°C with local positive temperature anomalies usually associated with the Gaoliu fault. A higher temperature zone, higher than 75°C, is found in the southwest part.
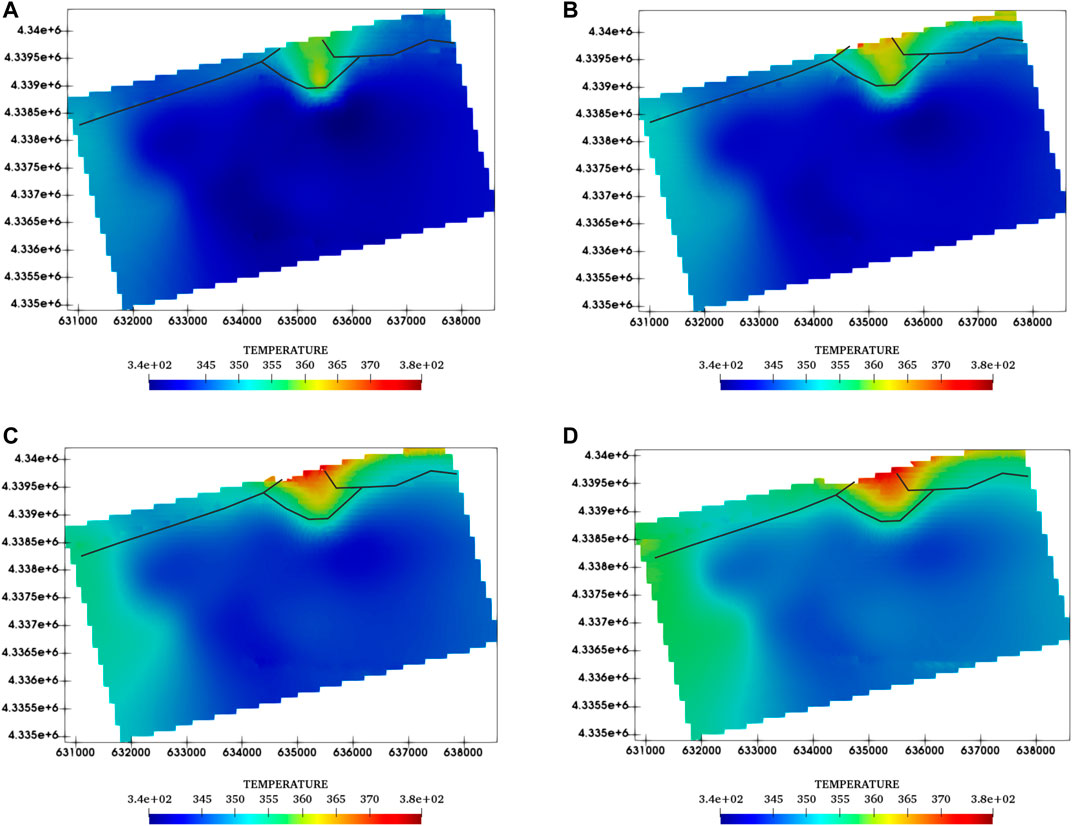
FIGURE 9. 2D profiles of temperature (K) distribution at different depths. (A) 2,000 m, (B) 2,100 m, (C) 2,200 m, and (D) 2,300 m.
At a depth of 2,100 m (Figure 9B), it is largely located in the Guantao Formation (member Ng1). The temperatures range between 70°C and 90°C. Temperatures higher than 85°C can be observed at the middle margin of the Gaoliu fault. Large areas in this layer show temperatures of between 70°C and 80°C with local positive temperature anomalies usually associated with the Gaoliu fault. A higher temperature zone, higher than 80°C, is found in the southwest part.
At a depth of 2,200 m (Figure 9C), it is largely located in the Guantao Formation (member Ng2). The temperatures range between 73°C and 95°C. Temperatures higher than 90°C can be observed at the middle margin of the Gaoliu fault. Large areas in this layer show temperatures of between 75 and 85°C with local positive temperature anomalies usually associated with the Gaoliu fault. A higher temperature zone, higher than 85°C, is found in the southwest part.
At a depth of 2,300 m (Figure 9D), it is largely located in the Guantao Formation (member Ng3). The temperatures range between 80°C and 110°C. Temperatures higher than 100°C can be observed at the middle margin of the Gaoliu fault. Large areas in this layer show temperatures of between 80°C and 90°C with local positive temperature anomalies usually associated with the Gaoliu fault. A higher temperature zone, higher than 90°C, is found in the southwest part.
According to the characteristics of the thermal reservoir medium in the study area, the traditional geothermal reservoir volumetric method was used to evaluate the geothermal resources in the Guantao Formation of the Caofeidian geothermal field. The total amount of heat contained in the rock mass and water in a certain area can be determined according to the formulations.
The parameters required to calculate the geothermal resources and geothermal fluid resources are listed in Table 1. Thus, the total geothermal resources of the Guantao Formation (Ng1–Ng3) in the Caofeidian geothermal field are calculated and summarized in Table 2. The recoverable geothermal resources are calculated by considering a geothermal energy recovery rate of 25%, “Geothermal Resources Geological Prospecting Specification” GB/T 11615–2010, China. The associated geothermal fluid resources can be also obtained by considering a hot water resource recovery rate of 20%.
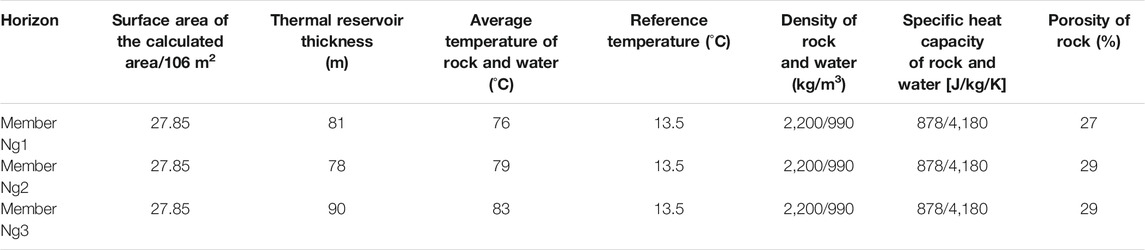
TABLE 1. Parameters for geothermal resource calculation in the traditional volumetric method (Dong et al., 2021).
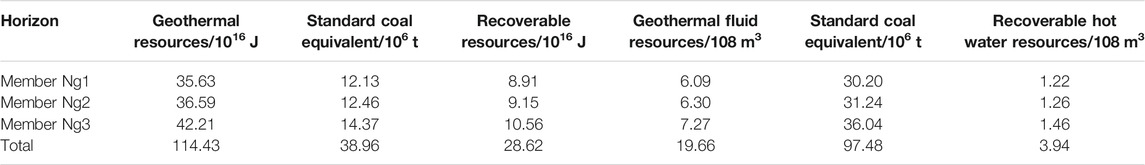
TABLE 2. Statistics on geothermal resources of Guantao Formation (Ng1–3) in Caofeidian geothermal field.
The coupling between the 3D geological model and natural-state HT numerical model allows the calculation of the total amount of geothermal energy distributed in each grid element. The 3D geological model is used for estimating the volume information of the geothermal reservoir.
Table 3 summarizes the total geothermal resources estimated by the proposed volumetric method and traditional method. The total geothermal resources estimated is 1.27e+18 J, which is 12.5% larger than the traditional method, while the total volume of member Ng1–Ng3 formations in the Caofeidian geothermal field is approximately 4.49e+9 m3, which is 35% less than the traditional estimation.
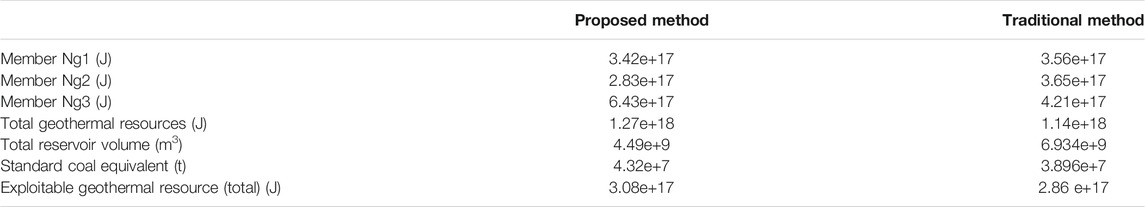
TABLE 3. The geothermal resource calculation (Ng1–Ng3), compared with the traditional volumetric method results.
Similar to the traditional calculation, member Ng3 bears the most geothermal resources, due to high temperature and large thickness. However, member Ng2 bears fewer geothermal resources than member Ng1, although its temperature is higher, which contrasts with the traditional method calculation.
The total geothermal fluid resource calculation estimated by the proposed volumetric method is shown in Table 4, compared with the traditional method. The total geothermal fluid volume estimated is 8.97e+8 m3, which is nearly half compared with the traditional methods, which can be explained by two facts: 1) the total volume of the Ng1–Ng3 formations estimated in the proposed method is 35% less than the traditional method, and 2) the porosity is overestimated in the traditional method.
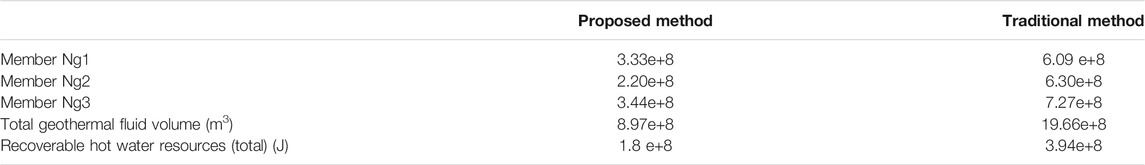
TABLE 4. The geothermal fluid volume calculation (Ng1–Ng3), compared with the traditional volumetric method results.
The proposed method can also exhibit the spatial distribution of the geothermal resources associated with each grid element. Figure 10 presents the local distribution of geothermal resources in members Ng1, Ng2, and Ng3.
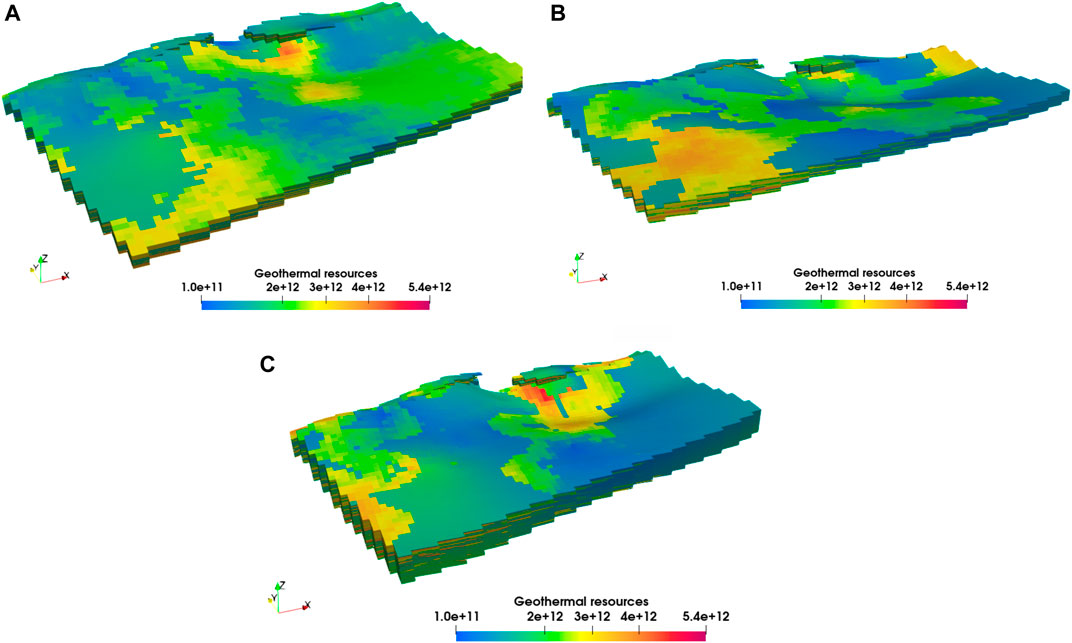
FIGURE 10. 3D model showing the geothermal resource (J) distribution: (A) member Ng1, (B) member Ng2, and (C) member Ng3.
This section aims to investigate the influence of saturation on geothermal resource estimation in oil fields. Fluid saturation is the crucial parameter for accurate estimation and is always assumed to be constant based on limited known data, which is obviously not true in oil and gas reservoirs, where water saturation may increase, while the oil and gas saturations decrease to some extent. The alterations of fluid saturations during hydrocarbon or geothermal productions may induce errors in geothermal resource estimation in oil fields. By courtesy of the oil field database, which could not only provide the oil/gas/water saturation but also the dynamic changes along with the production history, the operators are able to accurately evaluate the geothermal reserves at any interesting point of production history and help the decision making on the geothermal project.
The previous interpretation has only taken the saturated water into account; however, as mentioned before, the study area is located in an active oil field, which means it is very likely the geothermal fluid is mixed with oil. Such facts are also validated by the samples collected at the geothermal wells, such as GR4-1 and GR4-2. Therefore, in order to account for the influence of the oil and gas saturations on the total geothermal resources of this area, revised volumetric method calibration is carried out by assessing the geothermal resources with respect to water, oil, and gas. For this purpose, the revised volumetric method (Eq. 1) is extended as follows (Li and Sun, 2014):
where
Here, due to lack of the information and measured data regarding the oil saturation distribution at the Ng formation, a simple scenario is assumed by varying the oil and gas saturations from 0 to 1 while keeping the sum of both saturations at less than 1. A preliminary analysis is made thereby on the influence of oil and gas existence on the total geothermal resource assessment. Figure 11 depicts the estimated geothermal resource evolution with the gas and oil saturation. It can be observed that the increase of the oil and gas saturations leads to the decline of the overall geothermal energy. That can be explained by the fact that the density and specific heat capacity of oil and gas are less than those of water. The saturation of gas leads to a more significant contribution to the decline of geothermal resources, due to its density being even smaller.
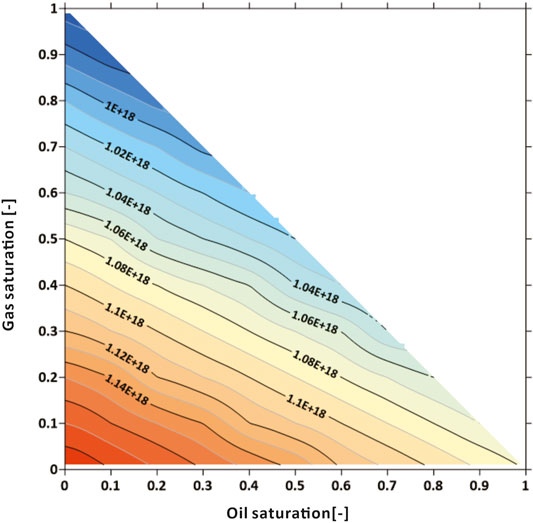
FIGURE 11. The estimated geothermal resources varying with gas and oil saturations.
This paper presents a comprehensive investigation of geothermal resource assessment in an active oil field. A revised volumetric method is proposed by integrating the 3D geological modeling into an HT-coupled numerical model. Special attention has been paid to account for the existence of the oil and gas phases.
In the proposed calculation method, a 3D geological model is introduced as the model basis. On the one hand, it provides detailed information on the reservoir volume; on the other hand, it serves as a basis and input geometry mesh to the HT numerical simulation. Moreover, HT natural-state numerical model addressed the temperature distribution in the reservoir by taking into account complex geological structures and highly contrasting heterogeneous distributed porosity and permeability. Therefore, the calculation results are more in line with the actual situation.
This approach improves the accuracy of the geothermal potential assessment. In the Caofeidian geothermal field, the geothermal resource is found to be 1.23e+18 J using the revised calculation method, which is 12.5% larger than those of the traditional volumetric method. The associated geothermal fluid volume is 8.97e+8 m3, which is nearly half of those calculated from the traditional method. Also, the possible distribution of available temperature data could be plotted in 3D, which helps identify the optimal place to develop geothermal resources.
The proposed method can provide solid information to the planning and management of deep geothermal resources in the Caofeidian new town geothermal field. It also demonstrates the potential to be applied to other geothermal reservoirs, especially for those with complex geological structures and high heterogeneities.
The original contributions presented in the study are included in the article/Supplementary Material, further inquiries can be directed to the corresponding authors.
YK and YC designed the study and gave conceptual advice. YH conducted the model runs, analyzed the model results, and prepared the manuscript. LR, JW, and YD provided raw data information and model parameters. FT contributed to the geological model setup. SP and KW helped the model post-process and visualization. All authors contributed to the editing of the manuscript and gave approval of the content in its current form.
This work was financially supported by the National Key Research and Development Program of China (No. 2019YFB1504101). We also acknowledge the support from National Natural Science Foundation of China (41902311, 42004060) and the Youth Innovation Promotion Association of CAS (2020067).
Authors LR and JW are employed by Jidong Oilfield Company of PetroChina. Author YD is employed by Advisory Center, China National Petroleum Corporation.
The remaining authors declare that the research was conducted in the absence of any commercial or financial relationships that could be construed as a potential conflict of interest.
All claims expressed in this article are solely those of the authors and do not necessarily represent those of their affiliated organizations, or those of the publisher, the editors, and the reviewers. Any product that may be evaluated in this article, or claim that may be made by its manufacturer, is not guaranteed or endorsed by the publisher.
We thank the PetroChina Jidong Oilfield Company and the individuals who contributed to the raw datasets and information used in this work.
Bédard, K., Comeau, F.-A., Raymond, J., Gloaguen, E., Malo, M., and Richard, M.-A. (2020). Deep Geothermal Resource Assessment of the St. Lawrence Lowlands Sedimentary basin (Québec) Based on 3D Regional Geological Modelling. Geomech. Geophys. Geo-energ. Geo-resour. 6 (3), 1–18. doi:10.1007/s40948-020-00170-0
Békési, E., Lenkey, L., Limberger, J., Porkoláb, K., Balázs, A., Bonté, D., et al. (2018). Subsurface Temperature Model of the Hungarian Part of the Pannonian Basin. Glob. Planet. Change 171, 48–64. doi:10.1016/j.gloplacha.2017.09.020
Békési, E., Struijk, M., Bonté, D., Veldkamp, H., Limberger, J., Fokker, P. A., et al. (2020). An Updated Geothermal Model of the Dutch Subsurface Based on Inversion of Temperature Data. Geothermics 88, 101880. doi:10.1016/j.geothermics.2020.101880
Blessent, D., Therrien, R., and MacQuarrie, K. (2009). Coupling Geological and Numerical Models to Simulate Groundwater Flow and Contaminant Transport in Fractured media. Comput. Geosciences 35, 1897–1906. doi:10.1016/j.cageo.2008.12.008
Calcagno, P., Baujard, C., Guillou-Frottier, L., Dagallier, A., and Genter, A. (2014). Estimation of the Deep Geothermal Potential within the Tertiary Limagne basin (French Massif Central): An Integrated 3D Geological and thermal Approach. Geothermics 51, 496–508. doi:10.1016/j.geothermics.2014.02.002
Carrier, A., Fischanger, F., Gance, J., Cocchiararo, G., Morelli, G., and Lupi, M. (2019). Deep Electrical Resistivity Tomography for the Prospection of Low- to Medium-Enthalpy Geothermal Resources. Geophys. J. Int. 219, 2056–2072. doi:10.1093/gji/ggz411
Cheng, Y., Pang, Z., Di, Q., Chen, X., and Kong, Y. (2021). Three-dimensional Resistivity Structure in the Hydrothermal System beneath Ganzi Basin, Eastern Margin of Tibetan Plateau. Geothermics 93, 102062. doi:10.1016/j.geothermics.2021.102062
Ciriaco, A. E., Zarrouk, S. J., and Zakeri, G. (2020). Geothermal Resource and reserve Assessment Methodology: Overview, Analysis and Future Directions. Renew. Sustainable Energ. Rev. 119, 109515. doi:10.1016/j.rser.2019.109515
Dong, Y., Huang, H., Ren, L., Li, H., DU, Z., E, J., et al. (2021). Geology and Development of Geothermal Field in Neogene Guantao Formation in Northern Bohai Bay Basin: A Case of the Caofeidian Geothermal Heating Project in Tangshan, China. Pet. Exploration Development 48, 775–786. doi:10.1016/S1876-3804(21)60063-0
Dong, Y., Xiao, L., Zhou, H., Wang, C., Zheng, J., Zhang, N., et al. (2010). The Tertiary Evolution of the Prolific Nanpu Sag of Bohai Bay Basin, China: Constraints from Volcanic Records and Tectono-Stratigraphic Sequences. Geol. Soc. America Bull. 122, 609–626. doi:10.1130/B30041.1
Fuchs, S., Balling, N., and Mathiesen, A. (2020). Deep basin Temperature and Heat-Flow Field in Denmark - New Insights from Borehole Analysis and 3D Geothermal Modelling. Geothermics 83, 101722. doi:10.1016/j.geothermics.2019.101722
Gascuel, V., Bédard, K., Comeau, F.-A., Raymond, J., and Malo, M. (2020). Geothermal Resource Assessment of Remote Sedimentary Basins with Sparse Data: Lessons Learned from Anticosti Island, Canada. Geotherm. Energ. 8, 1–32. doi:10.1186/s40517-020-0156-1
Guo, Y., Pang, X., Dong, Y., Jiang, Z., Chen, D., and Jiang, F. (2013). Hydrocarbon Generation and Migration in the Nanpu Sag, Bohai Bay Basin, Eastern China: Insight from basin and Petroleum System Modeling. J. Asian Earth Sci. 77, 140–150. doi:10.1016/j.jseaes.2013.08.033
Jiang, G., Hu, S., Shi, Y., Zhang, C., Wang, Z., and Hu, D. (2019). Terrestrial Heat Flow of continental China: Updated Dataset and Tectonic Implications. Tectonophysics 753, 36–48. doi:10.1016/j.tecto.2019.01.006
Kolditz, O., Bauer, S., Bilke, L., Böttcher, N., Delfs, J. O., Fischer, T., et al. (2012). OpenGeoSys: an Open-Source Initiative for Numerical Simulation of Thermo-Hydro-Mechanical/chemical (THM/C) Processes in Porous media. Environ. Earth Sciearth Sci. 67, 589–599. doi:10.1007/s12665-012-1546-x
Kong, Y., Pang, Z., Pang, J., Li, J., Lyu, M., and Pan, S. (2020). Fault-Affected Fluid Circulation Revealed by Hydrochemistry and Isotopes in a Large-Scale Utilized Geothermal Reservoir. Geofluids 2020, 1–13. doi:10.1155/2020/2604025
Lai, J., Pang, X., Xu, F., Wang, G., Fan, X., Xie, W., et al. (2019). Origin and Formation Mechanisms of Low Oil Saturation Reservoirs in Nanpu Sag, Bohai Bay Basin, China. Mar. Pet. Geology. 110, 317–334. doi:10.1016/j.marpetgeo.2019.07.021
Li, K., and Sun, W. (2014). Modified Method for Estimating Geothermal Resources in Oil and Gas Reservoirs. Math. Geosci. 47, 105–117. doi:10.1007/s11004-013-9516-8
Muffler, P., and Cataldi, R. (1978). Methods for Regional Assessment of Geothermal Resources. Geothermics 7, 53–89. doi:10.1016/0375-6505(78)90002-0
Pocasangre, C., and Fujimitsu, Y. (2018). A Python-Based Stochastic Library for Assessing Geothermal Power Potential Using the Volumetric Method in a Liquid-Dominated Reservoir. Geothermics 76, 164–176. doi:10.1016/j.geothermics.2018.07.009
Tian, B., Kong, Y., Gong, Y., Ye, C., Pang, Z., Wang, J., et al. (2020). An Improved Volumetric Method of Geothermal Resources Assessment for Shallow Ground Combining Geophysical Data. Renew. Energ. 145, 2306–2315. doi:10.1016/j.renene.2019.08.005
Wagner, W., and Kretzschmar, H.-J. (2008). “International Steam Tables: Properties of Water and Steam Based on the Industrial Formulation IAPWS-IF97,” in IAPWS industrial formulation 1997 for the thermodynamic properties of water and steam, 7–150. doi:10.1007/978-3-540-74234-0_3
Keywords: geothermal resource, geological model, HT model, geothermal energy in oil fields, fault model
Citation: Huang Y, Cheng Y, Ren L, Tian F, Pan S, Wang K, Wang J, Dong Y and Kong Y (2022) Assessing the Geothermal Resource Potential of an Active Oil Field by Integrating a 3D Geological Model With the Hydro-Thermal Coupled Simulation. Front. Earth Sci. 9:787057. doi: 10.3389/feart.2021.787057
Received: 30 September 2021; Accepted: 15 November 2021;
Published: 03 January 2022.
Edited by:
Mohammad Parsa, University of New Brunswick Fredericton, CanadaReviewed by:
Harish Puppala, BML Munjal University, IndiaCopyright © 2022 Huang, Cheng, Ren, Tian, Pan, Wang, Wang, Dong and Kong. This is an open-access article distributed under the terms of the Creative Commons Attribution License (CC BY). The use, distribution or reproduction in other forums is permitted, provided the original author(s) and the copyright owner(s) are credited and that the original publication in this journal is cited, in accordance with accepted academic practice. No use, distribution or reproduction is permitted which does not comply with these terms.
*Correspondence: Yanlong Kong, eWxrb25nQG1haWwuaWdnY2FzLmFjLmNu; Yuanzhi Cheng, Y2hlbmd5dWFuemhpQG1haWwuaWdnY2FzLmFjLmNu
Disclaimer: All claims expressed in this article are solely those of the authors and do not necessarily represent those of their affiliated organizations, or those of the publisher, the editors and the reviewers. Any product that may be evaluated in this article or claim that may be made by its manufacturer is not guaranteed or endorsed by the publisher.
Research integrity at Frontiers
Learn more about the work of our research integrity team to safeguard the quality of each article we publish.