- 1California Water Program, The Nature Conservancy, Sacramento, CA, United States
- 2Independent Researcher, Salt Lake City, UT, United States
- 3Contour Group, Salt Lake City, UT, United States
Groundwater dependent ecosystems (GDEs) are increasingly threatened worldwide, but the shallow groundwater resources that they are reliant upon are seldom monitored. In this study, we used satellite-based remote sensing to predict groundwater levels under groundwater dependent ecosystems across California, USA. Depth to groundwater was modelled for a 35-years period (1985–2019) within all groundwater dependent ecosystems across the state (n = 95,135). Our model was developed within Google Earth Engine using Landsat satellite imagery, climate data, and field-based groundwater data [n = 627 shallow (< 30 m) monitoring wells] as predictors in a Random Forest model. Our findings show that 1) 44% of groundwater dependent ecosystems have experienced a significant long-term (1985–2019) decline in groundwater levels compared to 28% with a significant increase; 2) groundwater level declines have intensified during the most recent two decades, with 39% of groundwater dependent ecosystems experiencing declines in the 2003–2019 period compared to 27% in the 1985–2002 period; and 3) groundwater declines are most prevalent within GDEs existing in areas of the state where sustainable groundwater management is absent. Our results indicate that declining shallow groundwater levels may be adversely impacting California’s groundwater dependent ecosystems. Particularly where groundwater levels have fallen beneath plant roots or streams thereby affecting key life processes, such as forest recruitment/succession, or hydrological processes, such as streamflow that affects aquatic habitat. In the absence of groundwater monitoring well data, our model and findings can be used to help state and local water agencies fill in data gaps of shallow groundwater conditions, evaluate potential effects on GDEs, and improve sustainable groundwater management policy in California.
Introduction
Groundwater is a critical water source for humans and ecosystems. However, increasing human demands for groundwater to support agriculture, industrial expansion, economic development, and population growth are resulting in the degradation of freshwater ecosystems (Dudgeon et al., 2006; Albert et al., 2020). Species or ecological communities that rely on groundwater for some or all their water needs are commonly referred to as Groundwater Dependent Ecosystems (GDEs). Groundwater provide GDEs with a reliable supply of water, thermoregulation, or a unique chemical composition to support unique habitat conditions for phreatophytes, animals and microorganisms within terrestrial, aquatic, and coastal ecosystems (Eamus et al., 2015; Hoyos et al., 2016).
Sustainable groundwater management policies and regulations to balance human and ecosystem water needs have been increasing worldwide (Rohde et al., 2017). To achieve groundwater sustainability, it is imperative that the water needs of a diverse set of users (including GDEs) are integrated into water management decisions. However, groundwater information, particularly depth-to-groundwater data in shallow aquifers that typically support GDEs, are often limited due to gaps in groundwater monitoring and the prioritization of monitoring wells in deeper portions of the basin. This study is focused on California where GDEs are legally recognized under the Sustainable Groundwater Management Act (SGMA; State of California, 2014) and mapped by the State of California [California Department of Water Resources (CDWR), 2018]. However, long-term shallow depth-to-groundwater data remains a significant data gap in California. The objectives of this paper are to: 1) use machine learning algorithms to model shallow depth to groundwater (DTG) underlying GDEs across California, 2) analyze long-term and multi-decadal trends in DTG beneath GDEs, and 3) determine which GDEs in California are experiencing chronic groundwater level declines.
New remote sensing techniques, cloud computing, and emerging datasets are helping to fill groundwater data gaps (Díaz-Alcaide and Martínez-Santos, 2019). For example, the Gravity Recovery and Climate Experiment (GRACE) satellite data have been used to detect groundwater storage losses across large geographies globally, such as in NW India (Rodell et al., 2009), California’s Central Valley (Scanlon et al., 2012; Scanlon and Faunt, 2012), and the High Plains Aquifer in the Central United States (Rodell and Famiglietti, 2002; Strassberg et al., 2009; Rateb et al., 2020; Scanlon et al., 2021). Although GRACE-derived groundwater storage changes agree with groundwater level monitoring data in most U.S. major aquifers (Rateb et al., 2020), the spatial (> 150,000 km2) and temporal (monthly) resolution of GRACE data are too coarse to fill in sparse piezometric data over large areas. Although groundwater level contour mapping with sparse borehole data can be improved with Bayesian data fusion approaches (Fasbender et al., 2008), significant errors around GDEs are likely if borehole data are tracking deeper regional aquifers instead of shallow or perched aquifers that have their own water table.
Machine learning algorithms have become increasingly popular for solving complex, non-linear problems in ecology and earth sciences that are often hindered by heterogeneous conditions and data gaps (Thessen, 2016; Rajaee et al., 2019). In contrast to traditional process-based numerical modeling methods, which require large, observationally based datasets and input parameters, machine learning approaches are also increasingly being used in hydrogeological applications since they are data-driven and require less calibration than process-based models (Shen et al., 2018). For example, machine learning is being used to predict temporal groundwater dynamics (Daliakopoulos et al., 2005; Banerjee et al., 2009; Adamowski and Chan, 2011; Yoon et al., 2011; Shiri et al., 2013; Gholami et al., 2015), groundwater availability (Hussein et al., 2020), map the water table (Fienen et al., 2013; Koch et al., 2019a), model groundwater quality conditions (Winkel et al., 2011; Nolan et al., 2015; Erickson et al., 2018; Koch et al., 2019b), and strengthen traditional physical-based numerical groundwater models (Shen et al., 2018).
This study employs the ensemble-based Random Forest machine learning method to model depth to groundwater beneath GDEs across California. Random Forest integrates multiple variables into a series of randomly constructed decision tree models to make a prediction (Breiman, 2001). Random Forest was selected because it is computationally efficient, does not overfit, and can handle many predictors, containing continuous, categorical, or nominal (binary) data, even from small datasets with a low number of observations (Belgiu and Drăguţ, 2016; Maxwell et al., 2018). Here, we combine 35 years of 30 m spatial resolution Landsat satellite imagery, climate data, and field-based groundwater data (n = 55,260 groundwater elevation observations) to model depth to groundwater in GDEs (n = 95,135 individual GDEs) across California using a Random Forest algorithm. We used Google Earth Engine (GEE), an application program interface (API; Gorelick et al., 2017) that enables complex computing across large spatial and temporal scales, to run the data processing and modeling. GEE uses Google’s computing infrastructure which greatly improves data acquisition, processing speeds and enables the development of complex algorithms over large datasets in a manner that was nearly impossible in the recent past. In this study, we model annual depth to groundwater from 1985 to 2019 for individual GDEs, and then use these data to evaluate depth-to-groundwater trends in GDEs across California. Finally, we discuss the implications of our findings in the context of sustainable groundwater management in California.
Materials and Methods
Study Area
The study area includes GDEs located within California’s 515 groundwater basins, as defined by the California of Water Resources [California Department of Water Resources (CDWR), 2020a]. California is divided into ten hydrologic regions that correspond to the state’s major drainage basins (CNRA, 2021) and they are used to contextualize the study results. Statewide GDE vegetation data were obtained from the Natural Communities Commonly Associated with Groundwater dataset (Natural Communities Commonly Associated with Groundwater dataset; Klausmeyer et al., 2018) hosted by the California Department of Water Resources [California Department of Water Resources (CDWR), 2018], and created in partnership with the California Department of Fish and Wildlife and The Nature Conservancy of California. The NC dataset is a compilation of 48 publicly available state and federal agency datasets that map vegetation, wetlands, springs, and seeps associated with groundwater in California, and is the best available information for identifying GDEs across California’s groundwater basins. There are two main habitat classes included in the NC dataset: 1) wetland features that are commonly associated with natural, unmodified surface expressions of groundwater (n = 78,810 mapped polygons); and 2) vegetation communities dominated by phreatophytes that are commonly associated with subsurface groundwater (n = 98,275 mapped polygons). Groundwater-dependent plants (phreatophytes) have long been used as indicators of groundwater, since their roots can extend deep beneath the Earth’s surface to access groundwater (Meinzer, 1927). This study uses only the phreatophytic vegetation data layer, since changes in groundwater levels can be detected in the canopy by satellites (Eamus et al., 2015; Huntington et al., 2016; Kibler et al., 2021; Rohde et al., 2021).
Random Forest Modeling and Analysis
Groundwater Data
For this study, we included vegetation polygons that were ≥900 m2 (1 Landsat pixel) in size and were within a 1 km radius of a nearby well that met the following well selection criteria: 1) observed DTG values ≤6.1 m to better reflect conditions in the rooting zone of most GDEs (Canadell et al., 1996); 2) a minimum of 5 years of observations within the 35-years period of interest to reflect temporal trends for model calibration; and 3) an upper screening interval <30 m to select for wells that are drawing water from shallow unconfined aquifers. This resulted in a total of 631 wells and 3,097 vegetation GDE polygons that were associated with those wells and were then used as the training data to develop and validate the Random Forest regression model (Figure 1). Some GDEs are within 1 km of multiple wells, resulting in 4,932 unique well and GDE combinations. Annual mean (1984–2019) DTG for these wells were calculated using data from the California Department of Water Resources SGMA Data Viewer [California Department of Water Resources (CDWR), 2021]. Each of these well and GDE combinations have multiple years of DTG measurements, resulting in a total of 55,614 training samples; each representing a unique combination of GDE, well, and year.
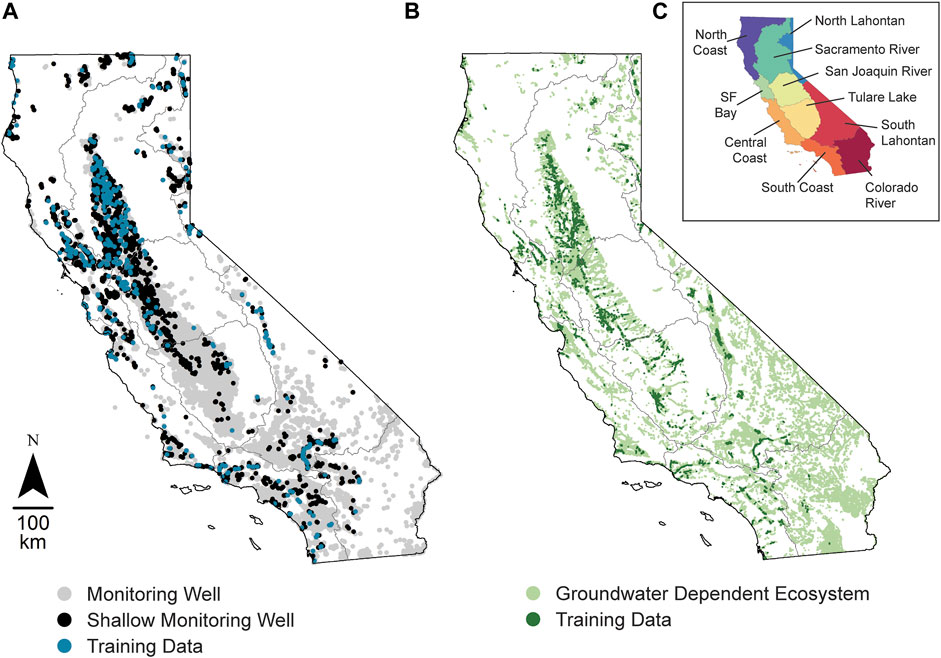
FIGURE 1. Statewide data distribution and training data selection for this study. (A) Groundwater monitoring well distribution statewide. Groundwater elevation data from 631 wells met the study’s selection criteria to be used as training data. Out of the 42,401 monitoring wells that exist statewide, only 3,097 monitor shallow groundwater. (B) Groundwater dependent ecosystem (GDE) distribution statewide. GDEs existing within 1 km of a shallow monitoring well were selected to be used as training data (n = 3,082 GDEs). (C) Hydrologic regions of California.
Predictor Variables and Data Processing
Climate Data
Daily-interpolated climate data were acquired from NASA’s Daily Surface Weather Data (Daymet) and are available daily from 1980 to present across North America at 1 km spatial resolution (Thornton et al., 2016). The Daymet dataset is created by interpolating daily observations from surface weather stations in the Global Historical Climatology Network (GHCN; Menne et al., 2012). For this study, daily minimum temperature, maximum temperature, and precipitation were averaged over each water year (October 1–September 30) to create annual composites of the Daymet data from 1985 to 2019 for the entire study area.
Landsat Data
The Landsat data record dates from 1972, with 30 m spatial resolution data available at least every 16 days since 1984 (USGS, 2021a). We included all USGS Tier 1 Landsat 4 and Landsat 5 Thematic Mapper, Landsat 7 Enhanced Thematic Mapper+ (Sayler, 2020a) and Landsat 8 Operational Land Imager (Sayler, 2020b) surface reflectance corrected multispectral imagery available within GEE. Surface reflectance data during the summer months (June 1–September 30) from 1984 to 2019 across California were selected. The summer months were chosen since phreatophytes are physiologically active and more likely using groundwater during that period when surface water and precipitation is scarce (Huntington et al., 2016). Landsat data from different sensors were not cross-calibrated, since the calibration models have intercepts near zero and slopes close to one (Roy et al., 2016; Chastain et al., 2019). These results indicate that cross-calibration is not needed to provide temporally consistent datasets across multiple sensors. Clouds and cloud shadows were masked using the CFmask algorithm (Zhu and Woodcock, 2012, 2014a; Zhu et al., 2015). We reduced the spectral observations from the Landsat record to a set of 35 annual composites from 1985 to 2019 for the entire study area using a multi-band medoid selection process following (Kennedy et al., 2018), which provides a smoothed, annualized dataset. The wavelengths of the Landsat spectral bands used in these annual composites range from visible to middle infrared wavelengths (0.45–2.35 nm). We normalized these to each other to generate a suite of vegetation indices (Table 1) that have documented relationships to the presence of photosynthetic chlorophyll or moisture, which potentially correlates to DTG.
Temporal Segmentation
Various temporal segmentation algorithms have been developed to monitor changes in vegetation cover using optical remote sensing data. Each of these algorithms parses spectral time series into discrete temporal segments to minimize the influence of noise and to identify changes and trends more easily (Kennedy et al., 2010; Verbesselt et al., 2010; Zhu and Woodcock, 2014b). We use the GEE LandTrendr algorithm (Kennedy et al., 2018) since it is designed to run on an annualized time series. LandTrendr runs an iterative sequence of linear regressions and identification of potential vertices using their deviation from the regression lines to section the time series into discrete linear segments. The output data includes information about each segment, including its start and end vertex, its duration, slope, and magnitude of change. This information can also be used to infer the fitted values along each of the segments (Kennedy et al., 2010). Although LandTrendr was originally developed to detect trends in forest disturbance and recovery (Kennedy et al., 2010; Cohen et al., 2018), its basic linear regression approach is appropriate to identify trends and reduce noise in a wide range of remote sensing and other environmental time series. The LandTrended temporal stack of all Landsat bands, vegetation indices and Daymet data was then used to calculate the annual zonal mean of all satellite-based predictor variables for each GDE. This helps the model identify temporal trends at the GDE scale. For this study, we segment each vegetation index from the Landsat medoid composite time series, as well as the temperature and precipitation Daymet times series, at the pixel level using LandTrendr. We utilize the fitted values for each year as well as the magnitude of change for each segment as the predictor layers for the Random Forest model.
Categorical Predictor Variables
In addition to the LandTrended Landsat and Daymet time series described above, several categorical variables were included as predictor variables to the Random Forest model. These include USGS watershed boundaries (HUC 8; USGS, 2021b), biome (TNC, 2009), ecoregion (TNC, 2009), hydrological regions [correspond to the state’s ten major drainage basins; (CNRA, 2021)], and vegetation macrogroup {vegetation data from the NC dataset, grouped using the California Department of Fish and Wildlife hierarchical natural communities classification [California Department of Fish and Wildlife (CDFW), 2021]}.
Random Forest Model Development and Analysis
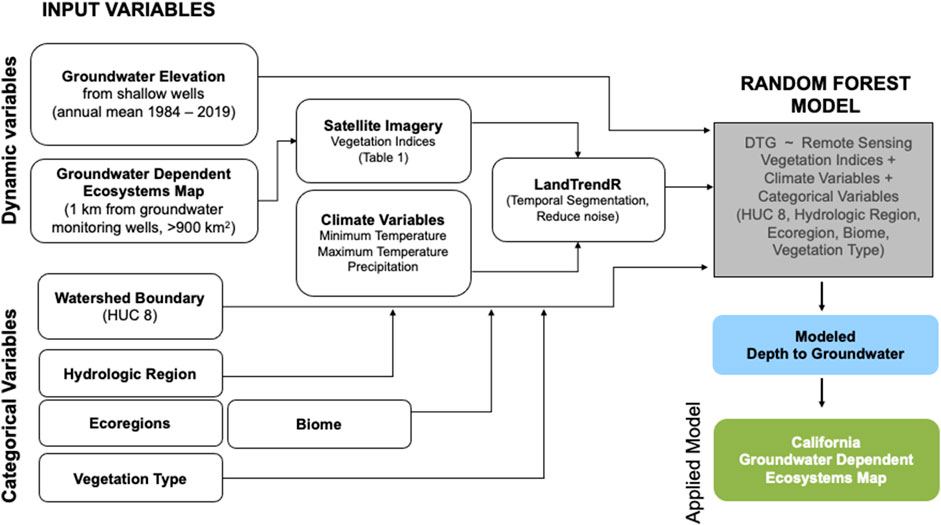
The Random Forest algorithm is a statistical model that trains an ensemble of classification and regression tree (CART) models populated by random subsets of the model calibration data and predictor variables (Breiman, 2001). The trees are created by drawing a subset of training samples through replacement (a bagging approach), resulting in some samples that are selected several times and others never selected, or the out-of-bag fraction. Since we were predicting a continuous variable (DTG), we ran the model in regression mode, which also allows for the computation of model error metrics, such as root mean squared error (RMSE), using the samples that are not included in the training of each tree (out-of-bag). Figure 2 shows a flowchart of the full modeling framework, including the training data, generation of predictor layers, and final predicted DTG values.
The trained Random Forest model was applied to the 98,275 GDEs that met our selection criteria (see Study Area) and for each year from 1985–2019, creating a continuous annual time series of predicted DTG values for each GDE.
Temporal and Spatial Trend Analysis of Model Output
To better understand DTG trends in shallow aquifers linked to GDEs across California, we summarized the ordinary least squares (OLS) linear trends over time. These were calculated using the statsmodels Python package (Seabold and Perktold, 2010) across three different time periods on the predicted DTG time series. These periods were 1985–2019 (long-term), 1985–2002 (early period), and 2003–2019 (late period). The results from the analysis were then spatially summarized by state, hydrologic region, and groundwater basin for each of the three study time periods. The hydrologic region and groundwater basin boundaries are used by the California Department of Water Resources and many other state and local agencies to designate management areas in California.
To determine which GDEs experienced significant long-term increases or decreases in DTG, we assessed the statistical significance of the linear trends for modelled DTG within each GDE by testing whether the OLS slopes were significantly different from zero using the Mann-Kendall test in the pyMannKendall Python package (Hussain and Mahmud, 2019) and a p-value of 0.05. For the multi-decadal comparison, we compared the early period (1985–2002) and late period (2003–2019) DTG slopes using a t-test to evaluate whether the trends were significantly different across decades.
Results
Model Performance and Results
Our final model, which was calibrated with the 55,614 unique training data observations (GDE-well-year combinations), had an out-of-bag error of 0.77 m. The model used 90 decision trees, each using an out-of-bag fraction of 0.5 and 7 predictor variables per split; the latter is approximately the square root of the 47 predictor variables used in the model (Supplementary Figure S1). The variables with the most predictive power (also known as variable importance) were primarily the climate-related variables, followed by the fitted spectral LandTrendr values (Supplementary Figure S1). Fitted NIR (near-infrared) and tasseled cap brightness were the top two predictor vegetation indices. All the top vegetation indices are either sensitive to the presence of photosynthetic vegetation or moisture. The HUC 8 watershed, hydrologic region, and vegetation macrogroup of each GDE were more important predictor variables than most vegetation indices. Supplementary Figure S2 shows an example of the time series of modeled DTG values plotted alongside DTG observations from a nearby well.
Temporal and Spatial Groundwater Trends
Statewide
Based on our model, 44% of GDEs statewide experienced significant declines in groundwater levels, while only 28% experienced a significant increasing trend in groundwater levels between 1985 and 2019 (Table 2). When comparing declining groundwater level trends across the early and late periods (Supplementary Figure S3), significant groundwater level declines were more prevalent in the latter half of the study period (2003–2019; 39% of GDEs) compared to the preceding decades (1985–2002; 27% of GDEs). These modelled results are consistent with GRACE-derived groundwater trends in the Central Valley (Scanlon et al., 2012; Rateb et al., 2020). These declining groundwater trends suggest that more GDEs may have experienced greater water stress in more recent decades (2003–2019) than in the past (1985–2002).

TABLE 2. The percent of all California GDEs by count (n = 95,135) with decreasing, insignificant, or increasing ordinary least square linear trends in groundwater levels, as well as the median trend (cm/yr), across the long-term, early, and late time periods. Significance is at 0.05.
Hydrologic Regions
The statewide results obscure interesting patterns in modeled shallow groundwater levels on a regional scale. To reveal some of these regional patterns, we summarized the proportion of GDEs with significant increasing and decreasing groundwater level trends by the ten hydrologic regions in California (Figure 3; Supplementary Table S1). In eight of the ten hydrologic regions, the proportion of GDEs with long-term declining groundwater level trends was greater than the proportion of GDEs with increasing groundwater level trends (Figure 3A). Several hydrologic regions (i.e., Sacramento River, Central Coast, North Lahontan, and San Joaquin River) have over 50% of GDEs with significantly declining groundwater levels in the long-term. The Sacramento River hydrologic region contains over 20,000 GDEs (the highest number of GDEs compared to all the other hydrologic regions) and also has the highest proportion of GDEs with significant declining trends (60%), indicating increasing stresses on these important ecosystems. The median trend for all GDEs in the Sacramento River was −0.92 cm/year, indicating a median drop in groundwater levels of 0.3 m over the 1985–2019 period.
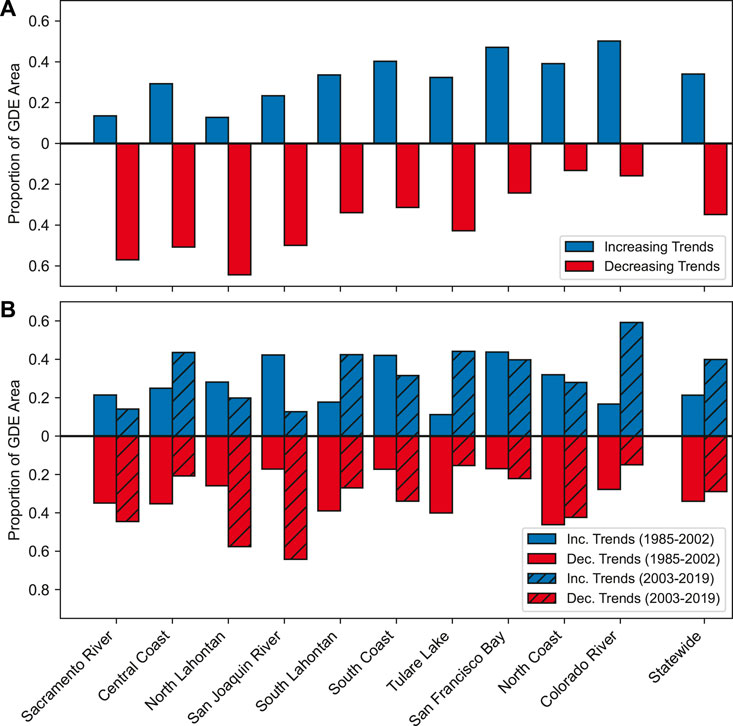
FIGURE 3. The proportion of GDEs with significant declining and increasing groundwater level trends by hydrologic region across three temporal time periods: (A) long-term trend (1985–2019) and (B) early period (1985–2002; solid) and late period (2003–2019; hatch).
In addition to the long-term (1985–2019) trends, the trends from the early (1985–2002) and late (2003–2019) time periods indicate changes over the years (Figure 3B and Supplementary Table S1). For example, in the early period, a greater proportion of GDEs in some regions (e.g., San Joaquin River and San Francisco Bay regions) had increasing groundwater level trends but transitioned towards declining DTG in the late period. Conversely, GDEs in other regions (e.g., Central Coast and Tulare Lake regions) had declining groundwater levels for a majority of GDEs in the 1985–2002 period but transitioned to increasing trends in the 2003–2019 period. A more detailed time series view of the changes in the modeled DTG for each hydrologic region is available in Supplementary Figure S4. Supplementary Figure S4 also shows how the median DTG is different in each region with more shallow groundwater in San Francisco Bay and the San Joaquin River hydrologic regions, and deeper groundwater in the Sacramento River and South Coast regions.
Groundwater Basins
Because groundwater basins are important geospatial units for groundwater management in California, we examined the groundwater level trends within these spatial units. We identified 457 basins with at least one GDE that meets the minimum size requirement (> 900 m2), and then mapped the count of GDEs by basin (Supplementary Figure S5). The statewide long-term median temporal groundwater level trend (Figure 4A) shows additional spatial detail on groundwater level trends not evident in the hydrologic region summaries. For example, the long-term median trend for the San Joaquin hydrologic region is decreasing (−0.62 cm/yr, Supplementary Table S1), but within that hydrologic region, some groundwater basins show a general increasing trend in modeled groundwater levels. In contrast, the Colorado River hydrologic region has an increasing long-term median trend (0.35 cm/yr), but some basins within the region are experiencing long-term groundwater level declines. Figures 4B,C show the median trends by groundwater basins in the early and late periods; respectively. As with the hydrologic region summaries (Figure 3), these maps show greater declines in the Sacramento and San Joaquin regions in the 2003–2019 period, and some increasing trends in the Tulare Lake and Central Coast regions.
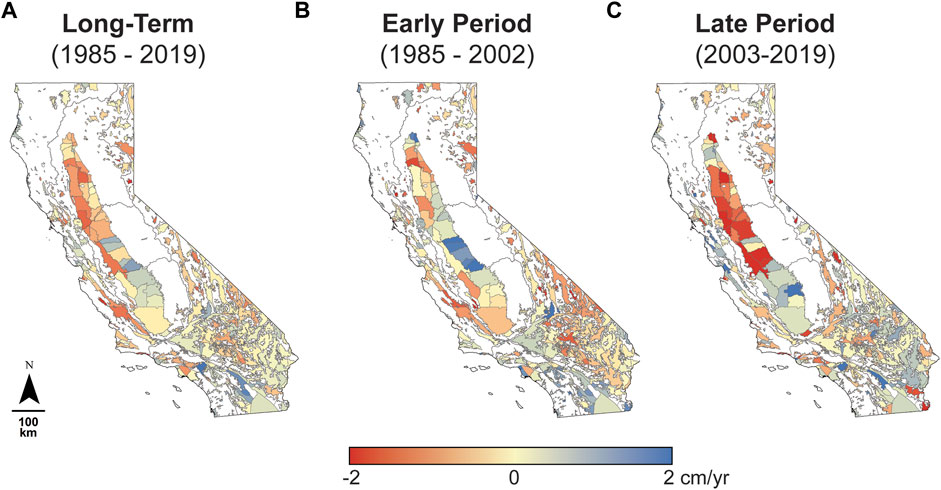
FIGURE 4. Median temporal groundwater level trends by groundwater basin for the (A) long-term (1985–2019), (B) early period (1985–2002), and (C) late period (2003–2019). Hydrologic regions are delineated with the black outline (see Figure 1C for hydrologic region names).
To explore the spatial trends in groundwater levels further we mapped the percent of GDEs with significant increasing or decreasing groundwater level trends by groundwater basin (Figure 5). We focused this analysis on basins with at least ten GDEs (n = 357 groundwater basins; Supplementary Figure S5). Across the state there are more groundwater basins with >50% of its GDEs experiencing a significant decline in groundwater levels (n = 191 groundwater basins; 37% of all groundwater basins) than significant increases in groundwater levels (n = 103 groundwater basins; 20% of all groundwater basins) over the past 35 years (Supplementary Table S2). The declining trends are more apparent in the late period (Figure 5F) than the early period (Figure 5D). In the late period, 22% of groundwater basins (n = 77) had >50% GDEs with a significant decline in groundwater levels compared to only 18% (n = 64) in the early period. The trends are not uniform across the state, and groundwater levels increased in some basins while decreased in others. Over the long-term, we found evidence of widespread declines in 54 basins, where >90% of the GDEs have experienced significant declines in shallow groundwater levels (e.g., Paso Robles, Upper Ventura River, Carpinteria, San Luis Obispo Valley), and in ten basins where >90% of the GDEs have experienced significant increases (e.g., Santa Margarita). However, the majority (89%) of basins with >90% of GDEs in the basin experiencing long-term groundwater declines were in the unregulated basins (non-SGMA or adjudicated).
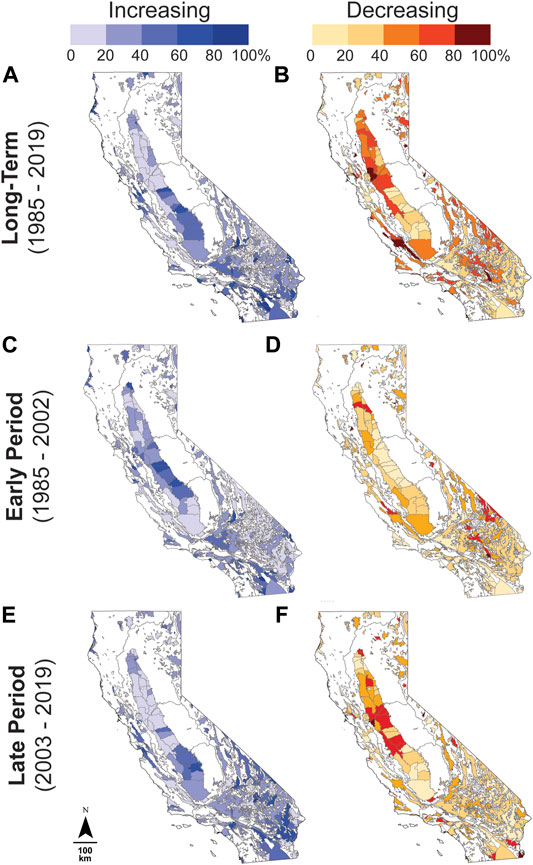
FIGURE 5. Percentage of GDEs within each groundwater basin (with more than 10 GDEs) with significantly increasing (A,C,E) and decreasing (B,D,F) groundwater level trends for the long-term (1985–2019); (A,B), early period (1985–2002); (C,D), and late period (2003–2019); (E,F).
Case Studies
Our results show that while shallow groundwater trends in GDEs throughout California have mostly been in decline over the long-term and particularly in recent decades, groundwater trends are location specific. Spatial differences in groundwater trends are likely due to varying water management regimes and other confounding factors such as surface water flow, dam releases, or wastewater treatment plant discharges (Rohde et al., 2021). To illustrate how these confounding factors can affect groundwater trends, we provide three case study examples of groundwater basins from three hydrologically distinct regions with various groundwater management histories: Santa Clara River Valley, Owens Valley and Mojave River Valley (Figure 6).
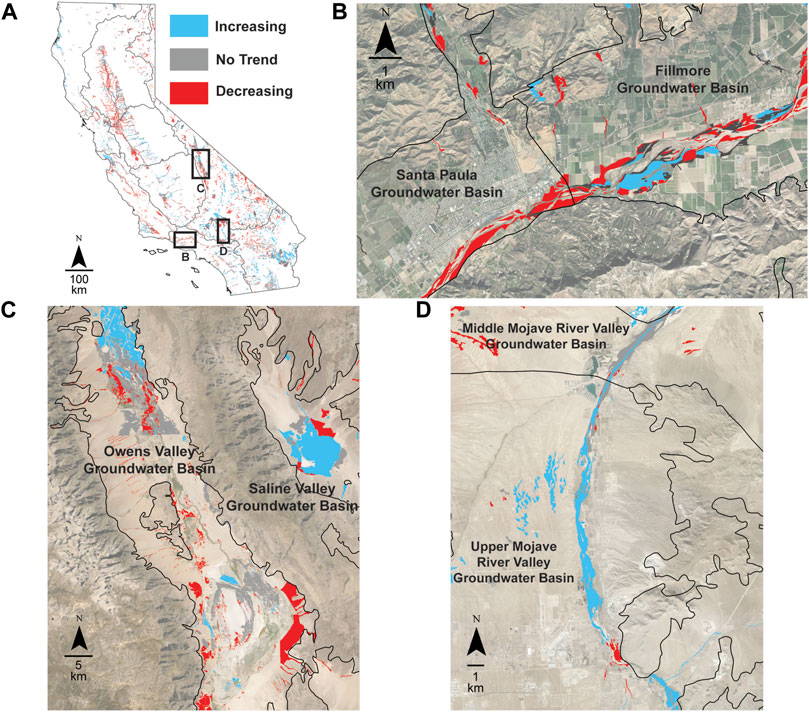
FIGURE 6. Case Study locations across California (A) to compare long-term (1985–2019) modelled groundwater level trends (increasing, no trend, decreasing) with monitoring shallow groundwater level data for GDEs within the (B) Santa Clara River Valley, (C) Owens Valley, and (D) Mojave River Valley.
Santa Clara River Valley
The Santa Clara River Valley was selected as a case study (Figure 6B), since it contains five groundwater basins that are subject to SGMA regulations and because sustainable groundwater management has been absent in the previous decades. The Santa Clara River is the largest river system in southern California, originating in the northern slopes of the San Gabriel Mountains in Los Angeles County and flowing southwest through Ventura County towards the Pacific Ocean. Extensive patches of high-quality riparian habitat, many of which are groundwater-dependent, are present along the river. Native cottonwoods (Populus spp.) and willows (Salix spp.) are common along the Santa Clara River, however, invasive non-native Arundo donax is increasingly prevalent particularly along river reaches with deep groundwater (Cal-IPC, 2011). Native riparian woodlands along the Santa Clara River support important threatened and endangered species, such as Least Bell’s Vireo (Vireo bellii pusillus) and Willow Flycatcher (Empidonax traillii) that are protected under the federal and state Endangered Species Acts and are actively undergoing recovery efforts by state and federal agencies such as the US Army Corps of Engineers, US Fish and Wildlife, and California Department of Fish and Wildlife.
Over the long-term period (1985–2019), modelled DTG trends within GDEs along the Santa Clara River have predominantly been in decline with 55% of the GDEs (n = 632 GDE polygons; 26 km2) having experienced significant decreases in groundwater levels (Supplementary Table S3). Groundwater declines have been more pronounced in the late period (45% of GDEs; 24 km2) compared to the early period (32% of GDEs; 14 km2). These modelled trends are consistent with available monitoring well data, which are only available from 2010–2016 (Figure 7).
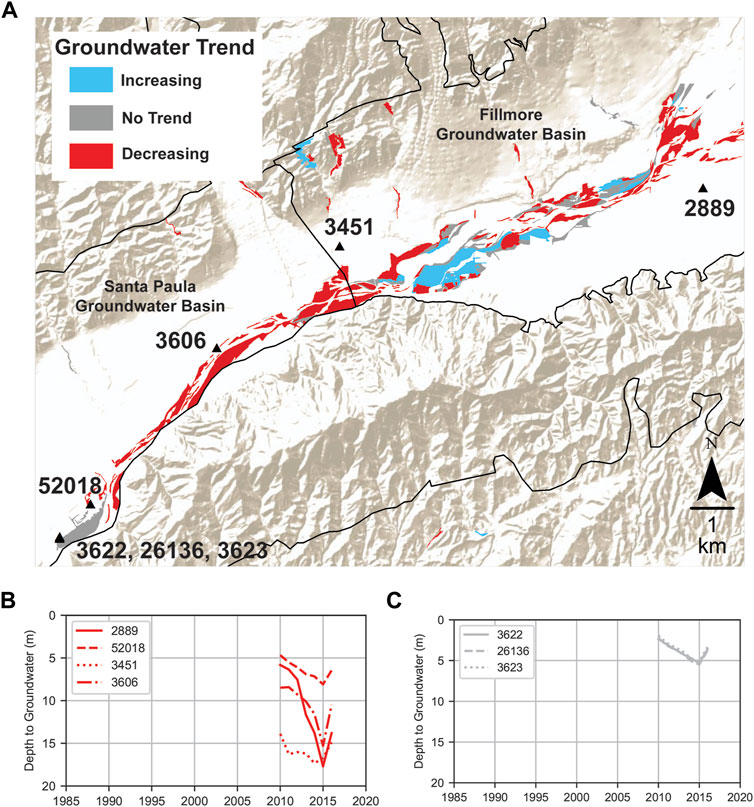
FIGURE 7. Santa Clara River Valley case study comparison of (A) long-term groundwater level trends (1985–2019), (B) shallow groundwater levels from monitoring wells nearby GDEs with long-term decreasing trends, and (C) shallow groundwater levels from monitoring wells nearby GDEs with no significant long-term trends. There were no monitoring well data near GDEs with long-term increasing trends.
During the last drought, GDEs along the river have exhibited strong physiological responses to groundwater level declines. Recent research has found that depth to groundwater increased up to 15 m in some parts of the Santa Clara River floodplain during the 2012–2016 drought, triggering widespread mortality for native riparian vegetation (Kibler et al., 2021). When groundwater remained within 4 m from the surface, the riparian woodlands were resilient throughout the drought. When groundwater levels are too deep to support native riparian woodlands, such as willows and cottonwoods, the ecosystem can shift to an Arundo-dominated system that has very little habitat value and results in excessive evapotranspiration water losses and wildfire risk to the basin. With SGMA implementation recently underway in the Santa Clara River groundwater basins, failing to prevent groundwater conditions in the basin from causing adverse impacts to GDEs, such as widespread riparian woodland mortality that provides critical habitat for these listed species, is not only a “significant and unreasonable” impact to GDEs under SGMA, but is also subject to these other state and federal laws such as state and federal Endangered Species Acts (State of California, 2014; State of California, 2016; Rohde et al., 2019).
Owens Valley
Owens Valley was selected as a case study (Figure 6C) since it is the only groundwater basin in California, prior to SGMA, that has been explicitly balancing groundwater use for humans and ecosystems for multiple decades. The Owens Valley groundwater basin is located east of the Sierra Nevada Mountains, west of the White and Inyo Mountains, and north of the Mojave Desert. Owens Valley is an arid valley that provides water to the Los Angeles Aqueduct under the 1991 Inyo County and Los Angeles Long-Term Water Agreement (County and Angeles, 1991). The Agreement was established to manage groundwater pumping to avoid substantial groundwater declines for phreatophytes in Owens Valley. Under the Agreement, baseline vegetation conditions are used to control future groundwater pumping, and routine and comprehensive monitoring is required to prevent impacts to groundwater-dependent vegetation. The Agreement also prescribes mitigative measures to reconcile some of the adverse effects of past pumping. If there is sufficient soil water provided by the shallow groundwater to satisfy plant water requirements (grass-dominated phreatophytes are assumed to have a 2 m root zone and shrubs a 4 m root zone), then production wells can pump groundwater into the Los Angeles Aqueduct.
Over the long-term period (1985–2019), modelled groundwater levels within GDEs within Owens Valley have predominantly (62% of GDEs) been increasing or stable, with 22% of GDEs (n = 1,047 GDE polygons; 165 km2) having experienced significant increases in groundwater and 40% of GDEs (n = 1,228 GDE polygons; 299 km2) having experienced no significant groundwater trends (Supplementary Table S4). Groundwater declines have been more pronounced in the late period (42% of GDEs; 311 km2) compared to the early period (32% of GDEs; 241 km2). These modelled trends are consistent with available monitoring well data (Figure 8).
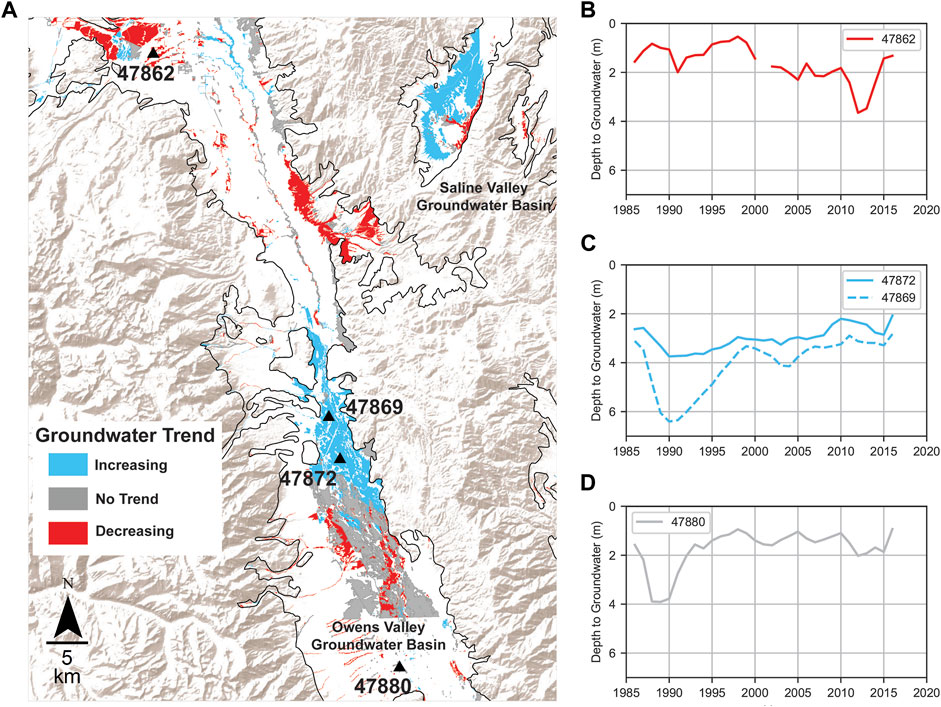
FIGURE 8. Owens Valley case study comparison of (A) long-term groundwater level trends (1985–2019), (B) shallow groundwater levels from monitoring wells nearby GDEs with long-term decreasing trends, (C) shallow groundwater levels from monitoring wells nearby GDEs with long-term increasing trends, and (D) shallow groundwater levels from monitoring wells nearby GDEs with no significant long-term trends.
The Owens Valley groundwater basin contains 11,275 GDEs which represents the second largest acreage of GDEs out of all California’s groundwater basins (Death Valley groundwater basin contains the largest acreage of GDEs statewide). While Owens Valley is also voluntarily subject to SGMA regulations, the high GDE acreage in Owens Valley is most likely due to the multiple decades of ongoing water management in the basin, and more specifically due to quantitative thresholds established for phreatophytes to inform pumping rules.
Mojave River Valley
The Mojave River Valley was selected as a case study (Figure 6D) because prior to being subject to SGMA regulations it was adjudicated under the California Supreme Court. The Mojave River is an intermittent river that flows northeast mostly underground from the eastern San Bernardino Mountains towards the Mojave Desert. The GDEs mapped along the Mojave River consist primarily of riparian phreatophytes such as cottonwood (Populus fremontii) and Tamarisk (Tamarix sp.).
Over the long-term period (1985–2019), modelled groundwater levels within GDEs in the Mojave River Valley basins have predominantly been in decline with 48% of GDEs (n = 444 GDE polygons; 136 km2) having experienced significant declines in groundwater (Supplementary Table S5). Groundwater declines have been more pronounced in the early period (52% of GDEs; 149 km2) compared to the late period (28% of GDEs; 81 km2). These modelled trends are consistent with available monitoring well data (Figure 9) and a recent study that found wastewater treatment discharge and recharge increased groundwater levels for some GDEs along the Mojave River (Rohde et al., 2021).
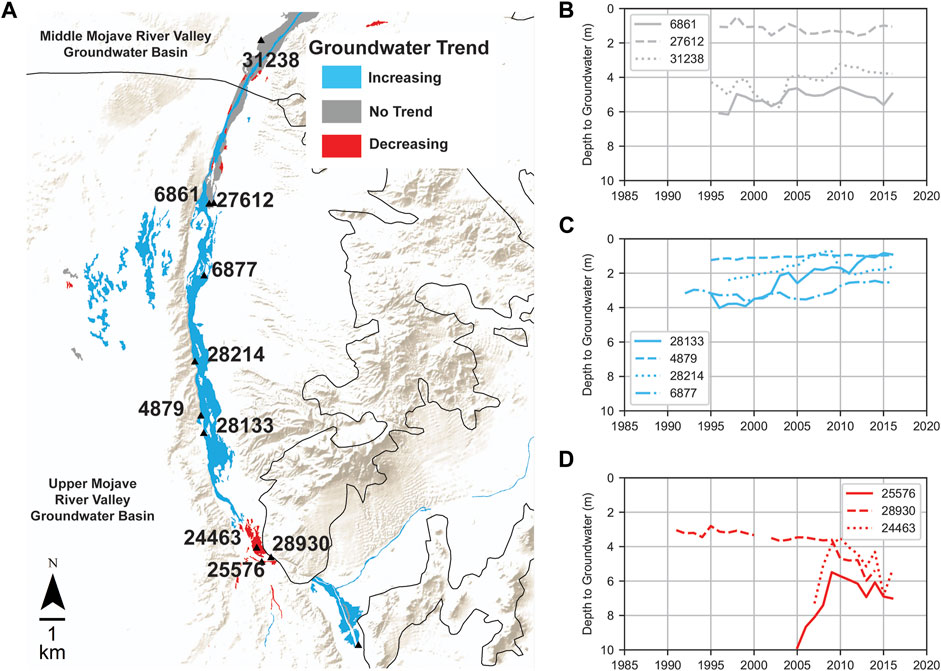
FIGURE 9. Mojave River Valley case study comparison of (A) long-term groundwater level trends (1985–2019), (B) shallow groundwater levels from monitoring wells nearby GDEs with no significant long-term trends, (C) shallow groundwater levels from monitoring wells nearby GDEs with long-term increasing trends, and (D) shallow groundwater levels from monitoring wells nearby GDEs with long-term decreasing trends.
GDEs experiencing increasing groundwater trends in the upper river reaches are adjacent to the Victor Valley Wastewater facility, which was founded in 1978 (VVWRA, 2021). Wastewater treatment discharge and recharge is likely creating more consistent year-round shallow groundwater conditions for the native cottonwood woodlands in the area (Rohde et al., 2021). Over the past several decades, groundwater trends have been increasing along the upper reaches of the river (in the south) and relatively stable or decreasing along the lower reaches of the river (in the north). Groundwater levels in the upper river reaches adjacent to the wastewater treatment facility are shallower than groundwater levels downstream in the lower reaches of the river where no significant trends in groundwater have been observed. Along these northern reaches where groundwater is deeper, invasive tamarisk is the dominant phreatophyte with roots that can reach as deep as 22 m below the ground surface (Gries et al., 2003). Tamarisk is an invasive shrub or small tree that favors conditions that are inhospitable to native phreatophytes, such as high salinity, low water availability, and altered streamflow regimes created by dams (Shafroth et al., 2000; Stromberg et al., 2007).
Discussion
Despite the importance of shallow groundwater for ecosystem health, surface water users, and drinking water wells (especially domestic rural wells), this crucial resource is often overlooked, poorly understood, and rarely monitored. We found that of the over 42,000 groundwater monitoring wells in California, only approximately 3,000 (7%) have consistent records of shallow groundwater levels near GDEs. By using GDEs as pseudo-monitoring wells and leveraging 35 years of freely available satellite and climate data, we have developed a novel approach to estimate the depth of shallow groundwater for all GDEs in California. Our dataset not only fills in chronic data gaps by providing a spatially explicit map of shallow groundwater levels for GDEs, but also enables us to reconstruct past groundwater conditions, which would not be possible with the installation of new wells. Our results provide not only an insight into broad temporal and spatial groundwater trends, but also a screening tool for monitoring groundwater levels within GDEs without nearby monitoring wells.
Statewide, our model estimates that more GDEs are experiencing decreases in shallow groundwater levels than are experiencing increases, and that this pattern has intensified in the past couple decades. GDEs are more likely to be stressed in groundwater basins with large decreasing trends. These declining trends are more significant in some hydrologic regions and in some groundwater basins, but in most areas, there is a mix of both increasing and decreasing trends within GDEs. These differences are likely due to a combination of climatological drivers and the existing patchwork of water management regimes across California, as illustrated in the case studies. For more than a century, groundwater has largely been unregulated in California, despite its significance in meeting California’s water needs. In the past, groundwater water management has been voluntarily practiced in a small subset of basins under AB3030, local ordinances, management by Special Act Districts, or mandated under court decree in adjudicated areas because of water rights disputes. However, in 2014, California took a major step towards achieving sustainable groundwater by passing the Sustainable Groundwater Management Act (SGMA), which requires a subset of basins to develop groundwater sustainability agencies and groundwater sustainability plans to achieve sustainability within a 20-years planning horizon. While only 18% of the 515 groundwater basins fall under these SGMA regulations (Figure 10A), these 94 basins account for most of the groundwater pumping, population, and irrigated acres across the state’s groundwater basins [California Department of Water Resources (CDWR), 2021] and are assumed to be the basins most susceptible to chronic groundwater level declines and other undesirable results (e.g., land subsidence, seawater intrusion, surface water depletions).
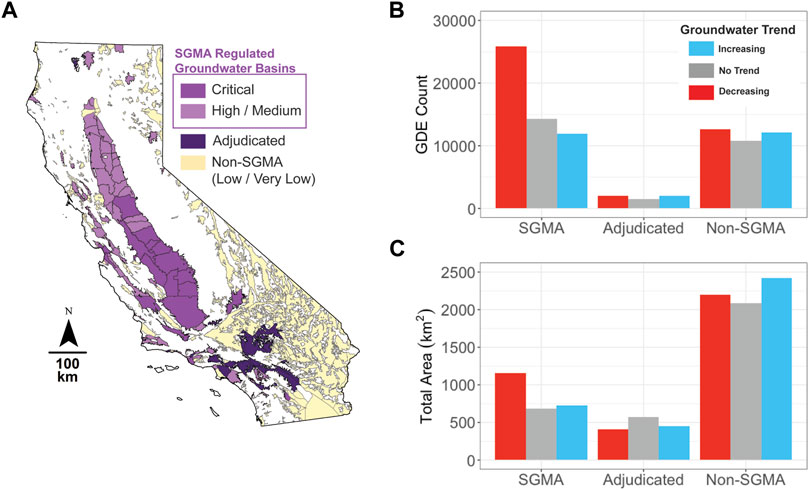
FIGURE 10. Long term (1985–2019) modeled groundwater level trends for GDEs within SGMA regulated basins, adjudicated basins, and non-SGMA basins (A) by GDE count (B) and total GDE area (C).
Our results show that within SGMA basins, half of the GDEs (n = 25,895 GDE polygons) exhibited significant long-term declining groundwater levels, compared to 36% of GDEs in non-SGMA (n = 12,665 GDE polygons) and Adjudicated (n = 1,986 GDE polygons) basins (Figure 10B). While the number of GDEs with declining groundwater trends is nearly twice as much in SGMA versus non-SGMA basins, the total acreage of GDEs exhibiting declining groundwater trends in non-SGMA basins is double (2,196 km2) that of GDEs with declining trends within SGMA basins (1,156 km2). One explanation for this juxtaposition is that GDEs are more fragmented and on average smaller in area within SGMA basins (0.05 km2 per GDE) than in the non-SGMA basins (0.16 km2 per GDE). Higher GDE fragmentation within the SGMA basins are due to more than a century of native habitat conversion to agriculture and urban land uses, streamflow alteration, and groundwater depletion (Moyle and Williams, 1990; Seavy et al., 2009).
Under SGMA, local agencies are required to bring groundwater basins into balance and prevent adverse impacts to GDEs (State of California, 2014; State of California, 2016). SGMA specifically requires that groundwater sustainability agencies identify and consider GDEs in their groundwater sustainability plans. To do this effectively, agencies need to understand groundwater conditions under GDEs (Rohde et al., 2017, 2018). However, many agencies lack sufficient shallow monitoring well data in and around GDEs to properly map and consider groundwater impacts to GDEs. To fill this critical data gap, we created a web-based application to share the groundwater trends from our model. This freely available tool is called “SAGE (Shallow Groundwater Estimation Tool)” and provides a user-friendly interface to visualize and download groundwater level trend data (https://igde-work.earthengine.app/view/sage). The intention of this tool is to help flag areas with consistent declines and inform sustainable groundwater management across the state. In the absence of monitoring well data, groundwater managers can use the GDE level trend data from SAGE to identify hotspots of shallow groundwater decline near important GDEs, evaluate whether groundwater conditions are impacting ecosystems, and prioritize new well installation locations. If the declines are confirmed and the ecosystems are in decline (e.g., crown dieback, recruitment failure, mortality, invasive species abundant), steps should be taken to 1) reduce groundwater pumping that affects the shallow aquifer, and/or 2) increase recharge to the shallow aquifer.
The most concerning trends from our analysis are the widespread declining groundwater trends in areas not regulated by SGMA. These results show that despite lower populations and lower pumping rates, shallow groundwater levels are declining nearly twice as much as in SGMA regulated areas. The vast majority of these non-SGMA areas are in Southeastern California’s desert basins, where precipitation is low and surface water bodies are primarily groundwater-fed springs that are disconnected from the large order streams draining snowmelt from the Sierras. Without groundwater management regulations in place, GDEs and the critical status species that reside within these basins, which are often entirely dependent upon groundwater and endemic to the region, remain vulnerable to ongoing groundwater level declines resulting from unfettered pumping (Rohde et al., 2019; Thompson et al., 2021). Given these trends, sustainable management guidelines should be considered statewide to conserve these critical ecosystems. In the absence of groundwater monitoring well data, our results can be used to help state and local water agencies fill in data gaps of shallow groundwater conditions, evaluate potential effects on GDEs, and improve sustainable groundwater management policy in California.
Data Availability Statement
All data used in this study are publicly available, and cited within the article. The model and analysis code are available on GitHub (https://github.com/tnc-ca-geo/SAGE). Modeled outputs of groundwater trend data are available in the Supplementary Material.
Author Contributions
MR, TB, IH, KK, and JH designed the research; IH, TB, and LC developed the model and performed research; MR, TB, IH, LC, KK, and JH analyzed the data; and MR, TB, IH, LC, KK, and JH wrote the paper.
Conflict of Interest
LC is a partner of Contour Group, LLC and IH is an independent contractor.
The remaining authors declare that the research was conducted in the absence of any commercial or financial relationships that could be construed as a potential conflict of interest.
Publisher’s Note
All claims expressed in this article are solely those of the authors and do not necessarily represent those of their affiliated organizations, or those of the publisher, the editors and the reviewers. Any product that may be evaluated in this article, or claim that may be made by its manufacturer, is not guaranteed or endorsed by the publisher.
Acknowledgments
The authors would like to thank Todd Keeler-Wolf from the California Department of Fish and Wildlife for associating macrogroups to the GDE vegetation data. The authors at The Nature Conservancy would also like to thank the S. D. Bechtel, Jr. Foundation and the Water Foundation for their philanthropic financial support to The Nature Conservancy’s ongoing research on sustainable groundwater management.
Supplementary Material
The Supplementary Material for this article can be found online at: https://www.frontiersin.org/articles/10.3389/feart.2021.784499/full#supplementary-material
References
Adamowski, J., and Chan, H. F. (2011). A Wavelet Neural Network Conjunction Model for Groundwater Level Forecasting. J. Hydrol. 407, 28–40. doi:10.1016/j.jhydrol.2011.06.013
Albert, J. S., Destouni, G., Duke-Sylvester, S. M., Magurran, A. E., Oberdorff, T., Reis, R. E., et al. (2020). Scientists' Warning to Humanity on the Freshwater Biodiversity Crisis. Ambio 50, 85–94. doi:10.1007/s13280-020-01318-8
Badgley, G., Field, C. B., and Berry, J. A. (2017). Canopy Near-Infrared Reflectance and Terrestrial Photosynthesis. Sci. Adv. 3, e1602244. doi:10.1126/sciadv.1602244
Banerjee, P., Prasad, R. K., and Singh, V. S. (2009). Forecasting of Groundwater Level in Hard Rock Region Using Artificial Neural Network. Environ. Geol. 58, 1239–1246. doi:10.1007/s00254-008-1619-z
Barron, O. V., Emelyanova, I., Van Niel, T. G., Pollock, D., and Hodgson, G. (2014). Mapping Groundwater-dependent Ecosystems Using Remote Sensing Measures of Vegetation and Moisture Dynamics. Hydrol. Process. 28, 372–385. doi:10.1002/hyp.9609
Belgiu, M., and Drăguţ, L. (2016). Random forest in Remote Sensing: A Review of Applications and Future Directions. ISPRS J. Photogrammetry Remote Sensing 114, 24–31. doi:10.1016/j.isprsjprs.2016.01.011
California Department of Fish and Wildlife (CDFW) (2021). Natural Communities. Available at: https://wildlife.ca.gov/Data/VegCAMP/Natural-Communities (Accessed September 27, 2021).
California Department of Water Resources (CDWR) (2021). Basin Prioritization. Available at: https://water.ca.gov/Programs/Groundwater-Management/Basin-Prioritization (Accessed September 27, 2021).
California Department of Water Resources (CDWR) (2020b). California’s Groundwater (Bulletin 118). Available at: https://water.ca.gov/Programs/Groundwater-Management/Bulletin-118 (Accessed December 18, 2020).
California Department of Water Resources (CDWR) (2018). Natural Communities Commonly Associated with Groundwater (NCCAG) Dataset. Available at: https://gis.water.ca.gov/app/NCDatasetViewer/ (Accessed May 15, 2020).
California Department of Water Resources (CDWR) (2020a). SGMA Data Viewer. Available at: https://sgma.water.ca.gov/webgis/?appid=SGMADataViewer#gwlevels (Accessed December 19, 2020).
Canadell, J., Jackson, R. B., Ehleringer, J. B., Mooney, H. A., Sala, O. E., and Schulze, E.-D. (1996). Maximum Rooting Depth of Vegetation Types at the Global Scale. Oecologia 108, 583–595. doi:10.1007/bf00329030
Chastain, R., Housman, I., Goldstein, J., Finco, M., and Tenneson, K. (2019). Empirical Cross Sensor Comparison of Sentinel-2A and 2B MSI, Landsat-8 OLI, and Landsat-7 ETM+ Top of Atmosphere Spectral Characteristics over the Conterminous United States. Remote Sensing Environ. 221, 274–285. doi:10.1016/j.rse.2018.11.012
CNRA (2021). Hydrologic Regions. Hydrologic Regions. Available at: https://data.cnra.ca.gov/dataset/hydrologic-regions (Accessed December 19, 2020).
Cohen, W. B., Yang, Z., Healey, S. P., Kennedy, R. E., and Gorelick, N. (2018). A LandTrendr Multispectral Ensemble for forest Disturbance Detection. Remote Sensing Environ. 205, 131–140. doi:10.1016/j.rse.2017.11.015
County, I., and Angeles, C. (1991). Agreement between the County of Inyo and the City of Los Angeles and its Department of Water and Power on a Long-Term Groundwater Management Plan for Owens Valley and Inyo County. Available at: https://www.inyowater.org/wp-content/uploads/legacy/Water_Resources/long_term_water_agreement.pdf.
Crist, E. P. (1985). A TM Tasseled Cap Equivalent Transformation for Reflectance Factor Data. Remote Sensing Environ. 17, 301–306. doi:10.1016/0034-4257(85)90102-6
Daliakopoulos, I. N., Coulibaly, P., and Tsanis, I. K. (2005). Groundwater Level Forecasting Using Artificial Neural Networks. J. Hydrol. 309, 229–240. doi:10.1016/j.jhydrol.2004.12.001
Díaz-Alcaide, S., and Martínez-Santos, P. (2019). Review: Advances in Groundwater Potential Mapping. Hydrogeol J. 27, 2307–2324. doi:10.1007/s10040-019-02001-3
Dudgeon, D., Arthington, A. H., Gessner, M. O., Kawabata, Z.-I., Knowler, D. J., Lévêque, C., et al. (2006). Freshwater Biodiversity: Importance, Threats, Status and Conservation Challenges. Biol. Rev. 81, 163–182. doi:10.1017/s1464793105006950
Eamus, D., Zolfaghar, S., Villalobos-Vega, R., Cleverly, J., and Huete, A. (2015). Groundwater-dependent Ecosystems: Recent Insights from Satellite and Field-Based Studies. Hydrol. Earth Syst. Sci. 19, 4229–4256. doi:10.5194/hess-19-4229-2015
Erickson, M. L., Elliott, S. M., Christenson, C. A., and Krall, A. L. (2018). Predicting Geogenic Arsenic in Drinking Water Wells in Glacial Aquifers, North‐Central USA: Accounting for Depth‐Dependent Features. Water Resour. Res. 54, 10,172–10,187. doi:10.1029/2018wr023106
Fasbender, D., Peeters, L., Bogaert, P., and Dassargues, A. (2008). Bayesian Data Fusion Applied to Water Table Spatial Mapping. Water Resour. Res. 44, W12422. doi:10.1029/2008wr006921
Fienen, M. N., Masterson, J. P., Plant, N. G., Gutierrez, B. T., and Thieler, E. R. (2013). Bridging Groundwater Models and Decision Support with a Bayesian Network. Water Resour. Res. 49, 6459–6473. doi:10.1002/wrcr.20496
Gholami, V., Chau, K. W., Fadaee, F., Torkaman, J., and Ghaffari, A. (2015). Modeling of Groundwater Level Fluctuations Using Dendrochronology in Alluvial Aquifers. J. Hydrol. 529, 1060–1069. doi:10.1016/j.jhydrol.2015.09.028
Gorelick, N., Hancher, M., Dixon, M., Ilyushchenko, S., Thau, D., and Moore, R. (2017). Google Earth Engine: Planetary-Scale Geospatial Analysis for Everyone. Remote Sensing Environ. 202, 18–27. doi:10.1016/j.rse.2017.06.031
Gries, D., Zeng, F., Foetzki, A., Arndt, S. K., Bruelheide, H., Thomas, F. M., et al. (2003). Growth and Water Relations of Tamarix Ramosissima and Populus Euphratica on Taklamakan Desert Dunes in Relation to Depth to a Permanent Water Table. Plant Cell Environ 26, 725–736. doi:10.1046/j.1365-3040.2003.01009.x
Huete, A. R. (1988). A Soil-Adjusted Vegetation index (SAVI). Remote Sensing Environ. 25, 295–309. doi:10.1016/0034-4257(88)90106-x
Huntington, J., McGwire, K., Morton, C., Snyder, K., Peterson, S., Erickson, T., et al. (2016). Assessing the Role of Climate and Resource Management on Groundwater Dependent Ecosystem Changes in Arid Environments with the Landsat Archive. Remote Sensing Environ. 185, 186–197. doi:10.1016/j.rse.2016.07.004
Hussain, M., and Mahmud, I. (2019). pyMannKendall: a python Package for Non Parametric Mann Kendall Family of Trend Tests. Joss 4, 1556. doi:10.21105/joss.01556
Hussein, E. A., Thron, C., Ghaziasgar, M., Bagula, A., and Vaccari, M. (2020). Groundwater Prediction Using Machine-Learning Tools. Algorithms 13, 300. doi:10.3390/a13110300
Kennedy, R. E., Yang, Z., and Cohen, W. B. (2010). Detecting Trends in forest Disturbance and Recovery Using Yearly Landsat Time Series: 1. LandTrendr - Temporal Segmentation Algorithms. Remote Sensing Environ. 114, 2897–2910. doi:10.1016/j.rse.2010.07.008
Kennedy, R., Yang, Z., Gorelick, N., Braaten, J., Cavalcante, L., Cohen, W., et al. (2018). Implementation of the LandTrendr Algorithm on Google Earth Engine. Remote Sensing 10, 691. doi:10.3390/rs10050691
Kibler, C. L., Schmidt, E. C., Roberts, D. A., Stella, J. C., Kui, L., Lambert, A. M., et al. (2021). A Brown Wave of Riparian woodland Mortality Following Groundwater Declines during the 2012-2019 California Drought. Environ. Res. Lett. 16, 084030. doi:10.1088/1748-9326/ac1377
Klausmeyer, K., Howard, J., Keeler-Wolf, T., Davis-Fadtke, K., Hull, R., and Lyons, A. (2018). Mapping Indicators of Groundwater Dependent Ecosystems in California: Methods Report. San Francisco: California. Available at: https://groundwaterresourcehub.org/public/uploads/pdfs/iGDE_data_paper_20180423.pdf.
Koch, J., Berger, H., Henriksen, H. J., and Sonnenborg, T. O. (2019a). Modelling of the Shallow Water Table at High Spatial Resolution Using Random Forests. Hydrol. Earth Syst. Sci. 23, 4603–4619. doi:10.5194/hess-23-4603-2019
Koch, J., Stisen, S., Refsgaard, J. C., Ernstsen, V., Jakobsen, P. R., and Højberg, A. L. (2019b). Modeling Depth of the Redox Interface at High Resolution at National Scale Using Random Forest and Residual Gaussian Simulation. Water Resour. Res. 55, 1451–1469. doi:10.1029/2018wr023939
Lozano, F. J., Suárez-Seoane, S., and de Luis, E. (2007). Assessment of Several Spectral Indices Derived from Multi-Temporal Landsat Data for Fire Occurrence Probability Modelling. Remote Sensing Environ. 107, 533–544. doi:10.1016/j.rse.2006.10.001
Maxwell, A. E., Warner, T. A., and Fang, F. (2018). Implementation of Machine-Learning Classification in Remote Sensing: an Applied Review. Int. J. Remote Sensing 39, 2784–2817. doi:10.1080/01431161.2018.1433343
Meinzer, O. E. (1927). Plants as Indicators of Ground Water. J. Geology. 37, 728. doi:10.1086/623671
Menne, M. J., Durre, I., Korzeniewski, B., McNeal, S., Thomas, K., Yin, X., et al. (2012). Global Historical Climatology Network - Daily (GHCN-Daily), Version 3. Available at: https://www.ncei.noaa.gov/access/metadata/landing-page/bin/iso?id=gov.noaa.ncdc%3AC00861 (Accessed September 24, 2021).
Moyle, P. B., and Williams, J. E. (1990). Biodiversity Loss in the Temperate Zone: Decline of the Native Fish Fauna of California. Conservation Biol. 4, 275–284. doi:10.1111/j.1523-1739.1990.tb00289.x
Nagler, P., Glenn, E. P., Thompson, T. L., and Huete, A. (2004). Leaf Area index and Normalized Difference Vegetation index as Predictors of Canopy Characteristics and Light Interception by Riparian Species on the Lower Colorado River. Agric. For. Meteorology 125, 1–17. doi:10.1016/j.agrformet.2004.03.008
Nolan, B. T., Fienen, M. N., and Lorenz, D. L. (2015). A Statistical Learning Framework for Groundwater Nitrate Models of the Central Valley, California, USA. J. Hydrol. 531, 902–911. doi:10.1016/j.jhydrol.2015.10.025
Pérez Hoyos, I., Krakauer, N., Khanbilvardi, R., and Armstrong, R. (2016). A Review of Advances in the Identification and Characterization of Groundwater Dependent Ecosystems Using Geospatial Technologies. Geosciences 6, 17. doi:10.3390/geosciences6020017
Rajaee, T., Ebrahimi, H., and Nourani, V. (2019). A Review of the Artificial Intelligence Methods in Groundwater Level Modeling. J. Hydrol. 572, 336–351. doi:10.1016/j.jhydrol.2018.12.037
Rateb, A., Scanlon, B. R., Pool, D. R., Sun, A., Zhang, Z., Chen, J., et al. (2020). Comparison of Groundwater Storage Changes from GRACE Satellites with Monitoring and Modeling of Major U.S. Aquifers. Water Resour. Res. 56. doi:10.1029/2020wr027556
Rodell, M., and Famiglietti, J. S. (2002). The Potential for Satellite-Based Monitoring of Groundwater Storage Changes Using GRACE: the High Plains Aquifer, Central US. J. Hydrol. 263, 245–256. doi:10.1016/s0022-1694(02)00060-4
Rodell, M., Velicogna, I., and Famiglietti, J. S. (2009). Satellite-based Estimates of Groundwater Depletion in India. Nature 460, 999–1002. doi:10.1038/nature08238
Rohde, M. M., Froend, R., and Howard, J. (2017). A Global Synthesis of Managing Groundwater Dependent Ecosystems under Sustainable Groundwater Policy. Groundwater 55, 293–301. doi:10.1111/gwat.12511
Rohde, M. M., Matsumoto, S., Howard, J., Liu, S., Riege, L., and Remson, E. J. (2018). “Groundwater Dependent Ecosystems under the Sustainable Groundwater Management Act: Guidance for Preparing Groundwater Sustainability Plans,” in The Nature Conservancy (San Francisco: California). Available at: https://groundwaterresourcehub.org/sgma-tools/gsp-guidance-document/.
Rohde, M. M., Seapy, B., Rogers, R., and Castañeda, X. (2019). “Critical Species LookBook: A Compendium of California’s Threatened and Endangered Species for Sustainable Groundwater Management,” in The Nature Conservancy (San Francisco: California). Available at: https://groundwaterresourcehub.org/public/uploads/pdfs/Critical_Species_LookBook_91819.pdf.
Rohde, M. M., Stella, J. C., Roberts, D. A., and Singer, M. B. (2021). Groundwater Dependence of Riparian Woodlands and the Disrupting Effect of Anthropogenically Altered Streamflow. Proc. Natl. Acad. Sci. USA 118, e2026453118. doi:10.1073/pnas.2026453118
Rouse, J. W., Haas, R. H., Schell, J. A., and Deering, D. W. (1973). “Monitoring Vegetation Systems in the Great plains with ERTS”. in Third ERTS Symposium NASA SP-351 (Washington, D.C: NASA), 309–317.
Roy, D. P., Kovalskyy, V., Zhang, H. K., Vermote, E. F., Yan, L., Kumar, S. S., et al. (2016). Characterization of Landsat-7 to Landsat-8 Reflective Wavelength and Normalized Difference Vegetation index Continuity. Remote Sensing Environ. 185, 57–70. doi:10.1016/j.rse.2015.12.024
Sayler, K. (2020b). “Land Surface Reflection Code (LaSRC) Product Guide, Version 3,” in Landsat 8 Collection (Sioux Falls: South Dakota), 1. C1. Available at: https://prd-wret.s3.us-west-2.amazonaws.com/assets/palladium/production/atoms/files/LSDS-1368_L8_C1-LandSurfaceReflectanceCode-LASRC_ProductGuide-v3.pdf.
Sayler, K. (2020a). “Surface Reflectance (LEDAPS) Product Guide, Version 3,” in Landsat 4-7 Collection (Sioux Falls: South Dakota), 1. C1. Available at: https://prd-wret.s3.us-west-2.amazonaws.com/assets/palladium/production/atoms/files/LSDS-1370_L4-7_C1-SurfaceReflectance-LEDAPS_ProductGuide-v3.pdf.
Scanlon, B. R., Faunt, C. C., Longuevergne, L., Reedy, R. C., Alley, W. M., McGuire, V. L., et al. (2012). Groundwater Depletion and Sustainability of Irrigation in the US High Plains and Central Valley. Proc. Natl. Acad. Sci. 109, 9320–9325. doi:10.1073/pnas.1200311109
Scanlon, B. R., Longuevergne, L., and Long, D. (2012). Ground Referencing GRACE Satellite Estimates of Groundwater Storage Changes in the California Central Valley, USA. Water Resour. Res. 48, 587. doi:10.1029/2011wr011312
Scanlon, B. R., Rateb, A., Pool, D. R., Sanford, W., Save, H., Sun, A., et al. (2021). Effects of Climate and Irrigation on GRACE-based Estimates of Water Storage Changes in Major US Aquifers. Environ. Res. Lett. 16, 094009. doi:10.1088/1748-9326/ac16ff
Seabold, S., and Perktold, J. (2010). Statsmodels: Econometric and Statistical Modeling with Python. Proc. 9th Python Sci. Conf., 92–96. doi:10.25080/majora-92bf1922-011
Seavy, N. E., Gardali, T., Golet, G. H., Griggs, F. T., Howell, C. A., Kelsey, R., et al. (2009). Why Climate Change Makes Riparian Restoration More Important Than Ever: Recommendations for Practice and Research. Ecol. Restoration 27, 330–338. doi:10.3368/er.27.3.330
Shafroth, P. B., Stromberg, J. C., and Patten, D. T. (2000). Woody Riparian Vegetation Response to Different Alluvial Water Table Regimes. West. North Am. Naturalist 60 (1), 66–76.
Shen, C., Laloy, E., Elshorbagy, A., Albert, A., Bales, J., Chang, F.-J., et al. (2018). HESS Opinions: Incubating Deep-Learning-Powered Hydrologic Science Advances as a Community. Hydrol. Earth Syst. Sci. 22, 5639–5656. doi:10.5194/hess-22-5639-2018
Shiri, J., Kisi, O., Yoon, H., Lee, K.-K., and Hossein Nazemi, A. (2013). Predicting Groundwater Level Fluctuations with Meteorological Effect Implications-A Comparative Study Among Soft Computing Techniques. Comput. Geosciences 56, 32–44. doi:10.1016/j.cageo.2013.01.007
Strassberg, G., Scanlon, B. R., and Chambers, D. (2009). Evaluation of Groundwater Storage Monitoring with the GRACE Satellite: Case Study of the High Plains Aquifer, central United States. Water Resour. Res. 45, 337. doi:10.1029/2008wr006892
Stromberg, J. C., Lite, S. J., Marler, R., Paradzick, C., Shafroth, P. B., Shorrock, D., et al. (2007). Altered Stream-Flow Regimes and Invasive Plant Species: the Tamarix Case. Glob. Ecol Biogeogr. 16, 381–393. doi:10.1111/j.1466-8238.2007.00297.x
Thessen, A. (2016). Adoption of Machine Learning Techniques in Ecology and Earth Science. Oe 1, e8621. doi:10.3897/oneeco.1.e8621
Thompson, B. H., Rohde, M. M., Howard, J. K., and Matsumoto, S. (2021). “Mind the Gaps: The Case for Truly Comprehensive Sustainable Groundwater Management,” in Water in the West (Stanford, California, United States: Stanford University). Available at: https://stacks.stanford.edu/file/druid:hs475mt1364/Mind%20the%20Gaps%2C%20The%20Case%20for%20Truly%20Comprehensive%20Sustainable%20Groundwater%20Management.pdf.
Thornton, P. E., Thornton, M. M., Mayer, B. W., Wei, Y., Devarakonda, R., Vose, R. S., et al. (2016). Daymet: Daily Surface Weather Data on a 1-km Grid for North America, Version 3. Oak Ridge, Tennessee, USA: ORNL DAAC. doi:10.3334/ORNLDAAC/1328
TNC (2009). Terrestrial Ecoregions, Major Habitat Types, Biogeographical Realms and the Nature Conservancy Terrestrial Assessment Units. Arlington: VA. Available at: https://geospatial.tnc.org/datasets/b1636d640ede4d6ca8f5e369f2dc368b/about.
USGS (2021a). Landsat Mission. Available at: https://www.usgs.gov/core-science-systems/nli/landsat (Accessed September 27, 2021).
USGS (2021b). The National Map. Available at: https://apps.nationalmap.gov/downloader/#/ (Accessed September 27, 2021).
Verbesselt, J., Hyndman, R., Newnham, G., and Culvenor, D. (2010). Detecting Trend and Seasonal Changes in Satellite Image Time Series. Remote Sensing Environ. 114, 106–115. doi:10.1016/j.rse.2009.08.014
VVWRA (2021). Victor Valley Wastewater Reclamation Authority. Available at: https://www.vvwra.com/about_us/welcome/default.htm (Accessed September 24, 2021).
Wilson, E. H., and Sader, S. A. (2002). Detection of forest Harvest Type Using Multiple Dates of Landsat TM Imagery. Remote Sensing Environ. 80, 385–396. doi:10.1016/s0034-4257(01)00318-2
Winkel, L. H. E., Trang, P. T. K., Lan, V. M., Stengel, C., Amini, M., Ha, N. T., et al. (2011). Arsenic Pollution of Groundwater in Vietnam Exacerbated by Deep Aquifer Exploitation for More Than a century. Proc. Natl. Acad. Sci. 108, 1246–1251. doi:10.1073/pnas.1011915108
Yoon, H., Jun, S.-C., Hyun, Y., Bae, G.-O., and Lee, K.-K. (2011). A Comparative Study of Artificial Neural Networks and Support Vector Machines for Predicting Groundwater Levels in a Coastal Aquifer. J. Hydrol. 396, 128–138. doi:10.1016/j.jhydrol.2010.11.002
Zhu, Z., Wang, S., and Woodcock, C. E. (2015). Improvement and Expansion of the Fmask Algorithm: Cloud, Cloud Shadow, and Snow Detection for Landsats 4-7, 8, and Sentinel 2 Images. Remote Sensing Environ. 159, 269–277. doi:10.1016/j.rse.2014.12.014
Zhu, Z., and Woodcock, C. E. (2014a). Automated Cloud, Cloud Shadow, and Snow Detection in Multitemporal Landsat Data: An Algorithm Designed Specifically for Monitoring Land Cover Change. Remote Sensing Environ. 152, 217–234. doi:10.1016/j.rse.2014.06.012
Zhu, Z., and Woodcock, C. E. (2014b). Continuous Change Detection and Classification of Land Cover Using All Available Landsat Data. Remote Sensing Environ. 144, 152–171. doi:10.1016/j.rse.2014.01.011
Keywords: depth to groundwater, groundwater dependent ecosystems, groundwater depletion, google earth engine, California, random forest, Landsat, Sustainable Groundwater Management Act (SGMA)
Citation: Rohde MM, Biswas T, Housman IW, Campbell LS, Klausmeyer KR and Howard JK (2021) A Machine Learning Approach to Predict Groundwater Levels in California Reveals Ecosystems at Risk. Front. Earth Sci. 9:784499. doi: 10.3389/feart.2021.784499
Received: 28 September 2021; Accepted: 19 November 2021;
Published: 17 December 2021.
Edited by:
Eric Rosa, Université du Québec en Abitibi Témiscamingue, CanadaReviewed by:
Brian Smerdon, University of Alberta, CanadaNathaniel K. Newlands, Agriculture and Agri-Food Canada (AAFC), Canada
Copyright © 2021 Rohde, Biswas, Housman, Campbell, Klausmeyer and Howard. This is an open-access article distributed under the terms of the Creative Commons Attribution License (CC BY). The use, distribution or reproduction in other forums is permitted, provided the original author(s) and the copyright owner(s) are credited and that the original publication in this journal is cited, in accordance with accepted academic practice. No use, distribution or reproduction is permitted which does not comply with these terms.
*Correspondence: Melissa M. Rohde, bWVsaXNzYS5yb2hkZUB0bmMub3Jn
 Melissa M. Rohde
 Tanushree Biswas
 Ian W. Housman
 Leah S. Campbell
 Kirk R. Klausmeyer1
 Jeanette K. Howard
