 Dandong Cheng
 Guizeng Qi
 Jinxi Song
 Yixuan Zhang1,2
- 1Shaanxi Key Laboratory of Earth Surface System and Environmental Carrying Capacity, College of Urban and Environmental Sciences, Northwest University, Xi’an, China
- 2Institute of Qinling Mountains, Northwest University, Xi’an, China
Quantitative assessment of the contributions of climate change and human activities to vegetation change is important for ecosystem planning and management. To reveal spatial differences in the driving mechanisms of vegetation change in the Qinling Mountains, the changing patterns of the normalized difference vegetation index (NDVI) in the Qinling Mountains during 2000–2019 were investigated through trend analysis and multiple regression residuals analysis. The relative contributions of climate change and human activities on vegetation NDVI change were also quantified. The NDVI shows a significant increasing trend (0.23/10a) from 2000 to 2019 in the Qinling Mountains. The percentage of areas with increasing and decreasing trends in NDVI is 87.96% and 12.04% of the study area, respectively. The vegetation change in the Qinling Mountains is caused by a combination of climate change and human activities. The Tongguan Shiquan line is a clear dividing line in the spatial distribution of drivers of vegetation change. Regarding the vegetation improvement, the contribution of climate change and human activities to NDVI increase is 51.75% and 48.25%, respectively. In the degraded vegetation area, the contributions of climate change and human activities to the decrease in NDVI were 22.11% and 77.89%, respectively. Thus, vegetation degradation is mainly caused by human activities. The implementation of policies, such as returning farmland to forest and grass, has an important role in vegetation protection. It is suggested that further attention should be paid to the role of human activities in vegetation degradation when formulating corresponding vegetation protection measures and policies.
1 Introduction
The continuous intensification of global climate change and human activities has been impacting the stability of the global terrestrial ecosystem (Duan et al., 2020). As the main component of the terrestrial ecosystem, vegetation plays an irreplaceable role in the mutual adjustment of atmosphere–soil–water, global carbon balance adjustment, and the maintenance of global climate stability (Cheng et al., 2017; Zhang et al., 2021). Vegetation is one of the most sensitive indicators in response to global change (Landuyt et al., 2019), and exploring vegetation change trends and driving mechanisms has become a focus of global change research, which is of great significance to assess the carbon sequestration capacity of vegetation and the evolution mechanism of terrestrial ecosystems.
Previous studies have pointed out that climate change is one of the main driving forces of vegetation variation (Piao et al., 2015; Ge et al., 2021). With temperature closely associated with the beginning and end of vegetation photosynthesis (Braswell et al., 1997), the continuous increase in temperature prolongs the vegetation growing periods (Ji et al., 2020), which in return promotes vegetation growth, especially in high-latitude areas and mountain areas (Nemani et al., 2003; Xu et al., 2017; Myers-Smith et al., 2020). However, the temperature increase aggravates the occurrence of drought, inhibiting vegetation growth in middle-to-low latitude regions, and arid and semi-arid regions (Ichii et al., 2002; Zeng et al., 2020; Huang et al., 2021). Precipitation is another important factor affecting vegetation variation (Piao et al., 2015; Shi et al., 2021). In arid and semi-arid regions, insufficient precipitation is the main factor that restricts vegetation growth (Vicente-Serrano et al., 2013). However, in humid areas, the increase in precipitation lowers the temperature and radiation, thereby, inhibiting vegetation growth (Nemani et al., 2003). Besides climate change, the impact of human activities on vegetation growth cannot be ignored. Human activities, such as urban expansion, agricultural production, and returning farmland to forests and grasses, are important factors affecting the spatial pattern of vegetation and its growth (Yan et al., 2019; Huang et al., 2020; Qin et al., 2021; Shi et al., 2021). Meanwhile, since the industrial revolution, the rapid increase in CO2 and other greenhouse gas emissions caused by human activities has promoted the photosynthesis of vegetation (Leakey et al., 2009), resulting in the fertilization effect of CO2, promoting the growth of global vegetation (Zhu et al., 2016). Both climate change and human activities impact vegetation variation, which may intensify the spatial difference of vegetation change. Therefore, quantifying the impact of driving factors on vegetation change is essential to ecosystem management and vegetation response to global changes.
In the past, the study of spatial vegetation changes often involves remote sensing data (Duan et al., 2021). Among them, the Normalized Difference Vegetation Index (NDVI), a commonly used vegetation index, is closely related to vegetation primary productivity and leaf area index and is also a good indicator of vegetation cover and growth status (Ichii et al., 2002; Mao et al., 2012; Kai et al., 2020; Shi et al., 2021). The quantitative assessment method of the impact of climate change and human activities on vegetation variation mainly involves mathematical statistical methods, including correlation analysis, principal component analysis, and least-squares method (Wold et al., 1987; Qin et al., 2021). However, uncertainties exist in the processes and factors of the impact on vegetation change (Cai et al., 2016). A single-scale analysis of influencing factors may obscure the actual impact of driving factors, whereas the multiple regression residuals analysis method is able to overcome the drawbacks of the single-scale analysis, with a good application in the quantitative evaluation of multiple driving factors (Ovakoglou et al., 2018; Song et al., 2018; Kai et al., 2020; Qin et al., 2021).
The Qinling Mountains, located at the boundary between the temperate monsoon climate and the subtropical monsoon climate, is an important north–south geographic boundary in China, which has particular significance for the local natural geographic environment due to the obvious differences in climate and vegetation zones between the north and south of the Qinling Mountains (Qi et al., 2021). Previous studies revealed qualitatively the vegetation cover changes in the Qinling Mountains due to climate change and human activities (Wang and Bai, 2017; Deng et al., 2018b; Liu et al., 2018; Li et al., 2019; Kai et al., 2020; Qin et al., 2021). However, spatial differences in the effects of climate change and human activities in the Qinling Mountains have not been clearly revealed, so it is necessary to analyze the drivers of vegetation change in the Qinling Mountains in detail in the spatial differences analysis, which is essential for understanding the spatial variability of vegetation ecosystem change and its response mechanism research (Deng et al., 2018b).
Based on MODIS NDVI remote sensing data from 2000 to 2019 in the Qinling Mountains and data from 32 meteorological stations, this paper employs trend analysis and multiple regression residual analysis to evaluate the driving mechanism of vegetation changes in the Qinling Mountains and quantitatively evaluate the driving factors. The study provides a scientific basis for the construction of ecological civilization in the Qinling Mountains and the response of the ecosystem to climate fluctuations.
2 Materials and Methods
2.1 Study area
The Qinling Mountains is a huge east–west mountain range in central China, between 32°40′N∼34°35′N and 105°30′E∼111°3′E, with an elevation of 195–3,767.2°m and a total area of 61,900 km2 (Qi et al., 2021). There are significant climatic differences between the northern and southern slopes of the Qinling Mountains (NSQM and SSQM) (Qi et al., 2021), the NSQM under a warm temperate semihumid climate, while the SSQM a humid northern subtropical climate. The Qinling Mountains is also the geographical boundary between the north and south of China and a sensitive area for climate change, which is generally consistent with the 0°C isotherm in January, the 800-mm annual equivalent precipitation line, and the 2,000-h sunshine hour line (Bai et al., 2012). The Qinling Mountains is the dividing line between five key elements: geography, climate, biology, water system, and soil (Deng et al., 2018a; Deng et al., 2019; Hu et al., 2020; Wang et al., 2020).
2.2 Data Sources
The meteorological data are the monthly average temperature and monthly precipitation of 32 meteorological stations in the Qinling Mountains during 2000–2019, provided by the National Earth System Science Data Sharing Infrastructure (www.geodata.cn) and the Shaanxi Meteorological Bureau. The spatial distribution of meteorological stations is shown in Figure 1. This paper uses the ANUSPLIN method to interpolate the temperature and precipitation (Hutchinson and Xu, 2013). Compared with other spatial interpolation methods, the ANUSPLIN method induces less error in interpolation accuracy in a complex mountain environment (Xu et al., 2017; Qi et al., 2019; Qi et al., 2021). The DEM (spatial resolution: 250 m) is obtained via the National Geomatics Centre of China.
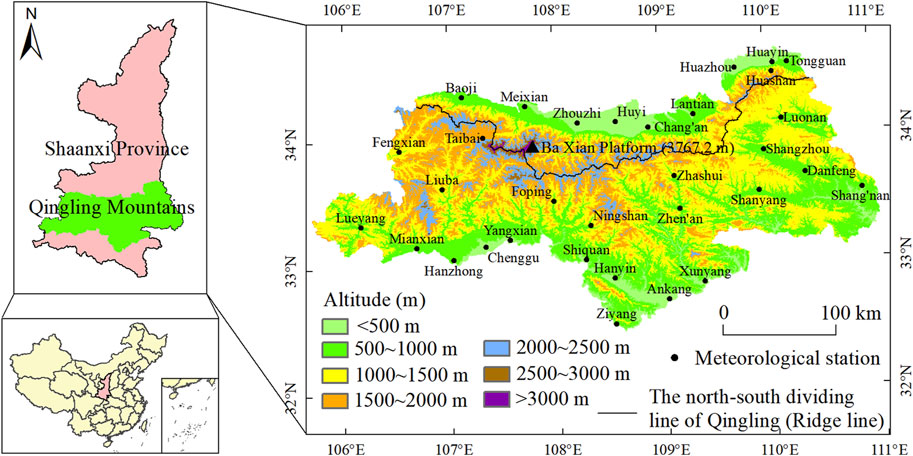
FIGURE 1. Geographical environment and distribution of meteorological stations in the southern and northern slopes of the Qinling Mountains.
This paper uses the NDVI index of the growing season to measure the vegetation status. According to the climate and vegetation growth in the Qinling Mountains, the vegetation-growing season is from March to October (Deng et al., 2019). NDVI data were obtained from the MOD13Q1 dataset of NASA (https://ladsweb.modaps.eosdis.nasa.gov/search/order/1/MOD13Q1--6), with a spatial resolution of 250 m × 250 m, and a time resolution of 16 days.
The MODIS Reprojection Tool (MRT) is used for image splicing, projection, and format conversion, and maximum value composite (MVC) is used to eliminate the influence of cloud, atmosphere, and Sun altitude to synthesize monthly NDVI data, which can effectively reflect the vegetation coverage of the area.
Method
2.3.1 Change Trend Analysis
The trends in this study were calculated using linear least-squares regression. The calculation formula is as follows:
where
Partial correlation analysis is a geostatistical method based on correlation analysis (Sun et al., 2020). When two variables are related to the third variable, the influence of one of the variables will be excluded, with only the degree of correlation between the other two variables considered, which has proven effective in eliminating other influencing factors:
where
The change trend and the partial correlation significance test are all determined by the t-test, and the results are divided into four levels: extremely significant
2.3.2 Multiple Regression Residual Analysis
Multiple regression residual analysis is employed to study the impact of climate change and human activities on vegetation NDVI changes and their relative contributions. The details of the method are as follows (Evans and Geerken 2004; Wessels et al., 2007):
① The binary regression model was constructed based on the growing season NDVI and the spatial temperature and precipitation time series datasets, in which temperature and precipitation were independent variables, and NDVI in the growing season was the dependent variable.
② According to the constructed model of step ①, the predicted NDVI is obtained (
③ According to the difference between the remotely sensed NDVI observation value
The calculation formula is as follows:
where
2.3.3 Determination of Driving Factors for Vegetation normalized difference vegetation index change
The slopes of
According to the impact of climate change and human activities on vegetation,
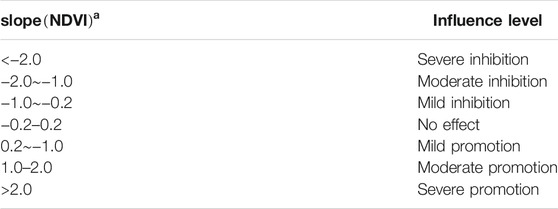
TABLE 1. Classification of the impacts of climate change and human activities on vegetation restoration (10–3 a−1).
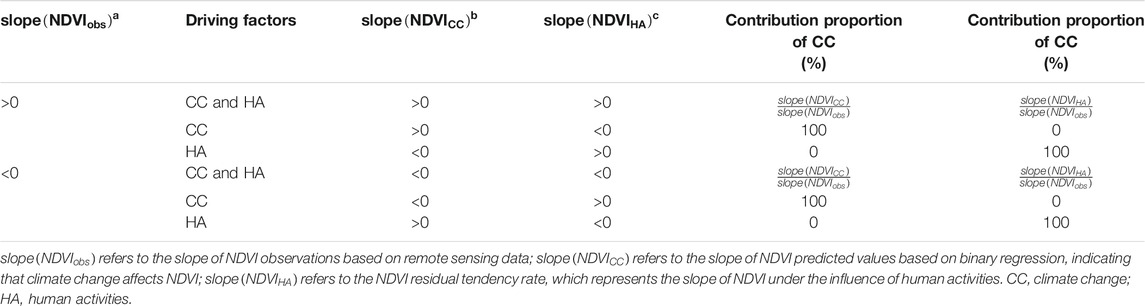
TABLE 2. Identification criterion and contribution calculation of the drivers of NDVI change.
3 Results
3.1 Temporal and Spatial Change Trends of Vegetation normalized difference vegetation index
The NDVI of the Qinling Mountains in the growing season during 2000–2019 showed a significant increase, with the rate of increase being 0.23/10a (p < 0.01) (Figure 2). Specifically, the rate of increase was 0.013/10a (p < 0.05) on the NSQM, and 0.026/10a (p < 0.01) on the SSQM. The NDVI during the growing season fluctuated between 0.64 and 0.70 on the NSQM, and between 0.69 and 0.76 on the SSQM. The NDVI on the SSQM is significantly higher than that on the NSQM. In the past 20 years, the vegetation coverage on the SSQM is not only higher than the NSQM but also displayed better signs of continuous improvement. This may be related to the expansion of the urban agglomeration on the NSQM.
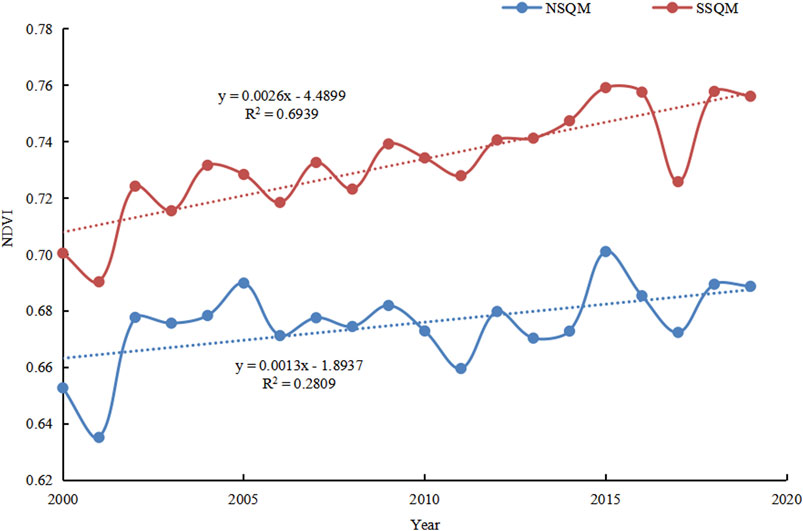
FIGURE 2. Interannual variation of growing season normalized difference vegetation index (NDVI) in the northern and southern slopes of the Qinling Mountains (NSQM and SSQM) during 2000–2019.
The change trend of NDVI during the growing season showed spatial heterogeneity in the Qinling Mountains during 2000–2019 (Figure 3). The area with increasing and decreasing trends of NDVI accounted for 87.96% and 12.04%. Among them, the areas with increasing and decreasing trends of NDVI accounted for 75.18% and 24.82% of the NSQM, and 91.30% and 8.70% of the NSQM, respectively.
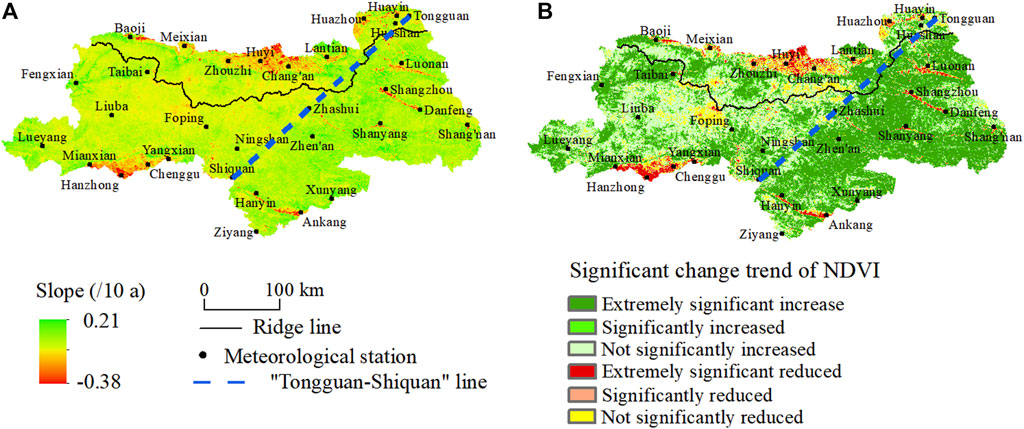
FIGURE 3. Spatial distribution of trend and the significance for NDVI in the NSQM and SSQM during 2000–2019.
The area with a significant increase in NDVI accounts for 59.21% of the Qinling Mountains (Figure 3B), which was mainly distributed in the eastern region (i.e., Zhen’an, Zhashui, Shanyang, etc.); the area with a significant decrease in NDVI only accounted for 4.00% of the study area, which is mainly located in Huyi, Chang’an, and Huazhou in the NSQM, and Hanzhong, Ankang, and Chenggu in the SSQM. Meanwhile, the areas with insignificant NDVI change are mainly distributed in the central region of the Qinling Mountains.
3.2 Analysis of the Driving Forces of Vegetation Change
With the continuous intensification of human activities, to reveal the internal mechanism of vegetation change, we must not only consider the impact of climate change but also account for the contribution of human activities. The area where climate change contributed to the increase in NDVI accounted for 84.04% of the Qinling Mountains, of which the severe and moderately promoted areas accounted for 56.97% of the Qinling Mountains, distributed in the eastern region and the area around the Qinling Mountains. The impact of climate change on the increase of NDVI showed that the lightly promoted area accounted for 27.07% of the Qinling Mountains, which is mainly distributed in the central areas of the Qinling Mountains. The inhibited impact of climate change on the increase in NDVI accounted for 7.54% of the Qinling Mountains, of which the area of moderate and severe inhibition is only 2.17% of the Qinling Mountains. It shows that climate change in the past 20 years is beneficial to vegetation growth in most areas of the Qinling Mountains.
The impact of human activities on the increase in NDVI is that the promoted area accounts for 73.63% of the Qinling Mountains, of which the severely and moderately promoted areas accounted for 52.77% of the Qinling Mountains, mainly distributed in the eastern part of the Qinling Mountains (Figure 4B). It may be related to the Natural Forest Protection Project and the Grain for Green Project. The area where the influence of human activities on the increase in NDVI is inhibited accounts for 17.65% of the Qinling Mountains, mainly located at low elevations (i.e., Huyi, Chang’an, Huazhou, and Hanzhong, Chenggu, Ankang), which are urban areas that have seen expansion. The moderately promoted area of the impact on NDVI increase of climate change accounts for a relatively high proportion, while the severely promoted area of human activity impact on NDVI increase is relatively high; the proportion of areas where human activities have inhibited the rise of NDVI is far greater than climate change. It indicates that human activities have a more direct and rapid impact on vegetation than climate change. A dividing line along Tongguan–Shiquan exists for the spatial distribution of climate change and human activity impact on NDVI in the Qinling Mountains. The impact of human activities on vegetation is more obvious east of the “Tongguan–Shiquan” divide.
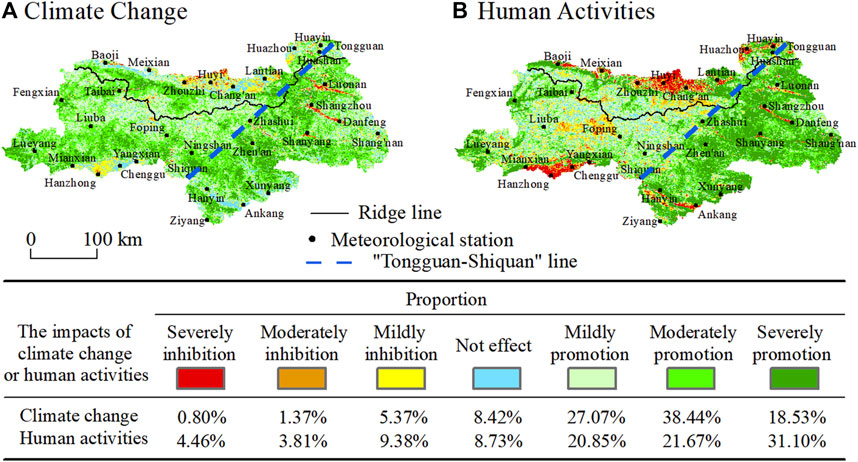
FIGURE 4. Spatial distribution of the impacts of climate change and human activities on vegetation restoration in the Qinling Mountains during 2000–2019.
The NDVI change is caused by climate change and human activities, accounting for 80.17% of the Qinling Mountains, among which 73.45% were found to increase and 6.72% decreased (Figure 5). The region of NDVI change caused by climate change alone accounted for 11.26% of the Qinling Mountains, mainly distributed in the central region (i.e., Liuba, Foping, Taibai, etc.); the region of NDVI change caused by human activities alone accounted for 8.57% of the Qinling Mountains. Regarding the NSQM and SSQM, the proportion of the NSQM where the NDVI decreases due to the combined influence of climate and human factors is much higher than that of the SSQM, but the area with increased NDVI is smaller than the SSQM.
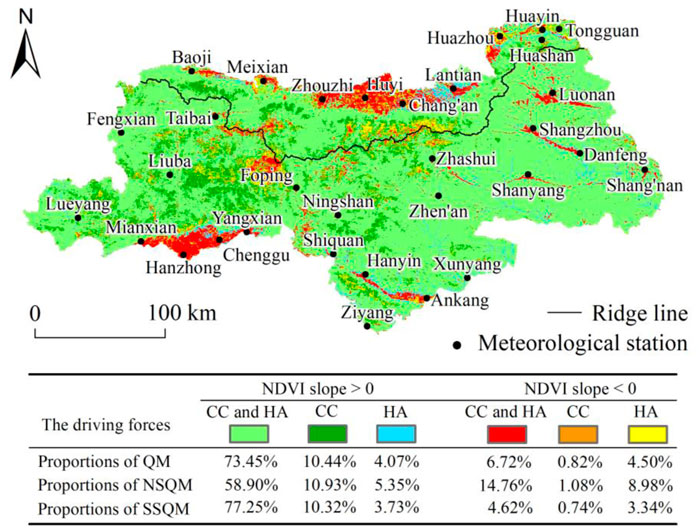
FIGURE 5. Drivers of vegetation cover change in the Qinling Mountains during 2000–2019.
3.3 Spatial Distribution of Driving Factors of Vegetation Change in Qinling Mountains
The NDVI change is caused by climate change and human activities, accounting for 80.17% of the Qinling Mountains, among which 73.45% were found to increase, and 6.72% decreased (Figure 5). The region of NDVI change caused by climate change alone accounted for 11.26% of the Qinling Mountains, mainly distributed in the central region (i.e., Liuba, Foping, Taibai, etc.); the region of NDVI change caused by human activities alone accounted for 8.57% of the Qinling Mountains. Regarding the NSQM and SSQM, the proportion of the NSQM where the NDVI decreases due to the combined influence of climate and human factors is much higher than that of the SSQM, but the area with increased NDVI is smaller than the SSQM.
3.4 Contribution of Climate Change and Human Activities to Vegetation Improvement or Degradation
Regarding vegetation improvement area (Figure 6A and Figure 6B), the contribution of climate change to vegetation improvement was higher than that of human activities in the Qinling Mountains (51.75% vs. 48.25%), including the NSQM (53.42% vs. 46.58%) and the SSQM (51.41% vs. 48.59%).
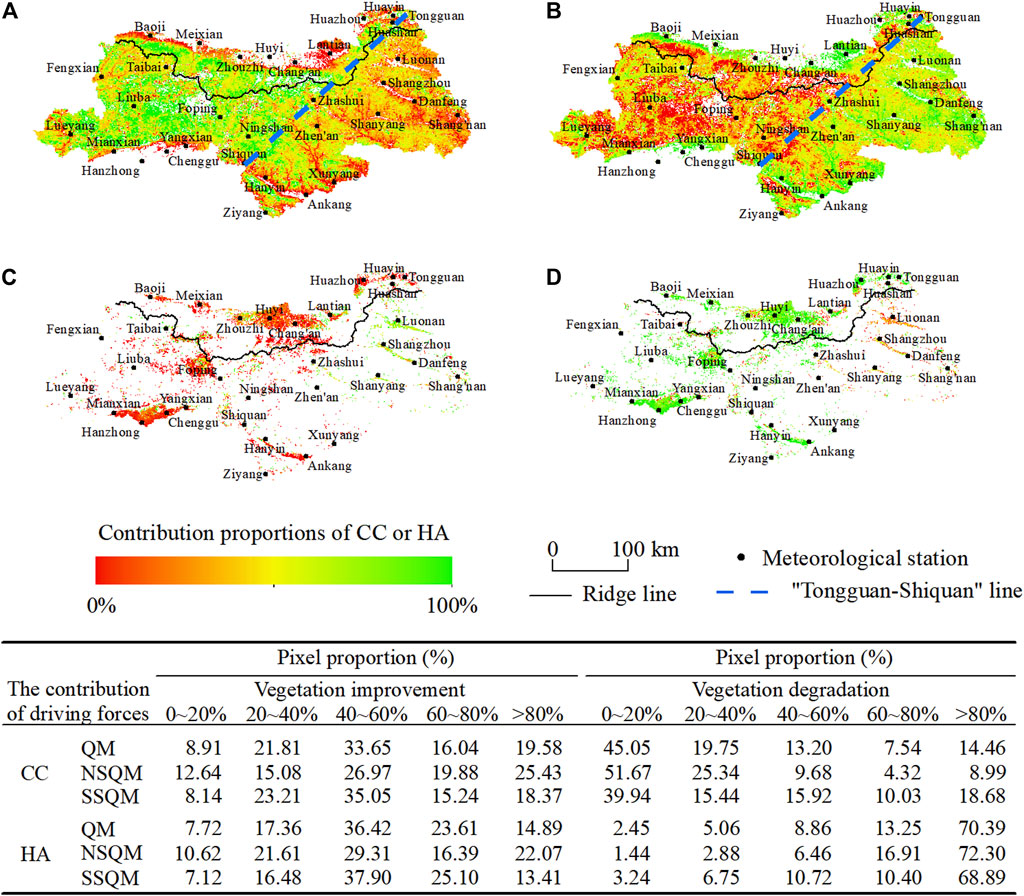
FIGURE 6. Spatial distributions of the contribution proportions of (A) climate change and (B) human activities to vegetation improvement, (C) climate change, and (D) human activities to vegetation degradation in the Qinling Mountains (CC, climate change; HA, human activities in the figure).
Regarding climate change, the largest area was characterized with 40%–60% contribution to vegetation improvement (Figure 6A). The regions where the climate change contribution rates are more than 80% were distributed in the central region of the Qinling Mountains. Regarding human activities, the largest area was found with 40%–60% contribution to vegetation improvement (Figure 6B). The highest rates of human activity contribution (over 80%) were distributed in the eastern part of the Qinling Mountains.
Regarding vegetation degradation area (Figures 6C, D), the contribution proportion of human activities to vegetation degradation was larger than that of climate change in the Qinling Mountains (77.89% vs. 22.11%), including the NSQM (81.78% vs. 18.22%) and the SSQM (75.02% vs. 24.98%).
As for climate change, the region with a contribution rate of 0%–20% was the largest, while for human activities, the regions with a contribution rate of more than 80% are the largest. The vegetation degradation is mainly caused by human activities, while the contribution of climate change is small.
3.5 Spatial Distribution of Dominant Factors in Vegetation normalized difference vegetation index Changes
In this study, the classification criteria for the leading factors of vegetation change are as follows: When the contribution rate of climate change is more than human activities, it is defined as “climate dominated.” On the contrary, it is defined as “human dominated.”
The percentage of climate-dominated vegetation improvement is smaller than that of human dominated (48.42% vs. 51.58%) (Figure7), while the percentage of climate-dominated vegetation degradation is smaller than that of human dominated (17.56% vs. 82.44%). The above shows that the impact of climate change on vegetation change is smaller than that of human activities in the Qinling Mountains.
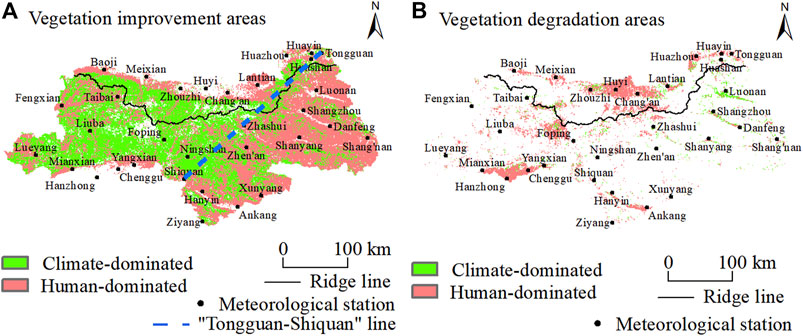
FIGURE 7. Spatial distributions of the climate and human dominated in the Qinling Mountains. (A) Vegetation improvement areas and (B) vegetation degradation areas.
4 Discussion
The vegetation changes in the Qinling Mountains are caused by the combined effects of climate change and human activities. On the one hand, it may be due to the continuous increase in temperature and precipitation, which promotes the growth of vegetation (Deng et al., 2018a; Qi et al., 2021), and the deposition of atmospheric carbon dioxide and nitrogen also enhances the growth of vegetation (Leakey et al., 2009). On the other hand, the implementation of vegetation restoration projects is conducive to vegetation restoration (i.e., the Grain for Green project), increasing vegetation coverage, and improving the management level of vegetation ecosystems.
The vegetation in the central region of Qinling Mountains was affected by climate change to a lesser extent, while in the surrounding region, it was affected by climate change to a greater extent (Figure 4A). This may be due to the high vegetation coverage in the central Qinling Mountains with little room for vegetation improvement. The vegetation of these regions is mildly promoted. Vegetation changes are not only affected by climate change but also human activities (Liu et al., 2018) (Qin et al., 2021). Population density, policy orientation, and topographical conditions will all affect the impact of human activities on vegetation changes (Li et al., 2017; Zheng et al., 2019). In areas with large slopes and complex terrain, the impact of human activities on vegetation changes is weakened. In this study, the eastern region with low altitude and low slope was found to have a high contribution rate of human activities to vegetation improvement, which is particularly obvious in the east of the “Tongguan–Shiquan line” (Figure 4B, Figure 6B).
In the degraded vegetation areas of the Qinling Mountains, human activities contributed 77.89% to the vegetation change (Figure 6D). It has been pointed out that land cover changes in Chang’an, Huyi, Lantian, and Huazhou in the Qinling Mountains are mainly the conversion of forest land and grassland to construction land (Guo et al., 2018), which may be the reason for the high contribution rate of human activities to the decrease of NDVI.
The central part of Foping also exhibits high human activity contribution with the NDVI declining significantly, which was related to the conversion of forested grassland to construction land during the construction of scenic areas (Guo et al., 2018). Human activities in the eastern part of the Qinling Mountains leads to an increase in vegetation NDVI (Figure 6), which was due to the implementation of artificial ecological projects, which has significantly improved the vegetation. Previous studies have pointed out that the vegetation coverage in the eastern part of the Qinling Mountains has increased significantly (Wang et al., 2016; Li et al., 2019), which was similar to the results of this study. The improvement of vegetation in this area is the main contribution of human activities. Therefore, the implementation of ecological engineering projects plays a significant role in the improvement of vegetation coverage.
Regarding the vegetation ecosystem change, there may be some normal ecological succession during the evolution of vegetation ecosystem leading to vegetation change, which needs to be improved by adding more detailed vegetation distribution data later. In the study, severe vegetation degradation was identified in the low-elevation areas in the Qinling Mountains, with the main factor of degradation being human activities. However, whether this area was converted to construction land or cultivated land after degradation deserves further exploration. Moreover, the deviation of NDVI data quality may lead to some errors in the results, which may cause certain errors in the research. Although this study has certain shortcomings, the research and analysis in this article are still a good attempt to quantitatively assess the influence factors of vegetation change.
5 Conclusion
This paper investigated the spatial and temporal variability characteristics of NDVI and quantitatively assessed the relative contribution of the drivers of NDVI change in the Qinling Mountains. The results show that the NDVI value in the Qinling Mountains exhibited a significant increasing trend at a rate of 0.23/10a during 2000–2019. The combined impact of climate change and human activities were the main driving force for the change and spatial difference of vegetation NDVI in the Qinling Mountains. The “Tongguan–Shiquan line” is not only the dividing line for the intensity of vegetation change but also separates the climatic- and human-dominated type. In terms of the vegetation improvement area, the contribution of climate change to the NDVI increase is greater than that of human activities (51.75% vs. 48.25%). In terms of vegetation degradation area, the area of climate change as the leading factor accounted for 17.56%, and the area with human activities as the dominant factor accounted for 82.44%. It is more important to establish stricter measures for human activities.
Data Availability Statement
The original contributions presented in the study are included in the article/supplementary material, further inquiries can be directed to the corresponding author.
Author Contributions
DC: Data Analysis, writing-original draft. GQ: Writing-review and editing. JS: Project administration. YZ: Formal analysis. HB: Conceptialization. XG: Investigation, Validation.
Funding
This study was jointly supported by the Special Funds of the National Natural Science Foundation of China (Grant No. 42041004), Key Research and Development Program of Shaanxi Province, China(Grant No. 2019ZDLSF05-02), Shaanxi Province Water Conservancy Science and Technology Project(Grant No.2021slkj-13).
Conflict of Interest
The authors declare that the research was conducted in the absence of any commercial or financial relationships that could be construed as a potential conflict of interest.
Publisher’s Note
All claims expressed in this article are solely those of the authors and do not necessarily represent those of their affiliated organizations, or those of the publisher, the editors and the reviewers. Any product that may be evaluated in this article, or claim that may be made by its manufacturer, is not guaranteed or endorsed by the publisher.
References
Bai, H., Ma, X., Gao, X., and Hou, X. (2012). Variations in January Temperature and 0°C Isothermal Curve in Qinling Mountains Based on DEM. Acta Geographica Sinica 67 (11), 1443–1450. (in Chinese). doi:10.11821/xb201211001
Braswell, B. H., Schimel, D. S., Linder, E., and Moore, B. (1997). The Response of Global Terrestrial Ecosystems to Interannual Temperature Variability. Science 278 (5339), 870–873. doi:10.1126/science.278.5339.870
Cai, Y., Yue, W., Xu, L., Yang, Z., and Rong, Q. (2016). Sustainable Urban Water Resources Management Considering Life-Cycle Environmental Impacts of Water Utilization under Uncertainty. Resour. Conservation Recycling 108, 21–40. doi:10.1016/j.resconrec.2016.01.008
Cheng, L., Zhang, L., Wang, Y.-P., Canadell, J. G., Chiew, F. H. S., Beringer, J., et al. (2017). Recent Increases in Terrestrial Carbon Uptake at Little Cost to the Water Cycle. Nat. Commun. 8 (1), 110. doi:10.1038/s41467-017-00114-5
Deng, C., Bai, H., Gao, S., Huang, X., Meng, Q., Zhao, T., et al. (2018a). Comprehensive Effect of Climatic Factors on Plant Phenology in Qinling Mountains Region during 1964-2015. Acta Geographica Sinica 73 (05), 917–931. (in Chinese). doi:10.1016/j.ecolind.2021.108211
Deng, C., Bai, H., Gao, S., Liu, R., Ma, X., Huang, X., et al. (2018b). Spatial-temporal Variation of the Vegetation Coverage in Qinling Mountains and its Dual Response to Climate Change and Human Activities. J. Nat. Sci. 33 (03), 425–438. (in Chinese). doi:10.11849/zrzyxb.20170139
Deng, C., Bai, H., Gao, S., Zhao, T., and Ma, X. (2019). Differences and Variations in the Elevation-dependent Climatic Growing Season of the Northern and Southern Slopes of the Qinling Mountains of China from 1985 to 2015. Theor. Appl. Climatol 137 (1), 1159–1169. doi:10.1007/s00704-018-2654-7
Duan, W., Maskey, S., Chaffe, P. L. B., Luo, P., He, B., Wu, Y., et al. (20212021). Recent Advancement in Remote Sensing Technology for Hydrology Analysis and Water Resources Management. Remote Sensing 13 (6), 1097. doi:10.3390/rs13061097
Duan, W., Zou, S., Chen, Y., Nover, D., Fang, G., and Wang, Y. (2020). Sustainable Water Management for Cross-Border Resources: The Balkhash Lake Basin of Central Asia, 1931-2015. J. Clean. Prod. 263, 121614. doi:10.1016/j.jclepro.2020.121614
Evans, J., and Geerken, R. (2004). Discrimination between Climate and Human-Induced Dryland Degradation. J. Arid Environments 57 (4), 535–554. doi:10.1016/S0140-1963(03)00121-6
Ge, W., Deng, L., Wang, F., and Han, J. (2021). Quantifying the Contributions of Human Activities and Climate Change to Vegetation Net Primary Productivity Dynamics in China from 2001 to 2016. Sci. Total Environ. 773, 145648. doi:10.1016/j.scitotenv.2021.145648
Hu, Y., Yao, Y., and Kou, Z. (2020). Exploring on the Climate Regionalization of Qinling-Daba Mountains Based on Geodetector-SVM Model. Plos one 15 (11), e0241047. doi:10.1371/journal.pone.0241047
Huang, S., Zheng, X., Ma, L., Wang, H., Huang, Q., Leng, G., et al. (2020). Quantitative Contribution of Climate Change and Human Activities to Vegetation Cover Variations Based on GA-SVM Model. J. Hydrol. 584, 124687. doi:10.1016/j.jhydrol.2020.124687
Huang, W., Duan, W., and Chen, Y. (2021). Rapidly Declining Surface and Terrestrial Water Resources in Central Asia Driven by Socio-Economic and Climatic Changes. Sci. Total Environ. 784, 147193. doi:10.1016/j.scitotenv.2021.147193
Hutchinson, M. F., and Xu, T. (2013). Anusplin Version 4.4 User Guide. Available at: http://fennerschool.anu.edu.au/files/anusplin44.pdf.
Ichii, K., Kawabata, A., and Yamaguchi, Y. (2002). Global Correlation Analysis for NDVI and Climatic Variables and NDVI Trends: 1982-1990. Int. J. Remote Sensing 23 (18), 3873–3878. doi:10.1080/01431160110119416
Ji, S., Ren, S., Li, Y., Dong, J., Wang, L., Quan, Q., et al. (2021). Diverse Responses of spring Phenology to Preseason Drought and Warming under Different Biomes in the North China Plain. Sci. Total Environ. 766, 144437. doi:10.1016/j.scitotenv.2020.144437
Kai, J., Fei, W., Han, J. Q., Shi, S. Y., and Ding, W. B. (2020). Contribution of Climatic Change and Human Activities to Vegetation NDVI Change over China during. 1982-2015. Acta Geographica Sinica 75 (5), 961–974. (in Chinese). doi:10.11821/dlxb202005006
Landuyt, D., De Lombaerde, E., Perring, M. P., Hertzog, L. R., Ampoorter, E., Maes, S. L., et al. (2019). The Functional Role of Temperate forest Understorey Vegetation in a Changing World. Glob. Change Biol. 25 (11), 3625–3641. doi:10.1111/gcb.14756
Leakey, A. D. B., Ainsworth, E. A., Bernacchi, C. J., Rogers, A., Long, S. P., and Ort, D. R. (2009). Elevated CO2 Effects on Plant Carbon, Nitrogen, and Water Relations: Six Important Lessons from FACE. J. Exp. Bot. 60 (10), 2859–2876. doi:10.1093/jxb/erp096
Li, G., Sun, S., Han, J., Yan, J., Liu, W., Wei, Y., et al. (2019). Impacts of Chinese Grain for Green Program and Climate Change on Vegetation in the Loess Plateau during 1982-2015. Sci. Total Environ. 660, 177–187. doi:10.1016/j.scitotenv.2019.01.028
Li, J., Peng, S., and Li, Z. (2017). Detecting and Attributing Vegetation Changes on China's Loess Plateau. Agric. For. Meteorology 247, 260–270. doi:10.1016/j.agrformet.2017.08.005
Liu, Z., Liu, Y., and Li, Y. (2018). Anthropogenic Contributions Dominate Trends of Vegetation Cover Change over the Farming-Pastoral Ecotone of Northern China. Ecol. Indicators 95, 370–378. doi:10.1016/j.ecolind.2018.07.063
Mao, D., Wang, Z., Luo, L., and Ren, C. (2012). Integrating AVHRR and MODIS Data to Monitor NDVI Changes and Their Relationships with Climatic Parameters in Northeast China. Int. J. Appl. Earth Observation Geoinformation 18, 528–536. doi:10.1016/j.jag.2011.10.007
Myers-Smith, I. H., Kerby, J. T., Phoenix, G. K., Bjerke, J. W., Epstein, H. E., Assmann, J. J., et al. (2020). Complexity Revealed in the Greening of the Arctic. Nat. Clim. Chang. 10 (2), 106–117. doi:10.1038/s41558-019-0688-1
Nemani, R. R., Keeling, C. D., Hashimoto, H., Jolly, W. M., Piper, S. C., Tucker, C. J., et al. (2003). Climate-Driven Increases in Global Terrestrial Net Primary Production from 1982 to 1999. Science 300 (5625), 1560–1563. doi:10.1126/science.1082750
Ovakoglou, G., Alexandridis, T. K., Clevers, J. G. P. W., Cherif, I., Kasampalis, D. A., Navrozidis, I., et al. “Spatial Enhancement of Modis Leaf Area Index Using Regression Analysis with Landsat Vegetation Index,” in IGARSS 2018 - 2018 IEEE International Geoscience and Remote Sensing Symposium, July 2018Valencia, Spain, 8232–8235. doi:10.1109/IGARSS.2018.8519387
Piao, S., Yin, G., Tan, J., Cheng, L., Huang, M., Li, Y., et al. (2015). Detection and Attribution of Vegetation Greening Trend in China over the Last 30 Years. Glob. Change Biol. 21 (4), 1601–1609. doi:10.1111/gcb.12795
Qi, G., Bai, H., Meng, Q., Zhao, T., and Guo, S. (2019). Climate Change in the Qinling Mountains in Spring during 1959-2018. Arid Zone Res. 36 (5), 1079–1091. (in Chinese). doi:10.13866/j.azr.2019.05.04
Qi, G., Bai, H., Zhao, T., Meng, Q., and Zhang, S. (2021). Sensitivity and Areal Differentiation of Vegetation Responses to Hydrothermal Dynamics on the Southern and Northern Slopes of the Qinling Mountains in Shaanxi Province. Acta Geographica Sinica 76 (1), 44–56. (in Chinese). doi:10.11821/dlxb202101004
Qin, X., Liu, W., Mao, R., Song, J., Chen, Y., Ma, C., et al. (2021). Quantitative Assessment of Driving Factors Affecting Human Appropriation of Net Primary Production (HANPP) in the Qilian Mountains, China. Ecol. Indicators 121, 106997. doi:10.1016/j.ecolind.2020.106997
Shaozhuang, G., Hongying, B., Qing, M., Ting, Z., Xiaoyue, Y., and Guizeng, Q. (2020). Landscape Pattern Changes of woodland and Grassland and its Driving Forces in Qinling Mountains. Acta Eco Sin 40 (1), 130–140. (in Chinese). doi:10.5846/stxb201811072418
Shi, S., Yu, J., Wang, F., Wang, P., Zhang, Y., and Jin, K. (2021). Quantitative Contributions of Climate Change and Human Activities to Vegetation Changes over Multiple Time Scales on the Loess Plateau. Sci. Total Environ. 755, 142419. doi:10.1016/j.scitotenv.2020.142419
Song, J., Tang, B., Zhang, J., Dou, X., Liu, Q., and Shen, W. (2018). System Dynamics Simulation for Optimal Stream Flow Regulations under Consideration of Coordinated Development of Ecology and Socio-Economy in the Weihe River Basin, China. Ecol. Eng. 124, 51–68. doi:10.1016/j.ecoleng.2018.09.024
Sun, W., Song, X., Mu, X., Gao, P., Wang, F., and Zhao, G. (2015). Spatiotemporal Vegetation Cover Variations Associated with Climate Change and Ecological Restoration in the Loess Plateau. Agric. For. Meteorology 209-210 (1), 87–99. doi:10.1016/j.agrformet.2015.05.002
Sun, Y.-L., Shan, M., Pei, X.-R., Zhang, X.-K., and Yang, Y.-L. (2020). Assessment of the Impacts of Climate Change and Human Activities on Vegetation Cover Change in the Haihe River basin, China. Phys. Chem. Earth, Parts A/B/C 115, 102834. doi:10.1016/j.pce.2019.102834
Vicente-Serrano, S. M., Gouveia, C., Camarero, J. J., Begueria, S., Trigo, R., Lopez-Moreno, J. I., et al. (2013). Response of Vegetation to Drought Time-Scales across Global Land Biomes. Proc. Natl. Acad. Sci. 110 (1), 52–57. doi:10.1073/pnas.1207068110
Wang, B., Xu, G., Li, P., Li, Z., Zhang, Y., Cheng, Y., et al. (2020). Vegetation Dynamics and Their Relationships with Climatic Factors in the Qinling Mountains of China. Ecol. Indicators 108, 105719. doi:10.1016/j.ecolind.2019.105719
Wang, S., Fu, B., Piao, S., Lü, Y., Ciais, P., Feng, X., et al. (2016). Reduced Sediment Transport in the Yellow River Due to Anthropogenic Changes. Nat. Geosci 9 (1), 38–41. doi:10.1038/ngeo2602
Wessels, K. J., Prince, S. D., Malherbe, J., Small, J., Frost, P. E., and VanZyl, D. (2007). Can Human-Induced Land Degradation Be Distinguished from the Effects of Rainfall Variability? A Case Study in South Africa. J. Arid Environments 68 (2), 271–297. doi:10.1016/j.jaridenv.2006.05.015
Wold, S., Esbensen, K., and Geladi, P. (1987). Principal Component Analysis. Chemometr Intell. Lab. 2 (1), 37–52. doi:10.1016/0169-7439(87)80084-9
Xu, H.-J., Wang, X.-P., and Yang, T.-B. (2017). Trend Shifts in Satellite-Derived Vegetation Growth in Central Eurasia, 1982-2013. Sci. Total Environ. 579, 1658–1674. doi:10.1016/j.scitotenv.2016.11.182
Yan, Y., Liu, X., Wen, Y., and Ou, J. (2019). Quantitative Analysis of the Contributions of Climatic and Human Factors to Grassland Productivity in Northern China. Ecol. Indicators 103, 542–553. doi:10.1016/j.ecolind.2019.04.020
Zeng, Z., Li, Y., Wu, W., Zhou, Y., Wang, X., Huang, H., et al. (2020). Spatio-Temporal Variation of Drought within the Vegetation Growing Season in North Hemisphere (1982-2015). Water 12 (8), 2146. doi:10.3390/w12082146
Zhang, X., Song, J., Wang, Y., Deng, W., and Liu, Y. (2021). Effects of Land Use on Slope Runoff and Soil Loss in the Loess Plateau of China: A Meta-Analysis. Sci. Total Environ. 755, 142418. doi:10.1016/j.scitotenv.2020.142418
Zheng, K., Wei, J.-Z., Pei, J.-Y., Cheng, H., Zhang, X.-L., Huang, F.-Q., et al. (2019). Impacts of Climate Change and Human Activities on Grassland Vegetation Variation in the Chinese Loess Plateau. Sci. Total Environ. 660, 236–244. doi:10.1016/j.scitotenv.2019.01.022
Keywords: normalized difference vegetation index (NDVI), quantitative analysis, climate change, human activities, the Qinling Mountains
Citation: Cheng D, Qi G, Song J, Zhang Y, Bai H and Gao X (2021) Quantitative Assessment of the Contributions of Climate Change and Human Activities to Vegetation Variation in the Qinling Mountains. Front. Earth Sci. 9:782287. doi: 10.3389/feart.2021.782287
Received: 24 September 2021; Accepted: 10 November 2021;
Published: 10 December 2021.
Edited by:
Guangzhi Sun, Northeast Institute of Geography and Agroecology (CAS), ChinaReviewed by:
Weili Duan, Xinjiang Institute of Ecology and Geography (CAS), ChinaPengfei Li, Xi’an University of Science and Technology, China
Changfeng Sun, Institute of Earth Environment (CAS), China
Copyright © 2021 Cheng, Qi, Song, Zhang, Bai and Gao. This is an open-access article distributed under the terms of the Creative Commons Attribution License (CC BY). The use, distribution or reproduction in other forums is permitted, provided the original author(s) and the copyright owner(s) are credited and that the original publication in this journal is cited, in accordance with accepted academic practice. No use, distribution or reproduction is permitted which does not comply with these terms.
*Correspondence: Guizeng Qi, Z3VpemVuZ19xaUAxNjMuY29t