- 1State Key Laboratory of Petroleum Resources and Prospecting, China University of Petroleum (Beijing), Beijing, China
- 2College of Petroleum Engineering, China University of Petroleum (Beijing), Beijing, China
With the continuous development of the petroleum resources, unconventional oil reservoirs such as shale oil and tight oil have gradually become a main development direction of oil reservoirs in various countries. The reserves of shale oil in China are huge, reaching 1.42 × 10¹¹ t; therefore, China has a great development potential and prospects for exploitation. However, in the process of developing shale oil reservoirs, we encountered many problems, such as un-replenishment of formation pressure and low flowback rate. At this stage, the development technology of shale oil reservoirs cannot effectively solve these problems. The proposition of shut-in technology can effectively improve these problems in theory, but the current shut-in technology of shale reservoirs after fracturing in China is still in its infancy. There is no in-depth understanding of the mechanism of shut-in wells. In addition, the factors affecting the change of oil-water distribution during shut-in after fracturing are complex, mainly including reservoir permeability, capillary force, fracture stress sensitivity, and reservoir damage. This paper investigates the mechanism of shut-in in shale reservoirs after fracturing and summarizes the mechanism of the shut-in process. Then, a single well shut-in numerical simulation model is established for the three complex characteristics of spontaneous imbibition, fracture stress sensitivity, and reservoir damage, and the oil-water distribution and change laws of shut-in shale reservoirs after fracturing are analyzed. Finally, the numerical model is used to study the influence of reservoir permeability, capillary force, fracture stress sensitivity, and reservoir damage on oil-water replacement, pressure increase, and daily fluid production during shut-in. The research results show that the influence of reservoir permeability and capillary force is more obvious, and the influence of fracture stress sensitivity and reservoir damage is relatively small.
Introduction
The effective development of shale oil usually relies on horizontal wells and multi-stage hydraulic fracturing technology, which usually requires the injection of a large amount of fracturing fluid into the reservoir to form a complex fracture network, so that the oil and gas production of shale reservoirs can achieve economic benefits. After the fracturing measures are over, the shut-in measures will be carried out first, and the duration varies from a few weeks to a few months (Wust et al., 2018). The shut-in process is usually accompanied by the imbibition effect of fracturing fluid from the fracture to the matrix, which plays three roles: The first is that the fracturing fluid enters the matrix through the fracture under the action of imbibition to raise the formation pressure of the near-fracture matrix, which plays a role in increasing the formation energy. The second is that the fracturing fluid enters the matrix through the fractures to replace the oil phase into the fractures under the action of imbibition, making it easier to produce oil during the development process. The third is that the fracturing fluid penetrates deeper into the matrix, so that the water saturation curve of the invasion zone is lower and flatter, and the relative permeability of the oil phase during flowback is higher. The effects of these three aspects are reflected in the higher initial production of flowback after shut-in (Bertoncello et al., 2014; Yaich et al., 2015; Wang and Leung, 2016). Therefore, shut-in is conducive to early flowback and production, but the interaction between fracturing fluid and reservoir fluid in the shut-in phase will bring many problems. Among them, the most difficult one is that it will increase the fracturing fluid absorption, which will lead to the effects of water sensitivity and water blocking in the reservoir. At the same time, the fracture may close after the fracture pressure is reduced, which will eventually lead to a decrease in shale oil production. Therefore, the influence of shut-in on production has gradually gained attention and related research has been carried out.
Odumabo (Odumabo et al., 2014) found that the water saturation distribution of the near-fracture surface during shut-in is closely related to the shut-in time and the fracturing fluid imbibition of the reservoir. And there are differences in the mode of action between the two. At the same time, Odumabo also found that the important factors affecting gas seepage after fracturing are the water saturation distribution and permeability changes of fracturing fluid intruding near the fracture surface. Wang (Wang et al., 2012) discovered the change of fluid seepage phenomenon under the action of osmotic pressure and capillary force, and studied the relationship between microfractures caused by hydraulic fracturing and imbibition in shale oil reservoirs. It is found that clay minerals are equivalent to a semi-permeable membrane and have a stronger ability to absorb water. Le (Le et al., 2009) used numerical simulation to analyze the changes in gas phase permeability of the fracturing fluid invaded area during the shut-in process. At the same time, he also noticed the deep fracturing fluid imbibition and gas phase evaporation phenomena in the matrix. Furthermore, he got a more reasonable conclusion: it takes time to recover the permeability, which shows that the imbibition of capillary force can promote the recovery of permeability during the flowback process of shut-in. He (He et al., 2020) presents a PTA model of an MFHW which considers the nonuniform properties of fractures, including unequal fracture conductivity, nonuniform production distribution, asymmetric fractures, and arbitrary locations. He found when the distance between fractures with high production (FHP) increases or number of FHP decreases, the early-radial flow can be obviously observed, and the duration of this regime depends on the interference among fractures. Jia (Jia et al., 2021a) proposed a fully coupled flow and geomechanics model to capture the dynamic behavior of key fracture parameters for flowback and early-time production. In this coupled model, the controlled volume method is used to numerically simulate the fracture flow, which can consider the geometry and conductivity distribution of the propped and unpropped fractures. For the fracture geomechanics, the joint-closure relationship is introduced to describe the fracture aperture of unpropped fracture. Fakcharoenphol (Fakcharoenphol et al., 2014) believed that the composition of the fracturing fluid and the physical characteristics of the reservoir itself have an effect on the fracturing fluid imbibition, and he discovered that micro-fractures may be formed after shale imbibition. Yan (Yan et al., 2015) studied the relationship between the change in gas volume attracted by spontaneous imbibition and shut-in time, and found that the important factor affecting the relationship between shut-in time and permeability recovery is the lithology of the reservoir. Jia (Jia et al., 2021b) built a transient model for multistage fractured horizontal wells, based on point-source method and superposition principle, which considers the couple of fracture flow and reservoir seepage, and solved with the Laplace transformation. The transient pressure behavior in multistage fractured horizontal wells is discussed, and effects of influence factors are analyzed. The result of this article can be used to identify the response characteristic of fracture conductivity to pressure and pressure differential and provide theoretical basis for effective development of tight oil reservoirs. He (He et al., 2022) provided a novel approach to enhance oil recovery from unconventional oil reservoirs through synchronous inter-fracture injection and production (SiFIP) and asynchronous inter-fracture injection and production (AiFIP). He demonstrated the feasibility of SiFIP and AiFIP to improve oil recovery. The proposed methods improved flooding performance by transforming fluid injection among wells to among hydraulic fractures from the same Multi-fractured horizontal well (MFHW). Liu (Liu, 2017) used nuclear magnetic resonance to discover the fluid flow law during the spontaneous imbibition process, and summarized the microscopic imbibition law during shut-in, that is, under the action of capillary force, the liquid imbibition rate in small pores is the fastest. Therefore, the water saturation in the small pores is the highest, while the large pores are the opposite. He divided the fracturing fluid imbibition into two main stages: one is the imbibition saturation of the fracture surface, and the other is the diffusion of the fracturing fluid in the deep part of the matrix. It not only analyzes the mechanism of shut-in measures to increase productivity at the microscopic level, but also summarizes the applicable conditions for shut-in.
Still, there is a lack of detailed and comprehensive numerical simulation studies on shut-in in shale reservoirs after fracturing, and the research on the change law of the oil-water distribution state of shut-in after fracturing is not comprehensive enough, and there is a lack of research on its influencing factors. As a result, the rules and applicable conditions of shut-in on productivity are unclear. In this paper, by constructing a complex fracture network of volume fracturing, a numerical simulation model of shut-in considering imbibition, near-fracture matrix damage, and stress sensitivity is established to clarify the change law of oil-water distribution state at different shut-in times, and explore the influence rules of different capillary forces, different fracture stress sensitivity coefficients, and different reservoir damage levels on productivity, and determine the hidden laws and main control factors of the shut-in effect.
Key Mechanisms in Shut-In Period
In the process of shut-in in shale reservoirs after fracturing, under the action of higher bottom hole pressure, fracturing fluid with a large amount of energy enters the near-fracture shale matrix, and the formation energy is improved through imbibition and oil-water replacement is carried out. At the same time, as the internal pressure of the crack decreases, the crack may close. After fracturing fluid intrudes into the formation, it also causes near-fractured reservoir damage, such as solid damage, some hydration caused by liquid incompatibility, etc., which are all important mechanisms for shut-in in shale reservoirs after fracturing. Each mechanism is explained in turn.
The Imbibition Mechanism of Fracturing Fluid-Shale Matrix
Under the action of capillary force, the fracturing fluid and the shale matrix are imbibed, that is, the wetting phase (fracturing fluid) displaces the non-wetting phase (oil phase) in the reservoir. In shale reservoirs, the capillary force in the matrix is higher due to the nano-scale pore structure, so the imbibition effect becomes more obvious. The imbibition phenomenon in the shut-in after fracturing is shown in Figure 1.
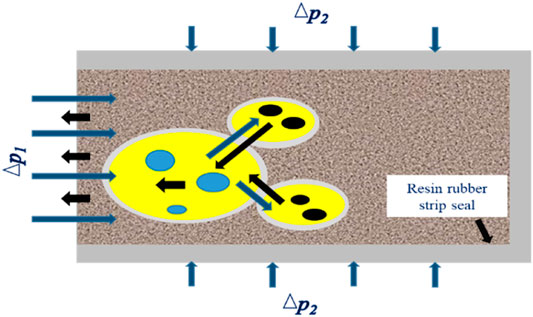
FIGURE 1. Imbibition in a fractured stuffy well (Li et al., 2017).
A key quantity in the process of imbibition is the amount of imbibition and the rate of imbibition. The amount of imbibition is not only related to time, but also closely related to space and imbibition capacity. The amount of imbibition directly affects the increase in formation pressure, and the amount of imbibition is usually proportional to the increase in pore pressure. The more the amount of imbibition, the better the effect of supplementing the formation energy. In the process of imbibition, the main body of fracturing fluid is slippery water that creates fractures, which can not only supplement energy, but also effectively replace the oil phase of the matrix.
In the process of imbibition, the imbibition rate of liquid in small pores is much higher than that in large pores. Fracturing fluid first enters the small pores to fill them, but the large pores are not filled. The fracturing fluid continuously displaces the crude oil in the small pores into the large pores. When the oil phase pressure exceeds the pore pressure, the oil phase will migrate to larger pores. During the entire imbibition process, the pore oil phase will be displaced into the fractures by a large amount of fracturing fluid, which realizes the oil-water replacement during the shut-in process (Liu, 2017).
Crack Closure Mechanism
During the shut-in process of a shale reservoir, because the fractures are subjected to external ground stress and internal fracturing fluid pressure in the reservoir, the mechanical balance of the fractures is maintained by the vertical stress, horizontal stress, and pressure in the fracture (Wang, 2018). As shown in Figure 2. During the shut-in process of a shale reservoir, due to imbibition, the pressure in the fracture continuously spreads to the deep part of the shale matrix, and the pressure in the fracture is continuously reduced.
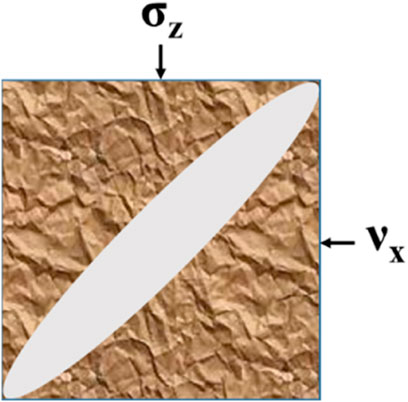
FIGURE 2. Schematic diagram of the stress state of the crack (Wang, 2018).
The phenomenon of fracture closure is due to the decrease of internal pore pressure caused by the outflow of fluid in the fracture, and the previous balance system is broken. During the shut-in process, the pressure in the fractures is continuously reduced, and the fractures near the wellbore will close earlier. After the fractures are closed, it is difficult for the reservoir to return to its original seepage capacity. Therefore, the residual crude oil in the matrix cannot be recovered, which will affect the oil and gas production capacity.
Damage to Near-Fracture Matrix
For the fracturing process of shale reservoirs, on the one hand, the fracturing fluid entering the reservoir can form fractures with high conductivity and improve the oil-water flow channel of the reservoir; on the other hand, the fracturing fluid will also bring damage to the reservoir. Some damages result in reduced permeability and reduced output.
The damage of fracturing fluid is to reduce the permeability of the formation through physical or chemical actions, which is mainly reflected in two aspects: First, the blockage of the pores caused by the expansion of clay minerals and the dispersion and migration of particles has serious damage to the reservoir. In particular, the incompatibility of foreign fluids causes various physical or chemical reactions with clay minerals. These reactions can cause many serious problems, such as wettability reversal, permeability reduction, hydration, pore structure changes, etc., which can damage the reservoir. Second, after the fracturing fluid enters the throat, due to the presence of capillary force, a water lock phenomenon may be formed, which has a serious impact on the reservoir. The higher the capillary resistance, the more clogged or even permanent clogging of the pores, causing serious damage.
Numerical Simulation Using a Fully Numerical Model
Characterization of Key Parameters of Shut-In Mechanism
Characterization of imbibition parameters: The Handy model (Cai and Yu, 2012), the theoretical model of imbibition, refers to imagining the core as a bundle of closely arranged parallel capillaries. Under the action of capillary force, fluid is imbibed into the interior of the rock matrix. This process can be regarded as a displacement process. Without considering the influence of gravity and gas pressure gradient, the relationship between core imbibition quality and time can be obtained, as shown in Equation 1.
where
It can be seen from the above relationship that in the process of spontaneous imbibition in the Handy model (Cai and Yu, 2012), the square of the imbibed volume has a linear relationship with the imbibition time.
Dynamic changes of cracks: In this paper, for the characteristic parameters of crack dynamic change, it is necessary to obtain the crack stress sensitivity coefficient, the crack stress sensitivity coefficient and use the power method. To obtain the basic form of the power formula, the fracture permeability and the effective stress of the rock need to be processed without dimension. After processing, the following form is obtained:
In the above formula,
Substituting the initial data of fracture permeability and the corresponding fracture stress sensitivity coefficient under this permeability into the rectangular coordinate system, and fitting it to obtain:
Among them, the fitting constants of a and b can be obtained as follows:
In the formula:
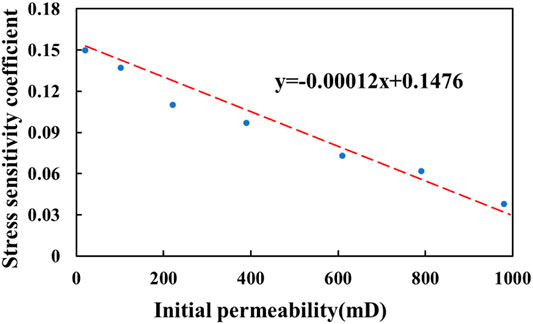
The relationship curve between fracture stress sensitivity coefficient and initial fracture permeability is shown in Figure 3. It can be seen from the figure that the fracture stress sensitivity coefficient has a good linear relationship with the initial fracture permeability.
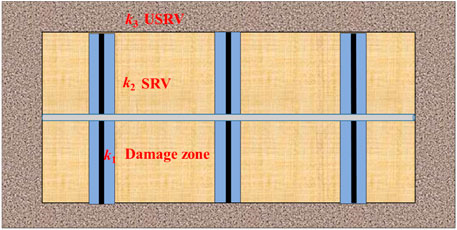
Damage to the reservoir matrix: The numerical simulation model in this paper believes that the main judgment basis for reservoir damage in the near-fracture area is the permeability of the reservoir, that is, the permeability of the reformed area and the unreformed area in the model are different, as shown in Figure 4. The blue area is the unreformed area of the reservoir, with a permeability of k3; the three small rectangular areas are the fracturing area, the yellow area on the left half is the reservoir damage area, and the green area on the right half is the undamaged area. The permeability is k1, k2, respectively. Where k1<k2, k3<k2.
Numerical Simulation Model of Shut-In Well
Based on the shut-in mechanism of shale reservoirs after fracturing, a numerical simulation model for shut-in wells for shale reservoirs with low permeability and low porosity characteristics is established using tNavigator software. The establishment of the numerical model for the shut-in of the single well after fracturing considered the three factors of spontaneous matrix imbibition, dynamic changes of fractures (expansion and closure), and reservoir matrix damage. The grid model of the numerical simulation model is shown in Figure 5. The basic parameters and relative permeability curves are shown in Figure 6.
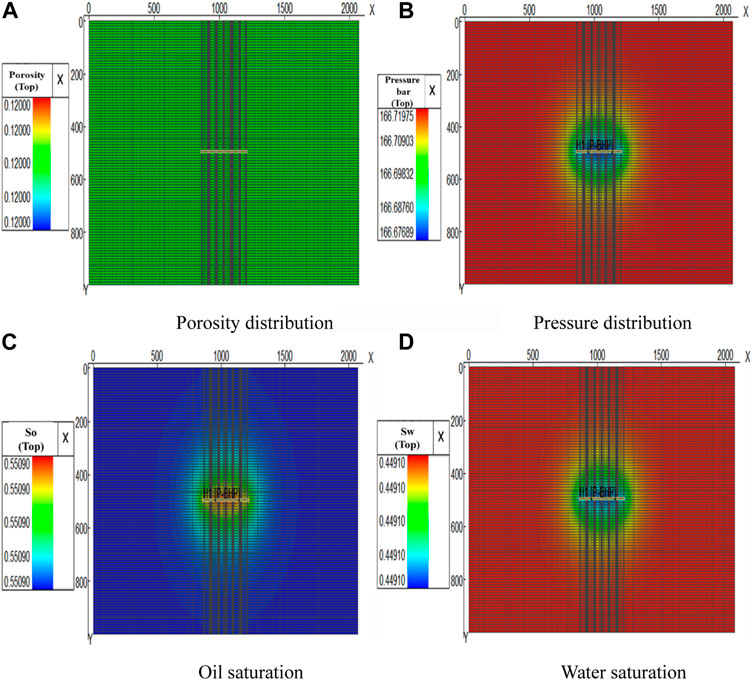
FIGURE 5. The grid model of the numerical simulation model. (A) Porosity distribution. (B) Pressure distribution. (C) Oil saturation. (D) Water saturation.
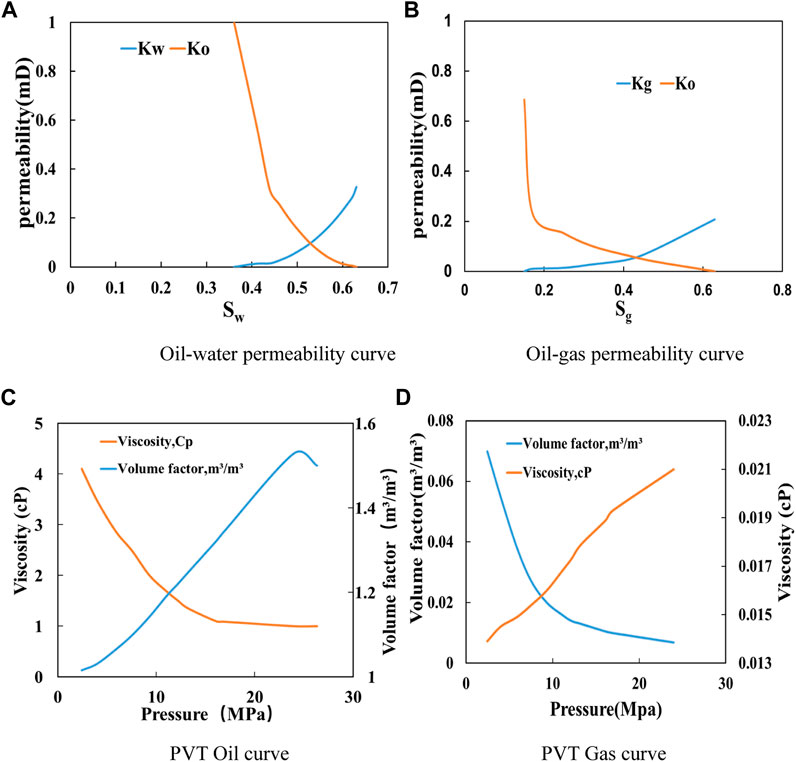
FIGURE 6. The basic parameters and relative permeability curves. (A) Oil-water permeability curve. (B) Oil-gas permeability curve. (C) PVT Oil curve. (D) PVT Gas curve.
For the imbibition effect, we use different capillary force curve in key word SWFN to model the imbibition strength, and represent the wettability between the fracturing, oil, and matrix essentially. And for the dynamic behavior of fracture (crack), we use the permeability-pressure table to update the fracture permeability in each simulation step for capturing fracture dynamic behavior. For the damage to the reservoir matrix, a lower permeability zone with different width surrounding fracture is assigned.
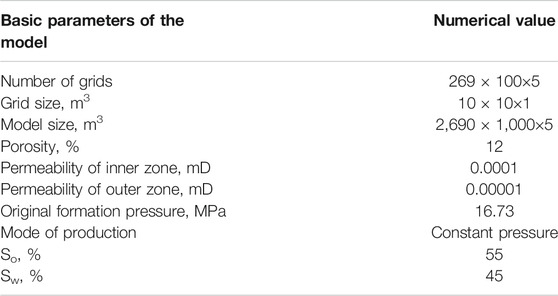
The basic parameters of the numerical simulation model are shown in Tables 1, 2.
Water and Oil Distribution in Shut-In Periods
Using the shut-in numerical simulation model established above, first analyze the oil-water and pressure distribution characteristics during the shut-in process. The selection of model parameters for shut-in of this single well after fracturing is shown in the table below.
The oil-water distribution characteristics of shut-in in shale reservoirs after fracturing are described by the distribution of oil saturation and near-fracture formation pressure distribution, and the oil-water distribution characteristics of shut-in in shale reservoirs after fracturing are analyzed through these two aspects.
1) Oil-water distribution: take the 30, 60, 90, 120 days fractures and the oil saturation distribution in the near-fracture area after the shut-in measures are taken. The schematic diagram is shown in Figure 7A.
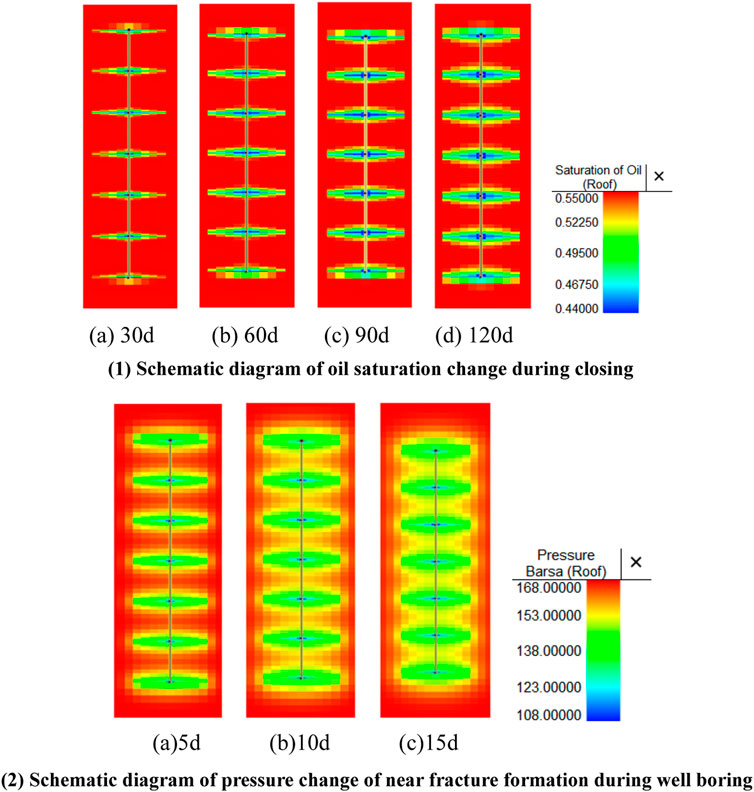
FIGURE 7. The schematic diagram. (A) Schematic diagram of oil saturation change during closing (i) 30d, (ii) 60d, (iii) 90d, (iv) 120d. (B) Schematic diagram of pressure change of near fracture formation during well boring (i) 5d, (ii) 10d, (iii) 15d.
From the schematic diagram of the distribution of oil saturation, there were obvious changes in the oil saturation in the fractures. By the time the well was shut in for 120 days, the average oil saturation in the fracture had increased to 0.43, but the change in oil saturation in the near-fracture area was not obvious.
2) Near-fracture formation pressure distribution: For the near-fracture formation pressure distribution, we take the pressure distribution in the near-fracture area for 5, 10, and 15 days of shut-in. The schematic diagram is shown in Figure 7B.
It can be seen from the figure above that the propagation speed of the pressure wave is far greater than the oil-water replacement rate. And on the 15th day of the shut-in measures, formation pressure increase effect in the near-fracture area is very obvious, and the range of pressure spread is also rapidly expanding. From the above figure, it can be found that after the shut-in measures are taken, the formation pressure has increased significantly, and the maximum value can reach 16.69 MPa. It can be clearly seen that the shut-in measures influence the formation pressure increase in shale oil reservoir production.
Effect of Key Parameters on Production Performance
Effect of Different Capillary
Take the capillary force as 1 MPa (low capillary force) and 5 MPa (high capillary force), and observe the distribution of oil saturation in the near fracture area after shut-in at low and high capillary forces for 30, 60, 90, and 120 days. The schematic diagram is shown in Figure 8.
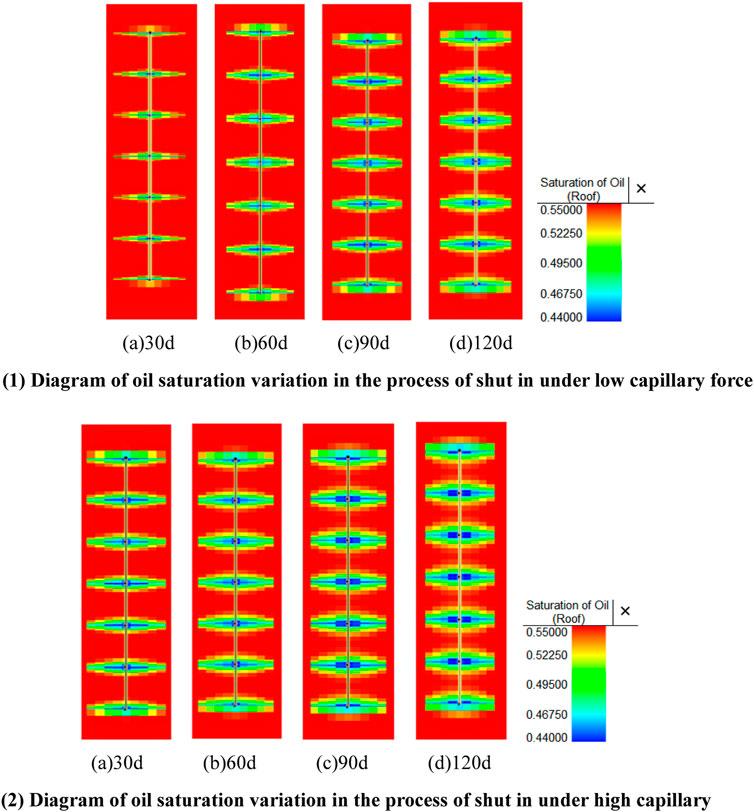
FIGURE 8. Diagram of oil saturation variation in the process of shut in under different capillary. (A) Diagram of oil saturation variation in the process of shut in under low capillary force (i) 30d, (ii) 60d, (iii) 90d, (iv) 120d. (B) Diagram of oil saturation variation in the process of shut in under high capillary (i) 30d, (ii) 60d, (iii) 90d, (iv) 120d.
It can be obtained from the figure that the capillary force has a very important influence on the imbibition of the matrix. In the above figure, it can be seen that the oil-water replacement effect of a 60-days shut-in under 5 MPa (high capillary force) is roughly the same as that of a 120-days shut-in under 1 MPa (low capillary force). It can be obtained that the higher the capillary force, the better the oil-water replacement effect.
Similarly, numerical simulation can be used to obtain the pressure distribution in the near fracture area after shut-in at low and high capillary force levels for 5, 10, and 15 days. The schematic diagram is shown in Figure 9.
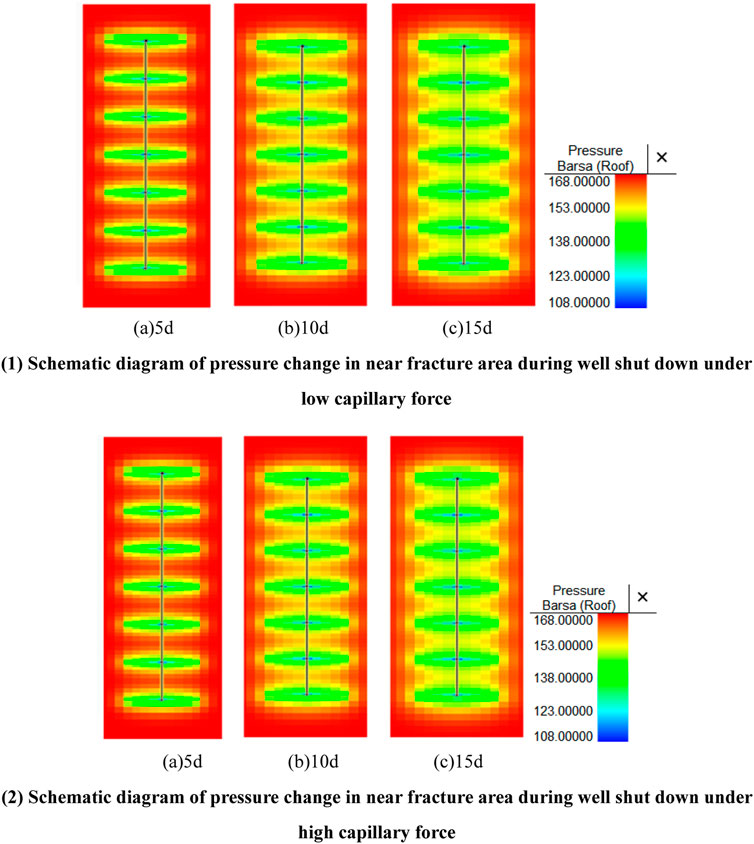
FIGURE 9. Schematic diagram of pressure change in near fracture area during well shut down under different capillary force. (A) Schematic diagram of pressure change in near fracture area during well shut down under low capillary force (i) 5d, (ii) 10d, (iii) 15d. (B) Schematic diagram of pressure change in near fracture area during well shut down under high capillary force (i) 5d, (ii) 10d, (iii) 15d.
It can be seen from the figure that under the capillary force level of 1 and 5 MPa, the pressure propagation range is roughly the same, and there is not much difference. The pressure in the near-slit area under the capillary force of 5 MPa is slightly higher than the pressure in the near-slit area under the capillary force of 1 MPa, but it is not very obvious.
It is also possible to obtain the change rule of daily liquid production under different capillary forces with the number of production days. As shown in Figure 10.
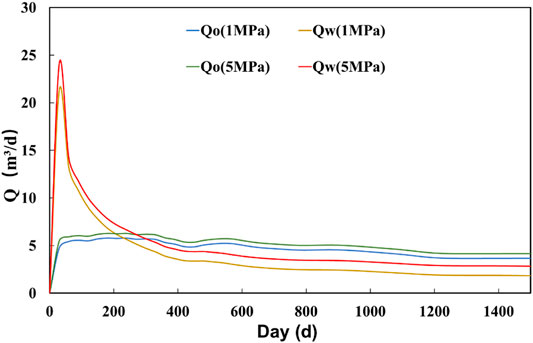
FIGURE 10. Variation rule of daily liquid production with days of development and production under1MPa capillary force and 5 MPa capillary force.
It can be seen from the figure that the change trend of daily liquid production under different capillary force levels with the number of production days is basically the same. That is, it increases first and then decreases, increases rapidly after shutting in, and then stabilizes. However, the peak value is different. The peak value of daily fluid production after shut-in under high capillary force is relatively larger. Therefore, the daily fluid output increases with the increase of capillary force.
The capillary force level has a great influence on the oil-water replacement effect during the development of shale reservoirs. The greater the capillary force, the more obvious the effect of oil-water replacement. In terms of daily fluid production, capillary force also has a positive effect on it. But for the pressure distribution, the pressure under different capillary forces tends to be basically the same, so the capillary force does not have much influence on the pressure distribution.
Effect of Different Stress-Sensitive of Fracture Permeability
Take the fracture stress sensitivity coefficients as 0.14, 0.098, and 0.056 respectively, and observe the distribution changes of oil saturation in the near fracture area after shut-in 30, 60, 90, and 120 days under different fracture stress sensitivity conditions. It can be seen that the distribution of oil saturation during shut-in of shale reservoirs is basically the same under the three fracture stress sensitive conditions. The oil saturation under 0.098 and 0.056 stress-sensitive conditions has a slight increase, only a 10−3 level increase, and the oil-water replacement effect is roughly the same. It shows that the crack stress sensitivity has little or no effect on the oil-water replacement effect.
The same numerical simulation method can also be used to obtain the pressure distribution in the near fracture area after shut-in for 5, 10, and 15 days under different fracture stress sensitivity. It can be seen from the figure that under different fracture stress-sensitive conditions, the pressure distribution in the near-fracture area during the shut-in process of a shale reservoir is basically the same, with almost no change. Therefore, it shows that the stress sensitivity of different fractures has no obvious influence on the pressure distribution in the near-fracture area during shut-in.
It can be seen that the stress sensitivity of different fractures has little effect on the oil saturation and pressure distribution in the near-fracture area during the shut-in process of shale oil reservoirs. For the daily fluid production, the smaller fracture stress sensitivity corresponds to a little more daily fluid production.
Effect of Formation Damage
By changing the thickness of the reservoir damage to 0.1, 0.2, 0.4 m, the influence of the reservoir damage on the oil saturation distribution in the near fracture area during the shut-in process is studied. Observe the distribution changes of oil saturation in the near fracture area after shut-in 30, 60, 90, and 120 days under the three thickness of the reservoir damage. It can be seen from the figure that the pressure distribution changes in the near fracture area under different reservoir thicknesses are basically the same. The larger the width, the higher the pressure, but it is also very small. Therefore, it is concluded that the influence of different reservoir damage thickness on the pressure increase effect in shale oil reservoir development is minimal.
Similarly, we can also obtain the change rule of daily fluid production with the number of production days under the condition of different reservoir damage thickness. It can be seen from the figure that the greater the thickness of the reservoir damage, the higher the peak of the daily fluid production will be correspondingly, but the increase is not very large.
It can be seen that in the development process of shale oil reservoirs, the influence of reservoir damage caused by different reservoir damage thickness on the oil-water replacement effect and pressure increase effect during the shut-in process is not very obvious. But in comparison, the smaller the thickness, the better the effect. The same is true for daily fluid production.
Conclusion
This paper first summarized the shut-in mechanism of shale oil reservoirs, including three aspects: shut-in imbibition, dynamic changes of fractures, and reservoir damage. And the mechanism was characterized. Finally, based on the reservoir numerical simulation method, the distribution of oil and water in shale reservoirs and the law of their influence on productivity are analyzed. The main conclusions drawn are as follows:
1) Most of the energy in the fracturing fluid in the reservoir is used for matrix imbibition, increasing the pressure of the formation. Under the action of the fracturing fluid, the natural fractures are expanded and the hydraulic fractures pass through the natural fractures to form a complex fracture grid, increasing the permeability of the reservoir. There is also reservoir damage caused by factors such as the incompatibility of foreign fluids, which leads to a decrease in reservoir permeability.
2) Considering the three aspects of matrix spontaneous imbibition, a numerical simulation model for shut-in of a single well after fracturing is established.
3) The higher the reservoir permeability and capillary force, the better the oil-water replacement effect during shut-in. Fracture stress sensitivity and reservoir damage have little impact on the oil-water replacement effect.
4) The greater the reservoir permeability, the greater the pressure range, and the better the effect of the increase. The influence of capillary force is second, and the influence of fracture stress sensitivity and reservoir damage on pressure increase is even smaller.
5) The higher the reservoir permeability and capillary force, the higher the peak daily fluid production. The smaller the fracture stress sensitivity, the higher the daily fluid production. The greater the thickness of the reservoir damage, the lower the daily fluid production.
In general, among the four influencing factors, reservoir permeability and capillary force have the most obvious effects, while fracture stress sensitivity and reservoir damage are less obvious than the former two.
Data Availability Statement
The original contributions presented in the study are included in the article/supplementary material. Further inquiries can be directed to the corresponding author.
Author Contributions
PJ: the idea; XK: the numerical simulation; YL: figures and tables; LC: revision; LN: the mechanism.
Conflict of Interest
The authors declare that the research was conducted in the absence of any commercial or financial relationships that could be construed as a potential conflict of interest.
Publisher’s Note
All claims expressed in this article are solely those of the authors and do not necessarily represent those of their affiliated organizations, or those of the publisher, the editors, and the reviewers. Any product that may be evaluated in this article, or claim that may be made by its manufacturer, is not guaranteed or endorsed by the publisher.
Acknowledgments
We acknowledge that this study was partially supported by the National Natural Science Foundation of China (No. 52004307), Beijing Municipal Natural Science Foundation (No. 3204053), and Science Foundation of China University of Petroleum, Beijing (No. 2462018YJRC015). We would further like to thank financial support of the National Natural Science Foundation of China (No. 51774297 and No. U1762210).
References
Bertoncello, A., Wallace, J., Blyton, C., Honarpour, M., and Kabir, C. S. S. (2014). Imbibition and Water Blockage in Unconventional Reservoirs: Well-Management Implications during Flowback and Early Production. SPE Res. Eval. Eng. 17, 497–506. doi:10.2118/167698-pa
Cai, J., and Yu, B. (2012). Research Progress of Spontaneous Imbibition in Porous media. progress mechanics[J] 42 (06), 735–754.
Fakcharoenphol, P., Kurtoglu, B., Kazemi, H., Charoenwongsa, S., and Wu, Y-S. (2014). “The Effect of Osmotic Pressure on Improve Oil Recovery from Fractured Shale Formations[C],” in SPE Unconventional Resources Conference.
He, Y., Qiao, Y., Qin, J., Tang, Y., Wang, Y., and Chai, Z. (2022). A Novel Method to Enhance Oil Recovery by Inter-fracture Injection and Production through the Same Multi-Fractured Horizontal Well. J. Energ. Resour. Technol. 144 (4), 043005. doi:10.1115/1.4051623
He, Y., Qin, J., Cheng, S., and Chen, J. (2020). Estimation of Fracture Production and Water Breakthrough Locations of Multi-Stage Fractured Horizontal wells Combining Pressure-Transient Analysis and Electrical Resistance Tomography. J. Pet. Sci. Eng. 194, 74–79. doi:10.1016/j.petrol.2020.107479
Jia, P., Zhuang, L., Cheng, L., and Hengfei, Y. Study on Stress Sensitivity Characteristics and Quantitative Characterization of highland Saturated Differential Pressure Reservoirs, Special Oil and Gas Reservoirs.
Jia, P., Ma, M., Cao, C., Chengab, L., Yine, H., and Lid, Z. Capturing Dynamic Behavior of Propped and Unpropped Fractures during Flowback and Early-Time Production of Shale Gas wells Using a Novel Flow-Geomechanics Coupled Model. J. Pet. Sci. Eng. 208, 2021. doi:10.1016/j.petrol.2021.109412
Jia, P., Wu, D., Yin, H., Li, Z., Cheng, L., and Ke, X. (2021). A Practical Solution Model for Transient Pressure Behavior of Multistage Fractured Horizontal Wells with Finite Conductivity in Tight Oil Reservoirs. Geofluids 2021, 9948505. doi:10.1155/2021/9948505
Le, D. H., Hoang, H. N., and Mahadevan, J. (2009). “Impact of Capillary Suction on Fracture Face Skin Evolution in Waterblocked Wells[C],” in SPE Hydraulic Fracturing Technology Conference.
Li, S., Ding, Y., and Yang, Y. (2017). Simulation Study on Forced Imbibition of Tight Rock Samples and Multi-Scale Modeling. J. Oil Gas Technology[J] 39 (2), 66. doi:10.12677/jogt.2017.392019
Liu, D. (2017). Fracturing Fluid Microscopic Imbibition and "stuffy Well" Stimulation mechanism[D]. Beijing: China University of Petroleum.
Odumabo, S. M., Karpyn, Z. T., and Ayala H., L. F. (2014). Investigation of Gas Flow Hindrance Due to Fracturing Fluid Leakoff in Low Permeability Sandstones. J. Nat. Gas Sci. Eng. 17, 1–12. doi:10.1016/j.jngse.2013.12.002
Wang, M., and Leung, J. Y. (2016). Numerical Investigation of Coupling Multiphase Flow and Geomechanical Effects on Water Loss during Hydraulic-Fracturing Flowback Operation. SPE Res. Eval. Eng. 19, 520–537. doi:10.2118/178618-pa
Wang, Q., Guo, B., and Gao, D. (2012). “Is Formation Damage an Issue in Shale Gas Development? [C],” in SPE International Symposium and Exhibition on Formation Damage Control.
Wang, Y. (2018). Research on the Fracture Closure Mechanism of Tight sandstone reservoirs[D]. Beijing: China University of Petroleum.
Wust, R. A., Mattucci, M., Hawkes, R., Quintero, H., and Sebastian, S. (2018). “Early Insights from Various Load Fluid Recoveries after Hydraulic Fracturing Treatments: A Case History of a Developing Unconventional Oil Shale Play in Alberta,” in Paper presented at the SPE International Hydraulic Fracturing Technology Conference and Exhibition, Muscat, Oman, October 2018. doi:10.2118/191421-18ihft-ms
Yaich, E., Williams, S., Bowser, A., Goddard, P., SouzaDiaz, O. C. de., and Foster, R. A. (2015). “A Case Study: The Impact of Soaking on Well Performance in the Marcellus,” in Paper presented at the SPE/AAPG/SEG Unconventional Resources Technology Conference, San Antonio, Texas, USA, July 2015. doi:10.15530/urtec-2015-2154766
Keywords: numerical simulation, shut-in, spontaneous imbibition, oil-water replacement, shale oil reservoirs
Citation: Jia P, Ke X, Niu L, Li Y and Cheng L (2022) Investigation of Shut-In Effect on Production Performance in Shale Oil Reservoirs With Key Mechanisms. Front. Earth Sci. 9:782279. doi: 10.3389/feart.2021.782279
Received: 24 September 2021; Accepted: 22 November 2021;
Published: 16 February 2022.
Edited by:
Feng Yang, China University of Geosciences, ChinaReviewed by:
Youwei He, Southwest Petroleum University, ChinaSuran Wang, CNOOC Research Institute Co. Ltd., China
Copyright © 2022 Jia, Ke, Niu, Li and Cheng. This is an open-access article distributed under the terms of the Creative Commons Attribution License (CC BY). The use, distribution or reproduction in other forums is permitted, provided the original author(s) and the copyright owner(s) are credited and that the original publication in this journal is cited, in accordance with accepted academic practice. No use, distribution or reproduction is permitted which does not comply with these terms.
*Correspondence: Xianzhe Ke, MjAyMDIxMDMyOUBzdHVkZW50LmN1cC5lZHUuY24=
 Pin Jia
 Xianzhe Ke
 Langyu Niu1,2