 Shaojun Lai
 Ying Li1*
95% of researchers rate our articles as excellent or good
Learn more about the work of our research integrity team to safeguard the quality of each article we publish.
Find out more
ORIGINAL RESEARCH article
Front. Earth Sci. , 03 December 2021
Sec. Atmospheric Science
Volume 9 - 2021 | https://doi.org/10.3389/feart.2021.782195
This article is part of the Research Topic Landfalling Tropical Cyclones: Physical Processes, Forecasting and Impacts View all 26 articles
Based on the typhoon best tracks of the China Meteorological Administration (CMA), ERA5 reanalysis data of ECMWF at 0.25 degrees horizontal resolution, and NOAA optimal interpolated sea surface temperature (OISST V2) data, the dynamical compositing analysis is used to study the north turning at nearly 90 degrees of 4 westward typhoons over the South China Sea (SCS). The composite analysis results show that: (1) As the typhoon goes westward into the SCS, the upper-level westerly trough moves eastward to the vicinity of 110°E in the mainland of China, and the western North Pacific subtropical high (SH) retreats eastward at the same time, which weakens the steering flow of typhoon and slowes down its movement. (2) The cold air guided by the westerly trough invades southwardly into the western part of SCS from the mainland leading to a descending and divergent airflow in the lower-to-middle atmospheric layers and enhancing the eastward pressure gradient force (PGF) in the west quadrant of the typhoon, which blocks and repesl the typhoon from moving any further westward. (3) Due to the cold air intrusion, the vertical atmospheric stratification in the west quadrant of the typhoon becomes static and stable, which may suppress the convection, impeding a typhoon’s westward motion. (4) With the cold air involving to the south of the typhoon, the direction of the PGF on the typhoon switches from eastward to northward, and the SH falling southward enhances the southwesterly airflow on the south of the typhoon at the same time. The remarkable increase of the northward steering airflows of the typhoon results in an abrupt northward turn. (5) In addition, the sea surface temperature (SST) and the ocean heat content (OHC) on the western part of the SCS is also reduced, attributed to the cold air cooling, and the typhoon is likely to avoid the cold ocean and approach a relatively warmer region. This study suggests that cold avoidance during the westward movement of typhoons is worthy of consideration in the operational forecast of typhoon tracks.
A tropical cyclone (TC) is a kind of severe weather system which can cause tremendous loss of human life and social property through excessive torrential rainfall, flash floods, and strong winds, etc. The western North Pacific (WNP) basin experiences on average 26 TCs each year, accounting for about 33% of the global total, and is the most active region of TCs on the Earth (Yumoto and Matsuura, 2001; Wu and Wang, 2004) What is more, 13% of TCs are generated in the South China Sea (SCS) (Wang and Fei, 1987). TCs can bring enormous disasters to the pacific islands and coastal regions, and an average of 472 people were killed each year by TCs making landfall during the period 1983–2006, with the greatest casualties occurring in coastal cities in Zhejiang, Fujian, and Guangdong Provinces (Zhang et al., 2009). In general, a TC generating in the WNP takes one of the three typical tracks: westward, northwestward, and northeastward recurving (Wu and Wang, 2004; Wu et al., 2005a) and may affect the SCS region (including the Philippines), the coastal region of China (including the island of Taiwan), and the region of Japan (Wu and Wang, 2004) accordingly. It is very important to make accurate forecasts of TC motion to prevent and defend against TC disasters.
In the past few decades, dramatic improvements have been made in the forecasting performance of TC tracks, which could be attributed to two major developments (Elsberry, 2007). One is the forecasting performance of numerical weather prediction (NWP) models by the rapid advances in computing power, higher weather prediction models resolutions, and data assimilation, and rapid growth in available remote sensing observations (Rappaport et al., 2009; Aberson, 2010). The other is the operational application of the multi-model consensus technique (Goerss, 2000; Goerss et al., 2004; Elsberry, 2014), which helps to improve short-range track forecasts greatly (Gall et al., 2013). As a result, it is possible to provide 3-days, 5-days, or even longer track forecast products for many operational centers. However, it is still difficult to make accurate forecasting on unusual TC tracks (UNTK) in terms of both numerical prediction and subjective forecast. Zhang et al. (2018) identified 1,059 typhoons over the WNP in the past 65 years and found that the UNTK events could be categorized into seven types, in which the sharply north turning typhoons accounted for more than 20%, and all of the UNTK events tended to take place in the areas to the south of 30°N with the most frequency in the SCS and the east of the Philippines. Based on operational track forecasts from the NMC/CMA for seven sudden north-turning cases during 2005–2010, the average 24- and 48-h forecast errors in distance increased by 29.3 and 68.3%, respectively, compared to the average errors for all TCs (Wu et al., 2013).
It is well known that TCs exhibited a wide variety of motions influenced by environmental large-scale systems as steering flow (Chen and Ding, 1979; Neumann, 1992), beta effect (e.g., Chan and Williams, 1987; Wang and Holland, 1996), the spatial distribution of SST (Chan, 1995), diabatic heating (Wu and Wang, 2001), asymmetric structure (Liang and Wu, 2015), orographic effects (Brand and Blelloch, 1974; Wang, 1980; Yeh and Elsberry, 1993a; Yeh and Elsberry, 1993b; Xu et al., 2013), and so on. Based on the statistics presented by Elsberry (1995), the TCs motion is mainly controlled by the environmental steering flow (Chan and Gray, 1980; Holland, 1983; Carr and Elsberry, 1990; Harr and Elsberry, 1995; Berger et al., 2011; Choi et al., 2013; Wu et al., 2013), composed of the subtropical ridges, midlatitude troughs, and cyclonic circulations. The TCs may be slow, stagnated, or recurved because of the change of the steering flow related to the large-scale systems surrounding them, such as relatively weaker SH, the stronger westerlies and continent high over China, or the presence of a deep midlatitude baroclinic wave/trough during the season of late summer (Wu et al., 2004).
In terms of the research of abruptly northward turning tracks, consensus analysis indicates the approach of a deep westerly trough and the eastward retreat of the SH are found to be favorable to a northward shift (Shi et al., 2014). Holland and Wang (1995) found that typhoons tended to recurve into the midlatitudes when a synoptic-scale trough moved away from East Asia into the subtropical ocean. Relevant research shows that the northward track deflection is attributed to the combined effects of the mid- and low-latitude systems (Kieu et al., 2012; Qian et al., 2013; Shi et al., 2014). Li et al. (2012) found that a sharp northward turning of Typhoon (Meranti, 2010) was associated with a northwestward-moving cold vortex on the northern side of the storm. Carr and Elsberry (1995) conducted a pioneering study on the sudden TC track change embedded in monsoon gyres (MGs) over the WNP. In fact, nearly 70% of TCs over the WNP are associated with a monsoon gyre (MG, Chen et al., 2004). Monsoonal influences on TC westward or sharp northward turnings over the SCS and the WNP have been examined in various time scales of the Madden–Julian oscillation (MJO), quasi-biweekly oscillation (QBW), and synoptic-scale flow (Wu et al., 2011; Wu et al., 2013; Liang and Wu, 2015). Typhoon Megi (2010) is a typical north-turning example, Bi et al. (2015) found that the low-frequency (10–60 days) MG interacted with Megi and affected its track change. Peng et al. (2014) revealed the cold-air intrusion from the northwest played a key role in the big turn of Megi through its adjustment to the large-scale circulation. In the lower layers, the northerly inflow of cold air tends to destroy the axisymmetric thermal structure of the TC, which may reduce the moving speed of the TC (Chou et al., 2008). Chen et al. (1997) revealed that the asymmetry of the thermal structure and the strength of the thermal instability layer of the TCs could lead to the significant anomaly of the TC track.
Underlying conditions also are important factors impacting the abnormal motions of TCs. Topographic effects can influence low-level flows and induce significant asymmetric diabatic heating resulting in TC track changes (Fiorino and Elsberry, 1989; Yeh and Elsberry, 1993a; Yeh and Elsberry, 1993b; Elsberry, 1995; Wang et al., 2012). TCs tend to move into a region with a higher SST value and a favorable condition for TC deflection could be established when the SST gradient is perpendicular to the mean flow (Chang and Madala, 1980). The positive SST anomalies (SSTA) over the equatorial western and central Pacific appear to be a major factor contributing to a northward-shifted typhoon track (Tu et al., 2009). Yun et al. (2012) studied a northeastward-moving TC demonstrating that the TC motion was sensitive to the SST magnitude and gradient. Xu et al. (2013) conducted a 60-years (1950–2009) survey on TCs that made landfall on China’s mainland and performed a set of numerical experiments. They proposed that the warmer land surface, with intense moisture supply from the summer Asian monsoon, was conducive to deep convection that attracts supertyphoons. The straight-moving (i.e., northward moving) TC will deflect toward the region of warmer SST when SST is zonally asymmetric (Choi et al., 2013). The slowdown of motion and the asymmetric latent heating are the main reasons why the typhoon Morakot (2009) caused extreme rainfall in Taiwan (Liang et al., 2011; Wu et al., 2011; Wang et al., 2012).
Although a great deal of work has been carried out on TC motion anomalies from different aspects, there is still a larger error in the prediction of abruptly turning TC tracks due to the lack of mechanism recognition. In particular, over the SCS, a high-frequency area of TC sharp turning is renowned for complicated interactions between TCs and mid-latitude systems (Shi et al., 2014). More importantly, there is only a limited time to make a prediction on TC motion change and landfalling site for the TCs over the SCS because of a short distance to the coasts (Ling et al., 2016). Therefore, it is a challenge to make accurate forecasting on abnormal changes in motion of TCs over the SCS. This study aims to gain a better understanding of the relationship between TC north turning and cold air intrusion in order to promote TC track forecasting technique over the SCS. The description of the data and methods are given in “Data and Methods” section. Section three presents the evolution of the synoptical circulation background for the north turning briefly. Section four demonstrates the cold avoidance characteristics during the north turning of TCs, followed by a summary and discussion in section five.
The TCs track data downloaded from (http://tcdata.typhoon.org.cn/en/index.html) the Shanghai Typhoon Institute of the China Meteorological Administration (CMA-STI; Ying et al., 2014) are in 6-h intervals with position, minimum sea level pressure, and maximum wind speed near the TC center. ERA5 is the fifth generation of the European Centre for Medium-Range Weather Forecasts (ECMWF) atmospheric analysis of the global climate (Hennermann and Berrisford, 2018). ERA5 datasets employed in this paper include 37 pressure levels and surface hourly grid data with a spatial resolution of 0.25° longitude × 0.25° latitude from 1979 to the present. The data can be accessed easily from the Climate Data Store (CDS) cloud server (Hersbach et al., 2019). The OISSTV2 data (Banzon et al., 2021) from the National Oceanic and Atmospheric Administration (NOAA) is utilized, which is a series of global and spatially gridded products created by interpolating and extrapolating data, including the weekly SST on a 1° grid and daily on a 0.25° grid. In addition, the ocean heat content (OHC) data from the National Centers for Environmental Prediction (NCEP) Climate Forecast System Reanalysis (CFSR) data (Saha et al., 2010) with the grid spacing of 0.5° latitude × 0.5° longitude at 6-h intervals are used to investigate the ocean characteristic affected by the cold air.
So far, there is not a uniform standard definition for sudden TC track changes. Chan et al. (1980) defined the left- and right-turning tracks by a minimum direction change of 20° within 12 h. Wu et al. (2011) indicated the sharp track direction change exceeded 60° over a 24-h period, and the standard derivation of direction changes were about 28.5° and 24.2° for 12- and 6-h periods, respectively. Wu et al. (2013) defined a track direction change exceeding 40° (37°) during the 12-h (6 h) period as a sudden northward-turning track change. In this study, in order to highlight the northward movement trend of the TC, the threshold of TC track sharping north changing directions is 45° and 40° for 12-h and 6-h, respectively.
A survey of historical TC tracks over the WNP in the past 30 years indicates that there are about 10 west-moving TCs which experienced sudden northward turning after moving into the SCS, among which 6 cases are accompanied by the low-level cold air intruding southward to the SCS. Excluding the possiblity of orographic influence during the north turning, the four typhoons, Dan (1999), Xangsane (2000), Chanchu (2006), and Megi (2010), were chosen as the samples for this study (Figure 1A). All the selected cases reached typhoon intensity (32.7 m s−1), especially, the maximum sustained wind speed of Megi exceeded 51 m s−1 (reaching Super TY category). The four typhoons all originated in the seasonal transition period when the cold air was active with three in October and one in May. (Table 1).
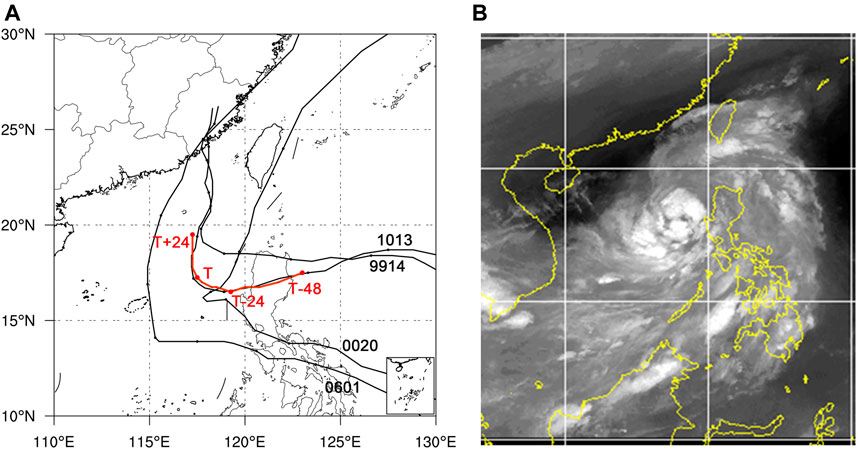
FIGURE 1. (A) The four north turning typhoon cases in the study (black) and their composited track (red) (Numbers are the typhoon number of the TC; T means turning time, negative/positive means pre-recurving/post-recurving time.) and (B) The CIMMS water vapor satellite image of typhoon Xangsane (2000) at 12:00 Oct. 29, 2000.

TABLE 1. The information of four typhoon cases over the south China sea.
Figure 1B shows the satellite water vapor (WV) image of typhoon Xangsane (2000) at 12:00 October 29, 2000, obtained from the Cooperative Institute for Meteorological Satellite Studies (CIMSS) at the University of Wisconsin-Madison (available online at http://tropic.ssec.wisc.edu/archive/). The bright and white cloud of the typhoon is located in the SCS, while a large dark area appears in the southeast coastal region to the northwest side of the typhoon. The dark area stretches southward and meets with the typhoon cloud, which means that the dry and cold air sinks southward and affects the periphery of the typhoon. The WV imageries of other selected cases also have a similar dark area in coordination with the cold air.
In order to analyze the comprehensive effects of cold air on the north turnings of four typhoons and keep a relatively intact typhoon circulation, the dynamic composite technique (Li et al., 2004) is used in the study. In this method, the composite region moves with the TC, and the center of the region is located at the TC center. At any given time, the value of a composite variable at a particular grid is calculated in the composite region. This procedure can be carried out for a set of times, from which each composite variable with time series can be obtained easily (Dong et al., 2010). In this study, it takes the turning position (time) as turning time (T) with 48 timesteps backward (T-48) and 24 timesteps forward (T+24), and slices the 15 longitudes and latitudes around the TC center in space cube respectively. The analysis and discussions in this paper are based on these composed data of four typhoon samples. The tracks of four typhoons (black lines) and their composited track (red line) are shown in Figure 1. In the figure, T means the turning time (T), negative values indicate pre-recurving, and a positive value means post-recurving. From the composed track, the turning begins at T-18 and basically completes at T time (Figure 1A).
The prevailing TC tracks are intimately linked to the large-scale circulation patterns (Wu and Wang, 2004). TC track with a sudden turning usually is related to the common effect of multiple synoptic systems. Before the turning (T-24), the composed TC moves westward with a relatively higher speed across Luzon Island, Philippines, and then into the SCS steadily, after generating to the east of the islands of the Philippines. During the turning (from T-24 to T), there was a major adjustment in the synoptic circulation. The SAH 200-hPa begins to weaken and splits into western and eastern parts over the Indo-China Peninsula and the western North Pacific, respectively (Figures 2A–C). The SH retreats eastward to the east of Taiwan island and a westerly trough moves eastward to about 105°E in the mid-latitude (Figures 2D–F). In this connection, the cold air with lower equivalent potential temperature (θe < 324 K; hereafter LEPT) is entangled into the western circulation of the typhoon at 500-hPa. At the same time, the LEPT invades southward from the mainland of China to the west side of the SCS in the lower layer at 850-hPa (Figures 2G–I). At T-24 time, the southwest jet stream to the southeast of the TC has not yet been established (Figure 2G). The TC slows down and shows a tendency of northward turning gradually. At T time, as the westerly trough moving at about 110°E and the cold air is involved southwardly into the TC circulation, the SH falls southward to the southeast part of the TC (Figure 2E) with strengthened southwest airflow on the southeast side of the TC (Figures 2E,H), the track of the TC bends significantly and accelerates northward (Figure 2H). Then (T+24), the TC almost completes the north turn and keeps moving northward (Figure 2I).
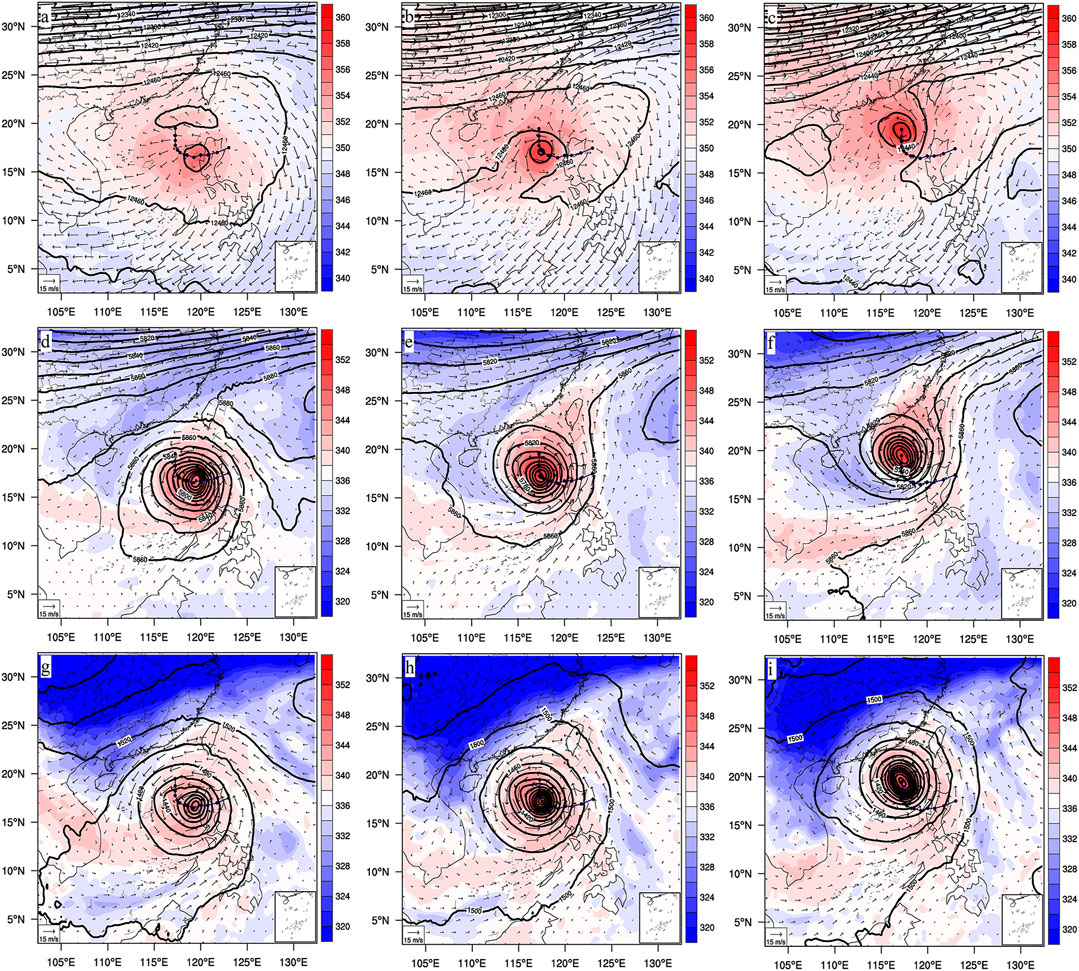
FIGURE 2. The composited circulation evolution at height of 200 (A, B, and C), 500 (D, E, F), and 850-hPa (G, H, I) (Figs. A, D, and G are at T-24, figs. B, E, and H are at T, figs. C, F and I are at T+24; lines are geopotential height, Unit: gpm; vectors are winds, Unit: m s−1; the shaded areas are equivalent potential temperature (EPT), Unit: K).
It is evident that the synoptic patterns become complex during the TC deflection, including the weakening SAH, the passing midlatitude westerly trough with down south cold air, the retreating SH, and enhanced southwesterly flow in the southeast of TC, et al., thus resulting in a sudden changing of TC motion.
George and Gray (1976) suggested that TC track was primarily a function of the steering flow and the advection of planetary vorticity by the TC circulation. The TC is primarily advected by the mean large-scale circulation patterns with a steering level ranging from 500 to 700-hPa (Holland, 1983). More studies have suggested that the deep-layer mean wind is the best discriminator for the motion of well-developed TCs (e.g., Sanders et al., 1980; Dong and Neumann, 1986; Velden and Leslie, 1991), however, individual cases can exhibit large variability in the steering flow depth (e.g., George and Gray, 1976; Dong and Neumann, 1986; Velden and Leslie, 1991; Aberson and DeMaria, 1994).
As suggested by Wu et al. (2011), the steering flow profiles are calculated as the mass-weighted mean wind averaged across the TC center, and the horizontal steering flows are averaged between 850- and 300-hPa within a domain with a radius of 400 km from the TC center in this study. Figure 3A shows the steering flow vertical profiles variation with time. Starting from T-48, the directions of steering flow shift from westward to northwestward, especially in layers below 500-hPa, and the magnitude decreases gradually reaching the minimum (about 2 m s−1) of northerly at T-18 related to the SH retreating eastward. After then, the northeastward steering flows of TC increased significantly near 500-hPa reaching 5–6 m s−1 and the TC motion shifts northward. These variations agree with the results of Carr and Elsberry (1995) and Wu et al. (2011).
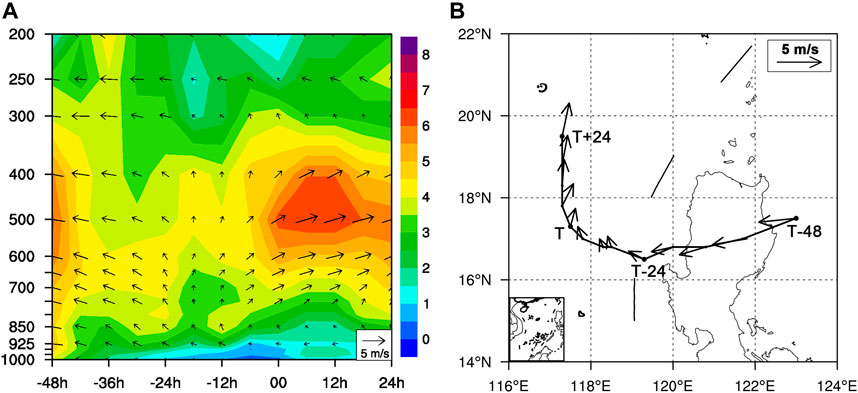
FIGURE 3. (A) The time series of the vertical distribution of the mass-weighted mean steering flow (averaged in a region of a radius of 400 km from the TC center) (Vectors are wind speed and direction, shaded means magnitude of wind speed, Unit: m s−1.) and (B) the averaged steering flow vectors between 850 hPa and 300 hPa.
Horizontally (Figure 3B), prior to the sudden track change, the TC keeps moving westward by the strong westward steering flows. However, the average speed of TC movement slows from about 6 m s−1 (before T-24) down to about 2 m s−1 (around T-12) gradually after moving across the Philippine Islands. Especially, from T-24, the westward component of the steering flow keeps decreasing, the TC motion speed slows down to about 1 m s−1 and shows a trend of turning. While the northward component of the TC motion increases with the influence of the strengthening of southwest airflow. At T time, the steering flow shifts to the northward and keeps growing, and the northward turning of the TC almost fulfills. Then, the speed of the TC movement rapidly increases and moves northward continuously.
The TC motion is dominantly guided by the steering flow, however, when the synoptic-scale steering flow is weak, the β-effect propagation will contribute significantly to the TC motion (Fiorino and Elsberry, 1989). The difference of gyres between lower and upper layers may lead to the asymmetric structure or circulation of TC, and hence it, in turn, affects the TC motion. The asymmetric divergent flow associated with convective asymmetries within the vortex core region deflects the vortex center toward the region with maximum convection and results in meandering vortex tracks (Wang and Holland, 1996). The TC motion is also directly influenced by the asymmetric component of diabatic heating (Wu and Wang, 2001). Chen et al. (1997) revealed that the asymmetry of the thermal structure and the strength of the thermal instability layer of the TCs could lead to the significant anomaly of the TC track (e.g. Holland, 1983; Chan and Williams, 1987).
The temporal-longitude variation of the EPT averaged on 15.5–17.5°N across the TC center at the height of 925-hPa is shown in Figure 4. It is obvious that there is a region higher than 344 K near 105°E before the cold air invades southward (T-24). From T-24, there exists a region with the values of EPT lower than 340 K on western of 115°E when the cold air coming from the Chinese mainland invades southward. Starting from this time, the values of LEPT on TC western side get much lower than those on the eastern side, with the center of LEPT around 105°E. There forms a region with a larger gradient of LEPT locatied around 115°E which indicates the cold air intrusion resulting in an asymmetric thermal structure of the TC. As the cold air continuously invades southward into the west of the SCS, the values of LEPT on the west of the TC continue to get lower and the thermal structure of TC becomes more asymmetric (at T time). The motion of TC shows the characteristics of deceleration to the west and acceleration to the north denoting the cold avoidance in TC motion.
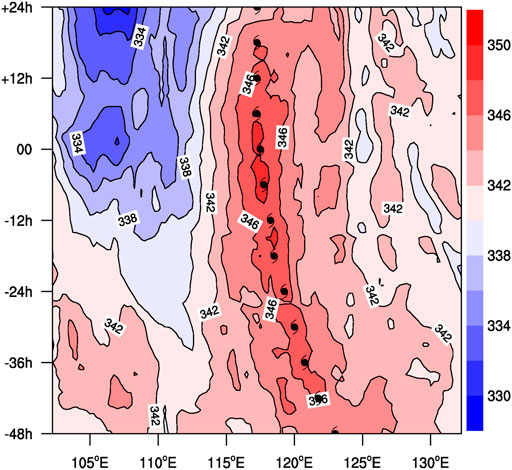
FIGURE 4. The temporal-longitude variation of EPT at 925-hPa averaged on 15.5–17.5°N across the TC centers (Contours with shaded are the EPT, Unit: K) (Symbols indicate the longitude position of typhoon centers).
The vertical distribution of the temperature anomaly can be found in Figure 5. In the figure, there is a positive temperature anomaly center above 500-hPa embodying the basic warm-core characteristic of the TC vertical profile. What is more important is there exists a negative temperature anomaly region below 700-hPa on the west side of the TC starting from T-24 for the cold air invading. As the cold air invades into the west of the TC circulation further, the intensity of negative temperature anomaly keeps increasing gradually (Figures 5A,B) and extends to the edge of TC center, particularly at T time (Figure 5C). On the contrary, there is a small range of weak positive temperature anomalies occurring on the east of the TC center in the lower layer. It represents clearly the vertical thermal structure asymmetric of the TC caused by the cold air from the China mainland.
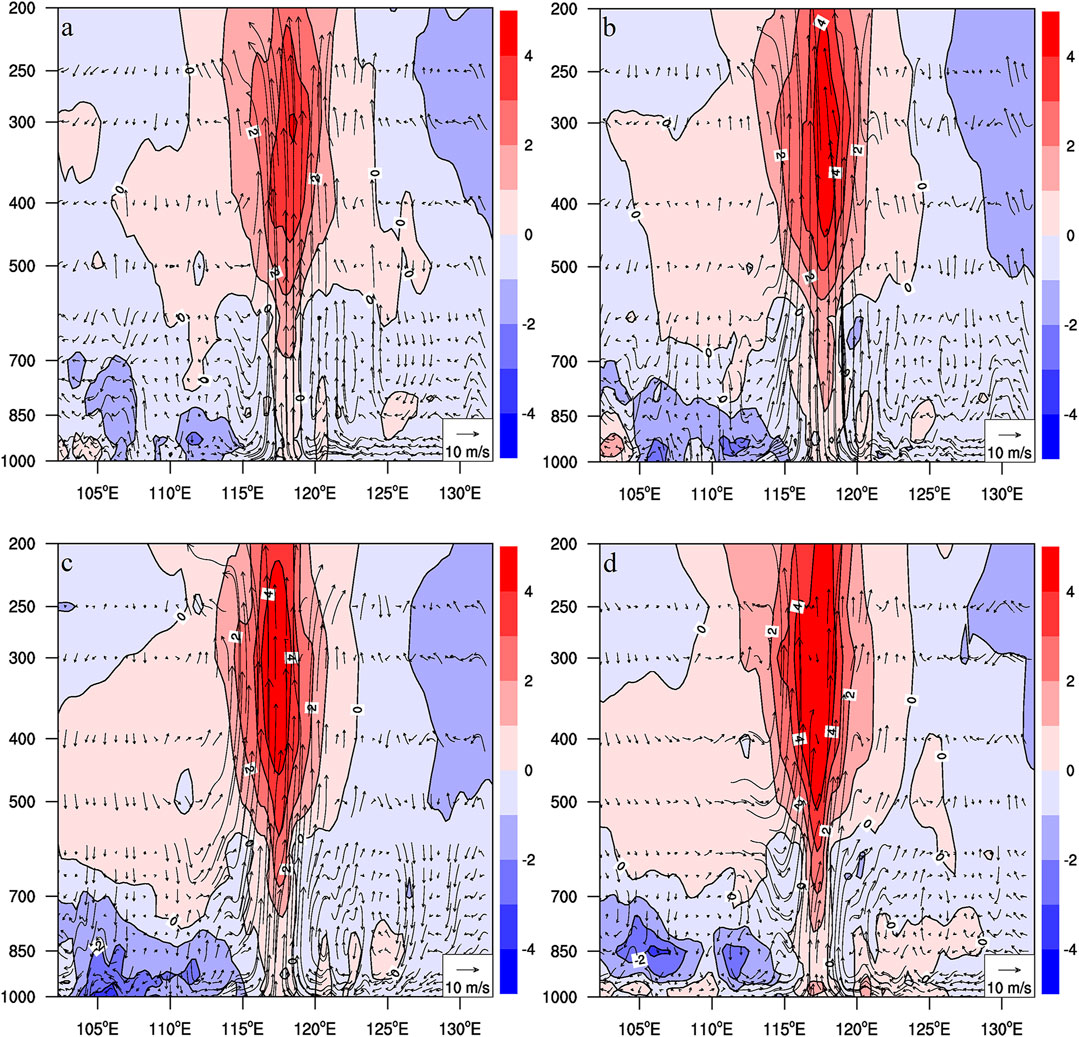
FIGURE 5. The vertical profile of the temperature abnomaly (Contours with shaded) and vertical wind vectors (made by u and w*10) at different stages. (A) T-12, (B) T-6, (C) T, (D) T+6.
Combined with Figure 4, it can be found that the increasing of negative temperature anomaly induced by the cold air with LEPT intrusion, is opposite to the direction of the TC movement, like a barrier blocking and preventing the TC from moving further westward.
The asymmetric structure forced by dynamics related to the interaction between the TC circulation and the cold air advection on the west side of the TC can also be found in Figure 5. The intrusion of LEPT air (Figure 2) indicated by the relative dark region a few degrees west (Figure 1B) below 500-hPa may cause the isentropic descent of the drier, colder air (Ritchie and Elsberry, 2001). The negative temperature anomaly generates a direct thermal circulation with downdraft near 117°E below 500-hPa (Figure 5A), which is consistent with the results of Harr and Elsberry (2000). As the negative temperature anomaly increases, the downdrafts from levels of 500-hPa to the sea surface are also enhanced obviously (Figures 5B,C), which causes divergent flows enhancing inflows toward the TC center in lower layers over 110–115°E.
Figure 6 presents the time variation of averaged divergence between 850 and 975-hPa and meridional wind between 925 and 975-hPa. Before the TC turning (at about T-36), the negative meridional wind center over -12 m s−1 is located on the east of the TC center, and there exists the convergence center with a value less than -5 × 10⁻⁵ s−1 located near the negative meridional wind center. The meridional winds on the west of TC are also negative. The TC keeps moving westward. As the cold air continues to invade into the west and south sides of the TC from T-36 to T, the divergence motion on 110°E is strengthened gradually both in values and scope extending to the TC center, while the convergence near the TC center is suppressed and weakened. In addition, the cold air sinking and diverging on the west of the TC can increase the low layer positive meridional winds pointing to the TC center, while weakening negative meridional winds on the east of the TC center. The westward motion of the TC is impeded showing a tendency of recurving in its track. After T time, the divergence on the west of the TC enhances greatly, and extends into the vicinity of the TC center with the center value over 4 × 10⁻⁵ s−1, even stronger than the convergence center near the TC center on the eastern side. The meridional winds are positive at the TC center and its west quadrant. It can be inferred that the divergence formed by the cold air sinking on the west side of the TC may block the TC from moving westward further.
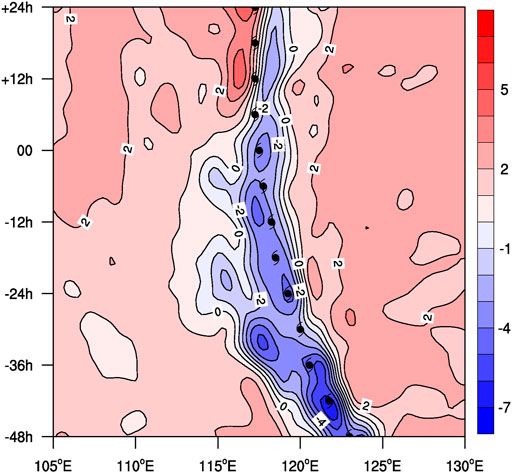
FIGURE 6. The latitudinal time variation of divergence averaged between 850 and 975-hPa and meridional winds averaged between 925 and 975-hPa across the TC center. (Contour indicates meridional wind speeds, Unit: m s−1, shaded area denotes divergence, Unit: 10−5 s−1, and symbol markers indicate the typhoon center position).
In circumstances with weak steering airflow, the PGF may highlight its influence on TC movement (Chen et al., 1997). The flow associated with large northward pressure gradients could push the TC northward (Chen et al., 2021). At T-18 (Figure 7A), due to the invasion of cold air on the west quadrant of TC, TC enters into an environment with weak guiding airflow. The direction of the resultant PGF on TC shifts eastward, and its magnitude also decreases to about 1 Pa m−1. From this moment, the TC begins to slow down (Figure 7A). Starting from T-12 to T-6 (Figure 7B), as the cold air keeps entangling southward into the southwest part of TC, the larger PGF occurs on the west and then the south sides of TC, which makes the resultant of PGF on TC decrease further to about 0.3 Pa m−1 and point to the north. The TC westward movement is suppressed with the northward motion promoted gradually, and the TC appears to deflect to the north obviously. The PGF continues to increase to 1 Pa m−1 and about 10 Pa m−1 at T (Figure 7C) and T+12 (Figure 7D) respectively, benefiting the TC moving northward obviously and accelerating gradually. Due to the strengthening of cold air intrusion from the mainland, the direction of the resultant PGF on TC is opposite to its movement direction, which prevents the TC from moving westward and is favorable to turning.
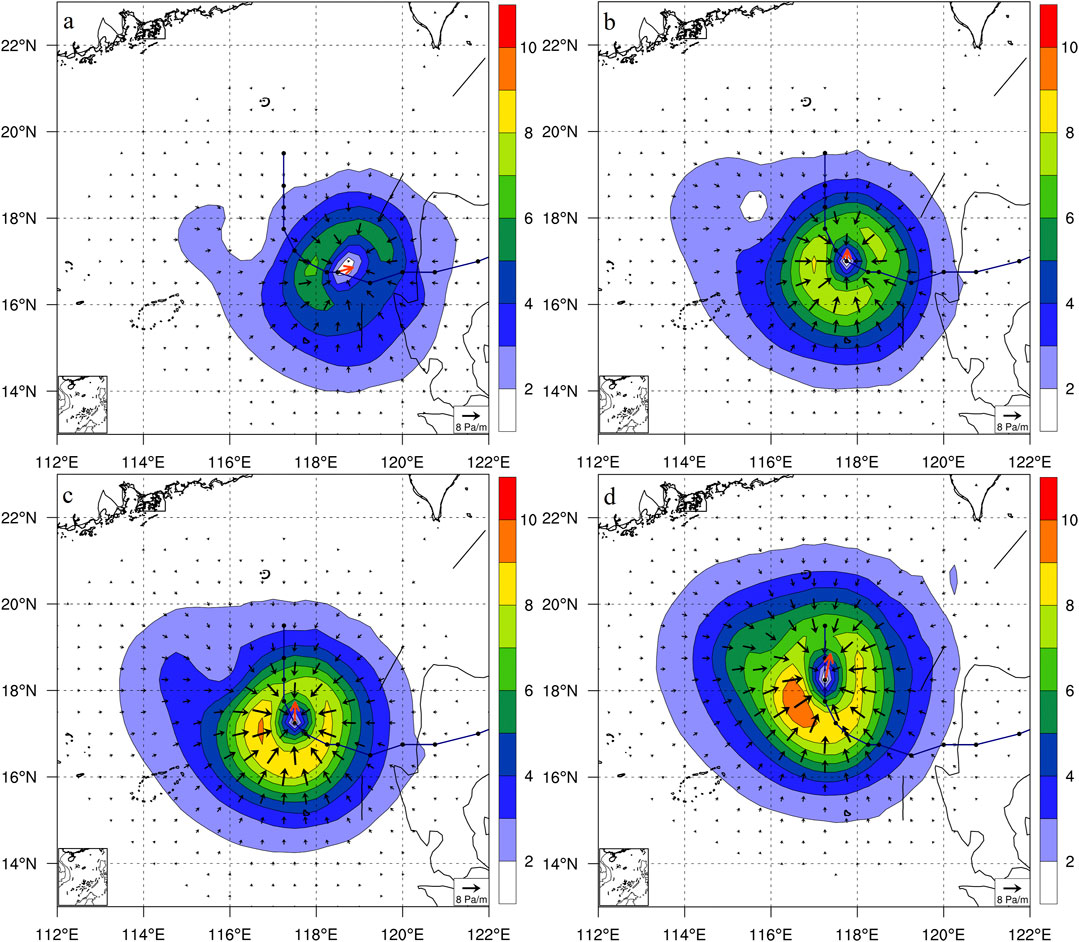
FIGURE 7. The averaged horizontal pressure gradient force between 975- and 300-hPa at different stages Unit: Pa m−1. (A) T-18, (B) T-6, (C) T, (D) T+12. (Shaded contours and black vectors represent the magnitude and direction of averaged pressure gradient force, respectively. Red vector denotes the composite pressure gradient force on grids in a circle with a radius of 400 km from the TC center).
When a TC enters an environment with weak steering airflow and slows down, the thermal asymmetric structure of TC induced by the cold air intrusion may project an impact on TC motion. The cold air sinking on the west of the TC center may lead to the divergent drafts, and form a pressure gradient force opposite to the direction of TC movement, which is unfavorable for a TC keeping its original moving direction.
Tuleya and Kurihara (1982) reported that a warm SST increases the TC intensity and induces a northwestward shift of the northwestward-moving TC related to the beta effect (sensitive to the intensity and size of the TC). Wu et al. (2005b) showed the relative contribution of the symmetric and asymmetric SST components to TC motion. They demonstrated that the asymmetric SST component modulates the TC motion by changing the asymmetry in rainfall and vertical motion, while the symmetric component is related to the beta effect. This result indicates the importance of the asymmetric distributions of SST on TC motion. Chang and Madala (1980) presented evidence that the spatial distribution of SST influences the TC motion, a warm S ST to the right of the mean flow is more favorable for the northwest drift of westward-moving TCs than a warm SST on the left side.
In this study, the TC also has the characteristics of approaching to warm region. Figure 8 shows the daily SSTA distributions at variant stages during the TC turning. During the stage of westward travel across the Luzon Island (Figure 8A), the negative SSTA is located west of 115°E. The TC keeps on moving westward approaching the SCS, because the sea surface of the region ahead of the TC track is still controlled by the positive SSTA over 0.4°C, the TC keeps moving westward approaching the region with positive SSTA in the SCS. Starting from T-24 (Figure 8B), the range of negative SSTA region on west of 115°E continues to expand. As the cold air heads southward further, the negative SSTA region with center values becomes lower than 0.6°C to the west of 115°E. It is notable that the negative SST anomaly occurring in the south and near the center of TC gets stronger, while the positive SSTA region is weakened and squeezed to the north of the TC (Figures 8C,D). It also finds that there is a negative SSTA region appearing near and on the south of the center of the TC, which is the typical response of SST caused by the cold wake of TC (Ma et al., 2013). In addition, the cooling of SST increases the asymmetry of the TC thermodynamic and dynamic structures (Zhu et al., 2004; Chen et al., 2010) and affects the track of the TC further.
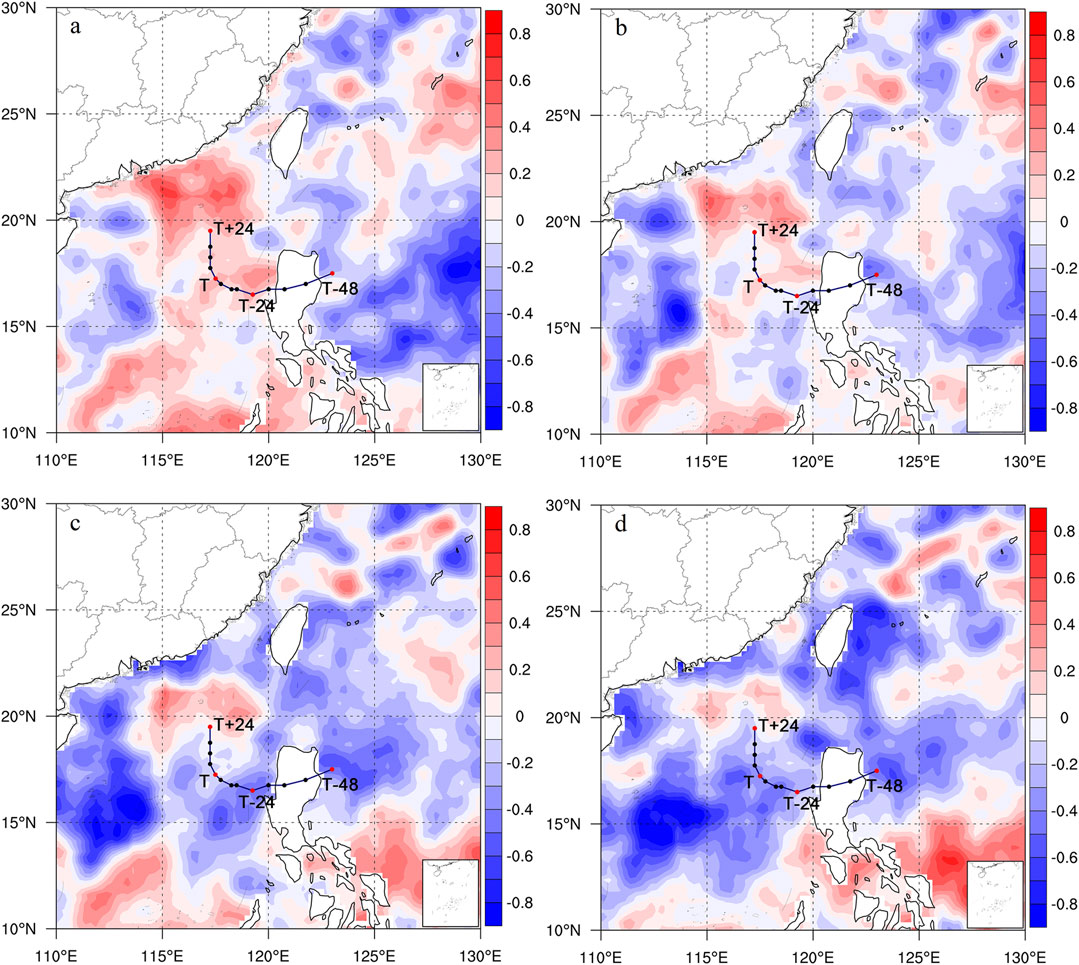
FIGURE 8. The distribution of abnormal daily SST at different stages (shaded contours, Unit: °C). (A) T-48, (B) T-24, (C) T, (D) T+24. (Solid line with dots is the composed typhoon track).
Although SST has been used widely to represent the ocean state in studies on air-sea interaction, Deser et al. (2003) have suggested that the OHC can also better reflect the heat storage of the ocean than the SST. The anomalous upper OHC indicates the total amount of heat that the ocean can release to the atmosphere (Dong and Kelly 2004). The anomalous of upper OHC at T-12 is shown in Figure 9. The cold air cools the SST to the west of the TC (Figure 8), which decreases the OHC of the upper surface. The presence of negative inconsistencies of OHC locating inhibits the TC from developing and moving westward, while the positive OHC anomalous is located on the north of the TC, which is favorable for the TC turning north.
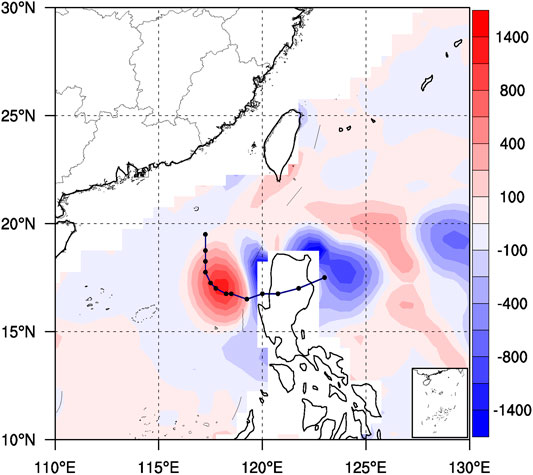
FIGURE 9. The distribution of OHC anomalous (shaded contours, Unit: J km−2) at T-12. (Solid line with dots is the composed typhoon track).
Mesoscale variability in SST affects sea surface heat fluxes, which then alters the boundary layer, leading to convective activity (Skyllingstad et al., 2019). Latent and sensible heat transfer from the ocean surface along with potential energy, increasing the moist static energy of the boundary layer (Andersen et al., 2013). The increasing moist static energy (MSE) in the lower troposphere leads to an establishment of convective instability, producing a high CAPE value (Chen and Qin 2016). In this study, the MSE also has a similar distribution to that of the SST (figures not shown). The region with an MSE less than 334 K is on the west and south sides of the TC, and the region with higher values (greater than 346 K) on the north side of TC due to the cold air intrusion.
It is found that convective heating can significantly affect TC motion through the direct asymmetric heating and the asymmetric flow caused by diabatic heating (Flatau et al., 1994; Wu et al., 2005b). Fiorino and Elsberry (1989) established a concept that the asymmetric flow induced by diabatic heating associated with the convection within a TC can significantly affect TC motion and vertical coupling. The asymmetric diabatic heating tends to move vortices to the region downstream of the maximum gradient of asymmetric diabatic heating (Wu and Wang, 2001). Figure 5 and Figure 8 represent a downdraft and colder ocean surface on the west side of the TC generated by the invasion of the cold air, which may suppress the convective activity there. While the convection may be promoted over a warmer underlying surface on the north side of the TC. Such the inhomogeneity of convection makes the TC present asymmetric diabatic heating. There is a convergent center downstream of the diabatic heating center located at the north side of the TC in lower layers (figure not shown), which is favorable for the TC vortex to turn northward. These are consistent with the results of Wu and Wang (2001).
According to the abovementioned, the asymmetric distribution of SSTA, OHC, or diabatic heating are all related to the cold air intrusion. The warm approaching of TC reflects its avoidance feature from the cold air in another way.
The effects of cold air during the north turning of the TCs over the SCS are studied in this paper. The compositive analysis attributes the north turning of TCs mainly to their characteristic of avoidance from the cold air under circumstances with weakened steering flows.
The cold air from the northern mainland may result in thermal and dynamical asymmetry of TCs exerting an influence on TC motion. On one hand, the negative temperature anomaly occurring below the mid-levels on the west and south sides of the TC may lead to stable atmospheric stratification and lower SST and OHC restraining convection development. On another hand, the cold air descending can generate diverging outflows opposite to the movement direction of TC, which slows and blocks the TC from moving westward further. Plus, the PGF related to the cold intrusion highlights its influence on the north turning in a weak steering flow field. Besides, the underlying warm region (including the SST and the OHC) are found occurring on the north side with the influence by the cold air and the cold wake of the TC, which is beneficial to the north turning.
In a word, when a westward-moving TC encounters cold air intruding from mid-latitude over the SCS, it may show a sharp north turn to avoid the cold air area, especially in weak steering flows. However, it should be noted the factors causing the recurvature of a TC can be various and complex, such as the low-latitude monsoon trough, binary tropical cyclone interaction, the tropical upper-tropospheric trough, diabatic heating, orographic effects, and so on. The role of cold avoidance should be discussed in detail. The cold avoidance characteristics need to be considered quantitatively in further study.
The original contributions presented in the study can be inquired to the corresponding author directly.
SL and YL conducted analysis and writing in the paper. SL contributed to the figures included in this manuscript. All of the authors were contributed to the article and approved to submit the paper.
This work was jointly funded by the National Natural Science Foundation of China (Grants Nos. 41930972 and 51778617), Fujian Key Laboratory of Severe Weather (Grants Nos.2020TF10).
The authors declare that the research was conducted in the absence of any commercial or financial relationships that could be construed as a potential conflict of interest.
All claims expressed in this article are solely those of the authors and do not necessarily represent those of their affiliated organizations, or those of the publisher, the editors and the reviewers. Any product that may be evaluated in this article, or claim that may be made by its manufacturer, is not guaranteed or endorsed by the publisher.
We thank reviewers for their critical comments that helped to improve the presentation of our results. Thanks also go to the graphic software packages, i.e., NCAR Command Language (NCL, doi: 10.5065/D6WD3XH5), which is employed to plot the figures.
Aberson, S. D. (2010). 10 Years of Hurricane Synoptic Surveillance (1997-2006). Mon. Wea. Rev. 138, 1536–1549. doi:10.1175/2009MWR3090.1
Aberson, S. D., and DeMaria, M. (1994). Verification of a Nested Barotropic hurricane Track Forecast Model (VICBAR). Mon. Wea. Rev. 122, 2804–2815. doi:10.1175/1520-0493(1994)122<2804:voanbh>2.0.co;2
Andersen, T. K., Radcliffe, D. E., and Shepherd, J. M. (2013). Quantifying Surface Energy Fluxes in the Vicinity of Inland-Tracking Tropical Cyclones. J. Appl. Meteorology Climatology 52, 2797–2808. doi:10.1175/JAMC-D-13-035.1
Banzon, V., and Reynolds, R.National Center for Atmospheric Research Staff (Editors) (2021). The Climate Data Guide: SST Data: NOAA High-Resolution (0.25×0.25) Blended Analysis of Daily SST and Ice, OISSTv2. Retrieved from https://climatedataguide.ucar.edu/climate-data/sst-data-noaa-high-resolution-025x025-blended-analysis-daily-sst-and-ice-oisstv2
Berger, H., Langland, R., Velden, C. S., Reynolds, C. A., and Pauley, P. M. (2011). Impact of Enhanced Satellite-Derived Atmospheric Motion Vector Observations on Numerical Tropical Cyclone Track Forecasts in the Western North Pacific during TPARC/TCS-08. J. Appl. Meteorol. Climatol. 50, 2309–2318. doi:10.1175/JAMC-D-11-019.1
Bi, M., Li, T., Peng, M., and Shen, X. (2015). Interactions between Typhoon Megi (2010) and a Low-Frequency Monsoon Gyre. J. Atmos. Sci. 72, 2682–2702. doi:10.1175/JAS-D-14-0269.1
Brand, S., and Blelloch, J. W. (1974). Changes in the Characteristics of Typhoons Crossing the Island of Taiwan. Mon. Wea. Rev. 102, 708–713. doi:10.1175/1520-0493(1974)102<0708:citcot>2.0.co;2
Carr, L. E., and Elsberry, R. L. (1995). Monsoonal Interactions Leading to Sudden Tropical Cyclone Track Changes. Mon. Wea. Rev. 123, 265–290. doi:10.1175/1520-0493(1995)123<0265:miltst>2.0.co;2
Carr, L. E., and Elsberry, R. L. (1990). Observational Evidence for Predictions of Tropical Cyclone Propagation Relative to Environmental Steering. J. Atmos. Sci. 47, 542–546. doi:10.1175/1520-0469(1990)047<0542:oefpot>2.0.co;2
Chan, J. C. L., Gray, W. M., and Kidder, S. Q. (1980). Forecasting Tropical Cyclone Turning Motion from Surrounding Wind and Temperature fields. Mon. Wea. Rev. 108, 778–792. doi:10.1175/1520-0493(1980)108<0778:ftctmf>2.0.co;2
Chan, J. C. L. (1995). Prediction of Annual Tropical Cyclone Activity over the Western North Pacific and the South China Sea. Int. J. Climatol. 15, 1011–1019. doi:10.1002/joc.3370150907
Chan, J. C. L., and Williams, R. T. (1987). Analytical and Numerical Studies of the Beta-Effect in Tropical Cyclone Motion. Part I: Zero Mean Flow. J. Atmos. Sci. 44, 1257–1265. doi:10.1175/1520-0469(1987)044<1257:aansot>2.0.co;2
Chang, S. W., and Madala, R. V. (1980). Numerical Simulation of the Influence of Sea Surface Temperature on Translating Tropical Cyclones. J. Atmos. Sci. 37, 2617–2630. doi:10.1175/1520-0469(1980)037<2617:nsotio>2.0.co;2
Chen, G., and Qin, H. (2016). Strong Ocean-Atmosphere Interactions during a Short-Term Hot Event over the Western Pacific Warm Pool in Response to El Niño. J. Clim. 29 (10), 3841–3865. doi:10.1175/JCLI-D-15-0595.1
Chen, L. S., Xu, X. D., Xie, Y. Y., and Li, W. H. (1997). The Effect of Tropical Cyclone Asymmetric Thermodynamic Structure on its Unusual Motion. Chin. J. Atmos. Sci. (Scientia Atmospherica Sinica) (in Chinese) 21 (1), 83–90. doi:10.3878/j.issn.1006-9895.1997.01.09
Chen, L. S., and Ding, Y. H. (1979). An Introduction to Typhoons over the Western North Pacific (In Chinese). Beijing: Science Press, 491.
Chen, S.-Y., Shih, C.-P., Huang, C.-Y., and Teng, W.-H. (2021). An Impact Study of GNSS RO Data on the Prediction of Typhoon Nepartak (2016) Using a Multi-Resolution Global Model with 3D-Hybrid Data Assimilation. Wea. Forecast. 36 (3), 957–977. doi:10.1175/WAF-D-20-0175.1
Chen, S., Campbell, T. J., Jin, H., Gaberšek, S., Hodur, R. M., and Martin, P. (2010). Effect of Two-Way Air-Sea Coupling in High and Low Wind Speed Regimes. Mon. Wea. Rev. 138, 3579–3602. doi:10.1175/2009MWR3119.1
Chen, T.-C., Wang, S.-Y., Yen, M.-C., and Gallus, W. A. (2004). Role of the Monsoon Gyre in the Interannual Variation of Tropical Cyclone Formation over the Western North Pacific. Wea. Forecast. 19, 776–785. doi:10.1175/1520-0434(2004)019<0776:rotmgi>2.0.co;2
Choi, Y., Yun, K.-S., Ha, K.-J., Kim, K.-Y., Yoon, S.-J., and Chan, J. C. L. (2013). Effects of Asymmetric SST Distribution on Straight-Moving Typhoon Ewiniar (2006) and Recurving Typhoon Maemi (2003). Mon. Wea. Rev. 141, 3950–3967. doi:10.1175/MWR-D-12-00207.1
Chou, C.-B., Huang, C.-Y., Huang, H.-P., Wang, K.-H., and Yeh, T.-C. (2008). The Analysis of Typhoon Structures Using Advanced Microwave Sounding Unit Data and its Application to Prediction. J. Appl. Meteorol. Climatol. 47, 1476–1492. doi:10.1175/2007JAMC1577.1
Deser, C., Alexander, M. A., and Timlin, M. S. (2003). Understanding the Persistence of Sea Surface Temperature Anomalies in Midlatitudes. J. Clim. 16, 57–72. doi:10.1175/1520-0442(2003)016<0057:utposs>2.0.co;2
Dong, K., and Neumann, C. J. (1986). The Relationship between Tropical Cyclone Motion and Environmental Geostrophic Flows. Mon. Wea. Rev. 114, 115–122. doi:10.1175/1520-0493(1986)114<0115:trbtcm>2.0.co;2
Dong, M., Chen, L., Li, Y., and Lu, C. (2010). Rainfall Reinforcement Associated with Landfalling Tropical Cyclones. J. Atmos. Sci. 67, 3541–3558. doi:10.1175/2010JAS3268.1
Dong, S., and Kelly, K. A. (2004). Heat Budget in the Gulf Stream Region: The Importance of Heat Storage and Advection. J. Phys. Oceanogr. 34, 1214–1231. doi:10.1175/1520-0485(2004)034<1214:hbitgs>2.0.co;2
Elsberry, R. L. (2014). Advances in Research and Forecasting of Tropical Cyclones from 1963-2013. Asia-pacific J. Atmos. Sci. 50, 3–16. doi:10.1007/s13143-014-0001-1
Elsberry, R. L. (2007). Advances in Tropical Cyclone Motion Prediction and Recommendations for the Future. WMO Bull. 56, 131–134.
Elsberry, R. L. (1995). “Tropical Cyclone Motion. Global Perspectives on Tropical Cyclones,” in WMO Tech. Doc. WMO/TD-693. Editor R. L. Elsberry (Geneva, Switzerland: World Meteorological Organization), 106–197.
Fiorino, M., and Elsberry, R. L. (1989). Some Aspects of Vortex Structure Related to Tropical Cyclone Motion. J. Atmos. Sci. 46, 975–990. doi:10.1175/1520-0469(1989)046<0975:saovsr>2.0.co;2
Flatau, M., Schubert, W. H., and Stevens, D. E. (1994). The Role of Baroclinic Processes in Tropical Cyclone Motion: The Influence of Vertical Tilt. J. Atmos. Sci. 51, 2589–2601. doi:10.1175/1520-0469(1994)051<2589:trobpi>2.0.co;2
Gall, R., Franklin, J., Marks, F., Rappaport, E. N., and Toepfer, F. (2013). The Hurricane Forecast Improvement Project. Bull. Amer. Meteorol. Soc. 94, 329–343. doi:10.1175/BAMS-D-12-00071.1
George, J. E., and Gray, W. M. (1976). Tropical Cyclone Motion and Surrounding Parameter Relationships. J. Appl. Meteorol. 15, 1252–1264. doi:10.1175/1520-0450(1976)015<1252:tcmasp>2.0.co;2
Goerss, J. S. (2000). Tropical Cyclone Track Forecasts Using an Ensemble of Dynamical Models. Mon. Wea. Rev. 128, 1187–1193. doi:10.1175/1520-0493(2000)128
Goerss, J. S., Sampson, C. R., and Gross, J. (2004). A History of Western North Pacific Tropical Cyclone Track Forecast Skill. Wea. Forecasting 19, 633–638. doi:10.1175/1520-0434(2004)019<0633:AHOWNP>2.0.CO;2
Harr, P. A., and Elsberry, R. L. (2000). Extratropical Transition of Tropical Cyclones over the Western North Pacific. Part I: Evolution of Structural Characteristics during the Transition Process. Mon. Wea. Rev. 128, 2613–2633. doi:10.1175/1520-0493(2000)128<2613:etotco>2.0.co;2
Harr, P. A., and Elsberry, R. L. (1995). Large-scale Circulation Variability over the Tropical Western North Pacific. Part I: Spatial Patterns and Tropical Cyclone Characteristics. Mon. Wea. Rev. 123, 1225–1246. doi:10.1175/1520-0493(1995)123<1225:lscvot>2.0.co;2
Hennermann, K., and Berrisford, P. (2018). What Are the Changes from ERA-Interim to ERA5? ECMWF. Available at: https://confluence.ecmwf.int/pages/viewpage.action?pageId=74764925.
Hersbach, H., Bell, W., Berrisford, P., Horányi, A. J., Nicolas, J., Radu, R., et al. (2019). Global Reanalysis: Goodbye Era-Interim, Hello ERA5. ECMWF Newsletter, No. 159. Reading, United Kingdom: ECMWF, 17–24. Available at: https://www.ecmwf.int/node/19027.
Holland, G. J. (1983). Tropical Cyclone Motion: Environmental Interaction Plus a Beta Effect. J. Atmos. Sci. 40, 328–342. doi:10.1175/1520-0469(1983)040<0328:tcmeip>2.0.co;2
Holland, G. J., and Wang, Y. (1995). Baroclinic Dynamics of Simulated Tropical Cyclone Recurvature. J. Atmos. Sci. 52, 410–426. doi:10.1175/1520-0469(1995)052<0410:bdostc>2.0.co;2
Kieu, C. Q., Truong, N. M., Mai, H. T., and Ngo-Duc, T. (2012). Sensitivity of the Track and Intensity Forecasts of Typhoon Megi (2010) to Satellite-Derived Atmospheric Motion Vectors with the Ensemble Kalman Filter. J. Atmos. Oceanic Technol. 29, 1794–1810. doi:10.1175/JTECH-D-12-00020.1
Li, Y., Chen, L. S., and Wang, J. Z. (2004). The Diagnostic Analysis on the Characteristics of Large Scale Circulation Corresponding to the Sustaining and Decaying of Tropical Cyclone after it’s Landfall. Acta Meteorol. Sin. 62, 167–179. doi:10.3321/j.issn:0577-6619.2004.02.004
Li, Y., Guo, L., Ying, Y., and Hu, S. (2012). Impacts of Upper-Level Cold Vortex on the Rapid Change of Intensity and Motion of Typhoon Meranti (2010). J. Trop. Meteorol. 18, 207–219.
Liang, J., Wu, L., Ge, X., and Wu, C.-C. (2011). Monsoonal Influence on Typhoon Morakot (2009). Part II: Numerical Study. J. Atmos. Sci. 68, 2222–2235. doi:10.1175/2011JAS3731.1
Liang, J., and Wu, L. (2015). Sudden Track Changes of Tropical Cyclones in Monsoon Gyres: Full-Physics, Idealized Numerical Experiments*. J. Atmos. Sci. 72, 1307–1322. doi:10.1175/JAS-D-13-0393.1
Ling, Z., Wang, Y., and Wang, G. (2016). Impact of Intraseasonal Oscillations on the Activity of Tropical Cyclones in Summer over the South China Sea. Part I: Local Tropical Cyclones. J. Clim. 29, 855–868. doi:10.1175/JCLI-D-15-0617.1
Ma, Z., Fei, J., Liu, L., Huang, X., and Cheng, X. (2013). Effects of the Cold Core Eddy on Tropical Cyclone Intensity and Structure under Idealized Air-Sea Interaction Conditions. Mon. Wea. Rev. 141, 1285–1303. doi:10.1175/MWR-D-12-00123.1
Neumann, C. (1992). Final Report: Joint Typhoon Warning Center (JTWC92) Model. SAIC Contract Rep. N00014-90-C-6042 (Part 2), 41.
Peng, S., Qian, Y.-K., Lai, Z., Hao, S., Chen, S., Xu, H., et al. (2014). On the Mechanisms of the Recurvature of Super Typhoon Megi. Sci. Rep. 4, 4451. doi:10.1038/srep04451
Qian, C., Zhang, F., Green, B. W., Zhang, J., and Zhou, X. (2013). Probabilistic Evaluation of the Dynamics and Prediction of Supertyphoon Megi (2010). Wea. Forecast. 28, 1562–1577. doi:10.1175/WAF-D-12-00121.1
Rappaport, E. N., Franklin, J. L., Avila, L. A., Baig, S. R., Beven, J. L., Blake, E. S., et al. (2009). Advances and Challenges at the National Hurricane Center. Wea. Forecast. 24, 395–419. doi:10.1175/2008WAF2222128.1
Ritchie, E. A., and Elsberry, R. L. (2001). Simulations of the Transformation Stage of the Extratropical Transition of Tropical Cyclones. Mon. Wea. Rev. 129, 1462–1480. doi:10.1175/1520-0493(2001)129<1462:sottso>2.0.co;2
Saha, S., Moorthi, S., Pan, H.-L., Wu, X., Wang, J., Nadiga, S., et al. (2010). The NCEP Climate Forecast System Reanalysis. Bull. Amer. Meteorol. Soc. 91, 1015–1058. doi:10.1175/2010BAMS3001.1
Sanders, F., Adams, A. L., Gordon, N. J. B., and Jensen, W. D. (1980). Further Development of a Barotropic Operational Model for Predicting Paths of Tropical Storms. Mon. Wea. Rev. 108, 642–654. doi:10.1175/1520-0493(1980)108<0642:fdoabo>2.0.co;2
Shi, W., Fei, J., Huang, X., Cheng, X., Ding, J., and He, Y. (2014). A Numerical Study on the Combined Effect of Midlatitude and Low-Latitude Systems on the Abrupt Track Deflection of Typhoon Megi (2010). Mon. Wea. Rev. 142, 2483–2501. doi:10.1175/MWR-D-13-00283.1
Skyllingstad, E. D., de Szoeke, S. P., and O’Neill, L. W. (2019). Modeling the Transient Response of Tropical Convection to Mesoscale SST Variations. J. Atmos. Sci. 76, 1227–1244. doi:10.1175/JAS-D-18-0079.1
Tu, J.-Y., Chou, C., and Chu, P.-S. (2009). The Abrupt Shift of Typhoon Activity in the Vicinity of Taiwan and its Association with Western North Pacific-East Asian Climate Change. J. Clim. 22, 3617–3628. doi:10.1175/2009JCLI2411.1
Tuleya, R. E., and Kurihara, Y. (1982). A Note on the Sea Surface Temperature Sensitivity of a Numerical Model of Tropical Storm Genesis. Mon. Wea. Rev. 110, 2063–2069. doi:10.1175/1520-0493(1982)110<2063:anotss>2.0.co;2
Velden, C. S., and Leslie, L. M. (1991). The Basic Relationship between Tropical Cyclone Intensity and the Depth of the Environmental Steering Layer in the Australian Region. Wea. Forecast. 6, 244–253. doi:10.1175/1520-0434(1991)006<0244:tbrbtc>2.0.co;2
Wang, C.-C., Kuo, H.-C., Chen, Y.-H., Huang, H.-L., Chung, C.-H., and Tsuboki, K. (2012). Effects of Asymmetric Latent Heating on Typhoon Movement Crossing Taiwan: The Case of Morakot (2009) with Extreme Rainfall. J. Atmos. Sci. 69, 3172–3196. doi:10.1175/JAS-D-11-0346.1
Wang, S.-T. (1980). Prediction of the Movement and Strength of Typhoons in Taiwan and its Vicinity (In Chinese). Natl. Sci. Counc. Res. Rep 108, 100.
Wang, Y., and Holland, G. J. (1996). The Beta Drift of Baroclinic Vortices. Part II: Diabatic Vortices. J. Atmos. Sci. 53, 3737–3756. doi:10.1175/1520-0469(1996)053<3737:tbdobv>2.0.co;2
Wang, Z., and Fei, L. (1987). Manual for Typhoon Prediction (In Chinese). Beijing, China: China Meteorological Press, 360.
Wu, L., Ni, Z., Duan, J., and Zong, H. (2013). Sudden Tropical Cyclone Track Changes over the Western North Pacific: A Composite Study. Mon. Wea. Rev. 141, 2597–2610. doi:10.1175/MWR-D-12-00224.1
Wu, L., and Wang, B. (2004). Assessing Impacts of Global Warming on Tropical Cyclone Tracks*. J. Clim. 17, 1686–1698. doi:10.1175/1520-0442(2004)017<1686:aiogwo>2.0.co;2
Wu, L., Wang, B., and Braun, S. A. (2005b). Impacts of Air-Sea Interaction on Tropical Cyclone Track and Intensity. Mon. Wea. Rev. 133, 3299–3314. doi:10.1175/MWR3030.1
Wu, L., and Wang, B. (2001). Effects of Convective Heating on Movement and Vertical Coupling of Tropical Cyclones: A Numerical Study*. J. Atmos. Sci. 58, 3639–3649. doi:10.1175/1520-0469(2001)058<3639:eochom>2.0.co;2
Wu, L., Wang, B., and Geng, S. (2005a). Growing Typhoon Influence on East Asia. Geophys. Res. Lett. 32, a–n. doi:10.1029/2005GL022937
Wu, L., Zong, H., and Liang, J. (2011). Observational Analysis of Sudden Tropical Cyclone Track Changes in the Vicinity of the East China Sea. J. Atmos. Sci. 68, 3012–3031. doi:10.1175/2010JAS3559.1
Xu, X., Peng, S., Yang, X., Xu, H., Tong, D. Q., Wang, D., et al. (2013). Does Warmer China Land Attract More Super Typhoons? Sci. Rep. 3, 1522. doi:10.1038/srep01522
Yeh, T.-C., and Elsberry, R. L. (1993a). Interaction of Typhoons with the Taiwan Orography. Part I: Upstream Track Deflections. Mon. Wea. Rev. 121, 3193–3212. doi:10.1175/1520-0493(1993)121<3193:iotwtt>2.0.co;2
Yeh, T.-C., and Elsberry, R. L. (1993b). Interaction of Typhoons with the Taiwan Orography. Part II: Continuous and Discontinuous Tracks across the Island. Mon. Wea. Rev. 121, 3213–3233. doi:10.1175/1520-0493(1993)121<3213:iotwtt>2.0.co;2
Ying, M., Zhang, W., Yu, H., Lu, X., Feng, J., Fan, Y., et al. (2014). An Overview of the China Meteorological Administration Tropical Cyclone Database. J. Atmos. Oceanic Technol. 31, 287–301. doi:10.1175/JTECH-D-12-00119.1
Yumoto, M., and Matsuura, T. (2001). Interdecadal Variability of Tropical Cyclone Activity in the Western North Pacific. J. Meteorol. Soc. Jpn. 79, 23–35. doi:10.2151/jmsj.79.23
Yun, K.-S., Chan, J. C. L., and Ha, K.-J. (2012). Effects of SST Magnitude and Gradient on Typhoon Tracks Around East Asia: Acase Study for Typhoon Maemi (2003). Atmos. Res. 109-110, 36–51. doi:10.1016/j.atmosres.2012.02.012
Zhang, Q., Wu, L., and Liu, Q. (2009). Tropical Cyclone Damages in China 1983-2006. Bull. Amer. Meteorol. Soc. 90, 489–496. doi:10.1175/2008BAMS2631.1
Zhang, X., Li, Y., Zhang, D.-L., and Chen, L. (2018). A 65-yr Climatology of Unusual Tracks of Tropical Cyclones in the Vicinity of China's Coastal Waters during 1949-2013. J. Appl. Meteorol. Climatol. 57, 155–170. doi:10.1175/JAMC-D-16-0392.1
Keywords: typhoon, cold avoidance, north turning, motion change, asymmetric structure
Citation: Lai S, Li Y, He F, Wang Y and Chen Y (2021) The Cold Avoidance of Typhoons in Their North Turning Over the South China Sea. Front. Earth Sci. 9:782195. doi: 10.3389/feart.2021.782195
Received: 24 September 2021; Accepted: 01 November 2021;
Published: 03 December 2021.
Edited by:
Hui Yu, China Meteorological Administration, ChinaReviewed by:
Nannan Qin, Fudan University, ChinaCopyright © 2021 Lai, Li, He, Wang and Chen. This is an open-access article distributed under the terms of the Creative Commons Attribution License (CC BY). The use, distribution or reproduction in other forums is permitted, provided the original author(s) and the copyright owner(s) are credited and that the original publication in this journal is cited, in accordance with accepted academic practice. No use, distribution or reproduction is permitted which does not comply with these terms.
*Correspondence: Ying Li, eWxpQGNtYS5nb3YuY24=
Disclaimer: All claims expressed in this article are solely those of the authors and do not necessarily represent those of their affiliated organizations, or those of the publisher, the editors and the reviewers. Any product that may be evaluated in this article or claim that may be made by its manufacturer is not guaranteed or endorsed by the publisher.
Research integrity at Frontiers
Learn more about the work of our research integrity team to safeguard the quality of each article we publish.