 Qingyuan Liu
 Jinjie Song
 Philip J. Klotzbach
94% of researchers rate our articles as excellent or good
Learn more about the work of our research integrity team to safeguard the quality of each article we publish.
Find out more
ORIGINAL RESEARCH article
Front. Earth Sci., 03 November 2021
Sec. Atmospheric Science
Volume 9 - 2021 | https://doi.org/10.3389/feart.2021.780353
This article is part of the Research TopicLandfalling Tropical Cyclones: Physical Processes, Forecasting and ImpactsView all 26 articles
This study investigates the long-term trend in the average 24-h intensity change (ΔV24) of western North Pacific (WNP) tropical cyclones (TCs) before landfall during June-November for the period from 1970–2019. We find a significant increasing trend in basin-averaged ΔV24 during 1970–2019. The increase in ΔV24 is significant over the northern South China Sea (17.5°-25°N, 107.5°-120°E) and to the east of the Philippines (7.5°-15°N, 122.5°-132.5°E), implying a slower weakening rate before landfall for the South China Sea and an increased intensification rate before landfall for the region east of the Philippines. We find a significant linkage between changes in ΔV24 and several large-scale environmental conditions. The increased ΔV24 before landfall in the above two regions is induced by a warmer ocean (e.g., higher sea surface temperatures, maximum potential intensity and TC heat potential) and greater upper-level divergence, with a moister mid-level atmosphere also aiding the ΔV24 increase east of the Philippines. Our study highlights an increasing tendency of ΔV24 before landfall, consistent with trends in ΔV24 over water and over land as found in previous publications.
Tropical cyclones (TCs) are one of the most devastating global natural disasters, inducing large economic losses as well as fatalities for various coastal regions. Among TC metrics, TC intensity change has long been regarded as a major challenge for both the scientific research and operational forecasting communities (Courtney et al., 2019; Hendricks et al., 2019). TC intensity change is the result of a complex interaction between various internal influences that are related to the structure and internal processes of the TC itself and various external influences that are controlled by the large-scale atmospheric and oceanic environment (Hendricks et al., 2019).
Given active research on the relationship between TCs and climate change, there has been an increasing focus on temporal variations in TC intensity change. Bhatia et al. (2019) reported an increasing trend in the mean TC 24-h intensity change (ΔV24) over the globe and for the Atlantic basin specifically since the 1980s. They also found a broadening distribution of ΔV24, due to increasing intensification and weakening rates. Similar changes in the ΔV24 distribution from 1982 to 2019 were shown over the western North Pacific (WNP) in Song et al. (2020). The increasing intensification rate is associated with an increasing proportion of rapid intensification (RI) cases that likely has an anthropogenic warming component (Bhatia et al., 2019). By comparison, there is a linkage between the increasing weakening rate and the increasing proportion of rapid weakening (RW) cases, possibly resulting from increasing sea surface temperature (SST) gradients in the subtropics (Song et al., 2020). Note that all of the above findings are only based on TC records over the open ocean.
By analyzing TC samples over land, Liu et al. (2020) demonstrated a slight decreasing trend in the TC weakening rate after landfall in mainland China during 1980–2018, implying an increasing trend in overland ΔV24. This was attributed to decreasing vertical wind shear (VWS), increasing upper-level divergence and increasing mid-level upward motion (Liu et al., 2020). Over mainland China, the decreasing TC weakening rate is consistent with the increasing decaying timescale of landfalling TCs, as shown in Song et al. (2021). They found a slower decay in the first 24 h after landfall, primarily driven by increasing low-level vorticity in coastal regions of China (Song et al., 2021). Additionally, Li and Chakraborty (2020) reported a slowing trend in the decay of landfalling TCs over the North Atlantic, mainly from a contemporaneous increase in SST.
There are still 24-h TC tracks excluded from consideration in the aforementioned previous publications, which examined either five 6-hourly records occurring over water or five 6-hourly records over land. The samples that have been excluded in previous publications move from water to land during the 24-h period, and are consequently expected to have complex ΔV24s, due to multiple environmental and land surface changes that occur during the 24-h period. The most important of these intensity change questions is the ΔV24 before landfall, which is critical for reducing damage and loss of life. Rappaport et al. (2010) studied the intensity change of TCs making landfall along the U.S. Gulf Coast, in which TC tracks in the 48 h prior to landfall were considered. They found that, on average, category 1–2 (category 3–5) hurricanes strengthened (weakened) before landfall, and this observed trend could be partially explained by environmental conditions.
Up until now, it is still unclear what environmental conditions are related to ΔV24 before landfall over the WNP and their potential long-term trends. The reminder of this study is arranged as follow. Data introduces the data used in this study. Trends in ΔV24 Before Landfall examines the long-term trends in the average ΔV24 before landfall and its contributors. Changes in Environmental Conditions highlights changes in environmental variables and their links to changes in ΔV24 before landfall. A summary is given in Summary.
WNP TC best track data used in this study are given by the Joint Typhoon Warning Center (JTWC), the Japan Meteorological Agency (JMA), the China Meteorological Administration (CMA) and the Hong Kong Observatory (HKO) including 6-hourly TC central positions and maximum sustained winds, as compiled in the International Best Track Archive for Climate Stewardship (IBTrACS) v04r00 (Knapp et al., 2010). Owing to the relatively low quality of the TC intensity estimates in the best track data prior to the 1970s (Camargo and Sobel, 2005), we focus on the period from 1970–2019. To reduce the uncertainty in detecting weak TCs (e.g., tropical depressions) that are induced by changing observational platforms (Klotzbach and Landsea, 2015), we only consider TCs with a lifetime maximum intensity of at least 34 kt. TCs forming during June-November (JJASON) are analyzed here, accounting for ∼85% of the annual total number of WNP TCs (Song and Klotzbach, 2019). Similar to Rappaport et al. (2010) and Zhu et al. (2021), a 24-h track before landfall is identified in this study as when the last record is over land and the previous four 6-h records are all over water. Any 24-h tracks with records labeled as extratropical cyclones in the best track data are removed, in order to minimize the influence of extratropical transition on intensity change. In total, there are 4307 identified 24-h tracks before landfall over the WNP (Figure 1A). The mid-points of these tracks are further interpolated onto a 2.5° × 2.5° grid. Our results are not significantly changed if a 5° × 5° resolution is used instead (figure not shown).
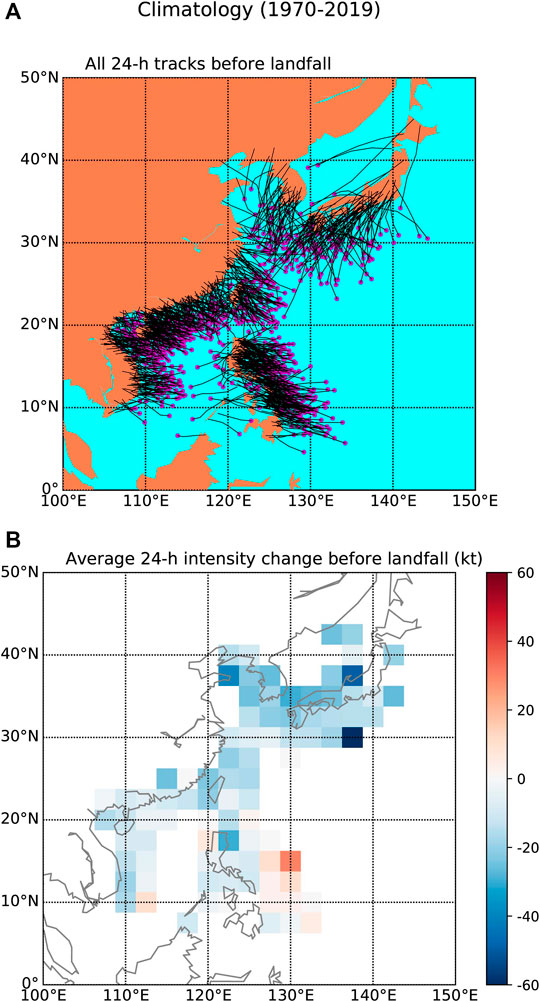
FIGURE 1. (A) All 24-h tracks before landfall identified during JJASON from 1970–2019 using JTWC best track data. (B) Climatological average ΔV24 before landfall calculated over individual 2.5° × 2.5 grids.
Monthly large-scale environmental conditions are provided by the fifth generation European Centre for Medium-Range Weather Forecasts (ECMWF) reanalysis of the global climate (ERA5; Hersbach and Bell, 2020), including SST, 200-hPa temperature, 700–500-hPa relative humidity, 850-hPa relative vorticity, 200-hPa divergence and 850–200-hPa VWS. The original ERA5 data over a grid of 0.25° × 0.25° are re-gridded to a resolution of 2.5° × 2.5°, in order to highlight large-scale features. Maximum potential intensity (MPI; Emanuel, 1988) is calculated from monthly ERA5 data. TC heat potential (TCHP), which measures ocean heat content that is warmer than 26°C (DeMaria et al., 2005), is estimated using monthly subsurface temperature profiles from the ECMWF Ocean Reanalysis System 5 (ORAS5; Zuo et al., 2019) with a resolution of 1° × 1°.
Figure 1A shows all of the 24-h tracks before landfall over the WNP during JJASON between 1970 and 2019. These tracks are located near the coasts of most East Asian and Southeast Asian countries. While it is typically viewed that TCs weaken as they approach land due to interactions with topography, the average ΔV24 before landfall exhibits obvious spatial inhomogeneities (Figure 1B). There are positive average ΔV24s near the Philippines and to the southeast of Vietnam, indicating that TCs, on average, intensify within 24 h prior to landfall in these regions. While Brand and Blelloch (1973) only examined a limited number of TCs, they reported an average TC intensity increase prior to hitting the Philippines. This TC intensity increase is likely caused by environmental conditions near the Philippines being more characteristic of an oceanic environment. Furthermore, negative average ΔV24s are observed along other WNP coastlines, and the magnitude of the negative ΔV24s generally increases with latitude. This result implies that TCs tend to weaken at a greater rate prior to landfall at higher latitudes, possibly as a result of both lower SSTs and increased VWS at higher latitudes.
Figure 2A displays a significant increasing trend for the JJASON average ΔV24 during 1970–2019, with increasing trends of 0.11 kt yr−1 (p < 0.01), 0.11 kt yr−1 (p = 0.04), 0.09 kt yr−1 (p < 0.01) and 0.06 kt yr−1 (p = 0.04) for the best track data from the JTWC, the JMA, the CMA and the HKO, respectively. Given that these increasing trends are relatively consistent between the four agencies, we use the JTWC dataset for all of the remaining analysis.
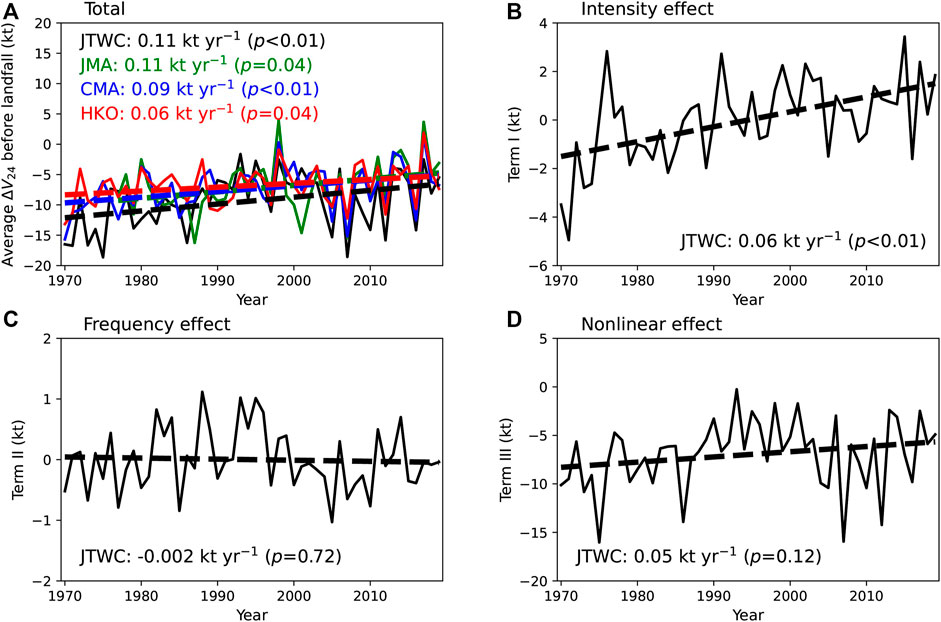
FIGURE 2. Annual averages of ΔV24 before landfall during JJASON for the period from 1970–2019. Black, green, blue, and red lines in (A) are for JTWC, JMA, CMA, and HKO, respectively. The original values and their three components are shown in (A) and in (B–D), respectively. The dashed lines are obtained by least squares, while the trends and their respective significance levels are shown in the panels.
To examine the relative contributions of incorporated variables to the overall ΔV24 change, a decomposition of the average ΔV24 in each year
Here, λ, φ and t refer to latitude, longitude and year, respectively.
The superscripts “c” and “a” refer to the climatological average value and the anomaly relative to the climatology, respectively. Finally, Eq. 2 is decomposed as:
In Eq. 3, because the climatology term does not vary with time, the temporal change in the average ΔV24 can only be influenced by the three other terms, namely the frequency effect, the intensity effect and the nonlinear effect.
There is a significant increasing trend in ΔV24 related to the intensity effect, with a slope of 0.06 kt yr−1 (p < 0.01), accounting for approximately one-half of the total ΔV24 trend (Figure 2B). By contrast, we find no significant trend in ΔV24 related to the frequency effect, whose rate is lower than the total ΔV24 trend by one order of magnitude (Figure 2C). The trend in ΔV24 related to the nonlinear effect is not significant, although its magnitude is comparable to that related to the intensity effect (Figure 2D). The reason that the nonlinear trend is not significant may be due to the larger standard deviation of this term (3.5 kt) relative to the intensity effect (1.7 kt). These results indicate that the intensity effect is the primary driver of the long-term changes in the total ΔV24, while the frequency effect and the nonlinear effect have a lesser impact.
Figure 3 displays the differences in ΔV24 before landfall during JJASON between two sub-periods (1970–1994 and 1995–2019). Similar features are obtained if long-term ΔV24 trends from 1970–2019 are displayed instead (figure not shown). Significant increases in ΔV24 are concentrated over two regions: one is located over the northern South China Sea (SCS) (Region A: 17.5°−25°N, 107.5°−120°E), while the other is located to the east of the Philippines (Region B: 7.5°−15°N, 122.5°−132.5°E). Given the climatological ΔV24 distribution in Figure 1A, the ΔV24 increase in Region A (Region B) implies a slower weakening (stronger intensification) of TCs before landfall. By comparison, changes in ΔV24 over other regions are of a lower magnitude and are less significant. We thus conclude that the increase in basin-averaged ΔV24 is primarily induced by the ΔV24 increases over Regions A and B.
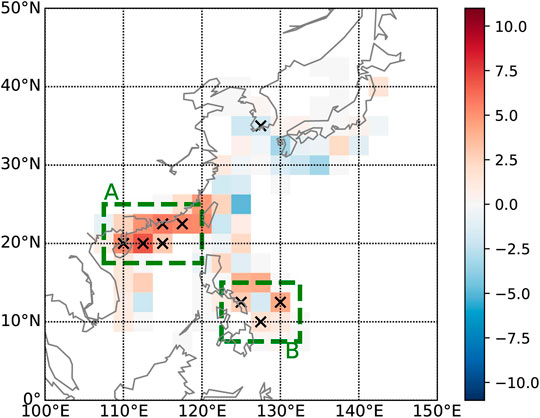
FIGURE 3. Changes in ΔV24 (unit: kt) before landfall during JJASON from 1970–1994 to 1995–2019. Black crosses refer to differences significant at the 0.05 level based on a Student’s t-test. Green boxes highlight Regions A and B.
Although TCs make landfall near the end of the identified 24-h tracks, they are over the ocean during most of the 24-h period. Consequently, these 24-h tracks are more likely influenced by the environment over water than over land. Figures 4A–E illustrates changes in thermodynamic conditions during JJASON from 1970–1994 to 1995–2019. There are significant increases in SST, MPI and TCHP over almost all of the WNP (Figures 4A–C), consistent with the global warming that has occurred since the middle of the last century. Compared with the period from 1970–1994, higher SST, MPI and TCHP in 1995–2019 inhibit the decaying of TCs before landfall over Region A and favor the intensification of TCs before landfall over Region B. There are no significant changes in 200-hPa temperature over Regions A and B from 1970–1994 to 1995–2019 (Figure 4D). While 200-hPa temperature has also increased, the increases in SST and 200-hPa temperature are of comparable magnitude, yielding a thermodynamic environment that is more favorable for TC intensification (Tuleya et al., 2016). In general, the mid-level atmosphere has become moister over the ocean and drier over land from 1995–2019 relative to 1970–1994 (Figure 4E). Although the 700–500-hPa relative humidity has only changed slightly over Region A, relative humidity has increased significantly over Region B. A moister environment is favorable for TC development and intensification, helping to increase the TC intensification rate before landfall over Region B. Given that MPI is a function of SST and the profiles of atmospheric temperature and humidity (Emanuel, 1988), the increasing MPI over Region A is primarily induced by increasing SST, while the increasing MPI over Region B is jointly driven by increasing SST and the moistening atmosphere.
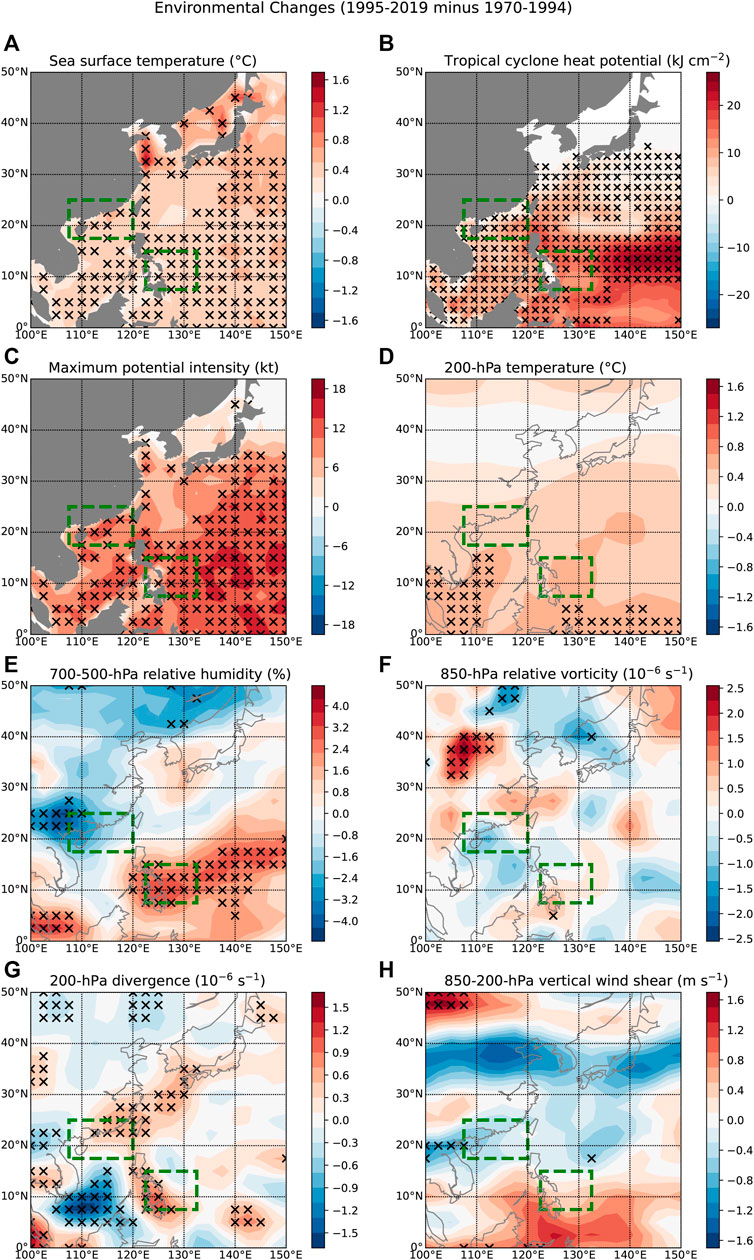
FIGURE 4. Changes from 1970–1994 to 1995–2019 for JJASON averages of the following environmental variables: (A) SST, (B) TCHP, (C) MPI, (D) 200-hPa temperature, (E) 700–500-hPa relative humidity, (F) 850-hPa relative vorticity, (G) 200-hPa divergence, and (H) 850–200-hPa VWS. Black crosses denote values significant at the 0.05 level based on a Student’s t-test. Green boxes denote the two focus regions of this study.
Figures 4F–H displays differences in dynamic variables during JJASON between 1970–1994 and 1995–2019. There are no significant changes in 850-hPa relative vorticity and 850–200-hPa VWS over Regions A and B (Figures 4F,H), indicating that changes in these variables related to the low-level environmental circulation have only had minor impacts on TC intensity changes before landfall. By contrast, significant increases in 200-hPa divergence are found over both Regions A and B (Figure 4G). The enhanced upper-level divergence favors TC development and subsequently increases ΔV24 before landfall. The above environmental variables exhibit similar features if their long-term trends from 1970–2019 are displayed (figure not shown).
To confirm the relationship between ΔV24 before landfall and environmental variables over Regions A and B, Figure 5 examines JJASON correlations between ΔV24 and environmental variables from 1970 to 2019. Over Region A, there is a significant increasing trend in the average ΔV24, with a slope of 0.18 kt yr−1 (p < 0.01). This increasing trend is much larger than the trend in the basinwide average ΔV24. Changes in average ΔV24 significantly correlate with changes in SST and 200-hPa divergence, with correlation coefficients of 0.34 (p = 0.02) and 0.38 (p < 0.01), respectively (Figure 5A). However, there is no significant correlation between the changes in average ΔV24 and 700–500-hPa relative humidity (r = -0.21; p = 0.14).
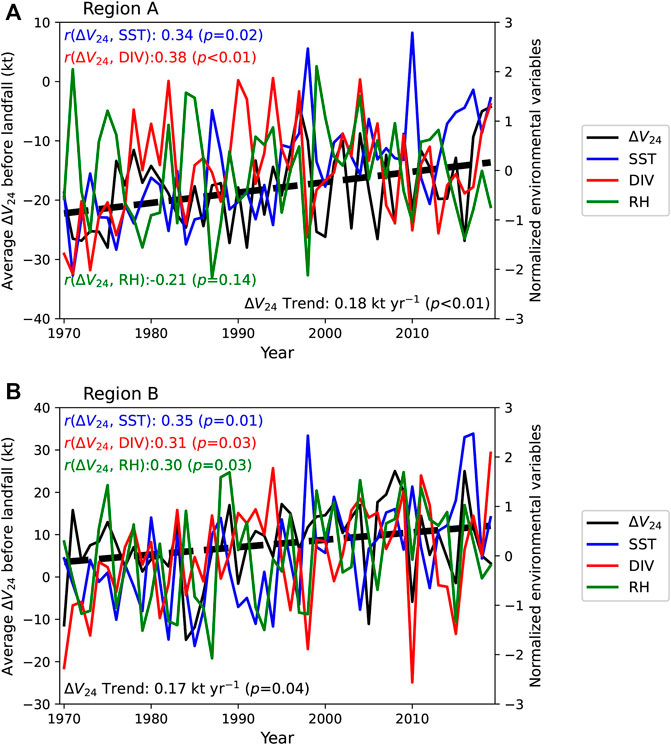
FIGURE 5. JJASON averages of ΔV24 before landfall and environmental variables (SST, 700–500-hPa relative humidity and 200-hPa divergence) from 1970 to 2019 over (A) Region A and (B) Region B. The black dashed lines denote linear trends in the average ΔV24, which are obtained through least squares, while their rates and respective significance levels are shown in the panels.
By comparison, over Region B, the average ΔV24 shows a significant increasing trend of 0.17 kt yr−1 (p = 0.04). The change in average ΔV24 is significantly correlated with changes in SST, 700–500-hPa relative humidity and 200-hPa divergence, with correlation coefficients of 0.35 (p = 0.01), 0.31 (p = 0.03) and 0.30 (p = 0.03), respectively (Figure 5A). Additionally, although SST, MPI, TCHP and 200-hPa divergence significantly increase to the south of Japan (27.5°-35°N, 127.5°-135°E), there are no significant changes in the average ΔV24 before landfall. The lack of trend may be related to the low number of TCs occurring over this region (1.2 TCs per year on average). This low TC frequency can lead to large variability in the annual change of average ΔV24, subsequently reducing the significance of the long-term trend.
This study investigates long-term trends in average ΔV24 before landfall during June-November from 1970–2019. After identifying 4307 24-h tracks before landfall, we display the climatological spatial distribution of their ΔV24s. On average, TCs intensify before landfall near the Philippines and to the southeast of Vietnam, while they weaken before landfall over other coastal regions. There is a significant increasing trend in basin-averaged ΔV24 during 1970–2019, regardless of best track dataset used to identify TCs. This increasing trend is primarily caused by changes in ΔV24 over individual grids, while it is only weakly influenced by changes in the TC occurrence distribution. We find that ΔV24 before landfall increases significantly over the northern SCS (Region A: 17.5°−25°N, 107.5°−120°E) and to the east of the Philippines (Region B: 7.5°−15°N, 122.5°−132.5°E). This implies a weakening decay rate over Region A and an increased intensification rate over Region B for WNP TCs before landfall.
The changes in ΔV24 before landfall over Regions A and B correlate well with changes in several large-scale environmental variables. The greater ΔV24 before landfall over Regions A and B can be linked to a warmer ocean (e.g., higher SST, MPI and TCHP) and greater upper-level divergence in 1995–2019 than in 1970–1994. By comparison, the greater ΔV24 before landfall over Region B is likely also a result of a moister mid-level atmosphere. Our study highlights an increasing tendency of ΔV24 in the WNP before landfall, consistent with trends in ΔV24 over water and over land (Bhatia et al., 2019; Liu et al., 2020).
The original contributions presented in the study are included in the article/Supplementary Material, further inquiries can be directed to the corresponding author.
QL, JS, and PK contributed to conception and design of the study. QL and JS organized the database and performed the statistical analysis. QL wrote the first draft of the article. JS and PK revised the article. All authors contributed to manuscript and approved the submitted version.
This work was jointly funded by the National Key Research and Development Program of China (2018YFC1507305), the National Natural Science Foundation of China (61827901 and 42175007) and the China Postdoctoral Science Foundation (2020M680789). Klotzbach would like to acknowledge financial support from the G. Unger Vetlesen Foundation.
The authors declare that the research was conducted in the absence of any commercial or financial relationships that could be construed as a potential conflict of interest.
All claims expressed in this article are solely those of the authors and do not necessarily represent those of their affiliated organizations, or those of the publisher, the editors and the reviewers. Any product that may be evaluated in this article, or claim that may be made by its manufacturer, is not guaranteed or endorsed by the publisher.
Bhatia, K. T., Vecchi, G. A., Knutson, T. R., Murakami, H., Kossin, J., Dixon, K. W., et al. (2019). Recent Increases in Tropical Cyclone Intensification Rates. Nat. Commun. 10, 635. doi:10.1038/s41467-019-08471-z
Brand, S., and Blelloch, J. W. (1973). Changes in the Characteristics of Typhoons Crossing the Philippines. J. Appl. Meteorol. 12, 104–109. doi:10.1175/1520-0450(1973)012<0104:citcot>2.0.co;2
Camargo, S. J., and Sobel, A. H. (2005). Western North Pacific Tropical Cyclone Intensity and ENSO. J. Clim. 18, 2996–3006. doi:10.1175/jcli3457.1
Courtney, J. B., Sampson, C. R., Knaff, J. A., Birchard, T., Barlow, S., Kotal, S. D., et al. (2019). Operational Perspectives on Tropical Cyclone Intensity Change Part 1: Recent Advances in Intensity Guidance. Trop. Cyclone Res. Rev. 8, 123–133. doi:10.1016/j.tcrr.2019.10.002
DeMaria, M., Mainelli, M., Shay, L. K., and Kaplan, J. A. (2005). Further Improvements to the Statistical Hurricane Intensity Prediction Scheme (SHIPS). Wea. Forecast. 20, 531–543. doi:10.1175/waf862.1
Emanuel, K. A. (1988). The Maximum Intensity of Hurricanes. J. Atmos. Sci. 45, 1143–1155. doi:10.1175/1520-0469(1988)045<1143:tmioh>2.0.co;2
Hendricks, E. A., Braun, S. A., Vigh, J. L., and Courtney, J. B. (2019). A Summary of Research Advances on Tropical Cyclone Intensity Change from 2014-2018. Trop. Cyclone Res. Rev. 8, 219–225. doi:10.1016/j.tcrr.2020.01.002
Hersbach, H., and Bell, B. (2020). The ERA5 Global Reanalysis. Quart. J. Roy. Meteorol. Soc. 146, 1999–2049 .
Klotzbach, P. J., and Landsea, C. W. (2015). Extremely intense hurricanes: Revisiting Webster et al. (2005) after 10 years. J. Clim. 28, 7621–7629. doi:10.1175/jcli-d-15-0188.1
Knapp, K. R., Kruk, M. C., Levinson, D. H., Diamond, H. J., and Neumann, C. J. (2010). The International Best Track Archive for Climate Stewardship (IBTrACS). Bull. Amer. Meteorol. Soc. 91, 363–376. doi:10.1175/2009bams2755.1
Li, L., and Chakraborty, P. (2020). Slower Decay of Landfalling Hurricanes in a Warming World. Nature 587, 230–234. doi:10.1038/s41586-020-2867-7
Liu, L., Wang, Y., Zhan, R., Xu, J., and Duan, Y. (2020). Increasing Destructive Potential of Landfalling Tropical Cyclones over China. J. Clim. 33, 3731–3743. doi:10.1175/jcli-d-19-0451.1
Rappaport, E. N., Franklin, J. L., Schumacher, A. B., DeMaria, M., Shay, L. K., and Gibney, E. J. (2010). Tropical Cyclone Intensity Change before U.S. Gulf Coast Landfall. Wea. Forecast. 25, 1380–1396. doi:10.1175/2010waf2222369.1
Song, J., Klotzbach, P. J., Duan, Y., and Guo, H. (2020). Recent Increase in Tropical Cyclone Weakening Rates over the Western North Pacific. Geophys. Res. Lett. 47, e2020GL090337. doi:10.1029/2020gl090337
Song, J., and Klotzbach, P. J. (2019). Relationship between the Pacific‐North American Pattern and the Frequency of Tropical Cyclones over the Western North Pacific. Geophys. Res. Lett. 46, 6118–6127. doi:10.1029/2019gl082925
Song, J., Klotzbach, P. J., Zhao, H., and Duan, Y. (2021). Slowdown in the Decay of Western North Pacific Tropical Cyclones Making Landfall on the Asian Continent. Front. Earth Sci. 9, 749287. doi:10.3389/feart.2021.749287
Tuleya, R. E., Bender, M., Knutson, T. R., Sirutis, J. J., Thomas, B., and Ginis, I. (2016). Impact of Upper-Tropospheric Temperature Anomalies and Vertical Wind Shear on Tropical Cyclone Evolution Using an Idealized Version of the Operational GFDL hurricane Model. J. Atmos. Sci. 73, 3803–3820. doi:10.1175/jas-d-16-0045.1
Zhu, Y. -J., Collins, J. M., and Klotzbach, P. J. (2021). Nearshore hurricane Intensity Change and post-landfall Dissipation along the United States Gulf and East Coasts. Geophys. Res. Lett. 48, e2021GL094680. doi:10.1029/2021gl094680
Keywords: tropical cyclone, intensity change, western North Pacific, before landfall, environmental changes
Citation: Liu Q, Song J and Klotzbach PJ (2021) Trends in Western North Pacific Tropical Cyclone Intensity Change Before Landfall. Front. Earth Sci. 9:780353. doi: 10.3389/feart.2021.780353
Received: 20 September 2021; Accepted: 14 October 2021;
Published: 03 November 2021.
Edited by:
Qingqing Li, Nanjing University of Information Science and Technology, ChinaReviewed by:
Jiuwei Zhao, Nanjing University of Information Science and Technology, ChinaCopyright © 2021 Liu, Song and Klotzbach. This is an open-access article distributed under the terms of the Creative Commons Attribution License (CC BY). The use, distribution or reproduction in other forums is permitted, provided the original author(s) and the copyright owner(s) are credited and that the original publication in this journal is cited, in accordance with accepted academic practice. No use, distribution or reproduction is permitted which does not comply with these terms.
*Correspondence: Jinjie Song, c29uZ2ppbmppZUBxcS5jb20=
Disclaimer: All claims expressed in this article are solely those of the authors and do not necessarily represent those of their affiliated organizations, or those of the publisher, the editors and the reviewers. Any product that may be evaluated in this article or claim that may be made by its manufacturer is not guaranteed or endorsed by the publisher.
Research integrity at Frontiers
Learn more about the work of our research integrity team to safeguard the quality of each article we publish.