 Sonam Rinzin
 Guoqing Zhang
 Sonam Wangchuk
- 1State Key Laboratory of Tibetan Plateau Earth System, Resources and Environment, Institute of Tibetan Plateau Research, Chinese Academy of Sciences, Beijing, China
- 2University of Chinese Academy of Sciences, Beijing, China
- 3Department of Geography and Sustainable Development, University of St Andrews, St Andrews, UK
Against the background of climate change-induced glacier melting, numerous glacial lakes are formed across high mountain areas worldwide. Existing glacial lake inventories, chiefly created using Landsat satellite imagery, mainly relate to 1990 onwards and relatively long (decadal) temporal scales. Moreover, there is a lack of robust information on the expansion and the GLOF hazard status of glacial lakes in the Bhutan Himalaya. We mapped Bhutanese glacial lakes from the 1960s to 2020, and used these data to determine their distribution patterns, expansion behavior, and GLOF hazard status. 2,187 glacial lakes (corresponding to 130.19 ± 2.09 km2) were mapped from high spatial resolution (1.82–7.62 m), Corona KH-4 images from the 1960s. Using the Sentinel-2 (10 m) and Sentinel-1 (20 m × 22 m), we mapped 2,553 (151.81 ± 7.76 km2), 2,566 (152.64 ± 7.83 km2), 2,572 (153.94 ± 7.83 km2), 2,569 (153.97 ± 7.79 km2) and 2,574 (156.63 ± 7.95 km2) glacial lakes in 2016, 2017, 2018, 2019 and 2020, respectively. The glacier-fed lakes were mainly present in the Phochu (22.63%) and the Kurichu (20.66%) basins. A total of 157 glacier-fed lakes have changed into non-glacier-fed lakes over the 60 years of lake evolution. Glacier-connected lakes (which constitutes 42.25% of the total glacier-fed lake) area growth accounted for 75.4% of the total expansion, reaffirming the dominant role of glacier-melt water in expanding glacial lakes. Between 2016 and 2020, 19 (4.82 km2) new glacial lakes were formed with an average annual expansion rate of 0.96 km2 per year. We identified 31 lakes with a very-high and 34 with high GLOF hazard levels. These very-high to high GLOF hazard lakes were primarily located in the Phochu, Kurichu, Drangmechu, and Mochu basins. We concluded that the increasing glacier melt is the main driver of glacial lake expansion. Our results imply that extending glacial lakes studies back to the 1960s provides new insights on glacial lake evolution from glacier-fed lakes to non-glacier-fed lakes. Additionally, we reaffirmed the capacity of Sentinel-1 and Sentinel-2 data to determine annual glacial lake changes. The results from this study can be a valuable basis for future glacial lake monitoring and prioritizing limited resources for GLOF mitigation programs.
Introduction
Climate warming, which is more evident across the high mountains than in lowland areas (Liu et al., 2009; Pepin et al., 2015), has led to unprecedented negative glacier mass balances worldwide (Hugonnet et al., 2021), and in particular in the Himalayas (Bolch et al., 2012). Several studies have observed rapid glacier melting and mass loss in the Bhutan Himalaya (BTH) (Gardelle et al., 2013; Bajracharya et al., 2014; Tshering and Fujita, 2016). The melt-water from these glaciers coalesces and accumulates, forming new glacial lakes or expanding existing ones. The formation of proglacial lakes can, in turn, accelerate the melting of glaciers through a positive feedback mechanism (King et al., 2018; King et al., 2019; Tsutaki et al., 2019). Analysis of Landsat series imagery has revealed an increasing number and area of glacial lakes since the 1990s across the globe (Shugar et al., 2020), in High Mountain Asia (Wang et al., 2020; Chen et al., 2021), the Third Pole region (Zhang et al., 2015) and in the Himalayas (Nie et al., 2017). For example, from 1990 to 2015, glacial lakes in the Himalayas have expanded by approximately 14% (Nie et al., 2017), with the eastern Himalayas, the location of the Bhutan Himalaya, having the highest expansion rate (Gardelle et al., 2011; Nie et al., 2017). These observations have been broken down to the regional level, with for example the Nepal Himalaya exhibiting a 181% increase in lake number and 82% increase in lake area from 1977 to 2017 (Khadka, 2018). In the central Himalaya, about 110% increase in the glacial lake area between 1964 and 2017, has been observed in the Poiqu River basin, while, in the north-western Indian Himalayas, 77 glacial lakes with area ≥0.001 km2 appeared between 1971 and 2011 (Prakash and Nagarajan, 2017a). However, as far as we are aware, there have been no robust studies to date focusing exclusively on glacial lake expansion in the Bhutan Himalaya.
The Landsat series imagery, available since 1972, is the most convenient data set for studying glacial lake evolution across the high mountains. However, past studies based on Landsat imagery are limited to the period since the 1990s and to more extended temporal scales such as those required for decadal studies (Zhang et al., 2015; Nie et al., 2017; Wang et al., 2020). Thus, glacial lake changes before the 1990s and at shorter temporal resolutions are not well understood. The Sentinel-2 multi-spectral instrument (MSI), with a spatial resolution of 10 m and a 5-day revisit cycle, is ideal for examining high-frequency glacial lake change behavior, although it has been available only since 2016 (Copernicus, 2021a). Likewise, the declassified Corona KH-4, available since 1962, provides an excellent historical data archive to catalog glacial lakes since the 1960s. Sentinel-1 synthetic aperture radar data (SAR) provides excellent complementary data for glacial lake mapping, overcoming the challenges, such as cloud cover contamination, inherent in optical data (Wangchuk and Bolch, 2020).
The normalized difference water index (NDWI) (McFeeters, 1996) is by far the most preferred method for mapping glacial lakes (Huggel et al., 2002; Bolch et al., 2011). However, despite improvements to shadow modeling with DEM (Huggel et al., 2002) and threshold segmentation (Li and Sheng, 2012), glacial lake mapping with NDWI needs substantial post-processing and is subject to both omission and commission errors. This requirement for post-processing renders lake mapping covering large spatial scales and multiple time periods an onerous task (Zhang et al., 2015). Recently, optimized methods, using machine learning algorithms such as neural networks, logistic regression (Lee et al., 2020), and random forest classifiers (Dirscherl et al., 2020; Wangchuk and Bolch, 2020), have provided promising approaches to overcome the challenges of the conventional methods.
One of the most noticeable consequences of the emergence and expansion of glacial lakes in the alpine mountains is the glacial lake outburst flood (GLOF), a sudden release of a hazardous volume of water typically caused by overtopping triggered by mass movement and gradual or sudden dam failure (Richardson and Reynolds, 2000). Fifty-one GLOF events have been reported in the Himalayas (Nie et al., 2018). Similarly, since the 1950s, 18 GLOF events were reported in the Bhutan Himalaya (see Supplementary Table S1) (Komori et al., 2012; Gurung et al., 2017; NCHM, 2019b), the most recent being the breaching of subsidiary lake II of Thorthormi Tsho in 2019 (NCHM, 2019b) and the GLOF from Lemthang Tsho in the Mochu basin in 2015 (Gurung et al., 2017).
GLOFs are characterized by sudden onset, long-runout distance, high-magnitude discharge, with a high velocity, and a tendency to flow over the existing flood plains, which are often densely populated. These features render GLOFs by far the most dangerous form of flooding (Worni et al., 2014). In the Himalayan region, past GLOF events have caused huge damage to life and property in downstream settlements (Bajracharya et al., 2007; Wang et al., 2015; Gurung et al., 2017; Luo et al., 2021). In the Bhutan Himalaya, the GLOF from Lugge Tsho in July 1994 was the most devastating. The flood released 17.2 ± 5.3 m3 × 106 m3 of water (Fujita, 2008) with a peak discharge rate of 2,539 m3 s−1, and the flood wave reached almost 200 km downstream (Richardson and Reynolds, 2000). It killed 21 people, affected 91 households, and severely damaged Punakha Dzong (Watanbe and Daniel, 1996; Osti et al., 2013), the former capital and administrative center of the Royal Government of Bhutan.
Based on the insights gained from past studies, the causes of GLOFs can be categorized into two broad parameters; dam stability and the possibility of triggering events (Richardson and Reynolds, 2000; Emmer and Cochachine, 2013). They are alternatively referred to as dynamic causes and long-term causes (dam self-destruction), respectively (Yamada, 1998). However, dam failure usually occurs due to the effects of specific triggering agents. Thus, GLOFs are usually caused by a cascade of multiple factors rather than a single, standalone factor (Worni et al., 2014). The dynamic causes of GLOF include slope movement (ice/snow avalanche, landslide/rockfall), earthquake, upstream GLOF, and the blockage of underground outflow channels (Emmer and Cochachine, 2013). The long-term causes are related to dam stability and are parameterized employing attributes such as dam width-to-height ratio, dam crest width, presence of permafrost and buried ice, and freeboard height are used to determine dam stability (Worni et al., 2012; Worni et al., 2013). Investigations into the causes of GLOFs worldwide have revealed that dynamic causes are four times more common than long-term causes, with ice avalanches being the most prominent cause. These detailed GLOF hazard parameters are considered when the hazard assessment focuses on a small area or a few selected lakes (Rounce et al., 2016; Prakash and Nagarajan, 2017b). In contrast, the broader study area coverage accounted for only a few generalized factors (Allen et al., 2019; Zheng et al., 2021). However, free availability of data and the possibility of automation are key considerations for first-order hazard assessment (Bolch et al., 2011; Anacona et al., 2014).
In the Bhutan Himalaya, the first-ever inventory by International Centre for Mountain Development (ICIMOD) using topographic maps for the period between 1950 and 1999 has mapped 2,677 (105.8 km2) glacial lakes, out of which 24 were identified as potentially dangerous glacial lakes (PDGLs) (Mool et al., 2001). The Bhutan-Japan joint project itemized 733 lakes, corresponding to a total area of 82.5 km2, using ALOS imagery for 2006–2011 (Ukita et al., 2011). However, neither of these studies reported on glacial lake change in the Bhutan Himalaya. Recent research covering all of High Mountain Asia has noted 114 (9.8 km2) new lakes that formed between 1990 and 2018 (Wang et al., 2020). A similar study by Chen et al. (2021) indicated an annual lake area expansion rate of 0.95 km2 per year in the BTH. In addition, a glacial lake hazard assessment for the Third Pole region identified 85 highly-hazardous lakes and 115 very highly-hazardous lakes (Zheng et al., 2021), and projected the emergence of an increasing number of PDGL under the current climate warming scenario. However, studies covering large-scale areas such as the Third Pole and High Mountain Asia are unlikely to provide a robust representation of the expansion and GLOF hazard status of glacial lakes in the BTH. On the other hand, a total of 226 glacial lakes are known to have positive flood volume (Nagai et al., 2017). GLOF analysis of typical representative proglacial lakes has revealed vulnerable communities downstream, such as Punakha Town and Lobesa in the Phochu basin (Osti et al., 2013) and Bjizam and Tingtingbi in the Mangdechu basin (Koike and Takenaka, 2012). This analysis shows that Bhutanese glacial lakes pose a substantial risk of flooding to downstream settlements while there is a lack of robust understanding of glacial lake expansion and their GLOF hazard. There is, therefore, a need for comprehensive glacial lake studies, such as inventory and GLOF hazard assessment, in the Bhutan Himalaya.
In this study, we created comprehensive historical and up-to-date glacial lake inventories for the BTH using Corona KH-4, Sentinel-2, and Sentinel-1 data. We examined glacial lake distribution and expansion since the 1960s. We also conducted GLOF hazard assessment and identified and updated potentially dangerous glacial lakes in the Bhutan Himalaya using the most recent datasets and “Analytical Hierarchy Process” (AHP) techniques. In addition to filling the knowledge gap mentioned above, this study will form the basis for relevant stakeholders to make proper policy and decisions related to the GLOF resilience and mitigation programs in Bhutan.
Data and Methods
Study Area
Bhutan is a landlocked country bordered by China in the north and India in the south. The landscape is mainly dominated by high mountains and rugged terrain with an elevation ranging from 200 to 7,000 m a.s.l. (Mool et al., 2001). It has a total area of 38,394 km2 and, as of 2018, a population of 734,374 (NSB, 2019). It consists of three broad climatic zones; subtropical in the southern foothills, temperate in the central valleys and inner hills, and alpine in the northern parts. The south-western monsoon originating in the Bay of Bengal governs the summer monsoon (Mool et al., 2001), which starts in late May and lasts until August. In 2017, the total annual rainfall was 1,816.74 mm, while the average yearly maximum and minimum temperatures are 22.3 and 12.3°C, respectively (NCHM, 2018). Figure 1 shows how the monthly mean, minimum and maximum temperatures and precipitation all increase from January to reach their peak values in July or August before falling in the remainder of the year.
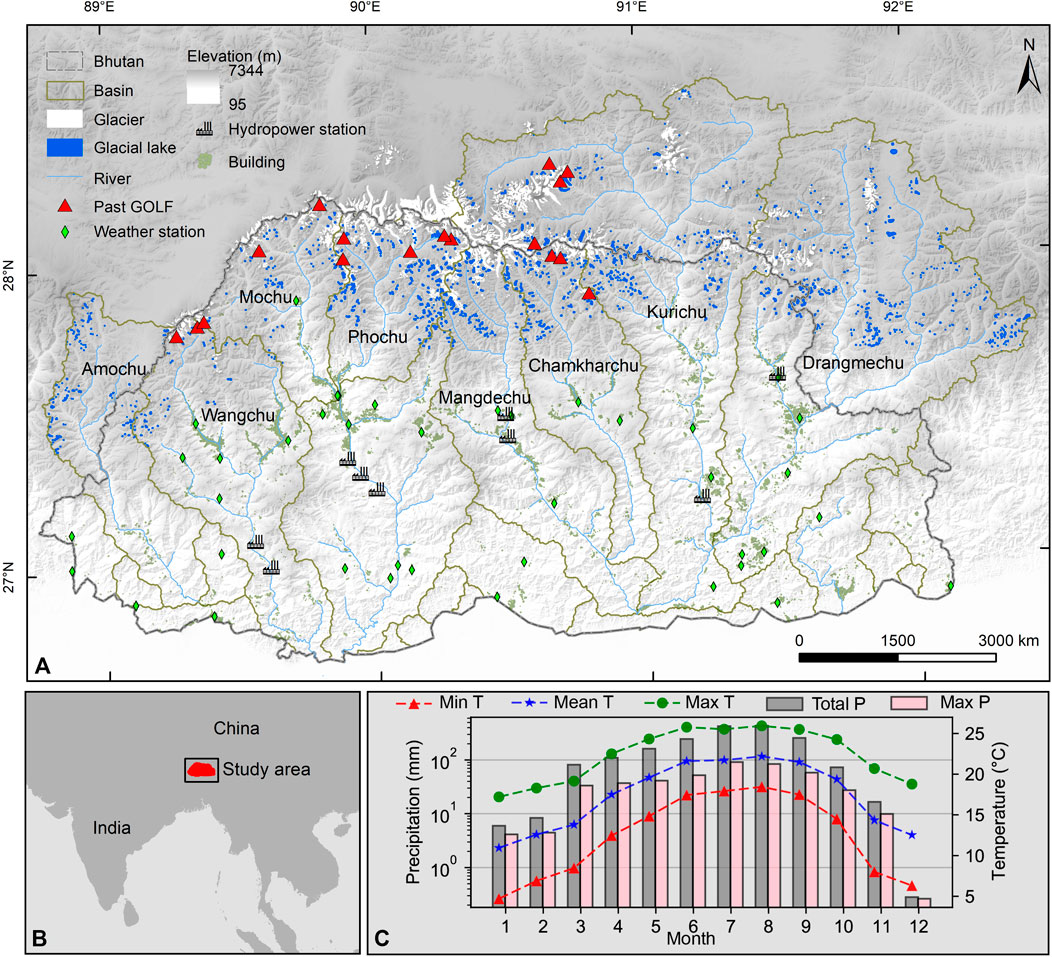
FIGURE 1. The setting of the Bhutan Himalaya. The map (A) shows the distribution of glaciers (Nagai et al., 2016), glacial lakes (Wang et al., 2020), historical GLOFs (Komori et al., 2012), hydropower stations, and built-up areas in the eight basins. The base map indicates the elevation change as per SRTM-30 m. The map (B) depicts the location of the Bhutan Himalaya. The line and bar charts (C) represent the monthly temperature (T) and precipitation (P) in 2017 as per the latest records maintained by NCHM (2018) derived from 42 weather stations across the country. Basin boundaries and river networks were delineated from SRTM-30 m using the hydrology toolset. The administrative boundary of Bhutan was downloaded from https://data.humdata.org/dataset/bhutan-administrative-boundaries-levels-0-2. It should be noted that the study area extends into Tibetan Autonomous Region (TAR), China and Arunachal Pradesh, India on the eastern side, and TAR on the western side due to transboundary glacial-fed rivers that flow into inland Bhutan.
Numerous glacier-fed rivers originate from the northern Himalayan mountains, providing essential ecological and livelihood services to settlements downstream. The rapid flow of these rivers coupled with the rugged terrain also presents an excellent opportunity to generate hydropower electricity (Tshering and Tamang, 2004; Farinotti et al., 2019). The river system in Bhutan is commonly divided into eight basins: Amochu, Wangchu, Phochu, Mochu, Chamkharchu, Mangdechu, Kurichu, and Drangmechu. Three of these river systems, namely Amochu, Kurichu, and Drangmechu, are transboundary. Amochu, which flows along the most western corner of Bhutan, originates in the TAR. In the east, the Kurichu flows from TAR, while the Drangmechu flows partly from TAR and partly from the state of Arunachal Pradesh in India (Katel et al., 2015).
The Bhutan Himalaya (Figure 1) contains 1,583 glaciers (1,487 ± 235 km2), of which 219 are debris-covered glaciers (951 ± 193 km2), and 1,364 are clean-ice glaciers (536 ± 42 km2) (Nagai et al., 2016). The debris-covered glaciers account for about 64% of the total. The total glacier cover accounts for about 4% of the total land cover in Bhutan (Nagai et al., 2016). In the Bhutan Himalaya, the glaciers have suffered an area loss of 23.3 ± 0.9% from 1980 to 2010 (Bajracharya et al., 2014), and, from 2000 to 2010, a mass loss ranging from 0.14 to 0.25 ± 0.13 m w.e.a−1, with a thinning rate of 0.50 ± 0.14 m a−1 (Gardelle et al., 2011). In-situ measurements have revealed that the Bhutanese glaciers have experienced comparatively higher mass loss than glaciers in the neighboring eastern Himalayan and southeastern Tibetan Plateau regions (Tshering and Fujita, 2016). Unfortunately, it is projected that the Bhutanese glaciers will undergo continuous and more rapid melting in the future, in response to current climate warming (Rupper et al., 2012). The recent inventory of High Mountain Asia lists 1,576 glacial lakes with a total area of 127.97 km2.
Data
Sentinel-2 MSI imagery with 10 m ground resolution provides superior earth surface information to Landsat imagery or any other freely available optical imagery (Copernicus, 2021a). For example, the band combinations and indices available in Sentinel-2 imagery, such as NDWI, false and natural composite, are nine times more detailed than corresponding band combinations from Landsat-8 (Nagy and Andreassen, 2019). The combination of the Sentinel-2A and Sentinel-2B constellation is also superior in terms of temporal resolution, with its 5-day revisit cycle at the equator and once in 2–3 days in mid-latitudes (Copernicus, 2021a). Here, Sentinel-2 multispectral image, Level-1c, top-of-atmosphere (TOA) reflectance corrected data was used for mapping glacial lakes from 2016 to 2020. The data were downloaded from the Copernicus Open Access Hub (https://scihub.copernicus.eu/). We chose images from November and October when the glacial lakes reach their post-monsoon maximum extent. This period also has the advantage of having low perennial snow and cloud coverage (Zhang et al., 2015), making the image selection process easier.
The Sentinel-1 mission consists of a constellation (A and B) of two polar-orbiting satellites, each with a 12 days revisit cycle, thus enabling collective temporal coverage every 6 days. It operates day and night and performs C-band synthetic aperture radar imaging, allowing image acquisition regardless of weather conditions (Copernicus, 2021b). Here, Sentinel-1 data was used to compliment the Sentinel-2 data to enable the mapping of glacial lakes from 2016 to 2020 which were missed by Sentinel-2 due to cloud coverage and other associated complications. The interferometric wide (IW) swath mode GRD-1 products with a spatial resolution of 20 m × 22 m in the range and azimuth directions were used. We chose VV polarization, as the water surface is more sensitive to the co-polarized wave (Wangchuk et al., 2019).
Declassified satellite data, Corona KH-4, was used to map historical glacial lakes from the 1960s. The Corona KH-4 system carried two panchromatic cameras and produced high-resolution images (∼2.7 m) between 1962 and 1972 (U.S. Geological Survey, 2008). After declassification of the Corona satellite data in 1995, KH-4 has been used in various environmental change studies (Song et al., 2015; Goerlich et al., 2017). Because of its high ground resolution, it has also been used in mapping historical glacial lakes such as in the northern Tien Shan (Bolch et al., 2011) and Poiqu River basin (Central Himalaya) (Zhang et al., 2019). KH-4 data covering the entire Bhutan Himalaya was downloaded from the USGS online portal (https://earthexplorer.usgs.gov/). Cloud cover was the major challenge while selecting the KH-4 data, but as our study area was relatively small, we were able to find multiple numbers of tiles covering the same area, which meant that it was not too difficult to obtain appropriate images. A few lakes could not be identified in the KH-4 data due to extreme cloud coverage in the available imagery. In such instances, we used hexagon KH-9 data to fill the gaps. The KH-4 data were from 1962 to 1972, while the KH-9 data were from 1973 to 1974, so there was not a substantial time difference between these two image sets.
We used the SRTM-30 m digital elevation model (DEM) as the primary remote sensing data to determine the geomorphometric characteristics of the lake surroundings for GLOF hazard assessment (Huggel et al., 2002; Huggel et al., 2003; Romstad et al., 2008; Wang et al., 2015). Specifically, we employed the DEM to quantify the lake-surrounding topographic potential for landslide or ice/snow avalanche into the lake and to determine the steep lakefront area (SLA). SRTM-30 m was also used as ancillary data for glacial lake mapping from 2016 to 2020. The SRTM-30 m data were available from the USGS online portal system.
We used glacier polygons to determine the lake-glacier distance threshold and avalanche-prone areas. The Randolph Glacier Inventory version 6.0 (RGI Consortium, 2017) and GAMDAM (Sakai, 2018) provides a glacier data set covering the high mountains throughout the world. However, its accuracy is relatively low when considering highly localized areas such as the Bhutan Himalaya, and so, for avalance mapping, we used the glacier inventory of Bhutan by Nagai et al. (2016) which is purely focused on the Bhutan Himalaya and has better local accuracy. However, owing to their multi-temporal coverage, the RGI v6.0 glacier data sets (RGI Consortium, 2017) were used to determine the threshold lake-glacier distance. Table 1 presents a summary of all the data used in the study.
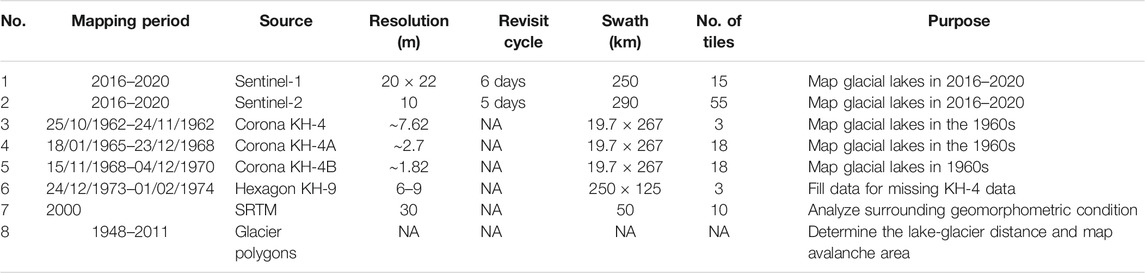
TABLE 1. Summary of data used for glacial lake mapping and hazard assessment in the Bhutan Himalaya.
Glacial Lake Mapping
We used the GlakeMap python package (Wangchuk and Bolch, 2020) to map glacial lakes from 2016 to 2020. GlakeMap is an automated machine learning-based method developed using the sci-kit-learn, snappy, and arcpy python libraries. The package enables the complementary combination of multi-source source data such as normalized difference water indices (blue and green) and radar backscatter and reaps the benefits of the strength of each data source. Such complementary combinations are principally chosen through rules-based image segmentation and the machine learning algorithm “random forest classifier.” The proposed method has been tested in several high mountain areas worldwide, including the Bhutan Himalaya, and has achieved average detection and delineation accuracies of 97.87 and 98.95%, respectively. Firstly, NDWI(green) and NDWI(blue) from Sentinel-2 were calculated using Eqs 1 and 2, and then the Sentinel-1 data were processed to calculate radar backscatter. We performed rules-based image segmentation of NDWI indices and radar backscatter to derive the rough polygons for all the glacial lakes. Six predictor data sets were prepared: NDWI (green), NDWI (blue), NIR infrared band, radar backscatter, slope, and compactness ratio (calculated using Eq. 3). The glacial lakes were then delineated based on the initial lake polygons derived from image segmentation and attributes in the predictor data sets by the random forest classifier model. All these procedures were executed automatically using the GlakeMap package. Wangchuk and Bolch (2020) provide more methodological details. The glacial lake polygons were then laid over the false-color composite of Sentinel-2 and manually verified. Further validation of the lake polygons was done using high-resolution imagery available in Google Earth.
where CR is compactness ratio, A is the area of a lake, and p is the perimeter of a lake.
We used the Corona KH-4 data to map glacial lakes in the 1960s. These images are not geometrically corrected and suffer from a significant geometric distortion. The images were co-registered by collecting 90–100 ground control points from the Sentinel-2 data using a geo-referencing toolset in the ArcGIS software. The high (10 m) resolution of the Sentinel-2 data makes it more suitable to use for this purpose than other freely available remote sensing imageries. The KH-4 images are single band, panchromatic images (Dashora et al., 2007), so the glacial lakes were manually digitized based on expert judgment. However, a single band image does provide substantial contrast between the lake and surrounding areas due to its high resolution. When the scenes were complicated by cloud cover and shadows cast by mountains, alternative scenes were used from other months or years. For the process of finding alternative images, the multiple numbers of images available between 1962 and 1970 covering the Bhutan Himalaya was advantageous, but when no alternative images were found, we used Hexagon KH-9 data to fill the data gap. A total of three hexagon KH-9 were used, and 78 lakes, missing in the KH-4 imagery, were mapped from the KH-9 data. The glacial lake mapping procedure is summarized in Figure 2.

FIGURE 2. Flowchart of glacial lake mapping and hazard assessment in the Bhutan Himalaya.
The glacial lakes are mostly the meltwater from current or past glaciers and ice fields/caps accumulated on a favorable topography (Dimri et al., 2016; Otto, 2019). Here, glacial lakes were identified as any lake located within the 10 km buffer distance from the glacier terminus following the earlier studies (Wang et al., 2013; Zhang et al., 2015). The RGI v6.0 glacier inventory data (RGI Consortium, 2017) was used to determine this threshold distance. Based on the hydrological relationship between the lake and the nearest glacier terminus identified from high-resolution Google Earth images, the glacial lakes were classified into four categories: non-glacier-fed, glacier-unconnected, glacier-connected, and supraglacial lakes (Ageta et al., 2000). The minimum lake area delineated was chosen to be 0.003 km2, as the main purpose of this inventory was to produce baseline glacial-lake data for the Bhutan Himalaya.
Since the lake polygons were manually corrected using the Sentinel-2 data after the automatic mapping process, we estimated the error associated with manual mapping from Sentinel-2. Based on the quality of satellite imagery, the error area of the glacial lakes is about 0.5 pixels (Fujita et al., 2009). Because the pure lake water pixels are usually surrounded by a mixture of water and non-water pixels, the maximum area error of glacial boundary extraction is estimated roughly to be half the area of the edge pixels (Wang et al., 2020). The manually delineated lakes are assumed to have a regular/Gaussian distributed error area. So, the lake error within one standard deviation (1σ) was calculated using the equation (Hanshaw and Bookhagen, 2014).
where p is the perimeter of the glacial lake (m), G is the spatial resolution of a satellite image, 0.6872 is the coefficient under 1σ, E is the relative error of the glacial lake, and A is the total area of the glacial lake (Wang et al., 2020).
GLOF Hazard Assessment
GLOF hazard assessment is mainly concerned with quantifying the likelihood and magnitude of occurrence of GLOF (Allen et al., 2016; Wang et al., 2015). Indicators such as lake area and volume, mass movement entering into glacial lakes, the moraine width to height ratio, the height of freeboard, lake geometry, and distance between the lake and the glacier terminus are commonly used (Bolch et al., 2011; Emmer and Vilímek, 2013; Worni et al., 2013; Aggarwal et al., 2017; Nagai et al., 2017; Frey et al., 2018). However, for first-order hazard assessment, attributes such as causes of historical GLOF, availability and applicability of remote sensing data, and suitability of automation are commonly employed (Bolch et al., 2011) (Supplementary Table S2). Accordingly, here we selected the following hazard assessment factors: 1) ice/snow avalanche, 2) landslide/rockfall, 3) steep lakefront area (SLA), 4) lake area expansion 5) upstream GLOF, 6), glacier-lake distance 7) lake area. Assuming that the differing intensity of the particular factor poses a varying degree of GLOF hazard to the lake, the quantified value of each element was categorized into three or two alternative classes: high, medium, and low (Table 2). Based on the previous literature, we assigned an index value of 1 to high, 0.5 to medium, and 0.25 to the low alternative classes (Bolch et al., 2011). A summary of this GLOF hazard assessment process is provided in Figure 2.
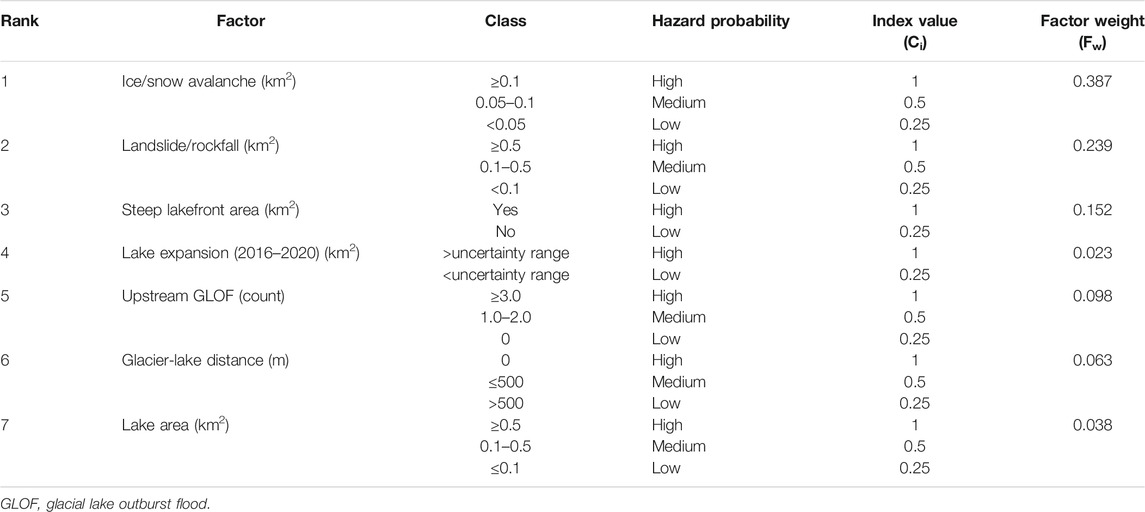
TABLE 2. Selected factors with classes and associated index values. The weight of each factor is computed using the AHP.
We calculated the GLOF hazard factors 1) ice/snow avalanche and 2) landslide/rockfall using the topographic tsunami generating potential of the lake surrounding terrain. This method identifies any potential release cells within the vicinity of a lake, considering slope as the single most important criterion. It is based on the assumption that the probability of detachment of a mass of tsunami generating potential is higher on the steep slopes directly above the lake than on more distal slopes. Initially developed by Romstad et al. (2008), the model has been used to map topographic potential for glacial lakes in the Swiss Alps (Schaub, 2015), northeast India (Allen et al., 2016), Tibetan Plateau (Allen et al., 2019) and the Third Pole (Zheng et al., 2021). Here, following Allen et al. (2019), the topographic potential area was defined as a 30° slope within the lake’s watershed area and with a threshold reach angle of 15°. The slope of the area surrounding the lake was derived from the SRTM-30 m data. The pixels within the potential topographic area which are covered by glacier were then identified as the avalanche-prone area, while those without glacier covering were considered to form the landslide/rockfall prone area. An avalanche area of more than 0.1 km2 was assigned a high index value, 0.05–0.1 km2 a medium value, and less than 0.05 km2 a low value. Here, the lower limit avalanche of 0.05 km2 was considered at par with the minimum size of the lake selected for this hazard assessment assuming that an avalanche of any volume may cause GLOF magnitude of the same volume. Because large landslide/rockfall areas were widespread across the sampled lakes, with for example, 78.4% of the sampled lakes found to have a landslide area of 0.1 km2, while only 21.9% of the sampled lakes were found to have a simillarly sized avalanche area, we followed a slightly different weighting categorization for landslide-zone quantification. Areas larger than 0.5 km2 were assigned a high value, those in the range 0.1–0.5 km2 a medium value and those less than 0.1 km2 a low value.
The type of damming material and its geometry determine a dam’s stability (Wang et al., 2011). The dam width-to-height ratio, dam crest width, presence of permafrost, buried ice, and freeboard height (Worni et al., 2013; Worni et al., 2014) are widely used to determine dam stability. However, identifying these dam parameters is difficult with existing freely accessible satellite data. Fortunately, the steep lakefront area (SLA), which is based on the depression angle between the flat lake surface and the surrounding terrain, is an excellent alternative measurement of the width-to-height ratio. The steepest elevation angle from a particular point towards the lake surface is considered as a value for SLA (Fujita et al., 2013). The SLA has been widely considered for hazard assessment, for example in the Himalayas in India (Dubey and Goyal, 2020) and Nepal (Rounce et al., 2016). Here, we identified the SLA by following the model developed by Fujita et al. (2013), which uses the minimum threshold angle of 10° within the buffer distance of 1 km from the lake shoreline. We gave a high index value to lakes with an SLA and low values to those without. However, bedrock-dammed lakes were considered to be stable (Huggel et al., 2002) and were, therefore, assigned a low hazard value even if they had an SLA.
Lake expansion is one of the crucial criteria for hazard assessment (Bolch et al., 2011; Anacona et al., 2014; Rounce et al., 2016; Allen et al., 2019) as it influences the volume of water available for GLOF (Richardson and Reynolds 2000). Glacial lake expansion also intensifies the lake’s vulnerability to potential hazards such as mass movement (Rounce et al., 2016). The threshold expansion percentage used by previous studies was based on the length of the study periods. For example, a threshold of more than 100% expansion was employed for a 40°years study period in the Sikkim Himalayas (Aggarwal et al., 2017), while a threshold of 20–50% expansion over a 20°year period was used in Nepal Himalayas (Khadka et al., 2018). We did not use glacial-lake area change from the 1960s to 2020, despite the data being available, because some glacial lakes have expanded significantly since the 1960s but have now attained their full extent and stopped expanding. Instead, when the expansion within the last 5 years (2016–2020) was greater than the uncertainty range, we assigned a high index value. When the growth was less than the uncertainty range or the lake had undergone recession a low index value was assigned.
A GLOF from upstream lakes is one form of mass movement that can cause a breach of the main lake downstream. Because it has high erosion and transport potential (Breien et al., 2008), it can produce displacement or tsunami waves equivalent to those caused by slope moments of the same magnitude (Emmer and Cochachine, 2013). In Bhutan, the most recent impactful GLOF of Lemthang Tsho was caused by the breaching of upstream supraglacial lakes (Gurung et al., 2017). We considered any upstream lake of size ≥0.01 km2 as a potential danger to downstream glacial lakes. According to Emmer and Cochachine (2013), all glacial lakes are hazardous as they are susceptible to at least one form of GLOF scenario. Therefore, we considered all upstream glacial lakes as a potential GLOF hazard source to the downstream lake without performing separate hazard assessments. We assigned a high index to lakes with ≥3 upstream lakes, a medium index to lakes with 1–2 upstream lakes, and a low index to lakes with no upstream lakes.
Glacial lakes expand due to the addition of melt-water from ice or thinning of the moraine dam and by a cumulative discharge of water from the ablation and calving of the glacier at the proximal end of the lake (Richardson and Reynolds, 2000). The distance and slope between the lake and the mother glacier determine the lake-glacier interaction (Wang, 2011). GLOFs in the Himalayas (Khadka et al., 2021) and on the Tibetan Plateau (Wang et al., 2011) have been within 0–700 and 0–800 m lake-glacier distance, respectively. In the Bhutan Himalaya, out of 13 identifiable lakes with a GLOF history, at least two lakes have a lake-glacier distance of 1,000 m. Therefore, here, we used a maximum threshold lake-glacier distance of 1,000 m. This is also the value used by Allen et al. (2019) for the region-wide hazard assessment of lakes in the Tibetan Plateau. We measured glacier-lake distance using the RGI v6.0 (RGI Consortium, 2017) glacier dataset. High, medium, and low indices were assigned for glacier-lake distances of 0 m (contact with glacier), 0–500 m, and 500–1,000 m, respectively.
Lake area is a widely used factor for assessing GLOF susceptibility, as larger lakes present a greater GLOF hazard than smaller ones. Larger glacial lakes are typically deeper with a larger volume, which means higher potential flood volume and greater hydrostatic pressure on the damming wall (Richardson and Reynolds 2000). Here, lake area was calculated from the lake polygon extracted from the Sentinel-1 and Sentinel-2 data. A glacial lake size of 0.01 km2 is considered large enough to present a significant hazard to downstream settlements (Nagai et al., 2017). When considering regional scale hazard assessment, an area threshold of 0.1 km2 is also reasonably used (Allen et al., 2019). Based on 51 past GLOF events in the Himalayan region, Nie et al. (2018) have recommended a minimum area threshold of 0.05 km2 for hazard assessment. In the Bhutan Himalaya, out of 13 existing lakes with a GLOF history, 10 have an area ranging from 0.01 to 0.06 km2. Therefore, we used a minimum area threshold of 0.05 km2. We assumed that GLOF magnitude will increase with increasing area, and so we assigned indices as follows: low for lakes <0.05 km2, medium for lakes in the range 0.05–0.1 km2, and high for those with area >0.1 km2.
Hazard Factor Weighting and Hazard Score Calculation
The different hazard factors have varying degrees of contribution to the GLOF hazard potential of lakes. Thus, assigning a weight to each variable is deemed necessary (Wang et al., 2011) to realize the objective hazard classification of the lakes. The seven factors determined in this study were weighted using AHP (Table 3). AHP is a multicriteria decision-making technique that quantifies subjective expert judgment by assigning values through pairwise comparison. The pairwise comparison enables prioritizing the available alternative options by estimating their relative significance (Saaty, 2008). The AHP technique also ensures consistency of the subjective judgment (Saaty, 2008) which is challenging to maintain in other semi-quantitative methods of GLOF hazard assessment (Emmer and Vilímek, 2013). AHP has been widely used in GLOF hazard assessment worldwide and particularly in the Himalayas (Anacona et al., 2014; Aggarwal et al., 2017; Prakash and Nagarajan, 2017b; Khadka et al., 2021).
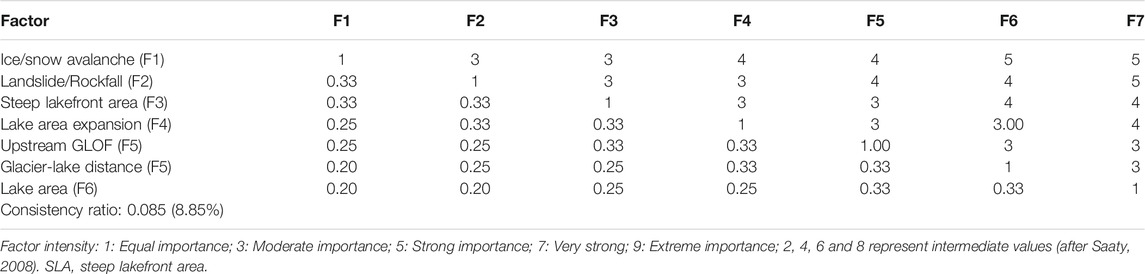
TABLE 3. Pairwise comparison of outburst factors and consistency ratio based on AHP.
Here, our expert judgment for the priority ranking was influenced by the previous causes of GLOFs in the Bhutan Himalaya and its neighboring Himalayan regions and following the convention in the existing literature. We assigned the highest rank to ice/ice snow avalanche followed by landslide/rockfall. The majority past GLOF events in Bhutan (55.6%) (Komori et al., 2012; NCHM, 2019a) (Supplementary Figure S1) and Himalayas (53%) (Richardson and Reynolds, 2000) were caused by ice avalanches or glacier advances. Landslide/rockfall was assigned the second rank as it is the key component of mass movement. In some previous studies (Allen et al., 2016; Allen et al., 2019; Zheng et al., 2021), ice/snow avalanches and landslides are often treated as one integrated factor. This assumes that the landslide area may provide an alternative representation of the avalanche area in case of uncertainty resulting from the data and method. We also assigned a relatively high ranking to SLA, considering it a first-order indicator of dam stability (Richardson and Reynolds, 2000; Hegglin and Huggel, 2008; Emmer and Vilímek, 2013). Lake area was ranked lowest because our initial screening criteria already considered a minimum area of lake that may cause considerable damage to downstream settlements. Accordingly, the paired-wise comparison matrix was constructed, and weights for each factor (Fw) were determined (Table 3) with an overall consistency ratio of 0.085 (8.85%). The final index of each factor (Fi) was calculated as the product of class index (Ci) and factor weight (Fw) using Eq. 6. The hazard score of the lake was calculated as an average score of all factor index values using Eq. 7. Finally, the hazard score of each lake was normalized to a value ranging from 0 to 1. Here, based on the hazard score, the hazard potential of the lake was categorized into five groups, namely, very low (0–0.2), low (0.2–0.4), medium (0.4–0.6), high (0.6–0.8) and very high (0.8–1.0).
Hazard Assessment Method Validation
Our GLOF hazard assessment relies on well-established methods and past GLOF experience in the context of the Bhutan Himalaya. However, validation of the hazard-assessment method was still deemed necessary as we relied solely on remote sensing data, which has inevitable uncertainties. GLOF is a high-magnitude, low-frequency natural disaster, thus validation is often tricky (Allen et al., 2019). However, the Bhutan Himalaya has experienced multiple GLOF events which were substantial enough to validate our method. The validation of hazard assessment methods through the use of past GLOF events has commonly been done in previous studies (Anacona et al., 2014; Emmer and Vilímek, 2014; Allen et al., 2019). A total of 23 GLOFs events have been documented in the Bhutan Himalaya (Komori et al., 2012; Gurung et al., 2017; NCHM, 2019a) (Supplementary Table S1). However, five of these events were located on the TAR side of the Himalayas and do not have any hydrological connection with the glacier-fed rivers that flow into the Bhutanese interior. Four of the events are from glaciers, and for another, the lake involved no longer exists due to the complete emptying of water during the GLOF, according to the verification carried out for this study. Out of the 13 remaining events, eight of them fulfilled our initial screening criteria (area ≥0.05 km2 and glacier-lake distance ≤1,000 m) and were used for validation. Although eight lakes out of a total of 278 represents only 2.9%, they do include all the past GLOF events in the region that caused damage to downstream settlements.
Results
Glacial Lake Number and Area Distribution
Using Sentinel-2 and Sentinel-1 imagery, we mapped 2,553 (151.81 ± 7.76 km2), 2,566 (152.64 ± 7.83 km2), 2,572 (153.94 ± 7.83 km2), 2,569 (153.97 ± 7.79 km2) and 2,574 (156.63 ± 7.95 km2) glacial lakes from 2016, 2017, 2018, 2019 and 2020, respectively. A total of 2,187 glacial lakes corresponding to 130.19 ± 2.09 km2 were mapped using historical KH-4 data from the 1960s (Supplementary Table S3). Of the total in 2020, 1,118 (82.92 km2) were glacier-fed lakes. In this inventory, the size of the glacial lakes ranges from 0.003 to 4.30 km2, with a mean area of 0.061 km2 and a standard deviation of 0.17 km2. There were slightly more non glacier-fed lakes (56.6%) than glacier-fed lakes, but the glacier-fed lakes were slightly dominant in terms of areal coverage (52.9%). Thorthormi Tsho, located in the Phochu basin, is the largest glacial lake in this inventory.
We used the 2020 inventory to analyze the distribution of glacial lakes in the BTH (Figure 3). The glacier-fed lakes were chiefly present in the elevation range 4,250–5,500 m a.s.l and had a mean elevation value of 4,810 m a.s.l. Their distribution was most dense in the central part of the BTH, becoming more sparse towards the eastern and western ends. Basin-wise, the Pchochu basin has the highest proportion 28.18% (area) and 22.63% (number), followed by Kurichu 26.35% (area), 20.66% (number). Wangchu with 1.34% (area), 0.78% (number), and Amochu with 2.24% (area), 1.71% (number) basins had the lowest proportion of glacier-fed lakes. Although Drangmechu had the most glacial lakes of all types by both number and area, it only contained 14.7% (number) and 8.9% (area) of the total number of glacier-fed lakes.

FIGURE 3. Distribution of glacial lakes in the Bhutan Himalaya in 2020. The bars display the proportion of all lakes and glacier-fed (G-fed) lakes across the eight basins (A) and in the entire BTH (B). The histogram (C) indicates the distribution of glacier-fed lakes with altitude. The map (D) compares the total area of the glacial-fed lakes (%) among the eight basins and the distribution of non-glacier-fed and different types of glacier-fed lakes based on their size. Pie charts show the percentage ratio of glacier-fed lakes to nonglacial-fed in number (E) and area (F).
A type-wise comparison of the glacial lakes shows that the glacier-unconnected lakes dominate both the number and area (76.9 and 56.7% of the total, respectively). Supraglacial lakes are uncommon, accounting for only 1% of the total area and 4.6% of the total number. Although glacier-connected lakes account for only 18.5% of the total numbers, they make up 42.3% of the total area. The mean area was the largest for glacier-connected lakes (0.17 km2), followed by glacier-unconnected lakes (0.055 km2) and supraglacial lakes (0.016 km2). We did not detect any supraglacial lakes in the Drangmechu basin (Figure 4).
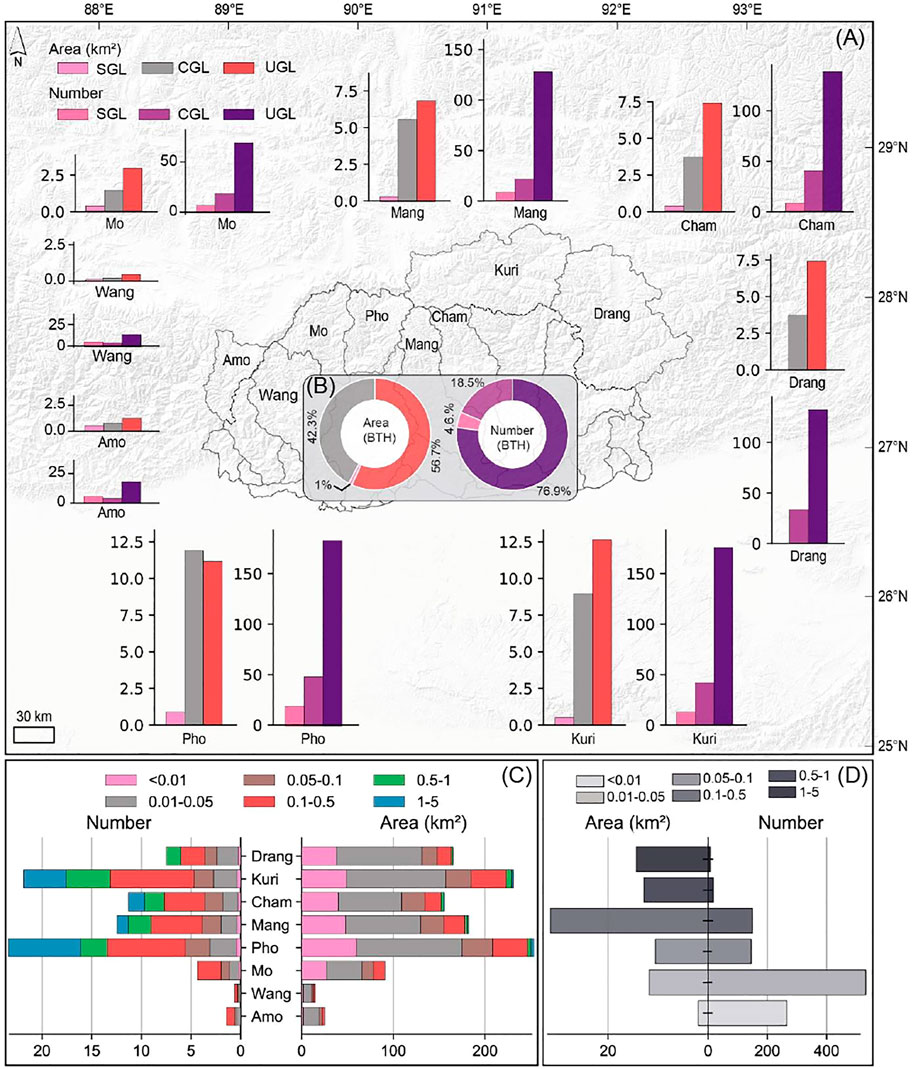
FIGURE 4. Distribution of different types of glacial lakes: supraglacial (SGL), glacier-connected (CGL), and glacier-unconnected lakes (UGL) across the eight basins (A) and in the entire BTH (B). The horizontal bars represent the proportional area and the number of glacial lakes of different size categories across the eight basins (C) and the entire (BTH) (D).
Following Maharjan et al. (2018), we examined the glacial lake distribution for six different size classes (km2) (<0.01, 0.0–0.05, 0.05–0.1, 0.1–0.5, 0.5–1, and 1–5) as shown in Figure 4. Small glacial lakes (<0.1 km2) were most frequent in terms of number (84.34%) while larger glacial lakes (>0.1 km2) formed a major portion of the total area (70.7%). The most common size, in terms of numbers, was 0.01–0.05 (km2) (47.58% of the total), while the 0.1–0.5 range predominance in area (38.0%). The glacial lakes less than 0.01 km2 had the lowest areal coverage (2.33%), and the size class 1–5 km2 had the lowest count (0.62% of the total). There were no glacier-fed lakes in size categories 0.5–1 and 1–5 (km2) in Amochu, Wangchu, or Kurichu basins, while Drangmechu lacked any lakes in the 1–5 (km2) category.
Glacial Lake Expansion Since the 1960s
Over the last 6 decades (1960s−2020), the total number of glacial lakes increased from 2,187 (130.19 ± 2.09 km2) to 2,574 (156.63 km2). The number of glacier-fed lakes increased by 190 (13.77 km2), while the number of non-glacier-fed lakes grew by 200 (12.67 km2). No significant change in the mean size of the glacial lakes was observed between the 1960s (0.059 km2) and 2020 (0.060 km2). The standard deviation of the area of glacial lakes increased slightly, from 0.144 km2 in the 1960s to 0.17 km2 in 2020. The maximum size of the glacial lakes increased from 3.4 to 4.3 km2 over the same period. The number and area of glacier-fed lakes increased across all the basins, with the exception of Amochu and Drangmechu. The further analysis of glacial lake change behavior and the results presented in the following sections concerns only the glacier-fed lakes.
The number of glacial lakes remained stable in the Amochu basin, while in Drangmechu, the glacial lakes shrank by 6.81 km2. The Phochu basin had the largest expansion, with 51 (10.43 km2) new lakes emerging over the period, followed by the Kurichu basin where 41 (4.54 km2) new lakes formed (Figure 5).
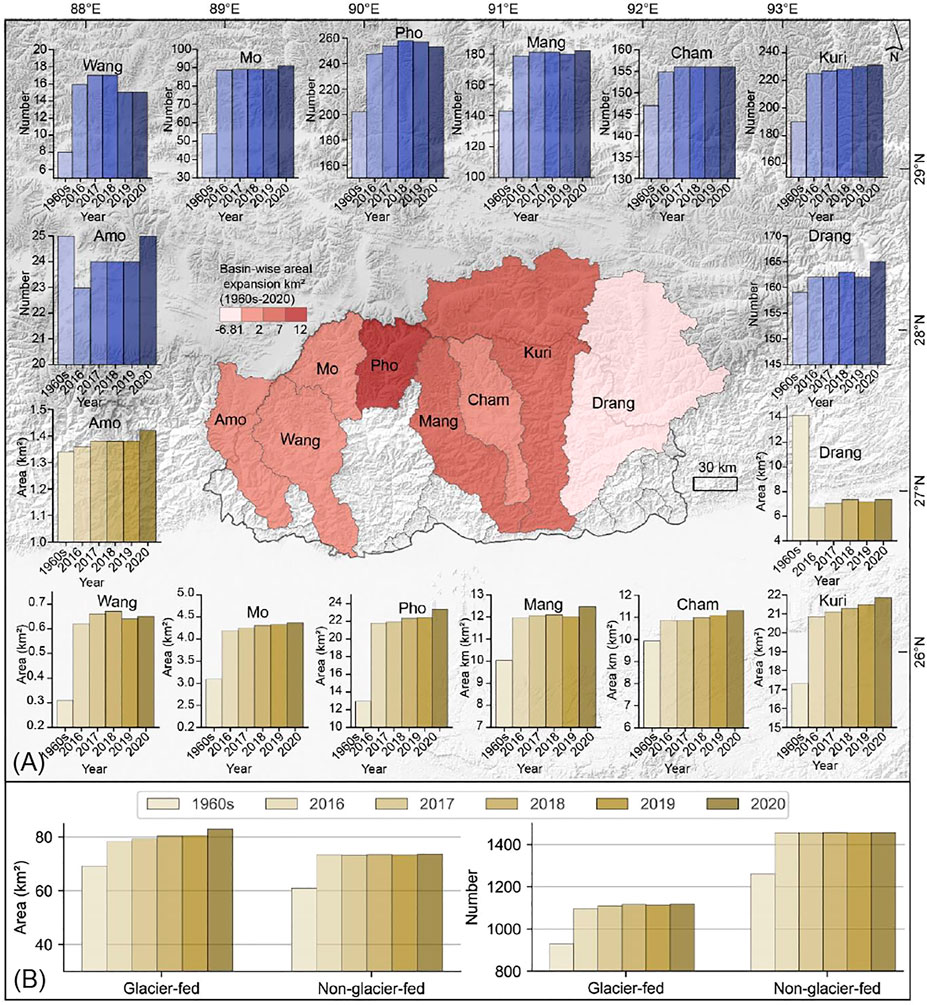
FIGURE 5. Glacial lake changes across the eight basins for 1960s−2016–2020 (A). The map in the middle shows the absolute area change (km2) for the eight basins. The glacier-fed and non-glacier-fed lake changes in the BTH for the period 1960s−2020 (B).
Looking at the changes in terms of glacial lake types, we observed the largest areal expansion (10.8 km2) in glacier-connected lakes, accounting for 75.4% of the overall total lake area growth in the BTH. However, 182 new glacier-unconnected lakes appeared over the period, contributing 96.3% of the overall increase in lake numbers in the BTH. The area of supraglacial lakes decreased by 35.47%, although their total number actually increased by 10.86% over the period (Figure 6).
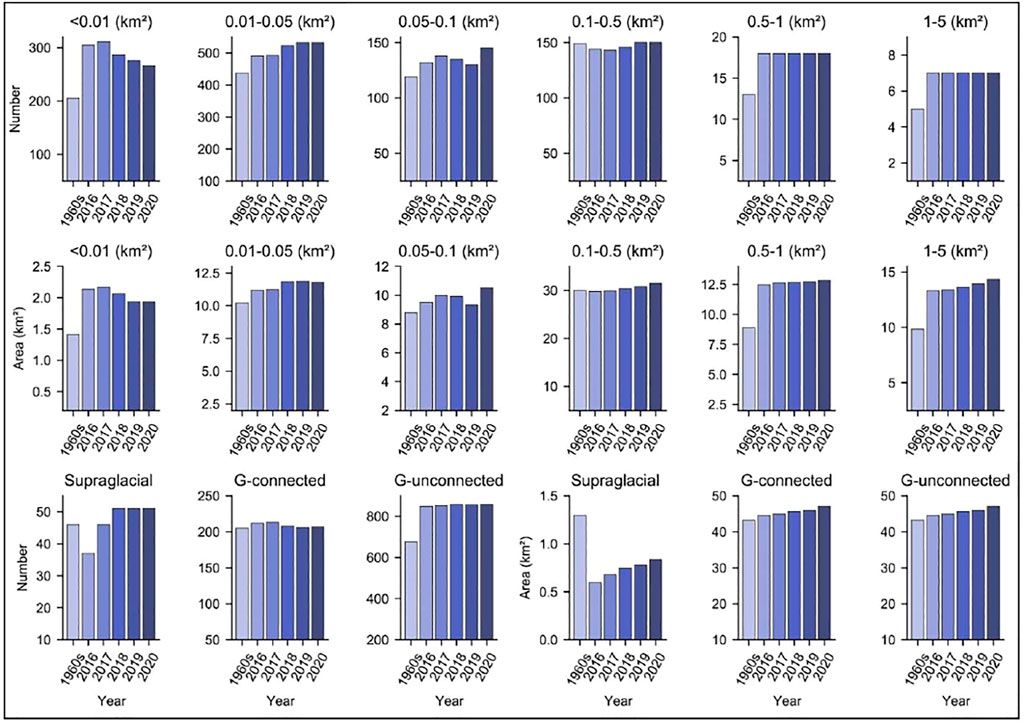
FIGURE 6. Glacial lake (number and area) change based on different size categories and types for 1960s−2016 and 2016–2020.
The glacial lake changes across the different size classes revealed that smaller glacial lake classes had the largest increases in numbers, while the larger glacial lake classes had the largest areal expansion. For example, a total of 182 new glacier-fed lakes of area <0.1 km2 were formed over the period, although their areal change contribution to the overall change was only 3.8 km2. On the other hand, the glacier-fed lakes >0.1 km2 expanded their area by 9.9 km2 despite their number increasing by only eight (Figure 6).
The glacier-fed lake changes across the four elevation zones, namely 4,000–4,500, 4,500–5,000, 5,000–5,500, and 5,500–6,000 m a.s.l are as shown in Figure 7. Over the last 6 decades, we observed the highest relative expansion (96.35%) in the elevation range 4,000–4,500 m a.s.l, followed by the range 5,500–6,000 m a.s.l. In contrast, lake area in the 4,500–5,000 m a.s.l range suffered recession (by 13.20%). Overall, the mean elevation of glacier-fed lakes increased from 4,986.46 to 5,031 m a.s.l.
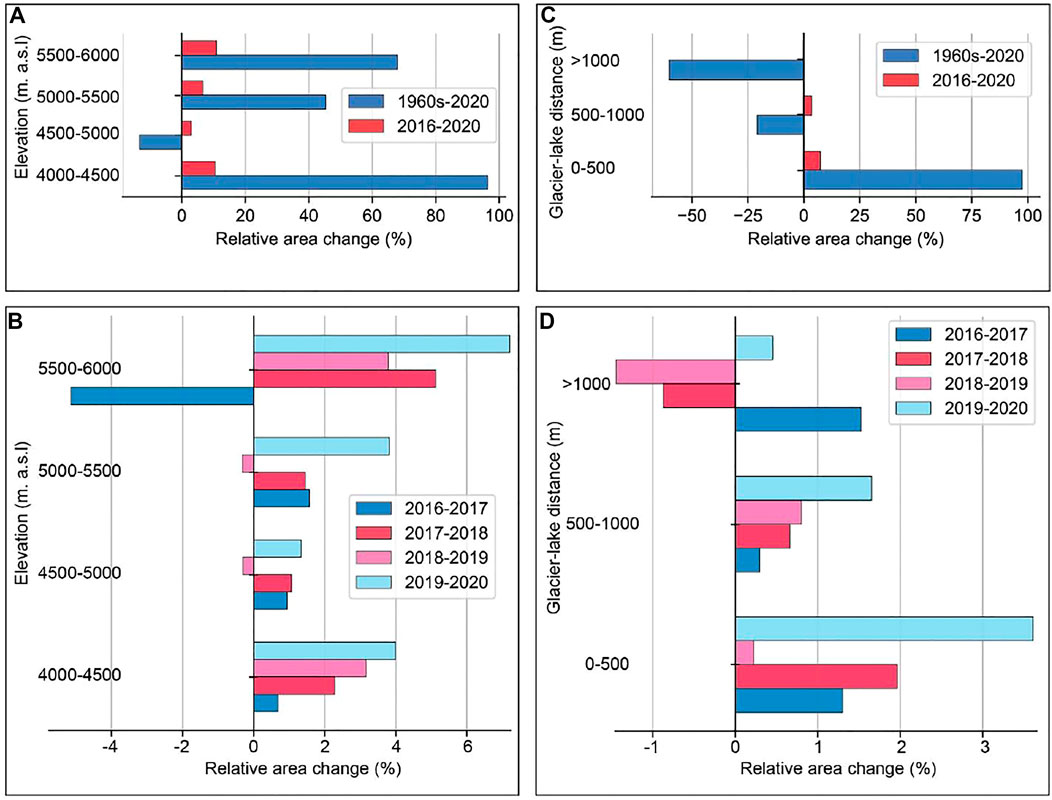
FIGURE 7. Relative area changes in the different elevation zones between 1960s–2020 and 2016–2020 (A), and in 2016–2017−2018–2019−2020 (B). The relative area changes in the different glacier-lake distance ranges in 2016–2020 and 1960s−2020 (C) and in 2016–2017−2018–2019−2020 (D).
The glacier-fed lake changes across the three lake-glacier distance ranges (0–500, 500–1,000, and >1,000 m) are also shown in Figure 7. Over the period, the glacial lakes with a glacier-lake distance within the range 0–500 m expanded, while glacial lakes with glacier-lake distance in other categories recessed. However, absolute net expansion (30.0 km2) for lakes in the 0–500 m category was more significant than net recession (−16.34 km2) in the other lake-glacier distance ranges. The mean glacier-lake distance decreased from 691.3 to 405 m over the 60 year period.
Short Term and Annual Variation
In 2016–2020, the glacier-fed lakes expanded (by 5.79% in area, and 1.91% in number) while the non-glacier-fed lakes remained reasonably stable (Figure 5). The annual changes between 2016 and 2020 show the area expanding at the rate of 0.96 km2 per year. A total of 19 (4.82 km2) new lakes were formed, with annual increments occurring except for 2018, when the total number of lakes decreased by three (Figure 5).
The number and area of glacier-fed lakes expanded between 2016 and 2020 in all basins except the Wangchu basin (Figure 6). The largest expansion occurred in the Phochu basin where six new lakes (1.55 km2) were formed. The Wangchu basin exhibited the smallest areal growth (0.03 km2), with its number of lakes decreasing by 1. However, there was irregular interannual variability in the number and area of lakes across the different basins. For example, in the Phochu and Wangchuk basins, the glacial lake counts increased in 2016–2017, remained stable in 2017–2018, and decreased between 2019 and 2020. By contrast, the Kurichu basin had a continuous annual expansion in area and number between 2016 and 2020 with average rates of 1.5 lakes and 0.2 km2, respectively (Figure 6).
Glacier-fed lakes of all kinds, except supraglacial lakes, increased both in area and number. The number of supraglacial lakes increased during 2016–2017 (19.56%) and 2017–2018 (9.80%) but remained stable in 2018–2019. However, the area of supraglacial lakes expanded continuously between 2016 and 2020 at an average rate of 0.06 km2 per year (Figure 6). The lakes across the different size categories exhibited an overall expansion trend during 2016–2020, although there is heterogeneous interannual variation (Figure 6). For example, the class of glacier-fed lake of area <0.01 km2 increased between 2016 and 2017 and continuously shrank between 2017 and 2020. On the other hand, the 0.01–0.5 km2 category expanded with an irregular annual pattern. The number of large glacial lakes (0.5–1 and 1–5 km2) remained stable, while their area underwent a continuous yearly expansion. We determined that the heterogeneous behaviour across the different classes was due to the rapid evolution of glacial lakes from small to large stages. For example, in 2017–2018, the drop of 24 in the number in the <0.01 km2 category was comparable to the increase of 30 in the number in the 0.01–0.05 km2 category (Figure 6).
Figure 7 shows that within the last 5 years, glacial lakes in all elevation ranges increased with a maximum relative expansion in the 4,000–4,500 m a.s.l range (10.48%) and a minimum (3.06%) in the 4,500–5,000 m a.s.l, range. However, there was inter-annual variability across the different elevation zones. For example, the glacial lakes in all years expanded in the elevation band 4,000–4,500 m a.s.l. In 2016–2017, the glacial lakes suffered recession in the 5,500–6,000 m a.s.l. elevation range. The maximum relative change was observed at 0–500 m glacier-lake distance category (7.26%), while there was a slight decrease in area in the >1,000 m category (−0.367 km2) in the last 5-year period. There was some interannual variability with glacial lakes in the <1,000 m glacier-lake distance category expanding in all the years, while those in the >1,000 m glacier-lake distance range, decreased in some years (2017–2018 and 2018–2019).
GLOF Hazard Assessment
Table 4 shows the GLOF hazard score value and hazard level for the eight lakes that were used for the validation. Out of these eight lakes which have failed in the past and caused a GLOF, three fell in the high GLOF hazard-level category and three in the very high category. There was only one lake in each of the medium and very-low GLOF hazard categories. This validation established that our hazard assessment method was robust enough to use on other lakes in the BTH.
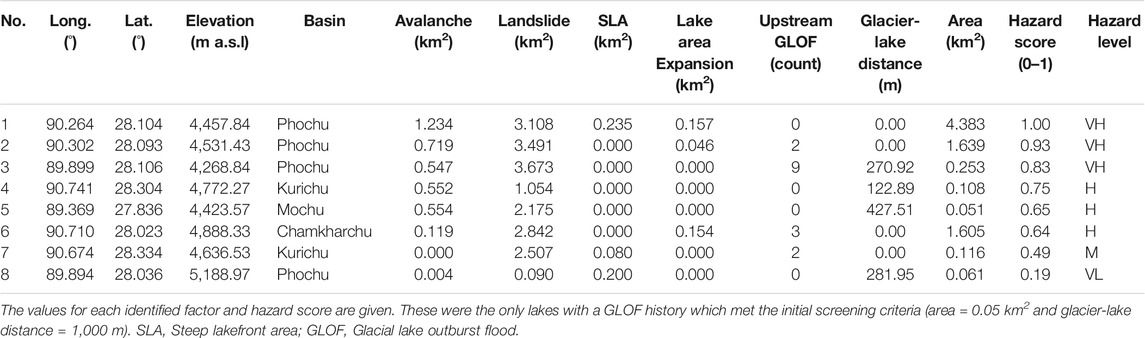
TABLE 4. Details of the lakes used to validate the hazard assessment method.
Based on the initial screening criteria, we identified 278 glacier-fed lakes for GLOF hazard assessment, out of which 84 lakes were transboundary (Figure 8). As per the GLOF hazard-level classification defined in the method section, we found 31 very high, 34 high, 50 medium, 102 low, and 62 very low GLOF-hazard lakes in BTH. The list of glacial lakes with high to very-high GLOF hazard levels is provided in Supplementary Table S4. The glacial lakes with high to very-high GLOF hazards were primarily located in the Kurichu basin (35.4%), followed by Phochu (18.5%), Drangmechu (15.4%), and Mochu (12.3%) basins. The number of glacial lakes with high to very-high GLOF hazard levels was smallest in the Amochu and Wanghcu basins. However, all the lakes with high to very-high GLOF hazard levels in Kurichu, Amochu, and Dranmgemechu were transboundary, located on the TAR side of the Himalayas. There were no lakes with a very-high GLOF hazard level in the Mangdechu basin. We found a positive correlation between the total number of glacial lakes and high GLOF hazard lakes. For example, Kurichu and Phochu basins exhibited the highest number of glacier-fed lakes (231 and 253, respectively), and also the highest number of very-high GLOF hazard-level lakes. Similarly, the opposite pattern was true for the Wangchu basin, which had the lowest number of glacier-fed lakes and lowest number of very-high GLOF hazard-level lakes.
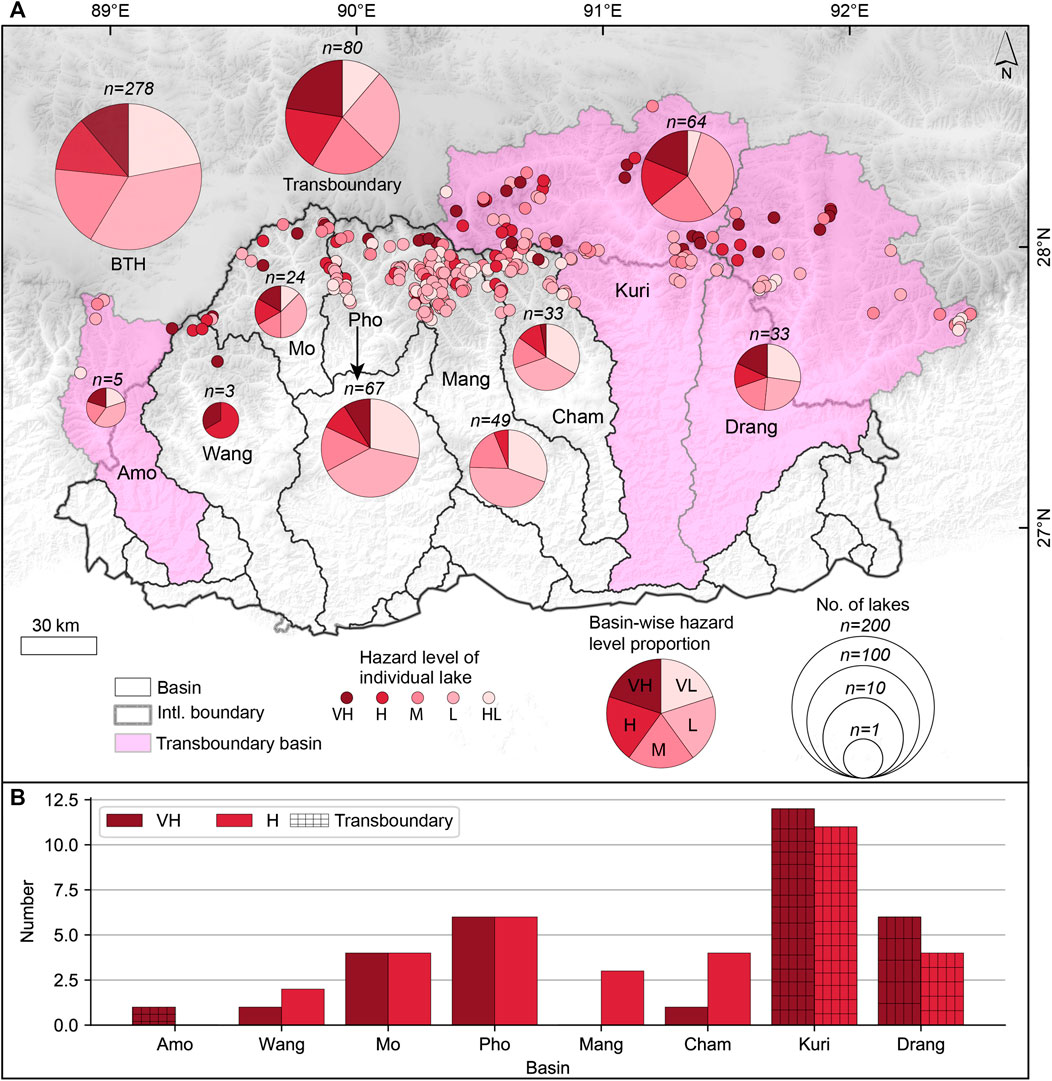
FIGURE 8. The pie charts in the map (A) show the proportional number of lakes of different hazard levels: very high (VH), high (H), medium (M), low (L), and very low (VL) across the different basins and in the BTH. The size of the pie chart indicates the total number (n) of lakes for which hazard assessments were carried out based on the initial two criteria (area = 0.05 km2 and glacier-lake distance = 1,000 m). The bar chart (B) shows the distribution of high and very-high hazard-level glacial lakes across the eight basins and transboundary regions.
Overall, the GLOF hazard-score distribution was slightly skewed towards the lower hazard levels, as shown in Figure 9. The very-high to high GLOF hazard-level lakes were mainly distributed in the 5,000–5,500 m a.s.l elevation range (47.69%) followed by the 4,500–5,000 range (35.38%). There was only one lake with a very-high hazard level in the 5,500–6,000 m a.s.l band. More than half (53.8%) of the lakes with a high to very-high hazard level fall in the size category of 0.1–0.5 km2 while the size category of 0.05–0.1 accounts for about 27.69%. Across the different types of glacial lakes, more than half (56.9%) of very-high to high GLOF hazard lakes were glacier-connected lakes followed by glacier-unconnected lakes (41.53%). There was at least one high hazard level supraglacial lake (Figure 9).
FIGURE 9. The histogram (A) represents the GLOF hazard levels across all the glacial lakes (with area = 0.05 km2 and glacier-lake distance = 1,000 m). The dashed lines show the hazard score for glacial lakes with a past GLOF history, which is also used to validate this study. The bars depict the distribution of high and very-high hazard level glacial lakes across the different elevation zones (B), size categories (C), and different lake types (D).
Discussion
Glacial Lake Mapping and Distribution
Uncertainty in glacial lake mapping usually results from the data quality used for mapping and other factors such as cloud coverage and seasonal snow. The Sentinel-2 and Sentinel-1 data used here have the highest ground resolution of any freely available data. Although glacial lakes were initially mapped with an automatic method involving both the imageries, manual validation was done using a false-color composite of Sentinel-2. We calculated the uncertainty value based on the resolution of the Sentinel-2 images (10 m) following the method of Hanshaw and Bookhagen (2014). Our uncertainty range (±5.04% of total area) was lower than the values in previous studies [e.g., ±16.1% in Zhang et al. (2015), 13.47% in Wang et al. (2020), ±30% in Khadka et al. (2018), and 15.96% in Nie et al. (2017)] which used Landsat data. Salerno et al. (2012) projected that the error associated with lake area can increase by an order of magnitude when the imagery resolution increase from 10 to 30 m which is corroborated by the reasonably minimal uncertainty range in this study. This substantiates the fact that the glacial lake mapping using Sentinel-2 in this study provides a data set with low uncertainty over the BTH, which is essential in the context of glacial lake hazard assessment (Allen et al., 2019). Obstruction by cloud cover is one of the main challenges in glacial lake mapping in the Himalayas (Zhang et al., 2015), and cloud cover is almost perennial over the BTH. The average cloud cover for all Sentinel-2 scenes in the months of October and November was 56.50 and 61.27%, respectively. Here, the use of Sentinel-1, SAR data was helpful in mapping glacial lakes obstructed by cloud cover in the Sentinel-2 data. For example, 107 lakes missed in the 2019 Sentinel-2 imagery were mapped using Sentinel-1 data. Hence, we have reaffirmed the proposal of Wangchuk and Bolch (2020) that using Sentinel-1 as a complement to optical data is a valuable and novel approach to overcome the cloud-cover problem.
The number of glacial lakes mapped in this study was higher than in previous studies, as indicated in Table 5. We compared our 2018 glacial lake data set with that of Wang et al. (2020) in 2018 and that of Chen et al. (2021) in 2017, both of which form the latest available inventory covering the BTH. When we compare the number of glacial lakes with areas between 0.0085 and 0.05 km2, Chen et al. (2021) reported 757 (16.59 km2), and Wang et al. (2020) mapped 970 (20.1 km2), while the current study found 1,475 (32.22 km2). The comparison indicates that the earlier inventories have missed glacial lakes, especially in the smaller size ranges, and implies that our study provides a more robust (both qualitative and quantitative) representation of the glacial lake census in the Bhutan Himalaya than previous studies at the regional scale.
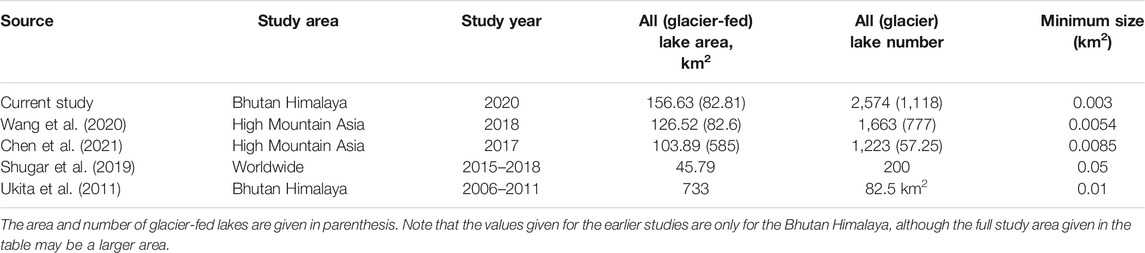
TABLE 5. Comparison of the number and area of glacial lakes with the findings of previous studies.
Basin-wise, we found that glacier-fed lakes were predominant in the Phochu and Kurichu basins, in agreement with earlier distribution patterns (Ukita et al., 2011). Gardelle et al. (2011) suggested that highly glaciated regions are likely to have more glacier lakes. Here we found that Kurichu (709 km2) and Phochu (507 km2) have the largest areas of glacier and, correspondingly, the largest numbers of glacial lakes. An opposite trend was observed in the Wangchu (32.39 km2) and Amochu (12.8 km2) basins, which had the lowest numbers of glacial lakes. These trends indicate that glacial lake formation is primarily related to glacier dynamics, as claimed by Richardson and Reynolds (2000).
We observed the dominance of small glacial lakes (0.01–0.05 km2) in the BTH, which is in line with previous records (Ukita et al., 2011), and the general distribution pattern of glacial lakes in the entire Third Pole region (Zhang et al., 2015). However, glacial lakes in the larger size categories represent the major portion of the total area, in agreement with earlier findings in the Himalayas (Nie et al., 2017). Comparing the distribution patterns of glacial lake types, we found glacier-unconnected lakes were dominant both in area and number, followed by glacier-connected lakes. In contrast, there were very few supraglacial lakes. This distribution trend was also observed in the Nepal Himalaya (Khadka et al., 2018) and in the entire Himalayan region (Nie et al., 2017). Moreover, an earlier study across the Hindukush Himalayas also observed the sparse distribution of supraglacial lakes in the eastern Himalayas, which corresponds with our study site (Gardelle et al., 2011). This sparse distribution was shown to occur because the eastern Himalaya contain smaller-sized, less debris-covered glaciers than its western counterpart, which provide less favorable conditions for the formation and sustenance of supraglacial ponds (Gardelle et al., 2011; 2013). Using high resolution (3 m), Planet Labs satellite data for 2016–2018, 5,754 supraglacial ponds with an average size of 1,206 m2 with high temporal and spatial variations were reported on three prominent glaciers in the Mangdechu and Chamkhar basins in the Bhutan Himalaya. This indicates that, because of the relatively smaller size and high variability of supraglacial lakes, they are usually unrepresented when the inventory is done using freely available satellite data with high to medium ground resolution.
Glacial Lake Evolution Since the 1960s
Several researchers have studied glacial lake changes across the Himalayas. However, the previous studies are limited to the Landsat era, and typically restricted to 1990 or later (Zhang et al., 2015; Nie et al., 2017; Wang et al., 2020; Chen et al., 2021). The inventory for the period since the 1960s has been focussed on specific regions and has provided minimal information in terms of area and number at larger spatial scales. For example, only 73 lakes from the Poiqu basin, in the central Himalaya (Zhang et al., 2019), and 50 moraine-dammed lakes across the transboundary area between Bhutan and TAR have been studied (Komori, 2008). Glacial lake changes since the 1960s have, therefore, remained largely unknown due to the limitations imposed by the lack of high-resolution imageries. This study provides the first comprehensive assessment of glacial lake change since the 1960s for the entire Bhutan Himalaya.
We observed that the increase in non-glacier-fed lakes was comparable to the rise in glacier-fed lakes within the last 6 decades. This finding contrasts with regional-scale studies where a small change in the trend of non-glacier-fed lakes observed since 1990 (Zhang et al., 2015) or a relatively stable situation (Nie et al., 2017). This difference could be due to the substantial difference in the temporal range between the previous studies (since 1990) and the current study (since 1960s). Here, following Ageta et al. (2000), we defined non-glacier-fed lakes as those lakes which have lost hydrological connection with their mother glacier. Based on this definition, the increase in the number and area of non-glacier-fed lakes was primarily due to the transition of glacier-fed lakes to non-glacier-fed lakes rather than the expansion of existing lakes. For example, 157 glacier-fed-lakes evolved into non-glacier-fed lakes between the 1960s and 2016 as they lost hydrological connection with their glacier due to rapid shrinkage of the glacier or complete disappearance of the glaciers. Further, 192 new glacier-unconnected lakes were formed over the period, corroborating the idea of rapid delinking of the glacial lakes from their mother glacier. We determined that the decrease in glacier-fed lake area in the elevation range 4,500–5,000 m a.s.l was also caused due to transition of glacier-fed to non-glacier-fed lakes. The retreat of the glaciers between the 1960s and 1993 was found to be more prominent in the Bhutan Himalaya (Karma et al., 2003). Other studies have also reported unprecedented glacier melt and mass loss in the BTH after the 1990s (Gardelle et al., 2011; Bajracharya et al., 2014; Tshering and Fujita, 2016) in agreement with our results regarding the disconnection of lakes from their glaciers over time. Our study has revealed that extending the study period back to the 1960s, which marks the formation stage of most of the glacial lakes in the Bhutan Himalaya (Komori, 2008), provides new insights on the transition from glacier-fed to non-glacier-fed lakes.
Greater areal expansion was observed for glacier-connected lakes than for glacier-unconnected lakes, which resonates with earlier findings for the entire Himalayan region (Nie et al., 2017; Wang et al., 2020; Zhang et al., 2015). Such differences between connected and unconnected lakes could be explained by considering the sources of water for the lakes. When a glacial lake is no longer in contact with its glacier, the only water source is drainage of meltwater from the upstream glacier and precipitation. In contrast, a lake in contact with its glacier receives additional water from subaerial melting, water-line melting, and calving of the glacier front into the lake (Gardelle et al., 2011). Surface area expansion, through a positive feedback mechanism between the lake and ice, is favored for glacial lakes connected to glaciers (King et al., 2018; King et al., 2019). On the other hand, the decreasing trend of precipitation between the 1970s and 2010 across the Himalayas in general (Yao et al., 2012), and in Bhutan in particular (Supplementary Figure S2), was observed to be an essential contributing factor to the growth of non-glacier-connected lakes. Other possible factors contributing to the difference in growth rates are water loss through evaporation, infiltration, and discharge through drainage channels (Xu and Feng, 1994). The importance of such factors is supported by our findings that glacial lakes close to a glacier exhibit expansion, while lakes further away have exhibited recession. This finding supports the idea that glacier-melt water plays a major role in expanding lakes, as claimed in earlier studies (Zhang et al., 2015).
In contrast to earlier findings (Zhang et al., 2015; Nie et al., 2017), we observed that the area and number of supraglacial lakes has decreased over the last 6 decades. This contrasting behavior of supraglacial lakes could also be due to ∼60 years of evolution, as the highly transient nature of supraglacial lakes (Benn et al., 2001; Röhl, 2008; Gardelle et al., 2011; Taylor et al., 2021) limits their long-term expansion. Komori (2008) has suggested that most of the proglacial lakes in the Bhutan Himalaya would have started to form in the 1950s−1970s, and has also proposed three stages of typical proglacial lake formation: 1) appearance of the supraglacial lakes, 2) merging of supraglacial lakes to a single coalesced lake, and 3) stable expansion of coalesced lakes. If this is correct, it is possible that most of the present-day proglacial lakes were in the supraglacial lake stage in the 1960s and have evolved gradually since. For example, we have observed that the typical present-day proglacial lakes, Lugge Tsho, Rapstreng Tsho, and Chubda Tsho, were in the proglacial lake stage in the 1960s (Figure 10).
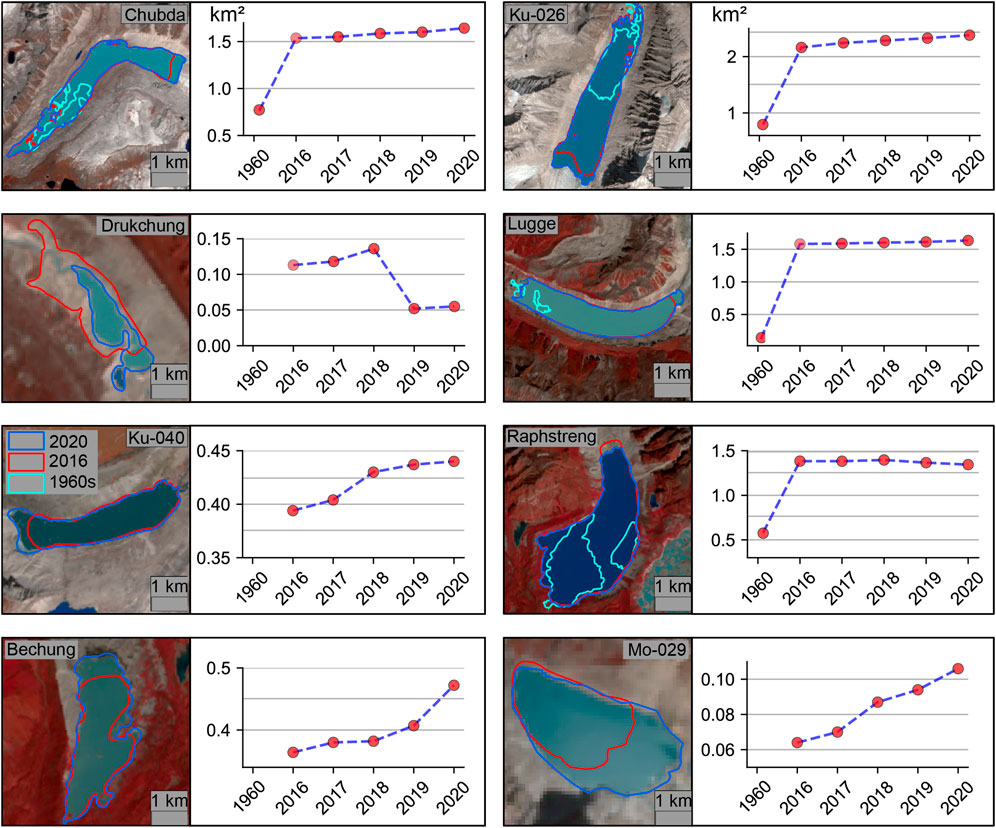
FIGURE 10. Examples of lakes that have exhibited typical expansion since the 1960s and which have undergone a distinct annual change. Chubda Tsho, Ku-026, Lugge Tsho, and Raphstreng Tsho are distinctive examples of lakes in the supraglacial lake stage in the 1960s which expanded rapidly after merging to a single proglacial lake. Drukchung Tsho and Raphstreng Tsho have recessed between 2016 and 2020.
Across the different size classes, the number increase over the last 6 decades was found to be highest amongst the smaller glacial lakes, a similar trend to that found in earlier studies (Zhang et al., 2015; Khadka et al., 2018). We observed that total area expansion was almost the same across all the size classes, which is not in agreement with the trend in other regions such as the Nepal Himalaya (Khadka et al., 2018) and the Third Pole (Zhang et al., 2015). Most of the large lakes (0.5–1 and 1–5 km2) in the BTH were glacier-connected lakes, which constitute 32.8% of the total area despite their small numbers. The rapid expansion of those glacier-connected lakes has significantly influenced the overall expansion statistics across the different size categories.
Glacial lake expansion, in general, is in line with the increased atmospheric warming and eventual negative glacier mass balance. For example, the pronounced temperature rise in the higher elevations across the TAR and surrounding regions (Liu et al., 2009) corresponds well to a negative trend in mean glacier mass balance from the 1960s to 2000 (Bolch et al., 2012) and greater expansion of glacial lakes from 1990 to 2020 in the Himalayan regions (Zhang et al., 2015). Several past studies have revealed the rapid retreat of glaciers in the Bhutan Himalaya (Karma et al., 2003; Gardelle et al., 2013; Bajracharya et al., 2014; Tshering and Fujita, 2016), an accelerated glacier mass loss which is consistent with the current finding of glacial lake expansion since the 1960s. On the other hand, a decrease in precipitation (summer snow) accelerates glacier melting by lowering surface albedo (Fujita, 2008). Analysis of temperature and precipitation data (1997–2017) collected from eight weather stations located above 2,500 m. a.s.l (NCHM, 2018) indicates overall increasing temperature and decreasing precipitation trends, which fit with the current findings of glacial lake expansion (Supplementary Figure S2). However, summer and winter precipitation were not differentiated in this analysis.
The extent of glacial lake expansion varied from one basin to another. Such differential glacial lake evolution across the different basins is possibly due to local variability in glacier mass loss. Across the HKH, glacial lakes have grown in the region where glaciers have lost mass (the Himalayas), and shrunk in the part where glaciers have lost limited mass or surged (Karakorum) (Gardelle et al., 2011). The most notable observation was the drastic decrease in size of the glacier-fed area in the Drangmechu basin (−49.817%) which is due to 49 lakes in the Drangmechu basin evolving from glacier-fed to non-glacier-fed lakes. However, the expansion of glacial lakes is also influenced by the local climate regime, such as a change in precipitation (Khadka et al., 2018). Future studies on glacier-lake interaction against a backdrop of local climate fluctuation in the Bhutan Himalaya may be able to provide definite insights into whether such an interaction is occurring there.
Annual Expansion
Using Landsat satellite data, previous studies have examined glacial lake change over relatively long temporal ranges. For example, decadal change (1990–2000−2010) (Zhang et al., 2015), a 28 year period (1990–2018) (Wang et al., 2020), 25 years (1990–2015) (Nie et al., 2017), and 20 years (1990–2009) (Gardelle et al., 2011). Glacial lake change behavior at shorter temporal resolution is relatively unknown, but knowledge of the interannual variation of glacial lakes is essential for understanding glacial lake evolution against the background ever-increasing GLOF hazard (Zheng et al., 2021; Veh et al., 2020). Chen et al. (2021) have generated annual glacial lake data sets for High Mountain Asia from 2008 to 2017 from Landsat data. However, for the Bhutan Himalaya, their data sets have high levels of uncertainty for determining annual glacial lake behavior, as well as underrepresenting the overall statistics. For example, in their data, the total area increased from 102.38 to 111.5 km2 between 2014 and 2015, while falling sharply back to 102.78 km2 between 2015 and 2016. In contrast, we provide annual glacial lake data sets from 2016 to 2020 in the Bhutan Himalaya using high resolution (10 m) Sentinel-2 and Sentinel-1 using a highly automated method coupled with careful manual inspection.
Overall, the annual mapping of glacial lakes from 2016 to 2020 indicates that glacial lakes in the Bhutan Himalaya have expanded at a rate of 0.96 km2 per year. Considering the uncertainty of ±5% in the total area, the annual expansion rate was within the uncertainty range. Comparing the interannual variation between glacier-fed and nonglacier-fed lakes, we found that only the former expanded while the latter has remained constant. Further, the rate of annual expansion was more prominent with the supraglacial lakes (8.94%). Typical proglacial lakes usually expand by progressing the upstream end of the shoreline (Komori, 2008). We found 102 glacier-connected lakes showing interannual upper-shoreline progression, a result which also indicate the interannual expansion from 2016 to 2020 (examples in Figure 10). Going by these observations, our results indicate that there was an interannual expansion of glacier-connected lakes although the increase rate for all lakes were within the uncertainty range.
GLOF Hazard Potential
Identification of the hazard potential of glacial lakes is the first step towards GLOF mitigation and early warning preparation programs (Ives, Shrestha, and Mool, 2010). Here, we employed seven hazard factors and multiple-criteria decision-making tools (AHP) (Saaty, 2008) to produce a GLOF hazard-potential ranking for 278 glacial lakes with area ≥0.05 km2 and with a glacier-lake distance of ≤1,000 m. Based on the glacial lake data sets of 1950–1999, ICIMOD has identified 24 potentially dangerous glacial lakes in the Bhutan Himalaya. However, its evaluation is based on qualitative judgment, and is highly subjective (Emmer and Vilímek, 2013). Moreover, it was based on old inventory data sets derived from topographic maps, which suffer from severe non-systematic shifts (Nagai et al., 2017). A regional study covering the entire Third Pole has identified 85 lakes in the Bhutan Himalaya as highly hazardous and 115 as very-highly hazardous, (Zheng et al., 2021). The numbers are higher than the findings of the current study. The discrepancy can be mainly put down to differences in the hazard-factor consideration. In contrast to the current study, they have integrated ice/snow avalanche and landslides/rockfall into a single “topographic potential” factor, which has led to an overestimation of the GLOF hazard level of the lakes. For example, we found only seven lakes out of 278 with zero topographic potential but 85 with zero avalanche area in the Bhutan Himalaya. While almost all glacial lakes pose flood hazards to downstream communities, it is essential that the hazard ranking prioritizes limited resources for flood mitigation activities (Ives et al., 2010). In this light, our result presents a robust illustration of the GLOF hazard potential of the glacial lakes in the Bhutan Himalaya. Supplementary Table S5 provides a comparison between current and previous GLOF hazard-assessment studies covering the Bhutan Himalayas.
The multi-criteria decision-based hazard assessment ranked Thorthormi Tsho as the most hazardous lake in the Bhutan Himalaya. Thorthomi Tsho is one of the most well-studied and monitored lakes due to its high flood potential. The lake has been observed since 2005 after being reported as highly dangerous by Häusler et al. (2000). Being aware of the grave danger it poses to downstream settlements and particularly to the Punakha Dzong and two large, nearly completed, hydropower power plants (Punatsangchu I and II), the Royal Government of Bhutan, in partnership with UNDP, started in 2008 to manually lower the lake level. Moreover, one of the subsidiary lakes (lake II) of the Thorthormi Tsho produced a GLOF in 2019, causing alarm in the downstream settlement, although no causalities or economic loss were reported. A recent field verification by the National Centre for Hydrology and Meteorology of Bhutan has further reemphasized that this lake is in a perilous state with unstable moraine and an actively receding mother glacier, and may drain into Raphstreng Tsho causing a cascading flood (NCHM, 2019b). Here, Raphstreng Tsho, with an area of 1.344 km2, is also given a high flood potential with a hazard score of 0.72. The GLOF from Lugge Tsho was the most devastating flood recorded so far in Bhutan. After the GLOF of 1994, Lugge Tsho expanded rapidly to the current area of 1.39 km2 (determined in this inventory) and a volume of 65.19 million m3 (NCHM, 2019c). It is also considered one of the most dangerous proglacial lakes in the BTH (NCHM, 2019c). Our hazard assessment gives Lugge Tsho a very high flood potential with a hazard score of 0.83. The Tarina Tsho I, Tarina II, and Chubdha Tsho, all previously recognized as the PDGLs (NCHM, 2019c), are all designated here as high to very high GLOF hazard lakes. These findings provide adequate evidence that the GLOF hazard assessment method adopted here was robust enough.
However, two previously known PDGLs in the Mangdechu basin, Metatshota, and Mang-gl-385 fell to medium and very-low GLOF hazard in this study. Metatshota has no SLA and was not actively expanding. However, it is a proglacial lake with a large avalanche zone, which is considered the most crucial GLOF hazard factor in the Himalayas. Moreover, a previous study has revealed that a flood from the Metatshota is likely to impact some farmlands in the downstream settlement of Bjizam and Tingtingbi (Koike and Takenaka, 2012). We, therefore, do not wholly rule out its GLOF hazard in the future. ICIMOD considered Mang-gl-385 to be a PDGL as it is an ice-dammed lake. However, our assessment revealed that Mang-gl-385 has no avalanche, landslide, or SLA areas, which are the factors with the most influence in determining a lake’s GLOF hazard.
Hydro-power plants have been the backbone of Bhutan’s economy, playing a vital role in enhancing the country’s GDP and overall living standard. Being dependent on the glacier-fed rivers (MOEA, 2021), the hydropower plants are inevitably vulnerable to any potential future GLOF. The GLOF may directly damage the plant as in Rishiganga, and Dhaulinganga, Uttarakhand, India (Shugar et al., 2021) or disturb the sustainable water flow in the long term (Xianbao et al., 2021; Nie et al., 2021). The National Commission for Hydrology and Meteorology, the agency that looks after the GLOF threat in Bhutan, conducts annual monitoring of the glacial lakes and, based on the ICIMOD hazard assessment report of 2001, it has identified 17 PDGLs for regular monitoring. As mentioned above, the ICIMOD assessment has drawbacks which do not render it ideal for considering the current GLOF hazard status of the glacial lakes. We have determined a GLOF hazard ranking of glacial lakes through well-established methods and using the latest updated inventory and our results should form the basis for reconsidering which PDGLs require monitoring in the future.
We used multiple factors and a well-established semi-quantitative decision-making approach, AHP, to generate the GLOF hazard ranking of the Bhutanese glacial lakes. Our study identified the previously well-known PDGLs as high GLOF hazard lakes, underlining the reliability of our method and results. While adding hazard factors does not necessarily improve the efficiency of the GLOF evaluation methods, we acknowledge that in future studies, integrating ground temperature and permafrost modelling, may provide even more robust results (Allen et al., 2019). Alpine regions elsewhere have exhibited increasing ground temperature and thawing of permafrost leading to slope failure (Haberkorn et al., 2021; Swanson, 2021), which is the key cause of dam overtopping of glacial lakes. However, our recommendations are made within the scope of freely available remote sensing imagery, although we acknowledge that novel field-based data can provide more appropriate information. One potential source of uncertainty in our results may stem from the glacier data sets used in this study. We used the glacier data set of Nagai et al. (2016), which is based purely on the Bhutan Himalaya and has a higher accuracy than other data sets such as RGI v6.0 (RGI Consortium, 2017) and GAMDAM (Sakai, 2018). However, the data set was produced using ALOS imagery from 2006 to 2011, which is almost a decade old, and could, therefore, have led to avalanche areas being slightly overestimated. Since we used multiple criteria, such a minor variation should not have affected our results significantly. We are also mindful of the uncertainty of the other remote sensing data used, such as SRTM-30. Thus, we reemphasize that our research is mainly concerned with first-order hazard assessment, and should be complemented with further detailed in-situ studies and high-resolution satellite observations.
Conclusion
We mapped 2,187 glacial lakes corresponding to an area of 130.19 ± 2.09 km2 from the 1960s using historical KH-4 data. The number of glacial lakes increased to 2,574 (156.63 ± 7.95 km2) in 2020. Between 2016 and 2020, the number of glacial lakes increased by 19 (4.82 km2) at an average annual expansion rate of 0.96 km2 per annum. Both glacier-fed lakes and non-glacier lakes increased in number and area between 2016 and 2020. A total of 157 glacier-fed lakes became non-glacier-fed lakes during the last 60 years of lake evolution. We ascertained that extending the glacial lake inventory back to the 1960s provides new insights on the evolution of glacier-fed lakes into non-glacier-fed lakes. Our study also reaffirmed the capability of Sentinel-1 and Sentinel-2 to determine the annual glacial lake variation. The hazard evaluation revealed 65 glacial lakes with very high (31) to high (34) GLOF hazard levels. These were mainly present in the Phochu, Kurichu, Drangmechu, and Mochu basins. Our study delivers the first-ever robust glacial lake inventory and GLOF hazard status of glacial lakes over the BTH. The findings form the basis for detailed glacial lake monitoring and prioritizing resource allocation in the context of increasing hazards from GLOFs. In the broader sense, this study is also a valuable asset for concerned stake-holders, such as local government, who have to make well-informed decisions and policies.
Data Availability Statement
The raw data supporting the conclusions of this article is available at https://zenodo.org/record/5704114.
Author Contributions
SR designed the study, processed and analyzed data, and wrote the manuscript. GZ designed the study, guided SR as a supervisor in processing and analyzing data, and writing this manuscript. SW designed this study and helped in processing and analyzing data and writing the manuscript. All authors read this manuscript and agreed to submit it to this journal.
Funding
This study was supported by the Basic Science Center for Tibetan Plateau Earth System (BSCTPES, NSFC project No. 41988101-03), grants from the Natural Science Foundation of China (41871056, 41831177), the National Key R and D Program of China (2018YFB0505005).
Conflict of Interest
The authors declare that the research was conducted in the absence of any commercial or financial relationships that could be construed as a potential conflict of interest.
Publisher’s Note
All claims expressed in this article are solely those of the authors and do not necessarily represent those of their affiliated organizations, or those of the publisher, the editors and the reviewers. Any product that may be evaluated in this article, or claim that may be made by its manufacturer, is not guaranteed or endorsed by the publisher.
Acknowledgments
This study was supported by the Basic Science Center for Tibetan Plateau Earth System (BSCTPES, NSFC project No. 41988101-03), grants from the Natural Science Foundation of China (41871056, 41831177), the National Key R and D Program of China (2018YFB0505005). SR acknowledges the CAS, ‘Belt and Road Master’ Programme Fellowship, and Institute of Tibetan Plateau Research (the host institute) for providing scholarship funding. SR is also grateful to Koji Fujita and Simon Allen for sharing their methodological model. The authors are also thankful to the research team members (Wenfeng Chen, Mengmeng Wang, MengEr Peng, Fenglin Xu and Tao Zhou) for their feedback on this manuscript which has led to substantial improvements.
Supplementary Material
The Supplementary Material for this article can be found online at: https://www.frontiersin.org/articles/10.3389/feart.2021.775195/full#supplementary-material
References
Ageta, Y., Iwata, S., Yabuki, H., Naito, N., Sakai, A., Narama, C., et al. (2000). Expansion of Glacier Lakes in Recent Decades in the Bhutan Himalayas. Washington, USA: Paper presented at the Debris_Covered Glaciers.
Aggarwal, S., Rai, S. C., Thakur, P. K., and Emmer, A. (2017). Inventory and Recently Increasing GLOF Susceptibility of Glacial Lakes in Sikkim, Eastern Himalaya. Geomorphology 295, 39–54. doi:10.1016/j.geomorph.2017.06.014
Allen, S. K., Linsbauer, A., Randhawa, S. S., Huggel, C., Rana, P., and Kumari, A. (2016). Glacial lake Outburst Flood Risk in Himachal Pradesh, India: an Integrative and Anticipatory Approach Considering Current and Future Threats. Nat. Hazards 84 (3), 1741–1763. doi:10.1007/s11069-016-2511-x
Allen, S. K., Zhang, G., Wang, W., Yao, T., and Bolch, T. (2019). Potentially Dangerous Glacial Lakes across the Tibetan Plateau Revealed Using a Large-Scale Automated Assessment Approach. Sci. Bull. 64 (7), 435–445. doi:10.1016/j.scib.2019.03.011
Anacona, I. P., Norton, K. P., and Mackintosh, A. (2014). Moraine-dammed lake Failures in Patagonia and Assessment of Outburst Susceptibility in the Baker Basin. Nat. Hazards Earth Syst. Sci. 14 (12), 3243–3259. doi:10.5194/nhess-14-3243-2014
Bajracharya, B., Shrestha, A. B., and Rajbhandari, L. (2007). Glacial Lake Outburst Floods in the Sagarmatha Region. Mountain Res. Develop. 27 (4), 336–344. doi:10.1659/mrd.0783
Bajracharya, S. R., Maharjan, S. B., and Shrestha, F. (2014). The Status and Decadal Change of Glaciers in Bhutan from the 1980s to 2010 Based on Satellite Data. Ann. Glaciol. 55 (66), 159–166. doi:10.3189/2014AoG66A125
Benn, D. I., Wiseman, S., and Hands, K. A. (2001). Growth and Drainage of Supraglacial Lakes on Debris-Mantled Ngozumpa Glacier, Khumbu Himal, Nepal. J. Glaciol. 47 (159), 626–638. doi:10.3189/172756501781831729
Bolch, T., Kulkarni, A., Kääb, A., Huggel, C., Paul, F., Cogley, J. G., et al. (2012). The State and Fate of Himalayan Glaciers. Science 336 (6079), 310–314. doi:10.1126/science.1215828
Bolch, T., Peters, J., Yegorov, A., Pradhan, B., Buchroithner, M., and Blagoveshchensky, V. (2011). Identification of Potentially Dangerous Glacial Lakes in the Northern Tien Shan. Nat. Hazards 59 (3), 1691–1714. doi:10.1007/s11069-011-9860-2
Breien, H., De Blasio, F. V., Elverhøi, A., and Høeg, K. (2008). Erosion and Morphology of a Debris Flow Caused by a Glacial lake Outburst Flood, Western Norway. Landslides 5 (3), 271–280. doi:10.1007/s10346-008-0118-3
Chen, F., Zhang, M., Guo, H., Allen, S., Kargel, J. S., Haritashya, U. K., et al. (2021). Annual 30 M Dataset for Glacial Lakes in High Mountain Asia from 2008 to 2017. Earth Syst. Sci. Data 13, 741–766. doi:10.5194/essd-13-741-2021
Copernicus (2021b). Sentinel-1 SAR - Technical Guide - Sentinel Online. Available at: https://sentinel.esa.int/web/sentinel/technical-guides/sentinel-1-sar (Accessed November 19, 2018).
Copernicus (2021a). Sentinel-2 MSI User Guide - Sentinel Online. Available at: https://sentinel.esa.int/web/sentinel/user-guides/sentinel-2-msi (Accessed November 19, 2018).
Dashora, J.-C., Lohani, B., and Malik, J. N. (2007). A repository of earth resource information–CORONA satellite programme. Current Science 92 (7), 7.
Dimri, A. P., Thayyen, R. J., Kibler, K., Stanton, A., Jain, S. K., Tullos, D., et al. (2016). A review of atmospheric and land surface processes with emphasis on flood generation in the Southern Himalayan rivers. Science of The Total Environment 556, 98–115. doi:10.1016/J.SCITOTENV.2016.02.206.3390/rs9030275
Dirscherl, M., Dietz, A. J., Kneisel, C., and Kuenzer, C. (2020). Automated Mapping of Antarctic Supraglacial Lakes Using a Machine Learning Approach. Remote Sensing 12 (7), 1203. doi:10.3390/rs12071203
Dubey, S., and Goyal, M. K. (2020). Glacial Lake Outburst Flood Hazard, Downstream Impact, and Risk Over the Indian Himalayas. Water Resources Research. 56 (4). doi:10.1029/2019wr026533
Emmer, A., and Cochachine, L. (2013). The Causes and Mechanisms of Moraine-Dammed lake Failures in the Cordillera Blanca, North American Cordillera, and Himalayas. AUC Geographica 48 (2), 10. doi:10.14712/23361980.2014.23
Emmer, A., and Vilímek, V. (2014). New Method for Assessing the Susceptibility of Glacial Lakes to Outburst Floods in the Cordillera Blanca, Peru. Hydrol. Earth Syst. Sci. 18 (9), 3461–3479. doi:10.5194/hess-18-3461-2014
Emmer, A., and Vilímek, V. (2013). Review Article: Lake and Breach hazard Assessment for Moraine-Dammed Lakes: an Example from the Cordillera Blanca (Peru). Nat. Hazards Earth Syst. Sci. 13 (6), 1551–1565. doi:10.5194/nhess-13-1551-2013
Farinotti, D., Round, V., Huss, M., Compagno, L., and Zekollari, H. (2019). Large Hydropower and Water-Storage Potential in Future Glacier-free Basins. Nature 575 (7782), 341–344. doi:10.1038/s41586-019-1740-z
Frey, H., Huggel, C., Chisolm, R. E., Baer, P., McArdell, B., Cochachin, A., et al. (2018). Multi-Source Glacial Lake Outburst Flood Hazard Assessment and Mapping for Huaraz, Cordillera Blanca, Peru. Frontiers in Earth Science. 6. doi:10.3389/feart.2018.00210
Fujita, K. (2008). Influence of Precipitation Seasonality on Glacier Mass Balance and its Sensitivity to Climate Change. Ann. Glaciol. 48, 88–92. doi:10.3189/172756408784700824
Fujita, K., Sakai, A., Takenaka, S., Nuimura, T., Surazakov, A. B., Sawagaki, T., et al. (2013). Potential Flood Volume of Himalayan Glacial Lakes. Nat. Hazards Earth Syst. Sci. 13 (7), 1827–1839. doi:10.5194/nhess-13-1827-2013
Fujita, K., Sakai, A., Nuimura, T., Yamaguchi, S., and Sharma, R. R. (2009). Recent changes in Imja Glacial Lake and its damming moraine in the Nepal Himalaya revealed by in situ surveys and multi-temporal ASTER imagery. United Kingdom: N. doi:10.1088/1748-9326/4/4/045205
Gardelle, J., Arnaud, Y., and Berthier, E. (2011). Contrasted Evolution of Glacial Lakes along the Hindu Kush Himalaya Mountain Range between 1990 and 2009. Glob. Planet. Change 75 (1-2), 47–55. doi:10.1016/j.gloplacha.2010.10.003
Gardelle, J., Berthier, E., Arnaud, Y., and Kääb, A. (2013). Region-wide Glacier Mass Balances over the Pamir-Karakoram-Himalaya during 1999-2011. The Cryosphere 7 (4), 1263–1286. doi:10.5194/tc-7-1263-2013
Gurung, D. R., Khanal, N. R., Bajracharya, S. R., Tsering, K., Joshi, S., Tshering, P., et al. (2017). Lemthang Tsho Glacial Lake Outburst Flood (GLOF) in Bhutan: Cause and Impact. Geoenviron Disasters 4 (1), 17. doi:10.1186/s40677-017-0080-2
Goerlich, F., Bolch, T., Mukherjee, K., and Pieczonka, T. (2017). Glacier Mass Loss during the 1960s and 1970s in the Ak-Shirak Range (Kyrgyzstan) from Multiple Stereoscopic Corona and Hexagon Imagery. Remote Sensing 9 (3). doi:10.3390/rs9030275
Haberkorn, A., Kenner, R., Noetzli, J., and Phillips, M. (2021). Changes in Ground Temperature and Dynamics in Mountain Permafrost in the Swiss Alps. Front. Earth Sci. 9, 234. doi:10.3389/feart.2021.626686
Hanshaw, M. N., and Bookhagen, B. (2014). Glacial Areas, lake Areas, and Snow Lines from 1975 to 2012: Status of the Cordillera Vilcanota, Including the Quelccaya Ice Cap, Northern central Andes, Peru. The Cryosphere 8 (2), 359–376. doi:10.5194/tc-8-359-2014
Häusler, H., Leber, D., Schreilechner, M., Morawetz, R., Lentz, H., Skuk, St., et al. (2000). Final Report of Raphstreng Tsho Outburst Flood Mitigatory Project (Lunana, Northwestern Bhutan) Phase II. Vienna: University of Vienna, Institute of Geology.
Hegglin, E., and Huggel, C. (2008). An Integrated Assessment of Vulnerability to Glacial Hazards. Mountain Res. Develop. 28 (3/4), 299–309. doi:10.1659/mrd.0976
Huggel, C., Kääb, A., Haeberli, W., and Krummenacher, B. (2003). Regional-scale GIS-Models for Assessment of Hazards from Glacier lake Outbursts: Evaluation and Application in the Swiss Alps. Nat. Hazards Earth Syst. Sci. 3 (6), 647–662. doi:10.5194/nhess-3-647-2003
Huggel, C., Kääb, A., Haeberli, W., Teysseire, P., and Paul, F. (2002). Remote Sensing Based Assessment of Hazards from Glacier lake Outbursts: a Case Study in the Swiss Alps. Can. Geotech. J. 39 (2), 316–330. doi:10.1139/t01-099
Hugonnet, R., McNabb, R., Berthier, E., Menounos, B., Nuth, C., Girod, L., et al. (2021). Accelerated Global Glacier Mass Loss in the Early Twenty-First century. Nature 592 (7856), 726–731. doi:10.1038/s41586-021-03436-z
Ives, J. D., Shrestha, R. B., and Mool, P. K. (2010). Formation of Glacial Lakes in the Hindu Kush-Himalayas and GLOF Risk Assessment. Kathmandu, Nepal: ICIMOD.
Karma, T., Ageta, Y., Naito, N., Iwata, S., and Yabuki, H. (2003). Glaicer Distribution in the Himalayas and Glacier Shinkage from 1963 to 1993 in Bhutan Himalayas. Bull. Glaciological Res. 20 (12), 29-41.
Katel, O. N., Schmidt-Vogt, D., and Dendup, N. (2015). Transboundary Water Resources Management in the Context of Global Environmental Change: The Case of Bhutan Himalaya. Cham, Switzerland: Springer International Publishing Switzerland.
Khadka, N., Chen, X., Nie, Y., Thakuri, S., Zheng, G., and Zhang, G. (2021). Evaluation of Glacial Lake Outburst Flood Susceptibility Using Multi-Criteria Assessment Framework in Mahalangur Himalaya. Front. Earth Sci. 8, 601288. doi:10.3389/feart.2020.601288
Khadka, N., Zhang, G., and Thakuri, S. (2018). Glacial Lakes in the Nepal Himalaya: Inventory and Decadal Dynamics (1977-2017). Remote Sensing 10 (12), 1913. doi:10.3390/rs10121913
King, O., Bhattacharya, A., Bhambri, R., and Bolch, T. (2019). Glacial Lakes Exacerbate Himalayan Glacier Mass Loss. Sci. Rep. 9 (1), 18145. doi:10.1038/s41598-019-53733-x
King, O., Dehecq, A., Quincey, D., and Carrivick, J. (2018). Contrasting Geometric and Dynamic Evolution of lake and Land-Terminating Glaciers in the central Himalaya. Glob. Planet. Change 167, 46–60. doi:10.1016/j.gloplacha.2018.05.006
Koike, T., and Takenaka, S. (2012). Scenario Analysis on Risks of Glacial Lake Outburst Floods on the Mangde Chhu River, Bhutan. Glob. Environ. Res. 9, 41-49.
Komori, J., Koike, T., Yamanokuchi, T., and Tshering, P. (2012). Glacial Lake Outburst Events in the Bhutan Himalayas. Glob. Environ. Res. 16, 12.
Komori, J. (2008). Recent Expansions of Glacial Lakes in the Bhutan Himalayas. Quat. Int. 184 (1), 177–186. doi:10.1016/j.quaint.2007.09.012
Lee, S., Stroeve, J., Tsamados, M., and Khan, A. L. (2020). Machine Learning Approaches to Retrieve Pan-Arctic Melt Ponds from Visible Satellite Imagery. Remote Sensing Environ. 247, 111919. doi:10.1016/j.rse.2020.111919
Li, J., and Sheng, M. (2012). An automated scheme for glacial lake dynamics mapping using Landsat imagery and digital elevation models: a case study in the Himalayas. International Journal of Remote Sensing 33 (16), 5194–5213. doi:10.1080/01431161.2012.657370
Liu, X., Cheng, Z., Yan, L., and Yin, Z.-Y. (2009). Elevation Dependency of Recent and Future Minimum Surface Air Temperature Trends in the Tibetan Plateau and its Surroundings. Glob. Planet. Change 68 (3), 164–174. doi:10.1016/j.gloplacha.2009.03.017
Luo, P., Xu, C., Kang, S., Huo, A., Lyu, J., Zhou, M., et al. (2021). Heavy Metals in Water and Surface Sediments of the Fenghe River Basin, China: Assessment and Source Analysis. Water Sci. Technol. 1–18. doi:10.2166/wst.2021.335
Maharjan, S. B., Mool, P. K., Wu Lizong, G. X., Shrestha, F., Shrestha, R. B., Khanal, N. R., et al. (2018). The Status of Glacial Lakes in the Hindu Kush Himalaya. Available at: https://lib.icimod.org/record/33736.
McFeeters, S. K. (1996). The Use of the Normalized Difference Water Index (NDWI) in the Delineation of Open Water Features. Int. J. Remote Sensing 17 (7), 1425–1432. doi:10.1080/01431169608948714
MOEA (2021). Bhutan Sustainable Hydropower Development Policy 2021. Thimphu, Bhutan: Ministry of Economic Affairs, Royal Government of Bhutan. Available at: https://www.gnhc.gov.bt/en/wp-content/uploads/2021/05/Bhutan-Sustainable-Hydropower-Development-Policy-2021.pdf.
Mool, P. K., Wangda, D., Bajracharya, S. R., Joshi, S. P., Kunzang, K., and Gurung, D. R. (2001). Inventory of Glaciers, Glacial Lakes and Glacial Lake Outburst Floods: Monitoring and Early Warning Systems in the Hindu Kush-Himalayan Region - Bhutan. Kathmandu, Nepal: ICIMOD. Available at: https://lib.icimod.org/record/21962.
Nagai, H., Fujita, K., Sakai, A., Nuimura, T., and Tadono, T. (2016). Comparison of Multiple Glacier Inventories with a New Inventory Derived from High-Resolution ALOS Imagery in the Bhutan Himalaya. The Cryosphere 10 (1), 65–85. doi:10.5194/tc-10-65-2016
Nagai, H., Ukita, J., Narama, C., Fujita, K., Sakai, A., Tadono, T., et al. (2017). Evaluating the Scale and Potential of GLOF in the Bhutan Himalayas Using a Satellite-Based Integral Glacier-Glacial Lake Inventory. Geosciences 7 (3), 77. doi:10.3390/geosciences7030077
Nagy, T., and Andreassen, L. (2019). Glacier lake Mapping with Sentinel-2 Imagery in Norway. Norwegian water resources and energy directorate, Norway: Norges vassdrags- og energidirektorat publication: Majorstua, Norway.
NCHM (2019a). Annual Report. PO Box: 2017. Thimphu, Bhutan: National Center for Hydrology and Meteorology Royal Government of Bhutan.
NCHM (2018). Climate Data Book of Bhutan. PO Box: 2017. Thimphu, Bhutan: National Center for Hydrology and Meteorology Royal Government of Bhutan.
NCHM (2019b). Detailed Assessment Report on GLOF hazard from Thorthormi Glacial Lakes and Asssociated Glaciers. PO Box: 2017. Thimphu, Bhutan: National Center for Hydrology and Meteorology Royal Government of Bhutan.
NCHM (2019c). Reassessment of Potentially Dangerous Glacial Lakes in Bhutan. PO Box: 2017. Thimphu, Bhutan: National Center for Hydrology and Meteorology Royal Government of Bhutan.
Nie, Y., Liu, Q., Wang, J., Zhang, Y., Sheng, Y., and Liu, S. (2018). An Inventory of Historical Glacial lake Outburst Floods in the Himalayas Based on Remote Sensing Observations and Geomorphological Analysis. Geomorphology 308, 91–106. doi:10.1016/j.geomorph.2018.02.002
Nie, Y., Sheng, Y., Liu, Q., Liu, L., Liu, S., Zhang, Y., et al. (2017). A Regional-Scale Assessment of Himalayan Glacial lake Changes Using Satellite Observations from 1990 to 2015. Remote Sensing Environ. 189, 1–13. doi:10.1016/j.rse.2016.11.008
Osti, R., Egashira, S., and Adikari, Y. (2013). Prediction and Assessment of Multiple Glacial lake Outburst Floods Scenario in Pho Chu River basin, Bhutan. Hydrol. Process. 27 (2), 262–274. doi:10.1002/hyp.8342
Otto, J.-C. (2019). Proglacial Lakes in High Mountain Environments. Springer Nature Switzerland, 231–247. doi:10.1007/978-3-319-94184-4_14
Pepin, N., Bradley, R. S., Diaz, H. F., Baraer, M., Caceres, E. B., Forsythe, N., et al. (2015). Elevation-dependent Warming in Mountain Regions of the World. Nat. Clim Change 5 (5), 424–430. doi:10.1038/nclimate2563
Prakash, C., and Nagarajan, R. (2017a). Glacial Lake Inventory and Evolution in Northwestern Indian Himalaya. IEEE J. Sel. Top. Appl. Earth Observations Remote Sensing 10 (12), 5284–5294. doi:10.1109/jstars.2017.2767098
Prakash, C., and Nagarajan, R. (2017b). Outburst Susceptibility Assessment of Moraine-Dammed Lakes in Western Himalaya Using an Analytic Hierarchy Process. Earth Surf. Process. Landforms 42 (14), 2306–2321. doi:10.1002/esp.4185
RGI Consortium (2017). Randolph Glacier Inventory – A Dataset of Global Glacier Outlines: Version 6.0: Technical Report. Tech. Rep. Glob. Land Ice Measurements Space. doi:10.7265/N5-RGI-60
Richardson, S. D., and Reynolds, J. M. (2000). An Overview of Glacial Hazards in the Himalayas. Quat. Int. 65 (66), 18. doi:10.1016/S1040-6182(99)00035-X
Röhl, K. (2008). Characteristics and Evolution of Supraglacial Ponds on Debris-Covered Tasman Glacier, New Zealand. J. Glaciol. 54 (188), 867–880. doi:10.3189/002214308787779861
Romstad, B., Harbitz, C. B., and Domaas, U. (2008). A GIS Method for Assessment of Rock Slide Tsunami hazard in All Norwegian Lakes and Reservoirs. Nat. Hazards Earth Syst. Sci. 9, 353–364. doi:10.5194/nhess-9-353-2009
Rounce, D. R., McKinney, D. C., Lala, J. M., Byers, A. C., and Watson, C. S. (2016). A New Remote hazard and Risk Assessment Framework for Glacial Lakes in the Nepal Himalaya. Hydrol. Earth Syst. Sci. 20 (9), 3455–3475. doi:10.5194/hess-20-3455-2016
Rupper, S., Schaefer, J. M., Burgener, L. K., Koenig, L. S., Tsering, K., and Cook, E. R. (2012). Sensitivity and Response of Bhutanese Glaciers to Atmospheric Warming. Geophys. Res. Lett. 39 (19), n/a. doi:10.1029/2012gl053010
Saaty, T. L. (2008). Decision Making with the Analytic Hierarchy Process. Int. J. Serv. Sci. 1 (1), 16. doi:10.1504/ijssci.2008.017590
Sakai, A. (2018). Brief Communication: Updated GAMDAM Glacier Inventory over High-Mountain Asia. The Cryosphere 13, 2043–2049. doi:10.5194/tc-13-2043-2019
Salerno, F., Thakuri, S., D’Agata, C., Smiraglia, C., Manfredi, E. C., Viviano, G., et al. (2012). Glacial lake Distribution in the Mount Everest Region: Uncertainty of Measurement and Conditions of Formation. Glob. Planet. Change 92-93, 30–39. doi:10.1016/j.gloplacha.2012.04.001
Schaub, Y. (2015). Outburst Floods from high-mountain lakes: Risk Analysis of Aascading Processes under Present and Future Conditions. (PhD PhD). Zurich, Switzerland: University of Zurich. Available at: https://www.researchgate.net/publication/278673012_Outburst_Floods_from_High-Mountain_Lakes_Risk_Analysis_of_Cascading_Processes_under_Present_and_Future_Condition.
Shugar, D. H., Burr, A., Haritashya, U. K., Kargel, J. S., Watson, C. S., Kennedy, M. C., et al. (2020). Rapid Worldwide Growth of Glacial Lakes since 1990. Nat. Clim. Chang. 10 (10), 939–945. doi:10.1038/s41558-020-0855-4
Shugar, D.H., Jacquemart, M., Shean, D., Bhushan, S., Upadhyay, K., Sattar, A., et al. (2021). A massive rock and ice avalanche caused the 2021 disaster at Chamoli, Indian Himalaya. Science 373 (6552), 300. doi:10.1126/science.abh4455
Song, D.-X., Huang, C., Sexton, J. O., Channan, S., Feng, M., Townshend, J. R., et al. (2015). Use of Landsat and Corona data for mapping forest cover change from the mid-1960s to 2000s: Case studies from the Eastern United States and Central Brazil. ISPRS Journal of Photogrammetry and Remote Sensing 103, 81–92. doi:10.1016/j.isprsjprs.2014.09.005
Swanson, D. K. (2021). Permafrost Thaw‐related Slope Failures in Alaska's Arctic National Parks, C . 1980-2019. Permafrost and Periglac Process 32 (3), 392–406. doi:10.1002/ppp.2098
Taylor, C. J., Carr, J. R., and Rounce, D. R. (2021). Spatiotemporal Supraglacial Pond and Ice Cliff Changes in the Bhutan-Tibet Border Region from 2016 to 2018. J. Glaciol. 2021, 1–13. doi:10.1017/jog.2021.76
Tshering, P., and Fujita, K. (2016). First In Situ Record of Decadal Glacier Mass Balance (2003-2014) from the Bhutan Himalaya. Ann. Glaciol. 57 (71), 289–294. doi:10.3189/2016AoG71A036
Tshering, S., and Tamang, B. (2004). Hydropower - Key to Sustainable, Socio-Economic Development of Bhutan. Beijing, China: Paper presented at the United Nations Symposium on Hydropower and Sustainable Development. Available at: https://www.un.org/esa/sustdev/sdissues/energy/op/hydro_tsheringbhutan.pdf.
Tsutaki, S., Fujita, K., Nuimura, T., Sakai, A., Sugiyama, S., Komori, J., et al. (2019). Contrasting Thinning Patterns between lake- and Land-Terminating Glaciers in the Bhutanese Himalaya. The Cryosphere 13 (10), 2733–2750. doi:10.5194/tc-13-2733-2019
Ukita, J., Narama, C., Tadono, T., Yamanokuchi, T., Tomiyama, N., Kawamoto, S., et al. (2011). Glacial lake Inventory of Bhutan Using ALOS Data: Methods and Preliminary Results. Ann. Glaciol. 52 (58), 65–71. doi:10.3189/172756411797252293
U.S. Geological Survey (2008). Declassified Intelligence Satellite Photographs: U.S. Geological Survey Fact Sheet 2008–3054. Reston, USA: U.S. Geological Survey.
Veh, G., Korup, O., and Walz, A. (2020). Hazard from Himalayan Glacier lake Outburst Floods. Proc. Natl. Acad. Sci. USA 117 (2), 907–912. doi:10.1073/pnas.1914898117
Wang, W., Gao, Y., Anacona, I. P., Lei, Y., Xiang, Y., Zhang, G., et al. (2018). Integrated hazard Assessment of Cirenmaco Glacial lake in Zhangzangbo valley, Central Himalayas. Geomorphology 306, 292–305. doi:10.1016/j.geomorph.2015.08.013
Wang, X., Ding, Y., Liu, S., Jiang, L., Wu, K., Jiang, Z., et al. (2013). Changes of Glacial Lakes and Implications in Tian Shan, central Asia, Based on Remote Sensing Data from 1990 to 2010. Environ. Res. Lett. 8 (4), 044052. doi:10.1088/1748-9326/8/4/044052
Wang, X., Guo, X., Yang, C., Liu, Q., Wei, J., Zhang, Y., et al. (2020). Glacial lake Inventory of High-Mountain Asia in 1990 and 2018 Derived from Landsat Images. Earth Syst. Sci. Data 12 (3), 2169–2182. doi:10.5194/essd-12-2169-2020
Wang, W., Gao, Y., Yang, X., and Kattel, D. B. (2011). A First-order Method to Identify Potentially Dangerous Glacial Lakes in a Region of the Southeastern Tibetan Plateau. Mountain Research and Development. 31 (2). doi:10.1659/mrd-journal-d-10-00059.1
Wangchuk, S., and Bolch, T. (2020). Mapping of Glacial Lakes Using Sentinel-1 and Sentinel-2 Data and a Random forest Classifier: Strengths and Challenges. Sci. Remote Sensing 2, 100008. doi:10.1016/j.srs.2020.100008
Wangchuk, S., Bolch, T., and Zawadzki, J. (2019). Towards Automated Mapping and Monitoring of Potentially Dangerous Glacial Lakes in Bhutan Himalaya Using Sentinel-1 Synthetic Aperture Radar Data. Int. J. Remote Sensing 40 (12), 4642–4667. doi:10.1080/01431161.2019.1569789
Watanbe, T., and Daniel, R. (1996). The 1994 Lugge Tsho Glacial lake Outburst Flood, Bhutan Himalaya. Mountain Res. Develop. 16 (1), 5. doi:10.2307/3673897
Worni, R., Huggel, C., Clague, J. J., Schaub, Y., and Stoffel, M. (2014). Coupling Glacial lake Impact, Dam Breach, and Flood Processes: A Modeling Perspective. Geomorphology 224, 161–176. doi:10.1016/j.geomorph.2014.06.031
Worni, R., Huggel, C., and Stoffel, M. (2013). Glacial Lakes in the Indian Himalayas - from an Area-wide Glacial lake Inventory to On-Site and Modeling Based Risk Assessment of Critical Glacial Lakes. Sci. Total Environ. 468-469 (Suppl. l), S71–S84. doi:10.1016/j.scitotenv.2012.11.043
Worni, R., Stoffel, M., Huggel, C., Volz, C., Casteller, A., and Luckman, B. (2012). Analysis and Dynamic Modeling of a Moraine Failure and Glacier lake Outburst Flood at Ventisquero Negro, Patagonian Andes (Argentina). J. Hydrol. 444, 134. doi:10.1016/j.jhydrol.2012.04.013
Xianbao, Z., Luo, P., Zhu, W., Wang, S., Lyu, J., Zhou, M., et al. (2021). A Bibliometric Analysis of the Research on Sponge City: Current Situation and Journal of Hydrology. J. Hydrol. 444-445, 134–145. doi:10.1016/j.jhydrol.2012.04.013
Xu, D., and Feng, Q. (1994). Dangerous Glacier Lakes and Their Outburst Features in the Tibetan Himalayas. Bull. glacier Res. 9.
Yamada, T. (1998). Glacier Lake and its Outburst Flood in the Nepal Himalaya. Tokyo: Japanese Society of Snow and Ice.
Yao, T., Thompson, L. G., Mosbrugger, V., Zhang, F., Ma, Y., Luo, T., et al. (2012). Third Pole Environment (TPE). Environ. Develop. 3, 52–64. doi:10.1016/j.envdev.2012.04.002
Zhang, G., Bolch, T., Allen, S., Linsbauer, A., Chen, W., and Wang, W. (2019). Glacial lake Evolution and Glacier-lake Interactions in the Poiqu River basin, central Himalaya, 1964-2017. J. Glaciol. 65 (251), 347–365. doi:10.1017/jog.2019.13
Zhang, G., Yao, T., Xie, H., Wang, W., and Yang, W. (2015). An Inventory of Glacial Lakes in the Third Pole Region and Their Changes in Response to Global Warming. Glob. Planet. Change 131, 148–157. doi:10.1016/j.gloplacha.2015.05.013
Keywords: glacial lake mapping, GLOF hazard potential, Corona KH-4, Sentinel-2, Analytical Hierarchy Process (AHP), Bhutan Himalaya
Citation: Rinzin S, Zhang G and Wangchuk S (2021) Glacial Lake Area Change and Potential Outburst Flood Hazard Assessment in the Bhutan Himalaya. Front. Earth Sci. 9:775195. doi: 10.3389/feart.2021.775195
Received: 13 September 2021; Accepted: 08 November 2021;
Published: 25 November 2021.
Edited by:
Frédéric Frappart, UMR5566 Laboratoire d’Etudes en Géophysique et Océanographie Spatiales (LEGOS), FranceCopyright © 2021 Rinzin, Zhang and Wangchuk. This is an open-access article distributed under the terms of the Creative Commons Attribution License (CC BY). The use, distribution or reproduction in other forums is permitted, provided the original author(s) and the copyright owner(s) are credited and that the original publication in this journal is cited, in accordance with accepted academic practice. No use, distribution or reproduction is permitted which does not comply with these terms.
*Correspondence: Guoqing Zhang, Z3VvcWluZy56aGFuZ0BpdHBjYXMuYWMuY24=