 Chang Li
 Victor Nnamdi Dike
 Zhaohui Lin
 Xuejie Gao
94% of researchers rate our articles as excellent or good
Learn more about the work of our research integrity team to safeguard the quality of each article we publish.
Find out more
ORIGINAL RESEARCH article
Front. Earth Sci., 16 November 2021
Sec. Interdisciplinary Climate Studies
Volume 9 - 2021 | https://doi.org/10.3389/feart.2021.771592
This article is part of the Research TopicThe Adaptation to and Mitigation of Climate-Sensitive Natural HazardsView all 21 articles
The southeast coastal region of China is susceptible to challenges related to extreme precipitation events; hence, projection of future climate extremes changes is crucial for sustainable development in the region. Using the Regional Climate Model Version 4 (RegCM4), the future changes of summer precipitation extremes have been investigated over the Jiulongjiang River Basin (JRB), a coastal watershed in Southeast China. Comparison between the RegCM4 simulated and observed rainy season precipitation over JRB suggests that the RegCM4 can reasonably reproduce the seasonal precipitation cycle, the frequency distribution of precipitation intensity, and the 50-year return levels of precipitation extremes over JRB. Furthermore, the model projects an increase in daily maximum rainfall (RX1day) mostly over the northern part of the basin and a decrease over other parts of the basin, while projecting a widespread decrease for maximum consecutive 5-day precipitation amount (RX5day) relative to the present day. In terms of the 50-year return level of RX1day (RL50yr_RX1day), a general increase is projected over most parts of the basin in the near and far future of the 21st century, but a decrease can be found in the northeast and southwest parts of the JRB in the mid-21st century. The future change of the 50-year return level of RX5day (RL50yr_RX5day) shows a similar spatial pattern with that of RL50yr_RX1day in the near and mid-21st century, but with a larger magnitude. However, a remarkable decrease in RL50yr_RX5day is found in the south basin in the far future. Meanwhile, the projected changes in the 50-year return level for both RX1day and RX5day differ between the first and second rainy seasons in JRB. Specifically, the future increase in RL50yr_RX5day over the north basin is mainly contributed by the changes during the first-half rainy season, while the decrease of RL50yr_RX5day in the south is mostly ascribed to the future changes during the second-half rainy season. All above results indicate that the future changes of precipitation extremes in JRB are complicated, which might differ from extreme indices, seasons, and future projected periods. These will thus be of practical significance for flood risk management, mitigation, and adaptation measures in Jiulongjiang River Basin.
Since the pre-industrial period, the observed global mean surface temperature has risen considerably, which is accompanied by more intense rainfall extremes over the globe (Kharin et al., 2013; Donat et al., 2016; IPCC, 2019; Dike et al., 2020). Extreme rainfall over short durations and prolonged wet periods are known for triggering devastating flash floods (Norbiato et al., 2007; Alfieri and Thielen, 2015) and riverine floods (Tol et al., 2003; Dottori et al., 2018; Khalid et al., 2018). Intense precipitation extremes have also been reported in many river basins across China (Su et al., 2006; Gemmer et al., 2011; Wu X. et al., 2016), and this has been linked to flooding events of unprecedented magnitude in these river basins (Chen et al., 2006). Flood disaster constitutes a significant challenge to the livelihood of the people, given its profound impacts on water resource allocation and scheduling, and natural ecosystems in the watershed (Merz et al., 2010; IPCC, 2014; Hammond et al., 2015; Wobus et al., 2017).
Meanwhile, given the large population and rapid economic development, coastal areas are highly vulnerable to extreme precipitation events, typhoons, storm surge, and associated flood disasters (Lian et al., 2013; Wahl et al., 2015; Wang et al., 2017; Fang et al., 2020, 2021). In addition, medium and small-scale watersheds are highly susceptible to flash floods and riverine floods due to their steep mountainous terrain, low drainage capacity in urban areas, low regulation capacity, and short confluence time of floodwaters (Xu et al., 2000; Chen, 2014; Li et al., 2018; Yuan et al., 2021). As one of the medium-sized coastal watersheds in Southeast China, the Jiulongjiang River Basin (JRB) is also known for its susceptibility to extreme rainfall and associated flood disasters (Shen et al., 2019; Tang et al., 2021). Record-breaking extreme precipitation events and the attendant flood episodes have been reported in the basin (Huang et al., 2013; Su et al., 2016; Ervinia et al., 2018; Xiong et al., 2020; Chen et al., 2006). It is also found that precipitation extremes have increased significantly since the early 1990s, arising from the increase in convective activities over South China driven by interdecadal change of latent heat flux over the South China Sea and sensible heat flux over the Indochina peninsula (Ning and Qian, 2009). Therefore, it is imperative to explore the future changes of extreme precipitation events over JRB, which is crucial for planning holistic adaptation and mitigation strategies to forestall the devastating impact of flood hazards in the future.
Among different extreme indices, the Expert Team on Climate Change Detection Indices (ETCCDI) is commonly used for the investigation of climate extremes (Peterson et al., 2002; Zhang et al., 2011). Meanwhile, the return value fitting from a statistical extreme distribution is also widely utilized for the examination of the characteristics of precipitation extremes (Fischer et al., 2010; Xu et al., 2018). Generally, these methods have been used extensively for the investigation of precipitation extremes in both observational and numerical model studies (Fischer et al., 2010; Qin and Xie, 2016; Wu Y. et al., 2016; Xu et al., 2018). For instance, Qin and Xie (2016) examined future changes in precipitation extremes in many river basins across China and concluded that the maximum consecutive 5-day precipitation (RX5day), which is one of the ETCCDI extreme rainfall indices, will occur in most river basins in the future. Meanwhile, Su et al. (2016) reported a significant increase in the observed summer heavy precipitation days over the Yangtze River basin. Interestingly, Wu Y. et al. (2016) established that less frequent but more intense precipitation extremes will be prevalent in the future over the Yangtze River basin, with more distinct changes in mean precipitation. Relatedly, while examining the probability distribution of annual precipitation extremes over the Zhujiang River Basin during the 1961–2007 period, Fischer et al. (2010) estimated an average value of 200 and 329 mm for the 50-year return level for RX1day and RX5day, respectively. Furthermore, Xu et al. (2018) investigated the projected changes in RX5day extremes over China as measured by 50-year return values and found a general increase in the 50-year return values of RX5day in the future.
It is well recognized that the global climate model (GCM) is an important tool to project future climate change under different emission scenarios (Xu and Xu, 2012; Chen and Sun, 2013; Sillmann et al., 2013a; Sillmann et al., 2013b; Wuebbles et al., 2014; Zhou et al., 2014). However, GCMs struggle to capture the detailed characteristics of precipitation extremes on a watershed scale due to their relatively low resolution (Tabari et al., 2016). Therefore, dynamic downscaling approaches with high-resolution regional climate models (RCMs) are commonly utilized for future projection of climate extremes at the regional scale, specifically at small- to medium-sized watershed scale (Graham et al., 2007; Fischer et al., 2013; Halmstad et al., 2013; Qin and Xie, 2016). Among all these RCMs, the RegCM4 is one of the widely used models for regional climate simulation and future projection, especially over the East Asia region (Gu et al., 2012; Oh et al., 2014; Gao and Giorgi, 2017; Im et al., 2017; Wu and Gao, 2020). It is acclaimed for its robustness in reproducing the present-day climatology of summer precipitation in many river basins across China (Gao X. et al., 2017).
The main objective of this paper is therefore to investigate future changes in precipitation extremes over the JRB in the coastal region of Southeast China, based on the projection outputs from RegCM4 driven by a well-performed GCM. The analysis focuses on the very-high-risk events defined by the 50-year return levels of the intense precipitation extremes, particularly RX1day and RX5day, which are associated with flash and riverine flood disasters (Fischer et al., 2010; Kirchmeier-Young and Zhang, 2020). In addition, the absolute values of RX1day and RX5day are also presented. We compared the simulated seasonal cycle, the frequency distribution of precipitation, and return levels of precipitation extremes in the present day against observations to validate the model performance and thereafter investigated the projected changes of precipitation extremes under a medium greenhouse gas emission scenario, i.e., RCP4.5. The remainder of this paper is organized as follows. The study area, datasets, and methods are described in Section 2, followed by the validation of present-day simulations in Section 3. Section 4 provides the main results and discussions, including changes in the future precipitation extremes and their 50-year return levels, and the concluding remarks are presented in Section 5.
The JRB is a middle-sized coastal watershed in the southeastern part of China (Figure 1), covering 116°50′ to 118°02′E and 24°12′ to 25°44′N. The watershed is located in the subtropical monsoon climate zone with a drainage area of 14,700 km2 and mountainous catchments in the upper reaches. In addition, the basin is adjacent to the Northwest Pacific Ocean, which is one of the main sources of the global tropical cyclone. There are also nine meteorological stations distributed along the Jiulongjiang River. Among them, Zhangping, Longyan, and Huaan stations are situated in the mountainous upper reaches, which extend into the inland area and are relatively less affected by typhoons. Six other stations, i.e., Changtai, Nanjing, Pinghe, Zhangzhou, Longhai, and Xiamen, are located in the downstream plain area, which is greatly susceptible to typhoon activities.
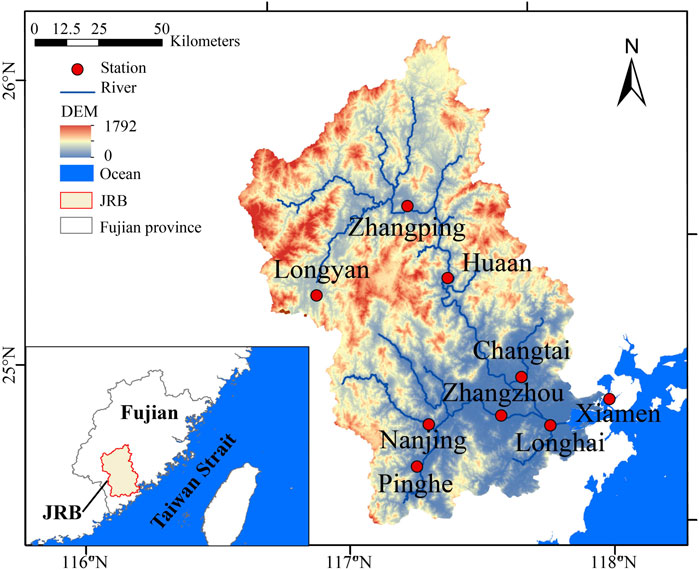
FIGURE 1. The location and topography of JRB and the distribution of rain gauging stations. The elevations are colored based on a Digital Elevation Model. The red and grey line indicate the boundary of JRB and Fujian province respectively.
This study uses the Regional Climate Model version 4 (RegCM4), a widely used RCM for regional climate simulation and projection over East Asia. The model used the Coordinated Regional Climate Downscaling Experiment (CORDEX) Phase II East Asia domain at 25-km grid spacing, with 18 vertical sigma layers and a model top at 10 hPa. The RegCM4 configuration follows Gao L. et al. (2017), while it used the CLM3.5 land surface scheme (Oleson et al., 2008), the convection scheme of Emanuel (1991), and a more reasonable land cover dataset over China (Han et al., 2017).
Meanwhile, the historical simulation and 21st-century climate change projection results from the Hadley Centre Earth System Model-Earth System (HadGEM2-ES; Collins et al., 2011), one of the participating climate models for the Coupled Model Intercomparison Project Phase 5 (CMIP5, Taylor et al., 2012), are used to drive the RegCM4 model to obtain the high-resolution historical climate simulation and future climate change projection over the JRB. HadGEM2-ES is a coupled Atmosphere-Ocean General Circulation Model (AOGCM) with an atmospheric horizontal resolution of 1.875° × 1.25° with 38 vertical levels and an ocean resolution of 1° (increasing to 1/3° at the equator) and 40 vertical levels. Besides, the carbon cycle and short-lived forcing agents (gas and aerosol phase) components are added to HadGEM2-ES due to their large effect on the climate. Previous studies have demonstrated the capability of HadGEM2-ES in representing the main observed characteristics of the East Asian monsoon precipitation (Sperber et al., 2013; Jiang et al., 2016). It is also utilized as the only model to provide initial and lateral boundary conditions for RegCM4 to project the future climate change in the 21st century over Western Africa and China (Diallo et al., 2016; Shi et al., 2018) due to its good performance over the studied regions.
The historical simulation covers the period 1968–2005 for the present day with observed time-evolving greenhouse gas concentrations and 2006–2098 for the future. Considering the plausibility of a significant reduction in greenhouse gas emission due to the international efforts and commitment to carbon neutrality, with 2060 as the carbon neutrality target year for China (Mallapaty, 2020), a medium-range emission scenario (i.e., RCP4.5; Moss et al., 2010) is most likely probable. Therefore, this study only considers the projected changes in precipitation extremes under the mid-level pathway, thus RCP4.5. Meanwhile, we would also like to focus more on the projected changes of precipitation extremes before 2060, which is consistent with the target year for carbon neutrality in China.
To validate the performance of RegCM4 in reproducing the present-day rainfall extremes over the JRB, rainfall dataset from nine rain gauge stations obtained by the China Meteorological Agency (hereafter CMA), i.e., Zhangping, Longyan, Huaan, Changtai, Nanjing, Pinghe, Zhangzhou, Longhai, and Xiamen stations, has been utilized. We compared the simulated annual cycle, the frequency distribution of daily precipitation intensity, and 50-year return levels of precipitation extremes in the present day against observations to validate the model performance, with a focus on the entire rainy season from May to September in the river basin.
This study uses extreme precipitation indices recommended by the ETCCDI (Karl et al., 1999; Peterson et al., 2002; Zhang et al., 2011). We focus on two indices that are closely related to flash and riverine flood disasters (Zhang et al., 2011; Alexander and Herold, 2015; Kirchmeier-Young and Zhang, 2020), i.e., RX1day for the maximum 1-day precipitation and RX5day for the maximum consecutive 5-day precipitation.
The 50-year return level, the threshold that is exceeded by seasonal or annual extreme with a probability of 2%, has also been utilized as another index for measuring the amplitude of precipitation extreme under the fixed probability of occurrence. Events with a magnitude of rainfall amount exceeding the 50-year return level threshold value can be considered as rare and very high risk. The 50-year return levels of the abovementioned rainfall indices RX1day and RX5day are hereafter referred to as RL50yr_RX1day and RL50yr_RX5day, respectively, and the parametric extreme value approach is applied in this study to esimate the 50-year return levels of RX1day and RX5day (Min et al., 2011; Kharin et al., 2013).
To get the RL50yr_RX1day, the extreme-value sample is constructed from RX1day in a given season of each year during an n-year period. Thereafter, the sample is sorted in a descending order (x1, x2, …, xm, …, xn), and the associated empirical frequencies (1/(1 + n), 2/(1 + n), …, m/(1 + n), …n/(1 + n)) are calculated. Then following Yan et al. (2014), the Pearson III (P-III) distribution (Srikanthan and McMahon, 1981) is used to fit the sample with the empirical frequency. Finally, the corresponding 50-year maximum 1-day precipitation is determined from the fitted P-III function with the probability of 2%. The RL50yr_RX5day is estimated in the same way as the fitting sample constructed from RX5day.
Accordingly, the mean state of extreme precipitation indices (RX1day and RX5day) and their 50-year return values (RL50yr_RX1day and RL50yr_RX5day) are estimated for the present period (1986–2005) and the near future (2021–2040), mid-future (2041–2060), and far future (2081–2098). Additionally, the projected changes in precipitation extremes are defined as the difference between values for a future period and the present-day levels.
To evaluate the performance of RegCM4 in simulating rainfall over JRB, we assess the ability of the model in representing the observed (1986–2005) seasonal rainfall cycle and the frequency distribution of daily precipitation, as well as the 50-year return levels of RX1day and RX5day in each station for the entire rainy season.
Figure 2 shows the seasonal evolution of mean rainfall at the nine stations from CMA station observations and RegCM4 simulations during the present-day period (1986–2005). Approximately 65% of the annual precipitation occurs from May to September (hereafter rainy season). The observed annual rainfall at each station is characterized by a bimodal pattern, with two peaks occurring in June and August. Rainfall increases from January and reaches its first peak in June, with a magnitude of 8.3 mm/day on average, corresponding with the onset of the Indian monsoon, which strengthens moisture transport to South China from the South China Sea (Li, 1999). Thereafter, an abrupt rainfall retreat is observed in July with a minimum of 5.7 mm/day on average, as a result of the northward shift of the East Asian monsoon rain belt (Huang et al., 2009; Zhang and Wei, 2009; Li et al., 2013). The rainfall then increases in August with a mean of 8.5 mm/day, resulting from an attendant increase in moisture convergence over the river basin due to typhoon activities (Xiaoyan et al., 2017). A substantial reduction is observed from 5.8 to 1.2 mm/day in September to December, respectively. This suggests that the entire rainy season in the JRB can also be separated into two sub-rainy seasons, i.e., the first rainy season during May to June and the second rainy season from July to September, due to the bimodal seasonal cycle and their different climatic drivers.
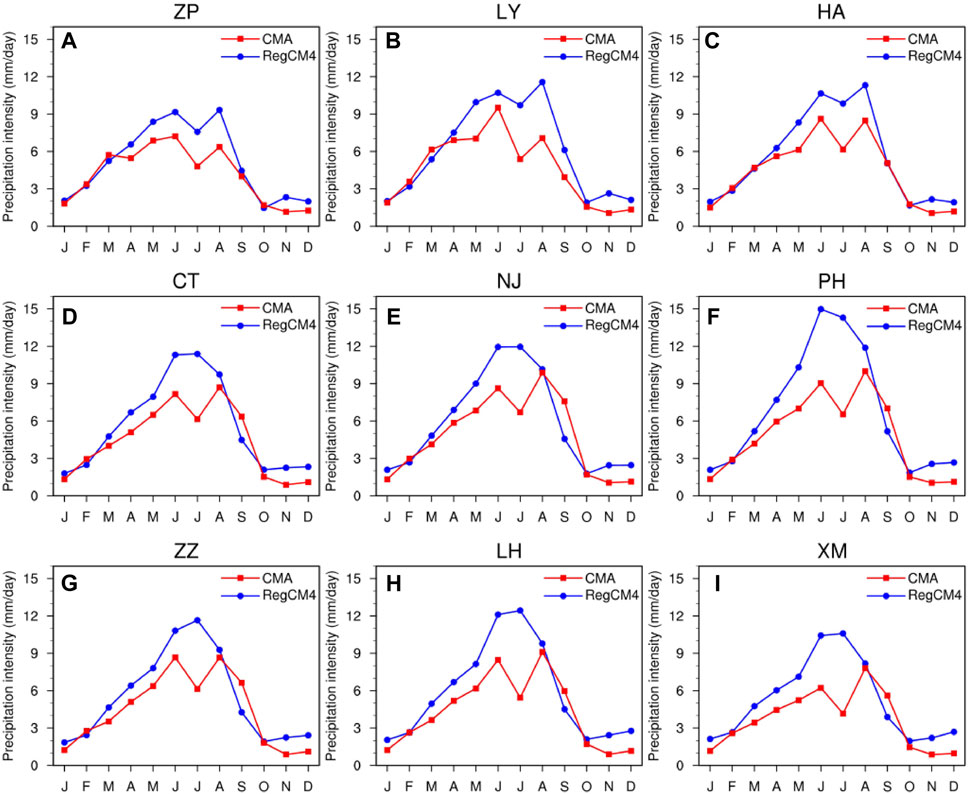
FIGURE 2. The seasonal cycle of monthly mean precipitation (mm/day) at (A) Zhangping, (B) Longyan, (C) Huaan, (D) Changtai, (E) Nanjing, (F) Pinghe, (G) Zhangzhou, (H) Longhai, and (I) Xiamen meteorological stations during 1986–2005. The red lines are for observations and blue lines for RegCM4 outputs driven by HadGEM2-ES.
Compared with the observations, the RegCM4 skillfully captured the seasonal evolution of precipitation over JRB. At Zhangping, Longyan, and Huaan stations in the upstream basin, the simulated precipitation cycle shows a similar bimodal seasonal cycle to the observations (Figures 2A–C). For the downstream stations (Changtai, Nanjing, Pinghe, Zhangzhou, Longhai, and Xiamen), the simulations captured the maximum rainfall from May through September and the minimum from October through April, albeit with a peak in July, which is contrary to the observation (Figures 2D–I). Meanwhile, a slight overestimation of 2–3 mm/day in the rainy season is found at each station, which could be ascribed to the excessive moisture transportation simulated by RegCM4 (Pattnayak et al., 2018).
Figure 3 shows the frequency distribution of daily precipitation intensity calculated at nine stations for the entire rainy season over JRB from the RegCM4 simulations and CMA observations during the present-day period (1986–2005). The frequencies of heavy precipitation events (defined as daily precipitation ≥50 mm) are also presented in Table 1. The observed frequency displays an exponential decay with the increasing precipitation intensity. In general, the observed frequency of heavy precipitation events is higher at downstream stations Changtai, Nanjing, Pinghe, Zhangzhou, Longhai, and Xiamen (more than 3.0%) than at upstream stations Zhangping, Longyan, and Huaan (less than 2.8%). Besides, heavy precipitation events are most frequent at Nanjing and Pinghe with a frequency of about 3.9%, while maximum precipitation is about 140 mm/day at Zhangping, Longyan, and Huaan stations. Moreover, near the estuary station, higher precipitation intensity of about 220 and 240 mm/day can also be found for Longhai and Xiamen stations, respectively.
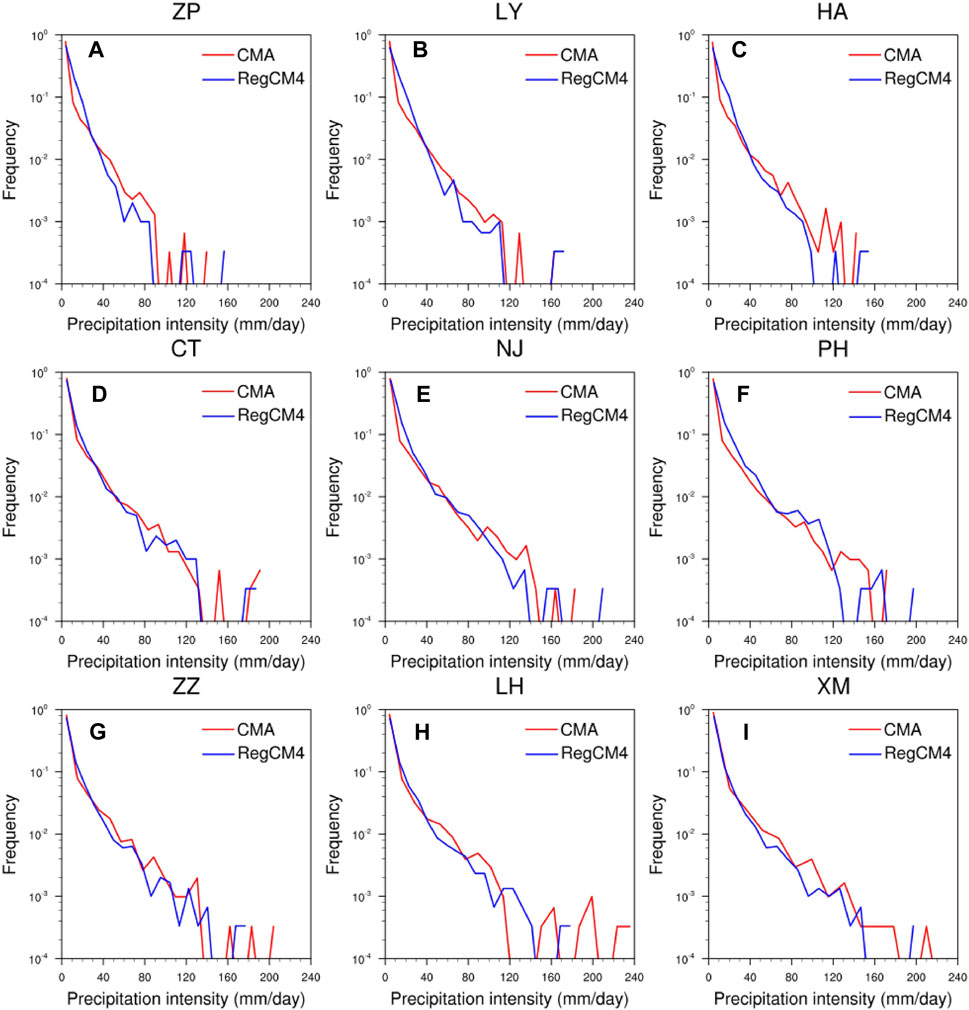
FIGURE 3. Frequency distributions of daily precipitation intensity (mm/day) calculated at (A) Zhangping, (B) Longyan, (C) Huaan, (D) Changtai, (E) Nanjing, (F) Pinghe, (G) Zhangzhou, (H) Longhai, and (I) Xiamen meteorological stations for the entire rainy season during 1986–2005. The red lines indicate the observation, and the blue lines are for RegCM4 simulation driven by HadGEM2-ES.

TABLE 1. CMA observed and RegCM4 simulated heavy rainfall frequencies (%) (daily precipitation intensity ≥50 mm) in the rainy season during the reference period of 1986–2005 at Zhangping, Longyan, Huaan, Changtai, Nanjing, Pinghe, Zhangzhou, Longhai, and Xiamen meteorological stations over JRB.
Compared to observations, the RegCM4 reproduced an exponential decay in frequency quite well with increasing precipitation intensity at each station. For the heavy precipitation events, the RegCM4 captured the observed characteristics of lower frequencies at the upstream stations and higher frequencies at the downstream stations. Furthermore, the frequencies of heavy precipitation events at Changtai, Pinghe, and Xiamen are 3.2%, 3.9%, and 3.0%, which are very close to the observed ones of 2.9%, 4.1%, and 2.6%, respectively. In addition, the largest precipitation intensity in Changtai and Huaan is about 190 and 155 mm/day with the biases between simulations and observations being less than 10 mm. Overall, Figure 3 and Table 1 indicate that RegCM4 performed well in representing the observed frequency of daily precipitation intensities during the rainy season in the river basin.
The observed and simulated present-day (1985–2006) 50-year return levels of RX1day and RX5day, as well as their relative biases, are presented in Table 2. From the observations, the downstream stations (Nanjing, Pinghe, Zhangzhou, Changtai, Longhai, and Xiamen) show more intense 50-year RX1day (in the range from 201 to 304 mm) than the upstream stations (Longyan, Zhangping, and Huaan) (less than 190 mm). Meanwhile, the smallest RL50yr_RX1day of 129 mm occurs at the upstream station Zhangping, while the largest RL50yr_RX1day of 304 mm is found at Longhai in the downstream region, which is likely induced by typhoon activities. Similarly, the observed RL50yr_RX5day also exhibits a more intense value at the downstream stations than at upstream stations, with the most extreme value of 644 mm at Longhai and the smallest one of 253 mm at Zhangping.
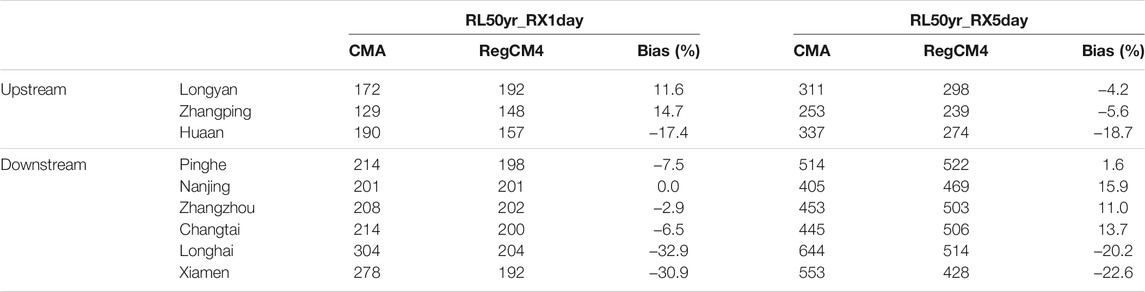
TABLE 2. 50-year return levels (mm) of RX1day and RX5day estimated from RegCM4 outputs driven by HadGEM2-ES and observed station data (CMA), and their relative bias at Zhangping, Longyan, Huaan, Changtai, Nanjing, Pinghe, Zhangzhou, Longhai, and Xiamen meteorological stations over JRB during the reference period of 1986–2005.
Compared to observations, the RegCM4 reasonably reproduced RL50yr_RX1day, with relative biases of less than 15% at most stations of JRB, except for Longhai and Xiamen stations. Notably, the simulated RL50yr_RX1day at Nanjing and Zhangzhou (201 and 202 mm) is nearly equal to the observations (201 and 208 mm). In addition, the model skillfully captured the more intense RL50yr_RX1day in downstream plain areas than in upstream mountainous areas. RegCM4 also simulated the maximum and minimum RL50yr_RX1day for Longhai and Zhangping, which is concordant with the observations. For RL50yr_RX5day, the biases between simulations and observations are mainly less than 16% at six out of nine stations, with less than 6% bias at Longyan, Zhangping, and Pinghe. The observed minimum RL50yr_RX5day at Zhangping can also be well simulated by RegCM4. Overall, the model exhibits good performance in reproducing the 50-year return level of RX1day and RX5day over JRB in the reference period (1986–2005).
Generally, the foregoing suggests that RegCM4 shows reasonably good performance in simulating the seasonal cycle, the frequency distribution of daily precipitation for the rainy season, and 50-year return levels of RX1day and RX5day over JRB. It is therefore rational to use the RegCM4 to project the future change in precipitation extremes over JRB, with the lateral forcing from HadGEM2-ES.
In this section, the projected changes of extreme precipitation (RX1day and RX5day) relative to the present-day levels and their 50-year return values (RL50yr_RX1day and RL50yr_RX5day) for different periods in the 21st century are presented. For simplicity, the present-day period of 1986–2005, near-future period of 2021–2040, mid-future period of 2041–2060, and far-future period of 2081–2098 will be referred to as P0, P1, P2, and P3 respectively.
Figure 4 presents the spatial distribution of average RX1day and RX5day over the JRB during 1986–2005 (hereafter P0), as well as the projected changes of RX1day and RX5day in different future periods relative to the present-day period. As shown in Figure 4A, the mean RX1day increases from 30 mm in the northeast basin to 80 mm in the southwest basin during P0. In the near future (P1: 2021–2040), the model projects inhomogeneous changes in RX1day in the region (Figure 4B). It is found that the southern and the northeastern extremities will experience about a 4-mm increase in mean RX1day, while the middle to the northwest will experience about a 4-mm decrease in RX1day as compared to the P0 period. The situation is not farfetched during period P2 (2021–2040) (Figure 4C); the basin will record a more significant reduction up to 12 mm in RX1day extremes in most areas, except for the north-central part area where a mild increase of less than 4 mm is found, leading to the comparable magnitude of RX1day in the northwest and south parts (Supplementary Figure S1). As shown in Figure 4D, the northern and southern parts might be exposed to more intense RX1day precipitation extremes while the central part will likely be exposed to a lesser magnitude of RX1day extremes at the end of the 21st century (P3: 2081–2098) relative to period P0.
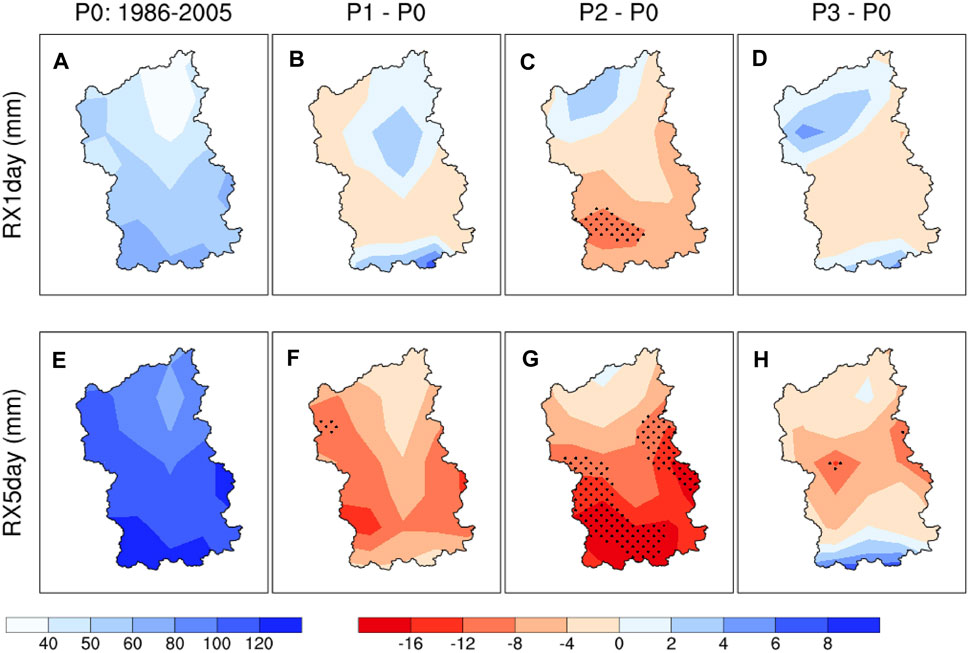
FIGURE 4. Spatial distribution of present-day (P0: 1986–2005) mean (A) RX1day and (E) RX5day for the entire rainy season in JRB, and the projected changes in precipitation extremes for (B–D) RX1day and (F–H) RX5day during the near-future P1 (2021–2040), mid-future P2 (2041–2060), and far-future P3 (2081–2098) relative to the present-day. The black dots indicate statistically significant changes at 90% confidence level.
Figures 4E–H show the results for maximum consecutive 5-day precipitation (RX5day). As shown in Figure 4E, considerable spatial variations can be seen in the mean RX5day extremes, with mean values exceeding 120 mm in the southwestern part while the least values of 80 mm are seen over the fringes of the northeast. Figure 4F illustrates that the near-future period will experience a widespread reduction of 4–12 mm in RX5day relative to the present-day levels. The reduction in RX5day further deepened in the mid-future; as such, Figure 4G shows a widespread significant reduction in RX5day extreme over the river basin, with the largest decrease of 16 mm in the southwest. In the far future, the RegCM4 projects an increase by 2–6 mm in RX5day only over the southern boundary while the rest of the river basin will experience weaker intensity of RX5day extreme as compared to the present-day levels. It is important to note that this does eliminate the occurrence of RX5day extreme during this period. However, the southern boundaries may be exposed to stronger riverine floods due to the intensification of RX5day extremes in the far future.
Figure 5 displays the spatial distribution of present-day RL50yr_RX1day and RL50yr_RX5day, as well as their projected changes during the rainy season over JRB in the future relative to the P0 period. In Figure 5A, the largest values of more than 200 mm for present-day RL50yr_RX1day can be found over the southwest and southeast coastal areas of the JRB, which is consistent with the high magnitude of RL50yr_RX1day reported by Sun and Zhang (2017). This indicates that severe RX1day events are recorded in these regions. The projected changes of RL50yr_RX1day in P1, P2, and P3 relative to P0 are listed in Figures 5B–D, respectively. Although Figure 4B suggests a slight patchy increase in RX1day, the model projects a widespread increase in RL50yr_RX1day over the river basin in P1. Notably, the increase in P1 is mostly in the range of 20–80 mm throughout the basin, with the largest increase of up to 130 mm in the center of the river basin. This suggests that rare and severe flash flood events will be widespread in P1, as Supplementary Figures S2B illustrates a higher magnitude (more than 350 mm) of RL50yr_RX1day during the period. To a large extent, the situation is not farfetched for the far future, as the model projects a general increase of 20–80 mm through P3. It is also noteworthy that the RL50yr_RX1day will decrease in the southwest and northeast with a reduction of 40–130 mm in P2, while in the mountain areas of the northwest and the southeast coastal areas, RL50yr_RX1day will increase by around 40 mm. This calls for proactive adaptive measures to forestall the devastating impact of flash floods resulting from the occurrence of rare and severe RX1day events.
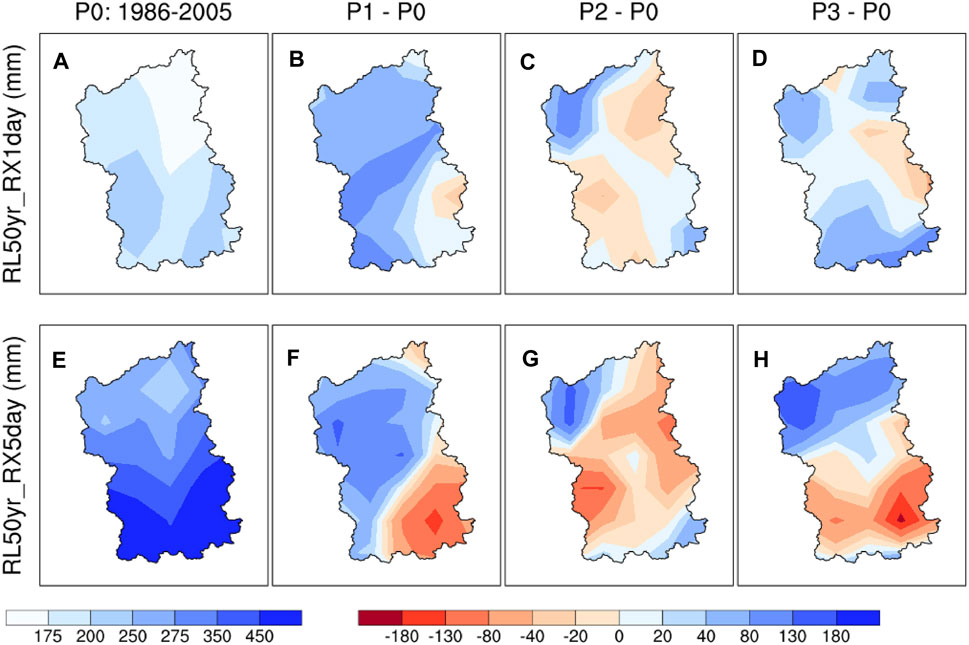
FIGURE 5. Spatial distribution of present-day (P0: 1986–2005) 50-year return level for (A) RX1day and (E) RX5day for the entire rainy season in JRB, and the projected changes in 50-year return level for (B–D) RX1day and (F–H) RX5day during the near-future P1 (2021–2040), mid-future P2 (2041–2060), and far-future P3 (2081–2098) relative to the present-day.
Next, we show in Figure 5E the present-day RL50yr_RX5day simulations in the rainy season and Figures 5F–H the projected change in the 21st century. Figure 5E suggests that the magnitude of present-day RL50yr_RX5day extremes scales across the latitude (from south to north) from 200 to 550 mm. From Figure 5F, it is found that the projected RL50yr_RX5day will increase by 80–130 mm over the northern part of the river basin in P1. However, a substantial induction of RL50yr_RX5day, mostly in the range of 20–130 mm, is found over the southern part of the river basin. This is to some extent, consistent throughout the 21st century. The foregoing demonstrates that under RCP4.5, the intensity of rare and severe RX5day extreme events will increase in northern areas of JRB throughout the 21st century, with a higher magnitude of the 50-year return levels (more than 350 mm) projected over sub-regions (Supplementary Figures S2F–H). This further suggests that severe flash flood and riverine flood events will be more intense in the rainy season over northern JRB. The increase in the intensity of rare precipitation extremes is reportedly associated with global warming (Myhre et al., 2019; IPCC, 2021), which is also evident in the medium-range greenhouse gas emission scenario. However, the projected decrease of the rainy season RL50yr_RX5day over the southern fringes of the river basin indicates that the region is less prone to rare and severe RX5day events and associated flood disasters in the future.
It is suggested from Figure 2 that there are two sub-rainy seasons in JRB, which are influenced by different climatic drivers. So, it is interesting to understand whether the future changes in precipitation extremes are consistent throughout the entire rainy season, or the future changes of precipitation extremes in one sub-season might dominate. To answer this question, we further present the spatial distribution of the projected change of RL50yr_RX1day in the first-half and second-half of the rainy season during the 21st century relative to the present day (Figure 6).
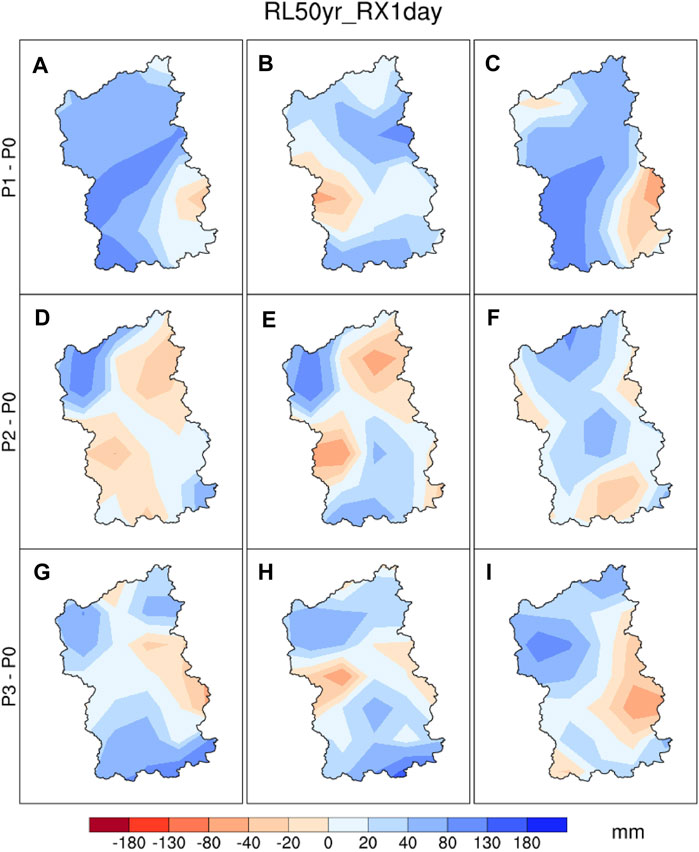
FIGURE 6. Spatial distribution of the projected changes in 50-year return levels (mm) of RX1day under the RCP4.5 for (A) the entire rainy season, (B) the first-half rainy season, and (C) the second-half rainy season during P1 (2021–2040) relative to present-day P0 (1986–2005). (D–F) and (G,H) are the same as (A–C), but for changes during P2 (2041–2060) and during P3 (2081–2098) respectively.
Comparing Figure 6A with Figure 6B, we can find that there exists a remarkable difference in the spatial pattern of RL50yr_RX1day changes between the first-half and entire rainy season during P1 (2021–2041), especially in the southern part of the river basin. However, the spatial pattern of RL50yr_RX1day changes in the second-half of the rainy season agrees quite well with that for the entire rainy season, with a pattern correlation coefficient (PCC) of 0.75 between the second-half and entire rainy season. This indicates that the changes in 50-year return level of RX1day are largely contributed by the projected changes during the second rainy season in the near-future period. Moreover, we can find that the high pattern correlation between Figure 6A and Figure 6C can be ascribed to the pattern similarity of RL50yr_RX1day changes in the southern part of the river basin. More specifically, a substantial increase in RL50yr_RX1day by 80–130 mm can be found in the southwest basin for the second-half rainy season, while a reduction of 20–130 mm in the southeast basin is witnessed. A similar change pattern of RL50yr_RX1day can also be found in Figure 6A, but with weaker amplitude.
In the mid-future period during 2041–2060, the spatial pattern of RL50yr_RX1day changes in the first rainy season, showing higher similarity with that for the entire rainy season, with a PCC of 0.64 between the first-half and entire rainy season, and this is contrary to the situation for the near-future period. From Figure 6E, we can find that the projected RL50yr_RX1day for the first rainy season in P2 increases by 40–130 mm in northwest JRB and mainly by 20–40 mm in south JRB. Meanwhile, a decrease of RL50yr_RX1day by 20–130 mm in the central north and northeast basin in P2 can also be found. However, Figure 6F shows that most parts of the river basin will experience more intense RL50yr_RX1day during the second rainy season, with the increase mostly ranging from 20 to 120 mm, especially in the mountain areas.
Figures 6G,H show the results for the far-future period during 2081–2098; we can find that the projected change in RL50yr_RX1day for the first rainy season mimics the spatial distribution of change during the entire rainy season, with a PCC as high as 0.80. The increase of RL50yr_RX1day in P3 can be found over most parts of the river basin, with larger increases in the north and south JRB, and a decrease in RL50yr_RX1day can be found only in small areas located in the central part of JRB. Although the spatial pattern of the entire rainy season RL50yr_RX1day is largely influenced by the pattern of the first rainy season, a higher magnitude of increase of 40–130 mm in RL50yr_RX1day is found over the northern areas during the second rainy season (Figure 6I). In summary, the projected change in RL50yr_RX1day indicates that the intensity of high-risk single-day precipitation extremes will generally get stronger in terms of the 50-year return level of RX1day during the sub-seasons (Supplementary Figure S3). Meanwhile, the spatial distribution of the projected change for the entire rainy season in near future is mostly influenced by the projected changes during the second rainy season, and this might indicate the influence from more typhoon activities in the near future, whereas in the mid-future and far-future periods, the spatial pattern of the projected changes in RL50yr_RX1day for the May–September season is largely similar to the projected pattern of the first rainy season.
Lastly, we compare the spatial pattern of the projected change of RL50yr_RX5day for the two sub-seasons and the entire rainy season as shown in Figure 7. The projected spatial distribution of RL50yr_RX5day changes in the second rainy season shows high similarity with that for the entire rainy season in the near future (P1), with PCC reaching 0.89, and this suggests that the RL50yr_RX5day changes in the second rainy season might contribute substantially to that for the entire rainy season (Figures 7A,C). From Figures 7A,C, a strong reduction of up to 180 mm for RL50yr_RX5day in the southeast basin can be found for the second rainy season, and it is much greater than the reduction obtained for the entire rainy season, which mostly ranges from 40 to 130 mm. However, it is also noticeable that the increase in RL50yr_RX5day during the first rainy season is widespread, with the largest increase of 80 mm in the northwest basin, which dominates the RL50yr_RX5day change pattern in the northwest basin for the entire rainy season (Figure 7B).
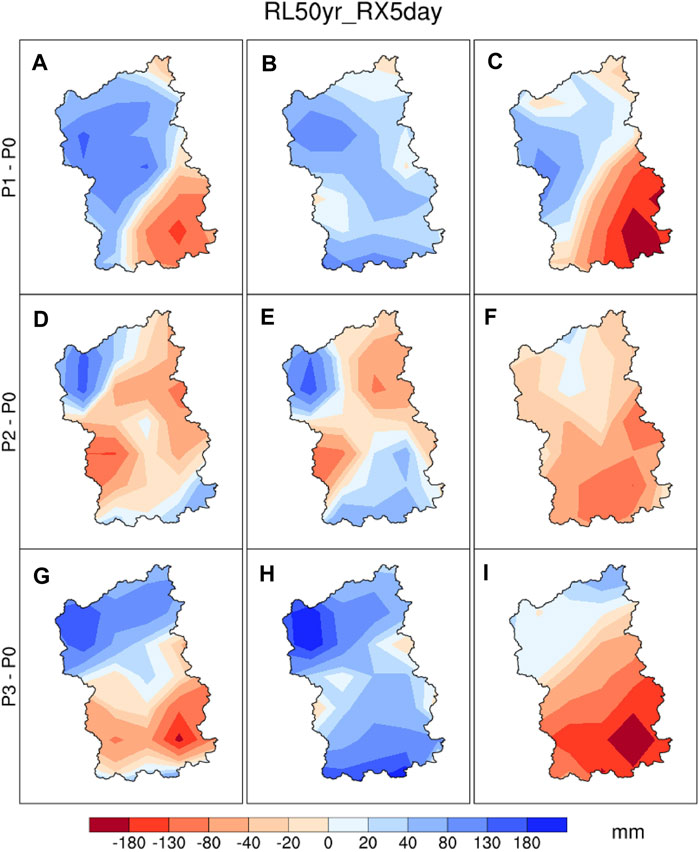
FIGURE 7. Spatial distribution of the projected changes in 50-year return levels (mm) of RX5day under the RCP4.5 for (A) the entire rainy season, (B) the first-half rainy season, and (C) the second-half rainy season during P1 (2021–2040) relative to present-day P0 (1986–2005). (D–F) and (G,H) are the same as (A–C), but for changes during P2 (2041–2060) and during P3 (2081–2098) respectively.
Figures 7D,E suggest that the spatial distribution of the projected first rainy season RL50yr_RX5day in P2 has a large influence on the result obtained for the entire rainy season, especially in the northwest basin with a large reduction of more than 130 mm. Nevertheless, a slight reduction of about 20 mm in RL50yr_RX5day for the entire rainy season can be found in the southern basin except for the southeastern fringe in P2, which is mainly attributed to the projected decrease in RL50yr_RX5day over southern JRB during the second rainy season (Figure 7F).
The spatial distribution of the projected change of RL50yr_RX5day in P3 for the entire rainy season and sub-seasons mimics the spatial pattern in P1, except for the southwest basin, but the magnitude of changes in RL50yr_RX5day in P3 is larger than that in P1 (Figures 7G–I). Furthermore, the future increase in RL50yr_RX5day over the northern part of the river basin in P3 is mainly contributed by the changes during the first-half rainy season, while the decrease of RL50yr_RX5day in the south is mostly ascribed to the future changes during the second-half rainy season. It is important to note that the dipolar structure of the projected change in RL50yr_RX5day during the first rainy season demonstrates that riverine floods will be more dominant in both the northwest and south parts of the basin in P3 (see Supplementary Figure S4H), which is also consistent with the findings by Xu et al. (2018) for the South China region.
In this study, we have investigated the projected changes in precipitation extremes over the JRB under a medium-range greenhouse gas emission scenario. Firstly, we evaluated the performance of RegCM4 forced by HadGEM2-ES in simulating present-day precipitation seasonal cycle. Results indicate that RegCM4 reasonably captured the seasonal evolution of monthly mean precipitation, albeit overestimating the climatology of rainy season precipitation. Meanwhile, the RegCM4 also well captured the observed frequency distribution of precipitation intensities, and the magnitude of the 50-year return level for the maximum 1-day precipitation (RX1day) and the maximum consecutive 5-day precipitation (RX5day) as seen in observations.
This study employs RX1day and RX5day precipitation extremes, which represent intense precipitation associated with flash floods and riverine floods (Kirchmeier-Young and Zhang, 2020). The two precipitation indices are designated as precipitation extremes with a direct impact on water resources and hydrology sectors (Alexander and Herold, 2015). Overall, the RegCM4 projected a decrease in the mean RX1day extreme index in the southern part of the river basin in the future. However, results also show that the model simulated high spatial variability of intense precipitation at different periods, with general features suggesting a slight increase by 2–4 mm in RX1day over the northern part of the river basin until the end of the 21st century. This suggests that the northern parts of the river basin will probably experience higher levels of intense single-day precipitation relative to the present day with the attendant flash flood disasters. Moreover, in the near future and the far future, an intense increase in RX1day extreme is also projected over the southern boundaries of the river basin. While the model projects a general decrease by 4–12 mm in mean RX5day over the river basin, there are indications that the severity of RX5day extremes will increase by 2–8 mm over the southern boundaries at the end of the 21st century. Additionally, the projected general decrease of RX5day in most areas of JRB may induce randomness of water supply, which limits water resource allocation and scheduling.
Although there is an overall slight reduction in the projected intensity of RX1day extremes in most of the river basin, there are indications that 50-year return level values of RX1day extreme in the rainy season will increase in most areas of the JRB in the 21st century. This suggests that the intensity of high-risk single-day precipitation extremes will generally get stronger, or the rare and severe precipitation will probably increase over the river basin with high-risk flash flood events.
On the other hand, the 50-year return level of RX5day extremes will exhibit a dipole structure, with a great reduction by 40–130 mm in the southeast and a substantial increase by 80–130 mm in the northwest in the future. This suggests that more intense precipitation extremes will likely occur over the upper reaches of JRB, which might trigger rare and high-risk riverine flood disasters, while precipitation extremes in the southern part of the river basin will become less intense, perhaps due to spatial variation of moisture convergence (Wu et al., 2020). This could also be ascribed to the future changes in landing typhoon activities in the coastal areas. Nonetheless, the projected increase in RX1day, RL50yr_RX1day, and RL50yr_RX5day, especially in the mountain areas, portends an increase in the intensity of rare precipitation extremes in the river basin, which has been reportedly associated with global warming (Myhre et al., 2019; IPCC, 2021). This will perhaps invigorate episodes of severe flash floods, mudslides, and landslides in most areas, with disastrous impacts on the society, economy, and ecological environment. It is therefore important to design adaptive measures to forestall the devastating impacts of these events.
Furthermore, it is important to note that there exists a substantial sub-seasonal difference in the projected pattern of the 50-year return extreme levels within the entire rainy season, which also varies with the projected future period. For instance, the spatial pattern of RL50yr_RX1day change in the first rainy season mimics that for the entire rainy season in the far-future period. However, the high magnitude of the return level projected over the northwest part of the river basin in the second rainy indicates a possible high-risk flash flood. For the projected increases of RL50yr_RX5day in the entire rainy season over the northern river basin, it is mainly connected to the changes during the first rainy season, while the projected decrease in the entire rainy season RL50yr_RX5day in the southern part of the basin is mostly linked to the changes during the second rainy season.
Moreover, future hydrologic design has largely relied on the projected return level of precipitation extremes (Milly et al., 2008; Rosenberg et al., 2010). The projected increase in the return levels of precipitation extremes over the northern part of the river basin suggests that the standard of water infrastructure designed, like reservoirs or dams, based on the historical climate conditions may not contain future disastrous precipitation events. Therefore, additional costs may be required to improve the capacity of water resource infrastructure and flood control measures to deal with the projected future changes, even under the medium-range emission scenario.
It is noted that the lateral conditions based on the GCM output have a significant impact on the accuracy of the dynamic downscaling (Diaconescu et al., 2007; Ludwig et al., 2017; Kim et al., 2020). In this study, the CMIP5 GCM simulations are used to get the initial and time-evolving lateral boundary conditions for RegCM4, it is expected that the latest model output of state-of-the-art CMIP6 GCMs (Eyring et al., 2016) will be applied to drive the RegCM4 for future climate change projection in river basins. In addition, the multi-model ensemble can be adopted based on the improved CMIP6 GCMs; it may bring a more reliable conclusion for the projected future changes of precipitation extremes over the JRB. Furthermore, we present the future changes of precipitation extremes in the JRB, without analyzing the mechanism associated with these projected changes, including the spatially inhomogeneous changes within the river basin. Therefore, further analysis is needed to identify the impact of changes in both monsoon circulations and landing typhoon activities. Despite these limitations, the results of this study show the need to create sufficient adaptation and mitigation strategies to manage the impact of the projected intensification of rare and high-risk precipitation extremes in the river basin.
The CMA observation data are accessible directly from http://data.cma.cn/data/detail/dataCode/A.0012.0001.html. The HadGEM2-ES output data are accessible directly from https://esgf-node.llnl.gov/projects/cmip5/. While the RegCM4 output used in this study is not publicly available. Request to access it should be directed to Z2FveHVlamllQG1haWwuaWFwLmFjLmNu.
All authors made an equal contribution to the manuscript’s development and consented to the submission for publication. Conceptualization, LZ and LC; methodology, LC, LZ, DVN, and GX; formal analysis, LC, DVN, and LZ; resources, LZ; data curation, LC and GX; writing—original draft preparation, LC and DVN; writing—review and editing, LZ; funding acquisition, LZ. All authors have read and agreed to the published version of the manuscript.
This research was supported by the National Natural Science Foundation of China (41661144032).
The authors declare that the research was conducted in the absence of any commercial or financial relationships that could be construed as a potential conflict of interest.
All claims expressed in this article are solely those of the authors and do not necessarily represent those of their affiliated organizations, or those of the publisher, the editors and the reviewers. Any product that may be evaluated in this article, or claim that may be made by its manufacturer, is not guaranteed or endorsed by the publisher.
The authors would like to thank the editor and reviewers for their constructive comments which considerably improved the manuscript.
The Supplementary Material for this article can be found online at: https://www.frontiersin.org/articles/10.3389/feart.2021.771592/full#supplementary-material
Alexander, L., and Herold, N. (2015). A Document Prepared on Behalf of the Commission for Climatology (CCl) Expert Team on Sector-Specific Climate Indices. Sydney: ET-SCI, 46.
Alfieri, L., and Thielen, J. (2015). A European Precipitation Index for Extreme Rain-Storm and Flash Flood Early Warning. Met. Apps 22, 3–13. doi:10.1002/met.1328
Chen, H., Chen, J., Li, W., and Cai, W. (2006). Characteristics of Rainstorm-Caused Flood and Waterlogging in the Main River Basin of Fujian Province. J. Nat. Disasters 15, 276–280. (in Chinese).
Chen, H., and Sun, J. (2013). How Large Precipitation Changes Over Global Monsoon Regions by CMIP5 Models? Atmos. Oceanic Sci. Lett. 6, 306–311. doi:10.1080/16742834.2013.11447099
Chen, Z. (2014). Study on Cause and Prevention Technology of Mountain Torrent Disaster in Small Watershed. Guangzhou: South China University of Technology.
Collins, W. J., Bellouin, N., Doutriaux-Boucher, M., Gedney, N., Halloran, P., Hinton, T., et al. (2011). Development and Evaluation of an Earth-System Model - HadGEM2. Geosci. Model. Dev. 4, 1051–1075. doi:10.5194/gmd-4-1051-2011
Diaconescu, E. P., Laprise, R., and Sushama, L. (2007). The Impact of Lateral Boundary Data Errors on the Simulated Climate of a Nested Regional Climate Model. Clim. Dyn. 28, 333–350. doi:10.1007/s00382-006-0189-6
Diallo, I., Giorgi, F., Deme, A., Tall, M., Mariotti, L., and Gaye, A. T. (2016). Projected Changes of Summer Monsoon Extremes and Hydroclimatic Regimes Over West Africa for the Twenty-First Century. Clim. Dyn. 47, 3931–3954. doi:10.1007/s00382-016-3052-4
Dike, V. N., Lin, Z.-H., and Ibe, C. C. (2020). Intensification of Summer Rainfall Extremes over Nigeria during Recent Decades. Atmosphere 11 (10), 1084. doi:10.3390/atmos11101084
Donat, M. G., Lowry, A. L., Alexander, L. V., O’Gorman, P. A., and Maher, N. (2016). More Extreme Precipitation in the World's Dry and Wet Regions. Nat. Clim. Change 6, 508–513. doi:10.1038/nclimate2941
Dottori, F., Szewczyk, W., Ciscar, J.-C., Zhao, F., Alfieri, L., Hirabayashi, Y., et al. (2018). Increased Human and Economic Losses from River Flooding with Anthropogenic Warming. Nat. Clim. Change 8, 781–786. doi:10.1038/s41558-018-0257-z
Emanuel, K. A. (1991). A Scheme for Representing Cumulus Convection in Large-Scale Models. J. Atmos. Sci. 48, 2313–2329. doi:10.1175/1520-0469(1991)048<2313:asfrcc>2.0.co;2
Ervinia, A., Huang, J., and Zhang, Z. (2018). Assessing the Specific Impacts of Climate Variability and Human Activities on Annual Runoff Dynamics in a Southeast China Coastal Watershed. WATER 9, 92–108. doi:10.14294/WATER.2017.7
Eyring, V., Bony, S., Meehl, G. A., Senior, C. A., Stevens, B., Stouffer, R. J., et al. (2016). Overview of the Coupled Model Intercomparison Project Phase 6 (CMIP6) Experimental Design and Organization. Geosci. Model. Dev. 9, 1937–1958. doi:10.5194/gmd‐9‐1937‐2016
Fang, J., Lincke, D., Brown, S., Nicholls, R. J., Wolff, C., Merkens, J.-L., et al. (2020). Coastal Flood Risks in China through the 21st century - an Application of DIVA. Sci. Total Environ. 704, 135311. doi:10.1016/j.scitotenv.2019.135311
Fang, J., Wahl, T., Fang, J., Sun, X., Kong, F., and Liu, M. (2021). Compound Flood Potential from Storm Surge and Heavy Precipitation in Coastal China: Dependence, Drivers, and Impacts. Hydrol. Earth Syst. Sci. 25, 4403–4416. doi:10.5194/hess-25-4403-2021
Fischer, T., Gemmer, M., Liu, L., and Su, B. (2010). Trends in Monthly Temperature and Precipitation Extremes in the Zhujiang River Basin, South China (1961-2007). Adv. Clim. Change Res. 1, 63–70. doi:10.3724/SP.J.1248.2010.00063
Fischer, T., Menz, C., Su, B., and Scholten, T. (2013). Simulated and Projected Climate Extremes in the Zhujiang River Basin, South China, Using the Regional Climate Model COSMO-CLM. Int. J. Climatol. 33, 2988–3001. doi:10.1002/joc.3643
Gao, L., Huang, J., Chen, X., Chen, Y., and Liu, M. (2017a). Risk of Extreme Precipitation under Nonstationarity Conditions during the Second Flood Season in the Southeastern Coastal Region of China. J. Hydrometeorology 18, 669–681. doi:10.1175/JHM-D-16-0119.1
Gao, X., and Giorgi, F. (2017). Use of the RegCM System over East Asia: Review and Perspectives. Engineering 3, 766–772. doi:10.1016/J.ENG.2017.05.019
Gao, X., Shi, Y., Han, Z., Wang, M., Wu, J., Zhang, D., et al. (2017b). Performance of RegCM4 over Major River Basins in China. Adv. Atmos. Sci. 34, 441–455. doi:10.1007/s00376-016-6179-7
Gemmer, M., Fischer, T., Jiang, T., Su, B., and Liu, L. L. (2011). Trends in Precipitation Extremes in the Zhujiang River Basin, South China. J. Clim. 24, 750–761. doi:10.1175/2010JCLI3717.1
Graham, L. P., Andréasson, J., and Carlsson, B. (2007). Assessing Climate Change Impacts on Hydrology from an Ensemble of Regional Climate Models, Model Scales and Linking Methods - a Case Study on the Lule River basin. Climatic Change 81, 293–307. doi:10.1007/s10584-006-9215-2
Gu, H., Wang, G., Yu, Z., and Mei, R. (2012). Assessing Future Climate Changes and Extreme Indicators in East and South Asia Using the RegCM4 Regional Climate Model. Climatic Change 114, 301–317. doi:10.1007/s10584-012-0411-y
Halmstad, A., Najafi, M. R., and Moradkhani, H. (2013). Analysis of Precipitation Extremes with the Assessment of Regional Climate Models over the Willamette River Basin, USA. Hydrol. Process. 27, 2579–2590. doi:10.1002/hyp.9376
Hammond, M. J., Chen, A. S., Djordjević, S., Butler, D., and Mark, O. (2015). Urban Flood Impact Assessment: A State-Of-The-Art Review. Urban Water J. 12, 14–29. doi:10.1080/1573062X.2013.857421
Han, Z., Zhou, B., Xu, Y., Wu, J., and Shi, Y. (2017). Projected Changes in Haze Pollution Potential in China: An Ensemble of Regional Climate Model Simulations. Atmos. Chem. Phys. 17, 10109–10123. doi:10.5194/acp-17-10109-2017
Huang, J., Zhang, Z., Feng, Y., and Hong, H. (2013). Hydrologic Response to Climate Change and Human Activities in a Subtropical Coastal Watershed of Southeast China. Reg. Environ. Change 13, 1195–1210. doi:10.1007/s10113-013-0432-8
Huang, X., Tan, H., Li, F., and Xu, Y. (2009). Changes of Flood-Season Severe Precipitation over South China in 2071-2100. Meteorol. Sci. Technol. 4, 425–428. (in Chinese). doi:10.19517/j.1671-6345.2009.04.008
Im, E.-S., Choi, Y.-W., and Ahn, J.-B. (2017). Robust Intensification of Hydroclimatic Intensity over East Asia from Multi-Model Ensemble Regional Projections. Theor. Appl. Climatol. 129, 1241–1254. doi:10.1007/s00704-016-1846-2
IPCC (2019). “Summary for Policymakers,” in Climate Change and Land: An IPCC Special Report on Climate Change, Desertification, Land Degradation, Sustainable Land Management, Food Security, and Greenhouse Gas Fluxes in Terrestrial Ecosystems. New York: Cambridge University Press.
IPCC (2021). “Summary for Policymakers,” in Climate Change 2021: The Physical Science Basis. Contribution of Working Group I to the Sixth Assessment Report of the Intergovernmental Panel on Climate Change (New York: Cambridge University Press). In Press.
Jiang, D., Tian, Z., and Lang, X. (2016). Reliability of Climate Models for China through the IPCC Third to Fifth Assessment Reports. Int. J. Climatol. 36, 1114–1133. doi:10.1002/joc.4406
Karl, T. R., Nicholls, N., and Ghazi, A. (1999). “CLIVAR/GCOS/WMO Workshop on Indices and Indicators for Climate Extremes Workshop Summary,” in Weather and Climate Extremes: Changes, Variations and a Perspective from the Insurance Industry. Editors T. R. Karl, N. Nicholls, and A. Ghazi (Dordrecht: Springer Netherlands), 3–7. doi:10.1007/978-94-015-9265-9_2
Khalid, B., Cholaw, B., Alvim, D. S., Javeed, S., Khan, J. A., Javed, M. A., et al. (2018). Riverine Flood Assessment in Jhang District in Connection with ENSO and Summer Monsoon Rainfall Over Upper Indus Basin for 2010. Nat. Hazards 92, 971–993. doi:10.1007/s11069-018-3234-y
Kharin, V. V., Zwiers, F. W., Zhang, X., and Wehner, M. (2013). Changes in Temperature and Precipitation Extremes in the CMIP5 Ensemble. Climatic Change 119, 345–357. doi:10.1007/s10584-013-0705-8
Kim, Y., Rocheta, E., Evans, J. P., and Sharma, A. (2020). Impact of Bias Correction of Regional Climate Model Boundary Conditions on the Simulation of Precipitation Extremes. Clim. Dyn. 55, 3507–3526. doi:10.1007/s00382-020-05462-5
Kirchmeier-Young, M. C., and Zhang, X. (2020). Human Influence Has Intensified Extreme Precipitation in North America. Proc. Natl. Acad. Sci. USA 117, 13308–13313. doi:10.1073/pnas.1921628117
Li, C. Z., Zhang, M., Zhang, X. L., Wang, H., Luo, K. B., Liu, C. J., and Sun, D. Y. (2018). “Watershed-Based Flash Flood Risk Assessment in Yulin Municipality, Guangxi, China,” in Proceedings of the International Workshop on Environmental Management, Science and Engineering, Xiamen, Fujian, China, June 16, 2018 (Xiamen, China: SCITEPRESS - Science and Technology Publications), 62–77. doi:10.5220/0007557100620077
Li, W.-P. (1999). Moisture Flux and Water Balance over the South China Sea During Late Boreal Spring and Summer. Theor. Appl. Climatol. 64, 179–187. doi:10.1007/s007040050121
Li, X., Zhou, W., Li, C., and Song, J. (2013). Comparison of the Annual Cycles of Moisture Supply Over Southwest and Southeast China. J. Clim. 26, 10139–10158. doi:10.1175/JCLI-D-13-00057.1
Lian, J. J., Xu, K., and Ma, C. (2013). Joint Impact of Rainfall and Tidal Level on Flood Risk in a Coastal City with a Complex River Network: A Case Study of Fuzhou City, China. Hydrol. Earth Syst. Sci. 17, 679–689. doi:10.5194/hess-17-679-2013
Ludwig, P., Pinto, J. G., Raible, C. C., and Shao, Y. (2017). Impacts of Surface Boundary Conditions on Regional Climate Model Simulations of European Climate during the Last Glacial Maximum. Geophys. Res. Lett. 44, 5086–5095. doi:10.1002/2017GL073622
Mallapaty, S. (2020). How China Could Be Carbon Neutral by Mid-Century. Nature 586, 482–483. doi:10.1038/d41586-020-02927-9
Merz, B., Kreibich, H., Schwarze, R., and Thieken, A. (2010). Review Article “Assessment of Economic Flood Damage”. Nat. Hazards Earth Syst. Sci. 10, 1697–1724. doi:10.5194/nhess-10-1697-2010
Milly, P. C. D., Betancourt, J., Falkenmark, M., Hirsch, R. M., Kundzewicz, Z. W., Lettenmaier, D. P., et al. (2008). Stationarity Is Dead: Whither Water Management? Science 319, 573–574. doi:10.1126/science.1151915
Min, S.-K., Zhang, X., Zwiers, F. W., and Hegerl, G. C. (2011). Human Contribution to More-Intense Precipitation Extremes. Nature 470, 378–381. doi:10.1038/nature09763
Moss, R. H., Edmonds, J. A., Hibbard, K. A., Manning, M. R., Rose, S. K., van Vuuren, D. P., et al. (2010). The Next Generation of Scenarios for Climate Change Research and Assessment. Nature 463 (7282), 747–756. doi:10.1038/nature08823
Myhre, G., Alterskjær, K., Stjern, C. W., Hodnebrog, Ø., Marelle, L., Samset, B. H., et al. (2019). Frequency of Extreme Precipitation Increases Extensively with Event Rareness under Global Warming. Sci. Rep. 9, 16063. doi:10.1038/s41598-019-52277-4
Ning, L., and Qian, Y. (2009). Interdecadal Change in Extreme Precipitation over South China and its Mechanism. Adv. Atmos. Sci. 26 (1), 109–118. doi:10.1007/s00376-009-0109-x
Norbiato, D., Borga, M., Sangati, M., and Zanon, F. (2007). Regional Frequency Analysis of Extreme Precipitation in the Eastern Italian Alps and the August 29, 2003 Flash Flood. J. Hydrol. 345, 149–166. doi:10.1016/j.jhydrol.2007.07.009
Oh, S.-G., Park, J.-H., Lee, S.-H., and Suh, M.-S. (2014). Assessment of the RegCM4 over East Asia and Future Precipitation Change Adapted to the RCP Scenarios. J. Geophys. Res. Atmos. 119, 2913–2927. doi:10.1002/2013JD020693
Oleson, K. W., Niu, G.-Y., Yang, Z.-L., Lawrence, D. M., Thornton, P. E., Lawrence, P. J., et al. (2008). Improvements to the Community Land Model and Their Impact on the Hydrological Cycle. J. Geophys. Res. 113, a–n. doi:10.1029/2007JG000563
Pattnayak, K. C., Panda, S. K., Saraswat, V., and Dash, S. K. (2018). Assessment of Two Versions of Regional Climate Model in Simulating the Indian Summer Monsoon over South Asia CORDEX Domain. Clim. Dyn. 50, 3049–3061. doi:10.1007/s00382-017-3792-9
Peterson, T. C., Taylor, M. A., Demeritte, R., Duncombe, D. L., Burton, S., Thompson, F., et al. (2002). Recent Changes in Climate Extremes in the Caribbean Region. J. Geophys. Res. 107, D21. doi:10.1029/2002JD002251
Qin, P., and Xie, Z. (2016). Detecting Changes in Future Precipitation Extremes over Eight River Basins in China Using RegCM4 Downscaling. J. Geophys. Res. Atmos. 121, 6802–6821. doi:10.1002/2016JD024776
Rosenberg, E. A., Keys, P. W., Booth, D. B., Hartley, D., Burkey, J., Steinemann, A. C., et al. (2010). Precipitation Extremes and the Impacts of Climate Change on Stormwater Infrastructure in Washington State. Climatic Change 102, 319–349. doi:10.1007/s10584-010-9847-0
Shen, Y., Morsy, M. M., Huxley, C., Tahvildari, N., and Goodall, J. L. (2019). Flood Risk Assessment and Increased Resilience for Coastal Urban Watersheds under the Combined Impact of Storm Tide and Heavy Rainfall. J. Hydrol. 579, 124159. doi:10.1016/j.jhydrol.2019.124159
Shi, Y., Wang, G., and Gao, X. (2018). Role of Resolution in Regional Climate Change Projections over China. Clim. Dyn. 51, 2375–2396. doi:10.1007/s00382-017-4018-x
Sillmann, J., Kharin, V. V., Zhang, X., Zwiers, F. W., and Bronaugh, D. (2013a). Climate Extremes Indices in the CMIP5 Multimodel Ensemble: Part 1. Model Evaluation in the Present Climate. J. Geophys. Res. Atmos. 118, 1716–1733. doi:10.1002/jgrd.50203
Sillmann, J., Kharin, V. V., Zwiers, F. W., Zhang, X., and Bronaugh, D. (2013b). Climate Extremes Indices in the CMIP5 Multimodel Ensemble: Part 2. Future Climate Projections. J. Geophys. Res. Atmos. 118, 2473–2493. doi:10.1002/jgrd.50188
Sperber, K. R., Annamalai, H., Kang, I.-S., Kitoh, A., Moise, A., Turner, A., et al. (2013). The Asian Summer Monsoon: an Intercomparison of CMIP5 vs. CMIP3 Simulations of the Late 20th Century. Clim. Dyn. 41, 2711–2744. doi:10.1007/s00382-012-1607-6
Srikanthan, R., and McMahon, T. A. (1981). Log Pearson III Distribution - Effect of Dependence, Distribution Parameters and Sample Size on Peak Annual Flood Estimates. J. Hydrol. 52, 149–159. doi:10.1016/0022-1694(81)90101-3
Su, B. D., Jiang, T., and Jin, W. B. (2006). Recent Trends in Observed Temperature and Precipitation Extremes in the Yangtze River basin, China. Theor. Appl. Climatol. 83, 139–151. doi:10.1007/s00704-005-0139-y
Su, Z. Z., Shi, S. J., Zhang, W., Zhou, X., and Chen, D. H. (2016). Analysis of the Trends of Extreme Precipitation Events over Fujian Province from 1960 to 2010. Torrential Rain and Disasters 35 (2), 166–172.
Sun, J., and Zhang, F. (2017). Daily Extreme Precipitation and Trends over China. Sci. China Earth Sci. 60, 2190–2203. doi:10.1007/s11430-016-9117-8
Tabari, H., De Troch, R., Giot, O., Hamdi, R., Termonia, P., Saeed, S., et al. (2016). Local Impact Analysis of Climate Change on Precipitation Extremes: Are High-Resolution Climate Models Needed for Realistic Simulations? Hydrol. Earth Syst. Sci. 20, 3843–3857. doi:10.5194/hess-20-3843-2016
Tang, J., Li, Y., Cui, S., Xu, L., Hu, Y., Ding, S., et al. (2021). Analyzing the Spatiotemporal Dynamics of Flood Risk and its Driving Factors in a Coastal Watershed of southeastern China. Ecol. Indicators 121, 107134. doi:10.1016/j.ecolind.2020.107134
Taylor, K. E., Stouffer, R. J., and Meehl, G. A. (2012). An Overview of CMIP5 and the Experiment Design. Bull. Am. Meteorol. Soc. 93, 485–498. doi:10.1175/BAMS-D-11-00094.1
Tol, R. S. J., van der Grijp, N., Olsthoorn, A. A., and van der Werff, P. E. (2003). Adapting to Climate: A Case Study on Riverine Flood Risks in the Netherlands. Risk Anal. 23, 575–583. doi:10.1111/1539-6924.00338
Wahl, T., Jain, S., Bender, J., Meyers, S. D., and Luther, M. E. (2015). Increasing Risk of Compound Flooding from Storm Surge and Rainfall for Major US Cities. Nat. Clim. Change 5, 1093–1097. doi:10.1038/nclimate2736
Wang, X., Hou, X., and Wang, Y. (2017). Spatiotemporal Variations and Regional Differences of Extreme Precipitation Events in the Coastal Area of China from 1961 to 2014. Atmos. Res. 197, 94–104. doi:10.1016/j.atmosres.2017.06.022
Wobus, C., Gutmann, E., Jones, R., Rissing, M., Mizukami, N., Lorie, M., et al. (2017). Climate Change Impacts on Flood Risk and Asset Damages within Mapped 100-Year Floodplains of the Contiguous United States. Nat. Hazards Earth Syst. Sci. 17, 2199–2211. doi:10.5194/nhess-17-2199-2017
Wu, J., and Gao, X. (2020). Present Day Bias and Future Change Signal of Temperature Over China in a Series of Multi-GCM Driven RCM Simulations. Clim. Dyn. 54, 1113–1130. doi:10.1007/s00382-019-05047-x
Wu, J., Han, Z., Xu, Y., Zhou, B., and Gao, X. (2020). Changes in Extreme Climate Events in China Under 1.5 °C-4 °C Global Warming Targets: Projections Using an Ensemble of Regional Climate Model Simulations. J. Geophys. Res. Atmos. 125, e2019JD031057. doi:10.1029/2019JD031057
Wu, X., Wang, Z., Zhou, X., Lai, C., Lin, W., and Chen, X. (2016a). Observed Changes in Precipitation Extremes Across 11 Basins in China during 1961-2013. Int. J. Climatol. 36, 2866–2885. doi:10.1002/joc.4524
Wu, Y., Wu, S.-Y., Wen, J., Tagle, F., Xu, M., and Tan, J. (2016b). Future Changes in Mean and Extreme Monsoon Precipitation in the Middle and Lower Yangtze River Basin, China, in the CMIP5 Models. J. Hydrometeorology 17, 2785–2797. doi:10.1175/JHM-D-16-0033.1
Wuebbles, D., Meehl, G., Hayhoe, K., Karl, T. R., Kunkel, K., Santer, B., et al. (2014). CMIP5 Climate Model Analyses: Climate Extremes in the United States. Bull. Amer. Meteorol. Soc. 95, 571–583. doi:10.1175/BAMS-D-12-00172.1
Xiaoyan, H., Li, H., Huasheng, Z., and Ying, H. (2017). Characteristics of Tropical Cyclones Generated in South China Sea and Their Landfalls over China and Vietnam. Nat. Hazards 88, 1043–1057. doi:10.1007/s11069-017-2905-4
Xiong, J., Pang, Q., Fan, C., Cheng, W., Ye, C., Zhao, Y., et al. (2020). Spatiotemporal Characteristics and Driving Force Analysis of Flash Floods in Fujian Province. IJGI 9, 133. doi:10.3390/ijgi9020133
Xu, C., and Xu, Y. (2012). The Projection of Temperature and Precipitation Over China Under RCP Scenarios Using a CMIP5 Multi-Model Ensemble. Atmos. Oceanic Sci. Lett. 5, 527–533. doi:10.1080/16742834.2012.11447042
Xu, Y., Gao, X., Giorgi, F., Zhou, B., Shi, Y., Wu, J., et al. (2018). Projected Changes in Temperature and Precipitation Extremes over China as Measured by 50-yr Return Values and Periods Based on a CMIP5 Ensemble. Adv. Atmos. Sci. 35, 376–388. doi:10.1007/s00376-017-6269-1
Xu, Y., Wang, L., Li, L., and Zhou, Y. (2000). Design of Decision Support System for Flood Control in Coastal Medium and Small Basins——A case study in the Yongjiang watershed in southeast China. J. Nanjing Univ. 36, 280–285.
Yan, D.-H., Han, D.-M., Wang, G., Yuan, Y., Hu, Y., and Fang, H.-Y. (2014). The Evolution Analysis of Flood and Drought in Huai River Basin of China Based on Monthly Precipitation Characteristics. Nat. Hazards 73, 849–858. doi:10.1007/s11069-014-1109-4
Yuan, W., Tu, X., Su, C., Liu, M., Yan, D., and Wu, Z. (2021). Research on the Critical Rainfall of Flash Floods in Small Watersheds Based on the Design of Characteristic Rainfall Patterns. Water Resour. Manage. 35, 3297–3319. doi:10.1007/s11269-021-02893-5
Zhang, T., and Wei, F. Y. (2009). Probability Dstribution of Precipitation Extremes During Raining Seasons in South China. Acta Meteorologica Sinica 67 (3), 442–451. doi:10.1175/JHM-D-11-041.1
Zhang, X., Alexander, L., Hegerl, G. C., Jones, P., Tank, A. K., Peterson, T. C., et al. (2011). Indices for Monitoring Changes in Extremes Based on Daily Temperature and Precipitation Data. Wires Clim. Change 2, 851–870. doi:10.1002/wcc.147
Keywords: precipitation extremes, return levels, RegCM4, future projection, coastal watershed
Citation: Li C, Dike VN, Lin Z and Gao X (2021) Projected Changes in Precipitation Extremes Over Jiulongjiang River Basin in Coastal Southeast China. Front. Earth Sci. 9:771592. doi: 10.3389/feart.2021.771592
Received: 06 September 2021; Accepted: 13 October 2021;
Published: 16 November 2021.
Edited by:
Anning Huang, Nanjing University, ChinaReviewed by:
Shanlei Sun, Nanjing University of Information Science and Technology, ChinaCopyright © 2021 Li, Dike, Lin and Gao. This is an open-access article distributed under the terms of the Creative Commons Attribution License (CC BY). The use, distribution or reproduction in other forums is permitted, provided the original author(s) and the copyright owner(s) are credited and that the original publication in this journal is cited, in accordance with accepted academic practice. No use, distribution or reproduction is permitted which does not comply with these terms.
*Correspondence: Zhaohui Lin , bHpoQG1haWwuaWFwLmFjLmNu
Disclaimer: All claims expressed in this article are solely those of the authors and do not necessarily represent those of their affiliated organizations, or those of the publisher, the editors and the reviewers. Any product that may be evaluated in this article or claim that may be made by its manufacturer is not guaranteed or endorsed by the publisher.
Research integrity at Frontiers
Learn more about the work of our research integrity team to safeguard the quality of each article we publish.