- 1Shanghai Institute of Technology, Shanghai, China
- 2Shanghai Climate Center, Shanghai, China
- 3Key Laboratory of Citie’s Mitigation and Adaptation to Climate Change in Shanghai, China Meteorological Administration, Shanghai, China
- 4Shanghai Meteorological Disaster Prevention Technology Center, Shanghai, China
- 5School of Environmental Science and Engineering, Southern University of Science and Technology, Shenzhen, China
- 6Shanghai Meteorological IT Support Center, Shanghai, China
- 7Key Laboratory of Geographic Information Science (Ministry of Education), East China Normal University, Shanghai, China
- 8School of Geographic Sciences, East China Normal University, Shanghai, China
In this study, we used the cumulative distribution function transform to conduct a bias correction for simulations from different regional climate models (RCMs) driven by one global climate model (HadGEM2-ES). We divided the historical period into two time-frames, i.e., the calibration period and the validation period. These two periods are 1986–1998 and 1999–2011, respectively. We then choose the period from 1986 to 2005 as the calibration period. The data for the future 2006–2098 were revised and used to explore future climate change under the RCP8.5 scenario. The difference before and after bias correction were compared. The results show that the cumulative distribution function transform method can improve the simulation accuracy of RCM in terms of the average precipitation and seasonal precipitation can improve in north arid regions. For extreme precipitation and different rainfall levels, the root mean squared errors of most indexes are reduced by about 60–80% in China, and the correlation coefficients are close to 1. For future precipitation, the bias correction method could reduce the overestimation of RCM simulations, but cannot change trends of precipitation variation. Compared with the simulations before bias correction, the predicted future precipitation indicates some differences in different regions. After correction, the spread of the precipitation and the most extreme precipitation indexes was smaller than those before correction. The predicted future daily precipitation intensity was also smaller. The reduction of drought days in the arid areas is more than before the correction, and the increase days of R50 in the southern regions is larger than before the correction.
Introduction
With global warming, the number of extreme precipitation events has continued to increase around the world (Donat et al., 2016). In China, extreme precipitation events have occurred frequently in recent years and caused numerous losses in terms of lives and property. Therefore, a better understanding of future variation trends in extreme precipitation is important. To effectively predict extreme precipitation events, researchers usually study future precipitation changes by using climate models, including global climate models (GCMs) and regional climate models (RCMs).
Some previous studies have used GCMs to predict climate change (Leng et al., 2020; Wang et al., 2020; Zhang et al., 2020b). However, due to the relatively low resolution of GCMs, there are large biases compared with observations, and it is difficult to accurately predict precipitation at a smaller regional scale (Zhang et al., 2017; Chen et al., 2018; Yu et al., 2018). In particular, China is located in East Asia and affected by the East Asian monsoon, and it has a unique terrain with numerous mountains, resulting in a complex and changeable climate. Therefore, there is uncertainty about GCMs climate prediction in China (Hui et al., 2018a; Hui et al., 2018b). Several studies have shown that high-resolution data can improve the precipitation simulation (Shi et al., 2017; Bucchignani et al., 2018; Xu et al., 2018; Fu et al., 2021). Therefore, the dynamic downscaling method is always used to obtain future precipitation trends at a regional scale more accurately.
Currently, RCMs have high resolution and are frequently used to simulate precipitation changes at a regional scale. Previous studies have shown that after dynamic downscaling, RCMs can effectively capture regional precipitation characteristics (Jiang et al., 2020; Tong et al., 2020; Fu et al., 2021; Qin et al., 2021). Fu et al. (2021) found that the Regional Climate Model version 4 (RegCM4) performs better than GCMs in simulating spatial details when studying climate change on the Tibetan Plateau (TP) and its surrounding areas and that the simulations from the RegCM4 are more consistent than those of GCMs. To project extreme precipitation between 2041 and 2060 in eastern China, Dong et al. (2020) applied the results from two GCMs to drive the weather research and forecasting model as part of the Providing Regional Climates for Impacts Studies (PRECIS). The results showed that RCMs after downscaling show better performance than GCMs in simulating extreme precipitation. Xiang-ling et al., 2020 used the results from one GCM to drive the RegCM4.4 to study extreme precipitation in Xinjiang, and the results showed that the RegCM4.4 could reproduce the spatial distribution of extreme precipitation in Xinjiang. Hui et al. (2018a) used two GCMs to drive two RCMs and predicted future precipitation, and found that extreme precipitation events will continue to increase. Bao et al. (2015) found that as the resolution increases, the simulated precipitation is more accurate when using one GCM to drive the weather research and forecasting model.
The regional climate data after dynamic downscaling are accompanied by certain systematic errors. Thus, it is necessary to conduct error correction. There are two main error sources. First, the errors in the GCMs are transferred to the RCMs after dynamic downscaling. Second, RCMs have systematic errors in themselves. These errors lead to a large bias of extreme precipitation indexes. Several studies have shown that when the improvement from optimizing the model parameterization schemes is limited, using the bias correction method to correct RCM results with dynamic downscaling could reduce systematic errors. For example, Zhou et al. (2014) found that after bias correction, the proportion of grid points where simulated daily precipitation deviations from the observation exceeded 100% was reduced to 1%. In addition, the spatial correlation of extreme indexes between the simulations and the observations was significantly improved. Tong et al. (2020) employed two correction methods, quantile mapping, and quantile delta mapping, to revise RCM results, and found that the quantile delta mapping performed relatively better. Both bias correction methods effectively improved the reliability of predicting future precipitation. Wang et al. (2019) applied a single dynamic downscaling method and a hybrid statistical-dynamical downscaling method to simulate the temperature in the coastal areas of Finland. The results demonstrated that the simulated temperature from the hybrid statistical-dynamical method is more accurate than dynamic downscaling results. Wu et al. (2021) used the cumulative distribution function transform (CDF-t) method to correct GCM results and found that the CDF-t improved the results from GCM simulations, with more precipitation days and a lower amount of precipitation. By using daily precipitation and temperature observations from 1961 to 2005, Yang et al. (2019) evaluated four bias correction methods, i.e., the bias-correction and spatial downscaling, bias-correction and climate imprint, bias correction constructed analogs with quantile mapping reordering, and CDF-t. These results suggested that all four methods performed well in improving the accuracy of climate models for simulating extreme precipitation.
In previous studies on error correction, some studies have sought to revise GCMs (Yang et al., 2018; Zhang et al., 2020a), and others have undertaken to correct one RCM driven by the data from one GCM (Wang et al., 2019). However, less attention has been paid to bias correction for multi-RCMs driven by GCM with CDF-t. To date, there have been few analyses on whether the correction effects are affected by different RCMs. In this study, the CDF-t method was used to correct the model data during a historical period in the past (1999–2011) and in the future, during the middle (2036–2065) and late (2066–2095) 21st century. One GCM (HadGEM2-ES) drives three different RCMs, with REMO, RegCM4, and PRECIS applied in this research. We use these data to study the performances of each model in terms of extreme indexes and average precipitation before and after the correction in the historical period, and we employ the revised RCMs to predict future extreme precipitation changes in China.
The remainder of this paper is organized as follows. Data and Methods briefly introduces the data and methods. Results provides the characteristics of the simulated historical precipitation and predicted future precipitation. Finally, Conclusion and Discussion presents the conclusions and discussion.
Data and Methods
The observation data used in this study are from the CN05.1 dataset. The CN05.1 dataset is a gridded dataset from more than 2,400 stations in China and contains historical meteorological data such as precipitation and temperature from 1961 to 2011, with a horizontal resolution of 0.25°(Wu and Gao, 2013). At present, this data set is widely used for model validation.
The RCMs used in this study are the REMO, the PRECIS, and the RegCM4, with a horizontal resolution of 25 km under the CORDEX-EA-II frame work. The data from the HadGEM2-ES are used to drive the REMO (HdRO), PRECIS (HdPE), and the RegCM4 (HdRE). HadGEM2-ES has good performance for simulating the climate in East Asia (Chen and Sun, 2015; Jiang et al., 2015). REMO can be download from https://esg-dn1.nsc.liu.se/projects/esgf-liu/.
The performance of RCMs used in this research was driven by reanalysis data in the simulation of precipitation over China, and the distribution of mean and extreme precipitation was evaluated. Some studies (Xu and Richard, 2004; Wang et al., 2012) have found that PRECIS driven by reanalysis dataset can better simulate climate change on the ground, especially extreme precipitation and seasonal changes. However, PRECIS simulates more precipitation in China, especially in the southern region. REMO is driven by reanalysis data and has also been evaluated in previous studies (Zhang, et al., 2005; Xu et al., 2016; Xu et al., 2018; Remedio et al., 2019; Pang et al., 2021). REMO can reproduce the mean climatology well, such as annual and seasonal precipitation. Even though it has a wet bias for most of China and a dry bias for Southern China in Summer. The seasonal mean precipitation simulated by RegCM4 which is driven by reanalysis data also performs well (Gao et al., 2016; Yu et al., 2019), although the annual precipitation simulated by RegCM4 in Northeast China is still relatively large. All the RCMs driven by reanalysis data have performed well when simulating precipitation to date, meaning we can project the mean and extreme precipitation in the future by using these three regional climate models (i.e., RegCM4, PRECIS, and REMO) driven by CMIP5 GCMs.
The GCMs that provide the driving field have performed relatively well in previous studies for simulating the precipitation in China. The RCMs used in this study have a high resolution and are based on the Coordinated Regional climate Downscaling Experiment, which provides better results for simulating precipitation in East Asia. To analyze the simulation performances of models, The study area was divided into eight sub-regions (Hui et al., 2018a, Hui et al., 2018b; Jiang et al., 2020) including northwest (NW, 35°–45°N, 78°–99°E), Tibetan Plateau (TP, 28°–35°N, 80°–99°E), eastern northwest (ENW, 34°–42°N,99°–110°E), southwest (SW, 24°–34°N, 99°–110°E), northeast (NE, 42°–52°N, 115°–132°E), north (N, 35°–42°N, 110°–122.5°E), southeast (SE, 27°–35°N, 110°–122.5°E), and south (S, 21°–27°N, 110°–120°E).
Due to the systematic errors of the simulated precipitation, the bias correction method CDF-t is required to correct the errors. This method was first used by Michelangeli and showed a good data correction effect (Michelangeli et al., 2009). It was later used in many other studies to correct precipitation data and showed outperformance (Gao et al., 2016; Wu et al., 2018; Yang et al., 2018; Yang et al., 2019). This method assumes a function T that makes the simulated CDF close to the observed CDF in the historical period. This method also assumes that the function T is still valid for the simulated future CDF, and it is applied to the simulated future CDF to revise RCM simulations.
Results
Evaluation of Historical Precipitation
Before using model data to predict future extreme precipitation, it is necessary to use observation data to evaluate the performances of RCMs and bias correction methods for simulating precipitation. This section shows the improvement of the bias correction method for simulating several precipitation indexes compared with the RCMs.
Mean Precipitation in the Historical Period
To evaluate the corrected precipitation, we compare the simulated annual precipitation from each model before and after correction with the observations during 1999–2011 (Figure 1). The spatial distribution of observed annual precipitation (Figure 1A) in the historical period (1999–2011) shows more precipitation in the south and less precipitation in the north. In terms of the three RCMs (REMO, PRECIS, RegCM4) (Figures 1B–E) driven by HadGEM2-ES, the precipitation is underestimated in the southern humid regions, and it has a general trend of overestimation at the national scale. Some research has found that the annual precipitation on the eastern edge of the Qinghai-Tibet Plateau has been overestimated by HadGEM2-ES, and for the southwest border of China. The HadGEM2-ES is more likely to overestimate the precipitation in Northeast China. After dynamical downscaling, the biases from HadGEM2-ES are taken into the RegCM4 and the RegCM4 further aggravates the bias of annual precipitation in Northeast China. The other studies on GCM and RCM assessments had the same conclusion (Flato et al., 2013; Bao et al., 2015). Some studies (Gao et al., 2016; Yu et al., 2019) also used a reanalysis dataset called “perfect boundary condition” to drive RegCM4, and the annual precipitation simulated by RegCM4 in Northeast China is still relatively large. The reasons for this could be due to the positive vorticity deviation in the lower levels of Northeast China (Hui et al., 2018a), or they could be related to the deficiency of parameterization scheme of physical processes. The ensemble-average precipitation of RCMs (ENS) presents underestimation in the south and the northwest, and overestimation in other regions, especially in parts of the TP. The deviations of the results from three RCMs driven by GCM may be caused by the GCM themselves. In addition, systematic errors in the RCMs can lead to simulation biases.
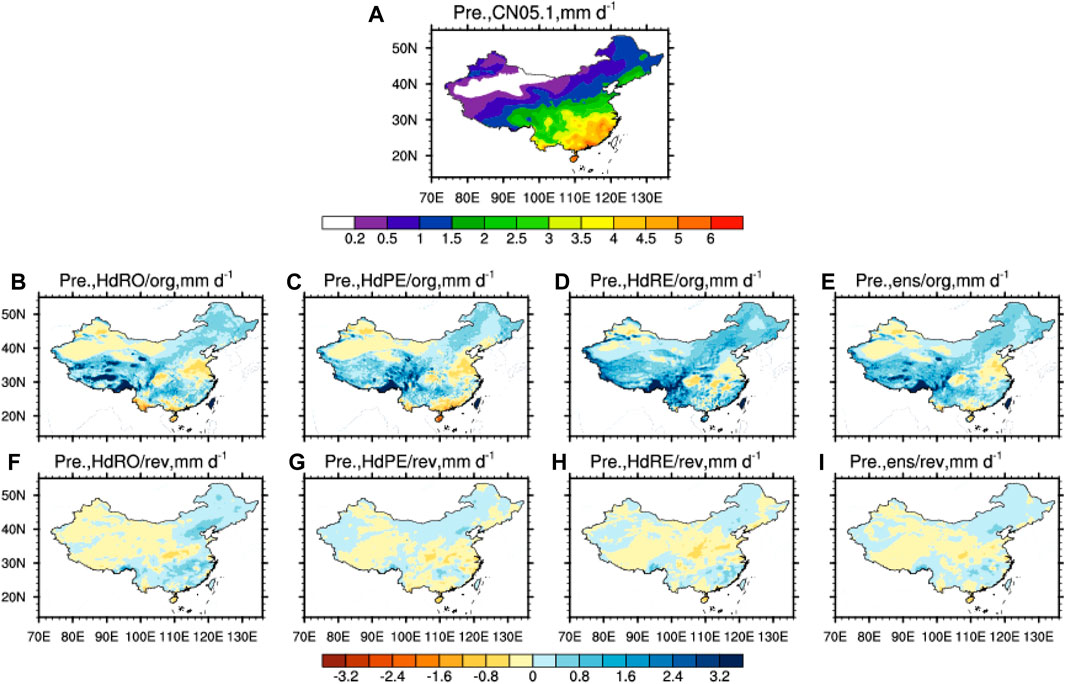
FIGURE 1. Spatial distributions of the observational annual precipitation (A) and biases between observations and simulations from RCMs before correction (B–E) and after correction (F–I).
In order to correct the above systematic errors, the bias correction method, CDF-t, is used, and the corrected results are evaluated with the observations (Figures 1F–I). In general, the corrected data of the RCMs are closer to the observations than before correction. After correction, the biases between the simulations of each RCM and the observations are between ±0.4 mm∙day−1 compared with ±3.2 mm∙day−1 before correction, the biases are significantly reduced.
Figure 2 shows the seasonal cycle of precipitation (mm day−1) from the RCM simulations and the ENS before and after correction during the historical period (1999–2011). There are large biases between simulations of each model and the observations in the TP, SE, and S, while the biases in the N region are relatively small. Before the correction, for the peak values of the average monthly precipitation, the biases between the RCM simulations and the observations are large. In addition, the maximum monthly precipitation occurs in different months. For example, in the S region (Figure 2H), only RegCM4 and the observations peak simultaneously in June, while the months with the peak values of the simulations from other models are different from that of the observations. This finding may be related to the complexity of precipitation characteristics in the southern regions. The corrected RCM results are improved. Firstly, the excessive-high peaks of simulated precipitation are reduced. For example, in the N region (Figure 2F), the precipitation peak of the RegCM4 before correction is about 6.5 mm∙day−1, higher than the observed peak of about 4 mm∙day−1. After correction, the precipitation peak value is closer to the observations.
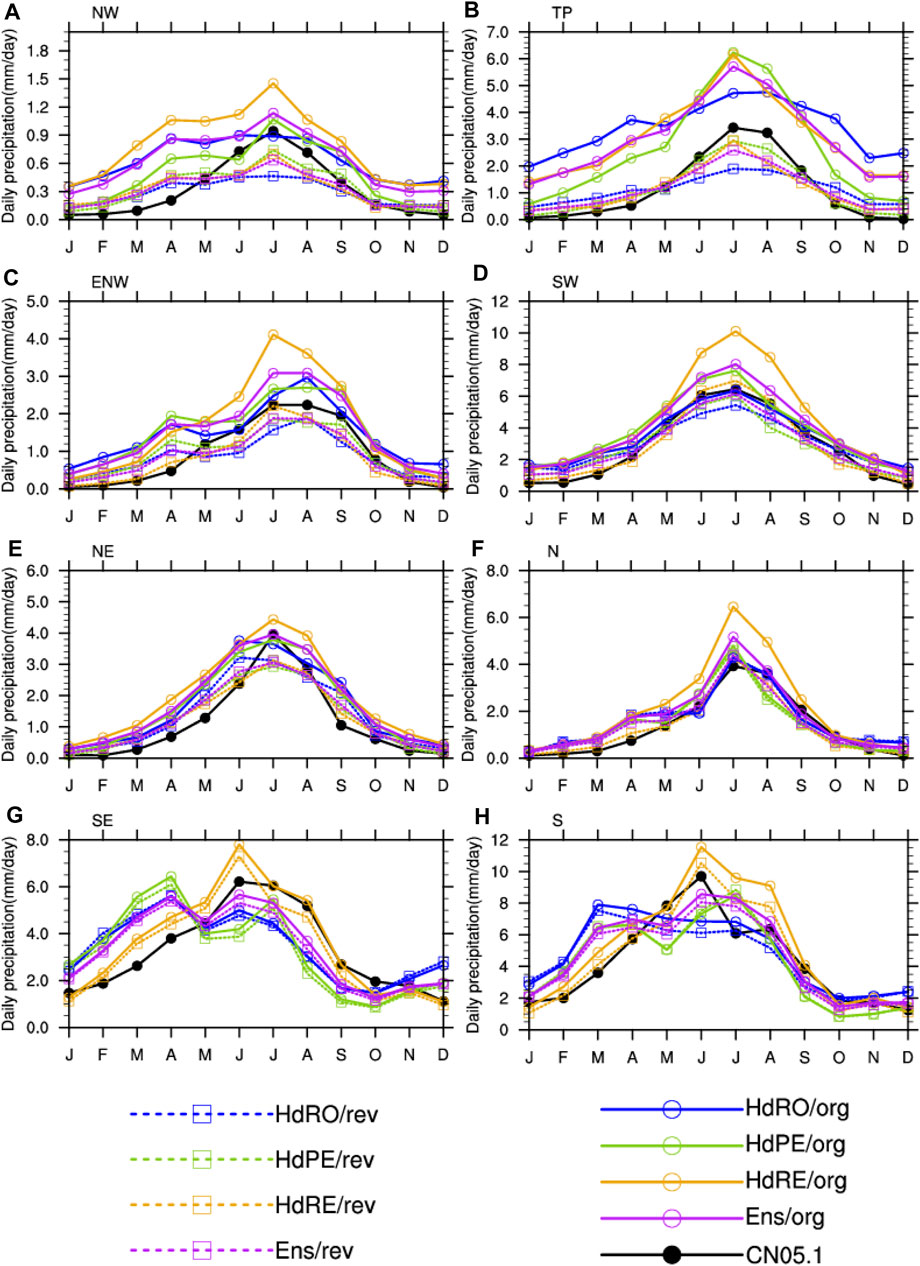
FIGURE 2. Seasonal cycle of monthly precipitation for the simulations and observations in eight sub-regions (A–H). The dashed lines with a box indicate the corrected simulations, and the solid lines with a circle denote the simulations before correction. The X-axes are the months, and the Y-axes represent the precipitation amount.
We also calculated the root mean squared errors (RMSEs) between the observations and the simulations from the five models before and after correction in the eight sub-regions. The results suggest that the bias of the corrected RCM simulations is significantly reduced. Especially in the NW and TP regions, all simulations have been significantly improved, with the RMSE reduced. After the bias correction, the HdRE simulations have been improved in all regions, indicating that the correction effect on HdRE simulations is significant. For the other models, the correction effect is not as significant as that of the HdRE, but there are also obvious improvements in some regions. The corrected ENS shows that the RMSE decreases significantly in the arid and semi-arid areas but the improvement is not significant for the humid areas where the precipitation characteristics are complex. In terms of the correlation coefficients, since the correlation coefficients between the simulations and the observations are relatively high before correction, the improvement by the CDF-t method is relatively limited. However, the correlation coefficients for most model simulations in the NW and TP regions have been significantly improved. Therefore, it can be concluded that the data correction has a limited improvement in the relatively small RMSE and relatively high correlation coefficients, and the improvement effect is different for different RCMs. However, the NW and TP regions have significant improvements in both the RMSE and correlation coefficients.
Figure 3 shows the precipitation probability distribution of each ENS before and after correction. It can be seen that before correction in the western arid areas, the precipitation probability of the ENS has large underestimations for precipitation of 1–5 mm but significant overestimations for precipitation greater than 5 mm. For heavy rain greater than 50 mm in humid areas, there are overestimations. After correction, the precipitation probability at most precipitation levels in the most studied area is extremely close to the observed values, demonstrating that the CDF-t method can effectively correct precipitation biases simulated by the RCMs.
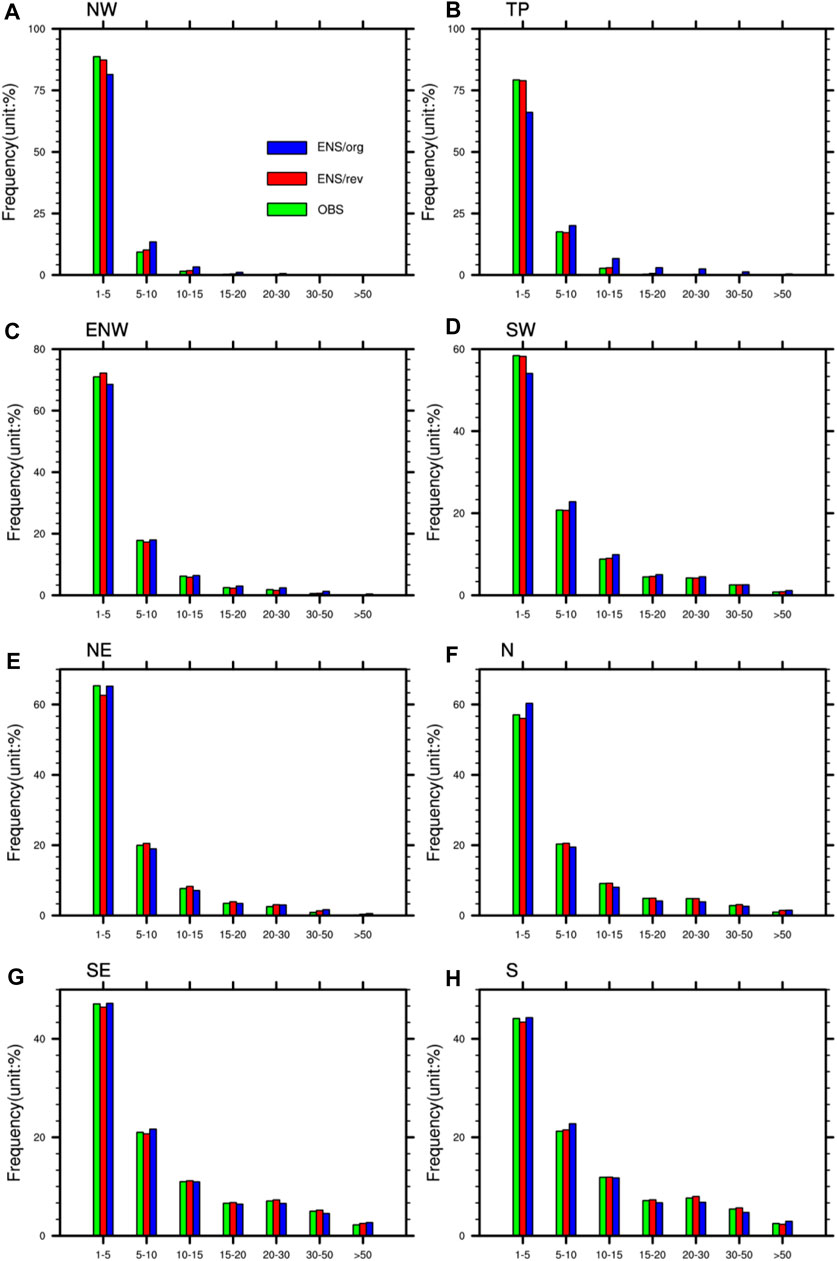
FIGURE 3. Precipitation probability distributions of the observations and simulations in eight sub-regions of China before and after correction (A–H). Blue and red columns represent the simulations before and after correction, respectively. Green columns indicate the observed values.
Historical Extreme Precipitation
As well as the mean precipitation, it is crucial to assess the simulation performances of each RCM on extreme precipitation. Figures 4, 5 show the biases of the 11 precipitation indexes between the observation and the ensemble mean for the five RCMs before and after correction. The precipitation indexes are the Rx5day, the Rx1day, the R95p, the R25, the R50, the SDII, the CDD, the CWD, the light rain, the medium rain, and the heavy rain, as shown in Table 1. For Rx5day, Rx1day, and R95p, the spatial distributions of observations show more extreme precipitation in the south and less in the north. In addition, the results of the ensemble mean before correction show an overall overestimation, but an underestimation in southern China and some areas of northwestern China. The Rx1day is severely overestimated by about 40 mm in southern coastal areas, but it is underestimated in parts of the northwest areas. The Rx5day is underestimated in parts of the south and northeast areas. However, the R95p is seriously overestimated. After correction, the biases of the R95p are reduced to ±15 mm in west China, much lower than before correction (±120 mm). The biases in east China are reduced to ±30 mm. The biases of the Rx1day are reduced to ±5 mm after correction in west China and ±10 mm in east China. Biases of the Rx5day are also reduced from ±56 mm to ±28 mm. Therefore, RCMs have been significantly improved in simulating extreme precipitation after correction.
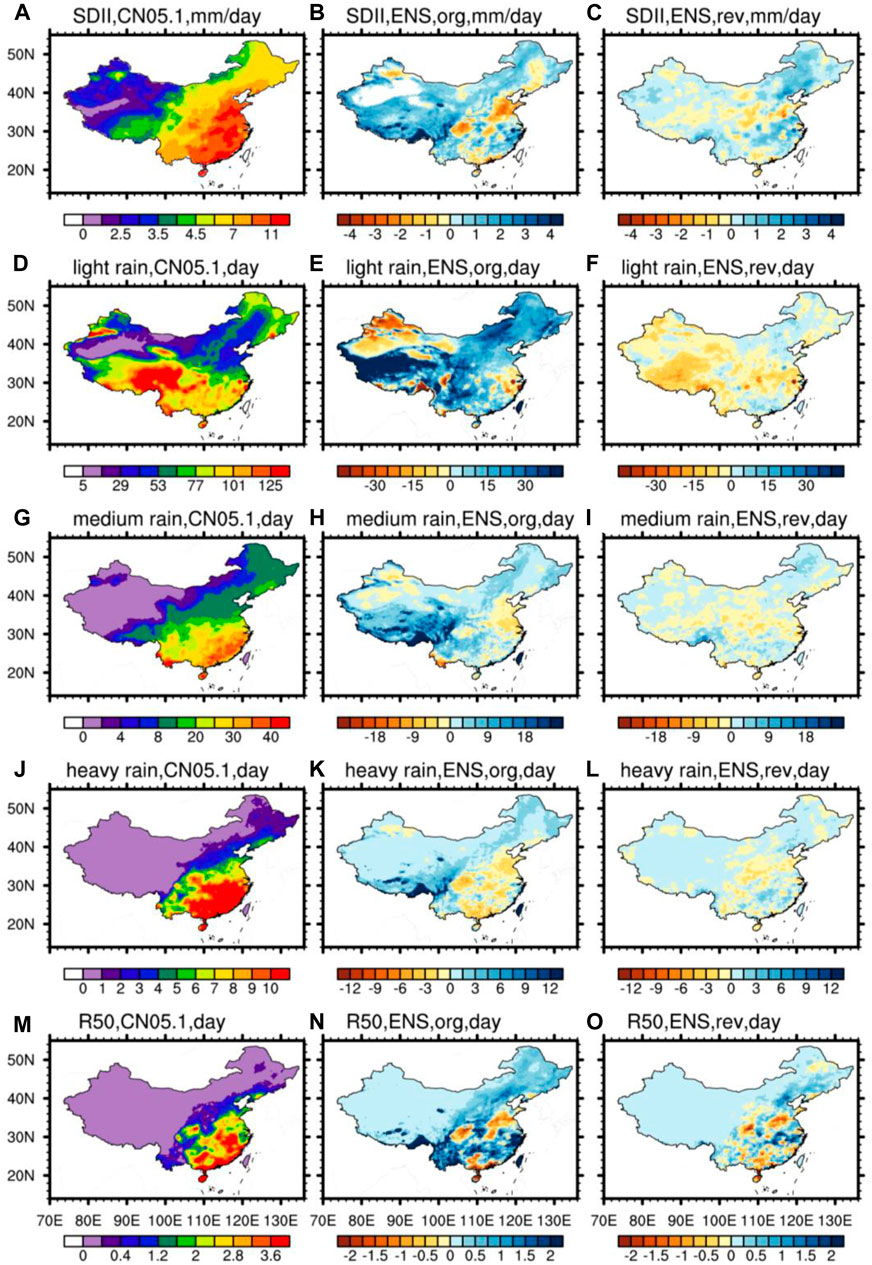
FIGURE 4. The spatial distributions of observed extreme precipitation indexes (A,D,G,J,M). The spatial distributions of the biases of the extreme precipitation indexes between observations and simulations before (B,E,H,K,N) and after correction (C,F,I,L,O). The extreme precipitation indexes include the SDII (A–C), the light rain (D–F), the medium rain (G–I), the heavy rain (J–L), and the R50 (M–O).
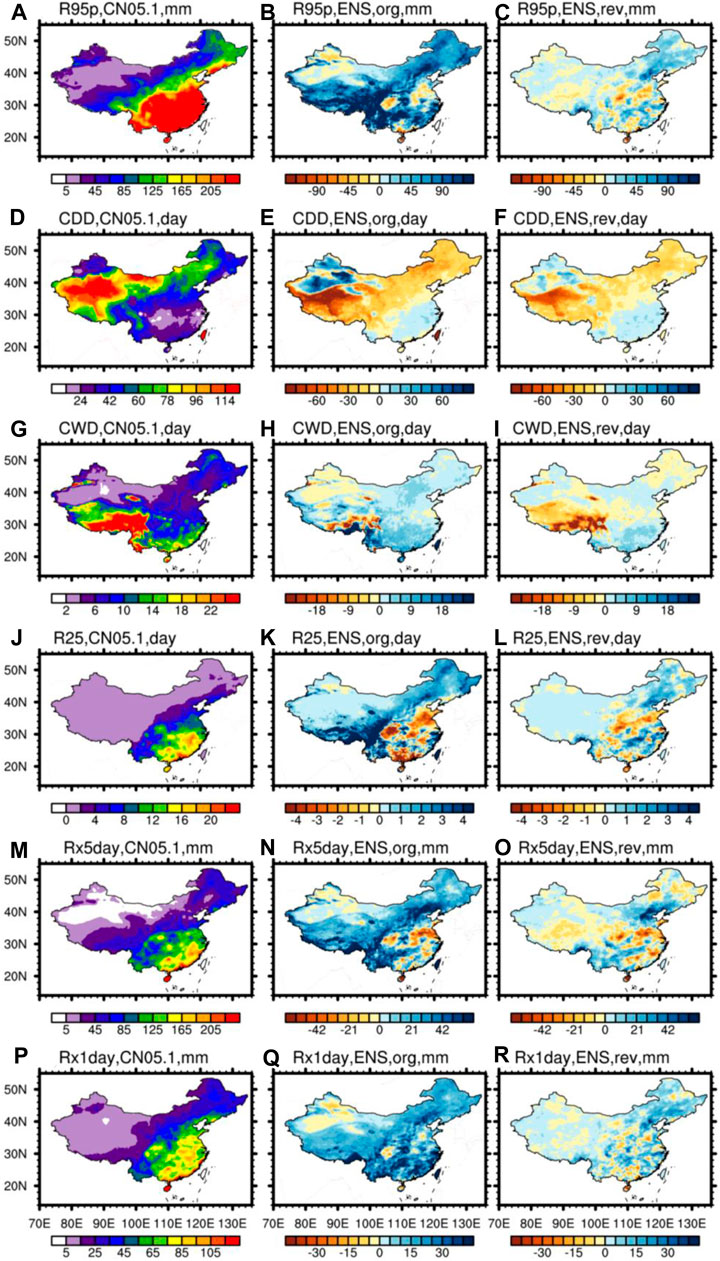
FIGURE 5. Same as Figure 4, but for the extreme precipitation indexes of the R95p (A–C), the CDD (D–F), the CWD (G–I), the R25 (J–L), the Rx5day (M–O), and the Rx1day (P–R).
In terms of the indexes R25, R50, light rain, medium rain, heavy rain, and SDII, there are large improvements after correction. The bias of light rain days is reduced from ±40 days to ±15 days after correction. The bias of medium rain days is reduced from ±24 days to about ±6 days, especially in the TP areas. Moreover, the bias of heavy rain days is reduced from ±12 days to about ±3 days, and the bias for R50 also have been reduced. The biases correction effect of the CDD and CWD are not as large as the other indexes. In addition, the CDD is underestimated in the northern arid areas, and overestimated in the southern areas, with no significant difference before and after correction. Moreover, the CWD is significantly underestimated for the TP.
Figures 6, 7 present the RMSEs of the extreme precipitation indexes and their reduction ratio after correction. After correction, the errors of different indices in each sub-region have been reduced. In general, most of the indices have improved less in eastern China than in western China. This could be because climate change in eastern China is complicated and it is difficult to achieve the expected results and reduce errors through bias correction methods. For CDD and CWD, the overall reduction in each region is less than that of other indices, and the same trend can also be found in the correlation coefficient. In terms of the correlation coefficients (Figure 8), The correlation coefficients of CDD and CWD are smaller than those of other indexes. The correlation coefficients of the CDD and CWD are between 0.6 and 0.8. However, the correlation coefficients of other indexes are quite close to 1, indicating that the data correction method brings a significant improvement in the spatial correlation. The improvement of CDF-t on the RMSE and CORR of CDD and CWD is not as great as other indices. Maybe the ability of CDF-t to correct drizzle needs to be improved (Yang et al., 2019). As a driving model, HadGEM2 has an overestimation of the wet days in China (Jiang et al., 2020). The overestimation of GCM may also be transmitted to the RCM, which leads to the error that CDD and CWD are higher and cause lower CORR. However, the CDF-t’s ability to improve drizzle is not strong, which leads to lower CORR and RMSE improvement after correction than other indices. The fact that only limited (or no) improvements are found for CDD is consistent with the theoretical analysis of Dosio (2016). They also found that indices based on the duration of events are hardly affected by bias adjustment because bias adjustment does not alter the temporal structure of the original data.
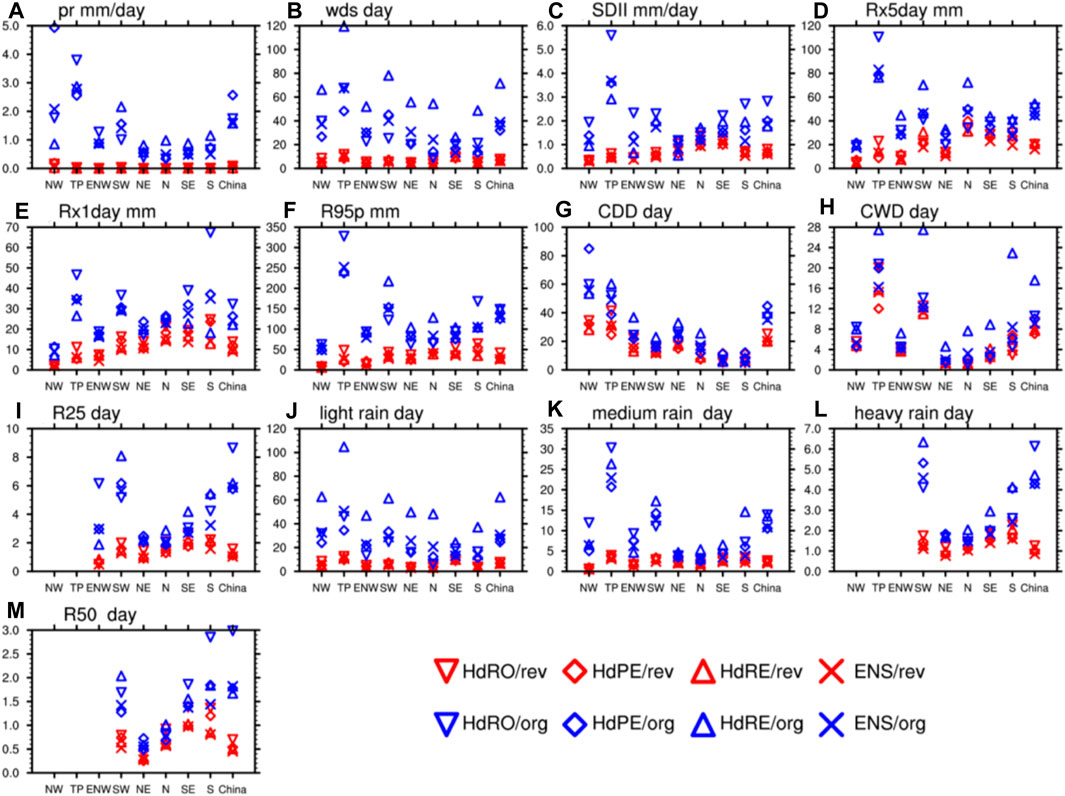
FIGURE 6. RMSE of mean precipitation (A–C), extreme precipitation (D–F), drought indexes (G,H) and precipitation days (I–M) before and after correction in eight sub-regions and China.
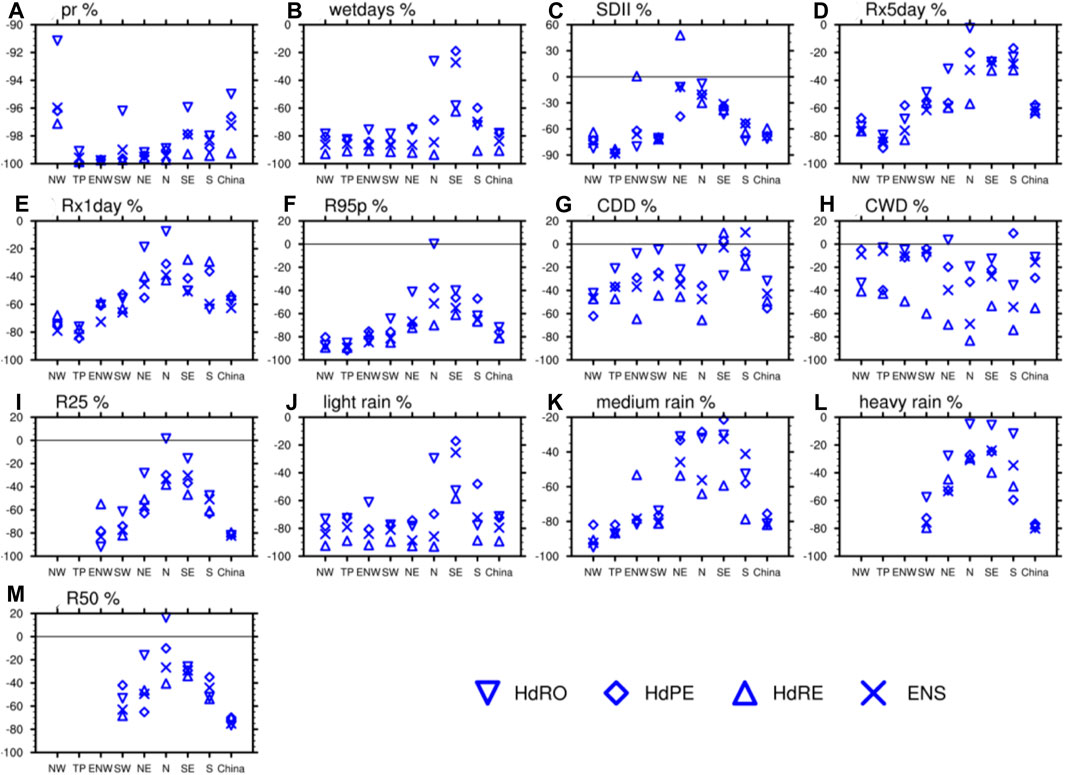
FIGURE 7. The reduction ratios of the RMSE of mean precipitation (A–C), extreme precipitation (D–F), drought indexes (G,H) and precipitation days (I–M) by using bias correction methodology (CDF-t).
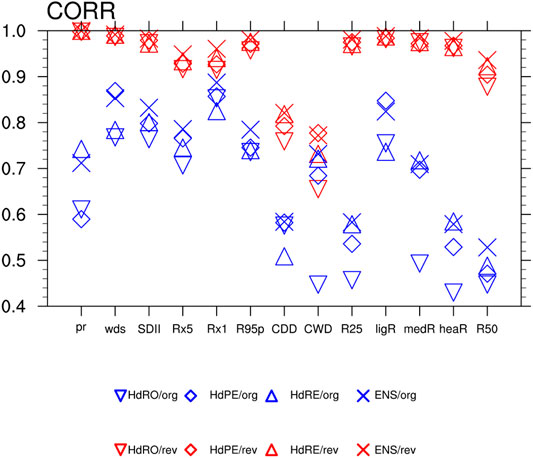
FIGURE 8. Correlation coefficients of 13 precipitation indexes before and after correction. The letters “rev” indicates the revised simulations, and the letters “org” denote the simulations before correction.
To analyze the consistency of the simulated extreme precipitation indexes among the RCMs, Figure 9 provides the standard deviations of the simulated indexes before and after correction in eight sub-regions of China during the historical period. These extreme precipitation indexes are simulated by different RCMs (difRCM) driven by the same GCM. We can see that the revised historical simulation results are more consistent in most regions between different indices. Therefore, the correction method can improve the simulation effect.
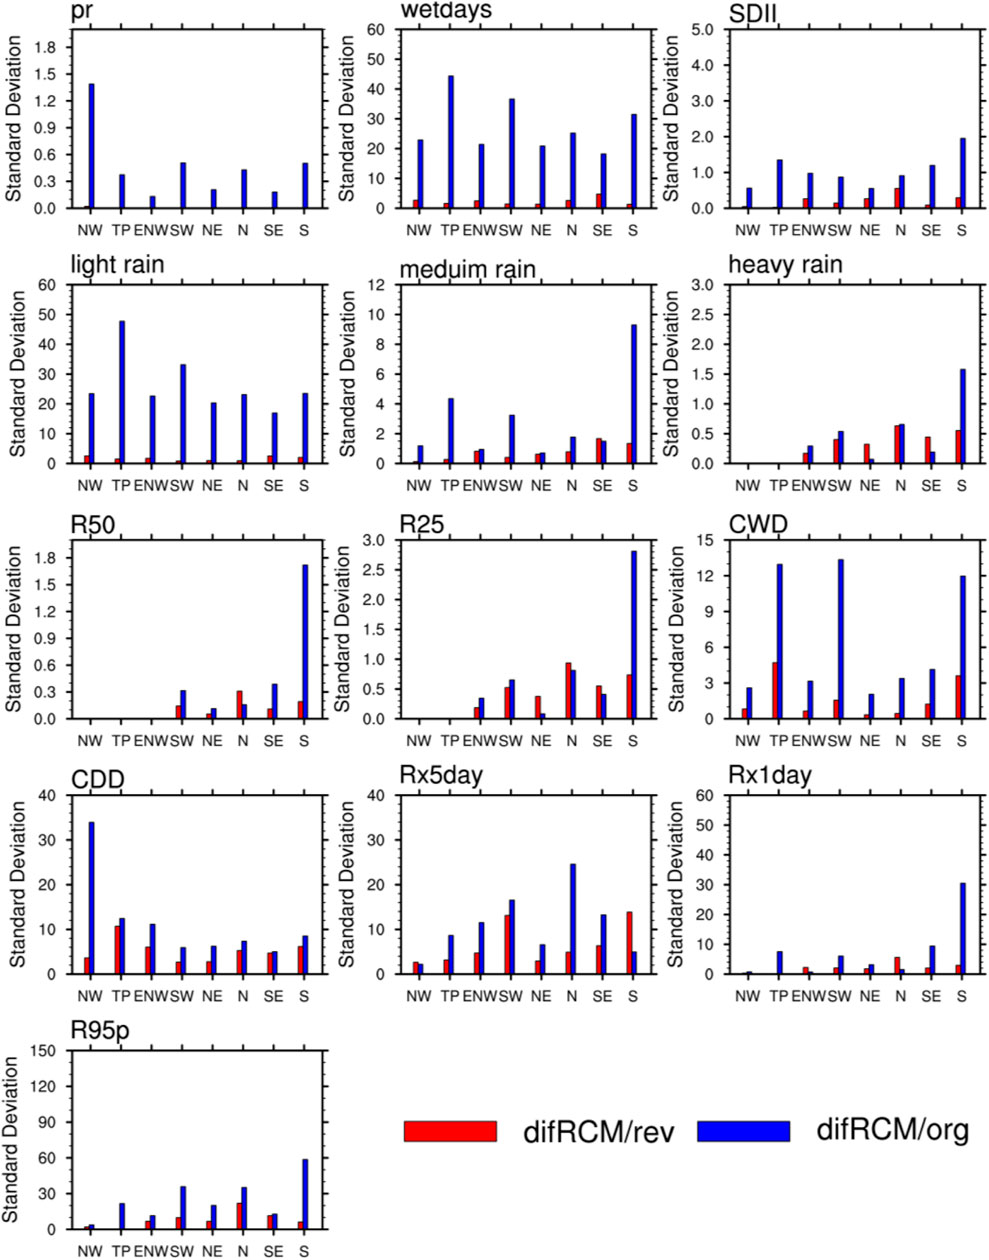
FIGURE 9. Standard deviations of extreme precipitation indexes from different RCMs driven by the same GCM (difRCM) in eight sub-regions before (rev) and after correction (org).
Prediction of Future Precipitation
In the previous section, the simulation errors of average and extreme precipitation in the historical period before and after correction were analyzed. The results demonstrate that bias correction is beneficial to improving the simulation results, with relatively smaller errors compared with a single dynamical downscaling. We then chose the period from 1986 to 2005 as the calibration period, and the data for the future were revised. We used the simulations after bias correction to predict future precipitation and found that the method was credible.
Projection of Future Mean Precipitation
Figure 10 show the variations of precipitation in the late 21st century compared with the historical period. The ensemble mean precipitation (Figures 10G,H) indicates that the precipitation slightly decreases in parts of the south and inland areas. The future precipitation trends are similar before and after correction. However, the range of precipitation reduction in inland areas of China after the correction is smaller than before the correction. In the TP area, the precipitation after the correction is more than that before the correction. Overall, the future precipitation in China shows an increasing trend.
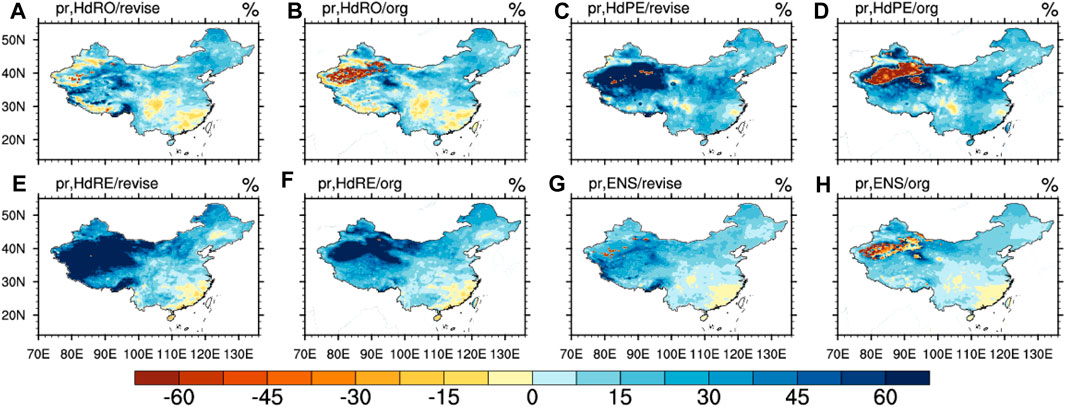
FIGURE 10. Change rates of precipitation in the late 21st century compared with the historical period before (B,D,F,H) and after correction (A,C,E,G).
Future Extreme Precipitation
Figure 11 shows the changes of 11 extreme precipitation indexes (Rx5day, Rx1day, R95p, R25, R50, SDII, CDD, CWD, light rain, medium rain, and heavy rain) in the late 21st century. The Rx5day, the Rx1day, the R95p, and SDII all show increasing trends in the late 21st century in most parts of China both before and after correction, with more increases in the south and relatively less increase in the north. The Rx1day shows no significant difference in future changes before (Figure 11B) and after correction (Figure 11A). For the Rx5day in most regions after correction, the predicted precipitation slightly decreases compared to before the correction. For R95p, the future precipitation growth in the S is bigger after correction (Figure 11E) than before correction (Figure 11F). The SDII in the southern region predicted by the revised ensemble mean precipitation (Figure 11K) is lower than that before correction (Figure 11I).
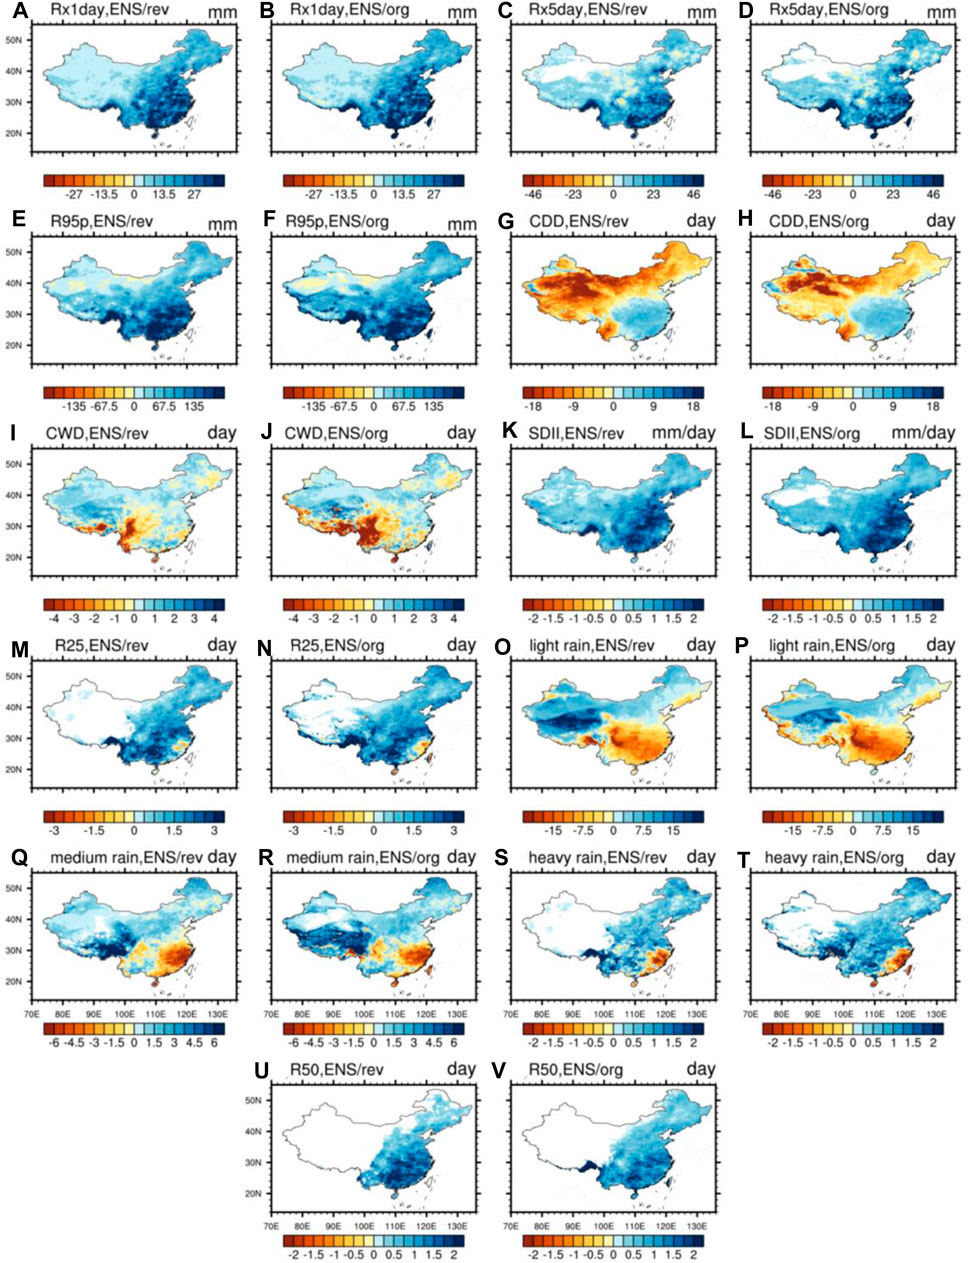
FIGURE 11. Future changes of 11 indexes from the ensemble mean precipitation of RCMs in the late of the 21st century compared with the historical period before (B,D,F,H,J,L,N,P,R,T,V) and after correction (A,C,E,G,I,K,M,O,Q,S,U).
The drought indexes used in this study are CWD and CDD. The CDD indicates that the main future changes will be that drought days decrease in arid areas but increase in humid areas. In addition, the number of drought reduction days in the northern arid regions were less before correction (Figure 11H) than after correction (Figure 11G). The future changes of CWD show that in the central region and the fringe areas of the TP, the number of consecutive precipitation days decreases compared with the historical period. Note that in the central region, the area with the decreased CWD is smaller after correction (Figure 11I) than before correction (Figure 11J). However, in general, the number of drought days will decrease in the future in northern arid areas, and the drought situation in the south will be severe.
In this study, the indexes indicating precipitation days with different precipitation levels include the R25, the R50, the light rain, the medium rain, and the heavy rain. The future precipitation days of light rain decrease in the south and increase in the north. The precipitation days of medium rain show the same trend as the light rain. However, the precipitation days of heavy rain generally increase in China, with a decrease only in some areas along the southern coast. Both the R25 and the R50 show an overall increase. However, the predicted results are different before and after correction for these indexes. The corrected light rain days in the western region are more than before correction. For the medium rain, the reduced number of days in the southern region is more after correction, but the area with the increased projections in the TP is smaller than that before correction.
To quantitatively characterize the future climate change in each region, we calculated the changes in future precipitation in eight sub-regions. Figure 12 shows the changes of 11 extreme indexes before and after correction in eight sub-regions of China in the late 21st century. During the late 21st century, from Figures 12A–D, it can be found that extreme indexes, Rx1day, Rx5day, R95p, and SDII show increasing trends before and after correction in each sub-region, especially in the south. For the drought indexes, the CDD changes in the NW and TP areas are different (Figure 12E), and the reduction of the simulated CDD after correction is greater than that before correction. The results of the ensemble mean precipitation indicate that in the TP region, the CDD decreases by about 3 days before correction and about 8 days after correction. For different precipitation levels, the precipitation days of light rain and medium rain generally increase in the north and decrease in the south. The precipitation days of the R50 increase significantly in all regions. The precipitation days with different precipitation levels have the same change trend in all regions before and after correction. However, the precipitation days of heavy rain in the southern region increases significantly compared to that before correction.
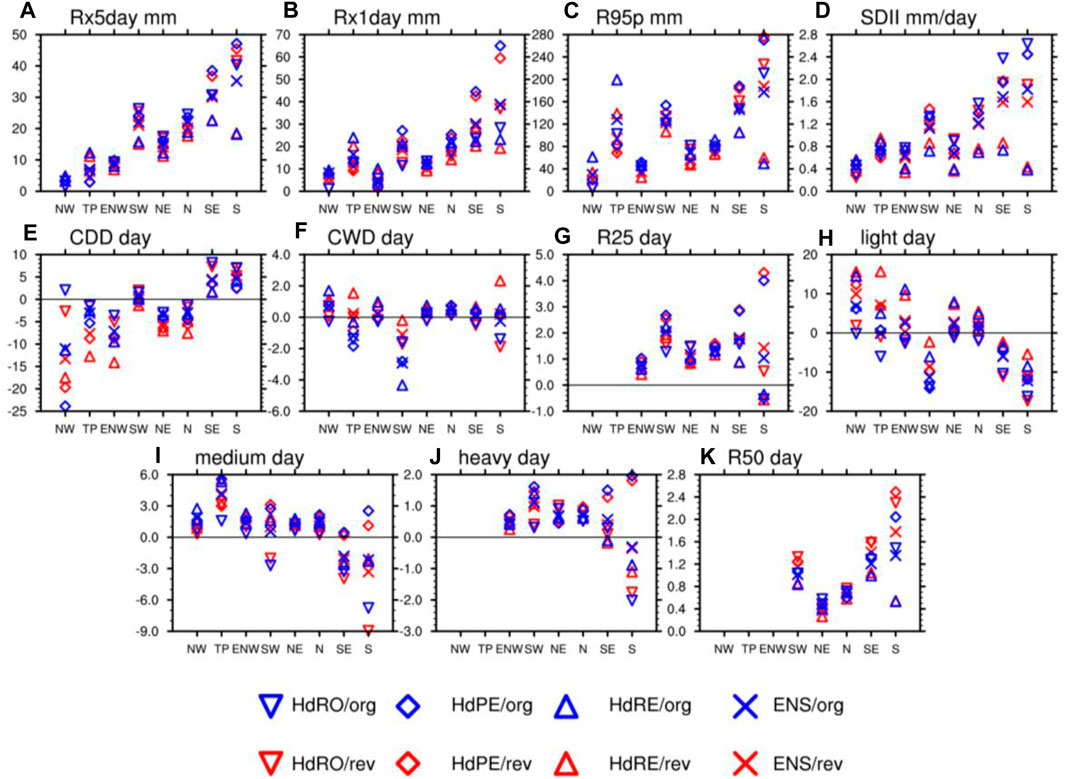
FIGURE 12. Change ratios of extreme precipitation (A–D), drought indexes (E,F) and precipitation days (G–K) in the late 21st century (2066–2095).
Figure 13 shows the interannual variations of the observed precipitation and the simulations before and after correction from 1986 to 2098. The results show that most of the simulated indexes after correction are closer to the observations in the historical period (1986–2005), while there are large biases before correction. This finding reflects the effectiveness of the correction method. Moreover, the change range of the simulations reduces after correction compared with that before correction, suggesting that the correction method can reduce systematic errors. The interannual variations of the various simulations before and after correction show that the precipitation has an increasing trend. Moreover, the interannual variation trend of the precipitation days is not significant, but the SDII has an obvious increasing trend. This situation suggests that the precipitation and the SDII will continue to increase in the future. For the extreme precipitation indexes, Rx5day, Rx1day, and R95p all show increasing trends. In terms of the future precipitation days with different precipitation levels (light rain, medium rain, heavy rain, and R50), the precipitation days change of light rain is not significant, the precipitation days of medium rain have not significant change trends, and the precipitation days of heavy rain and R50 will increase significantly. For the CDD and CWD, the biases of the ensemble mean after correction are large, which is consistent with the result that the CDF-t method performs poorly in verifying the CDD and CWD.
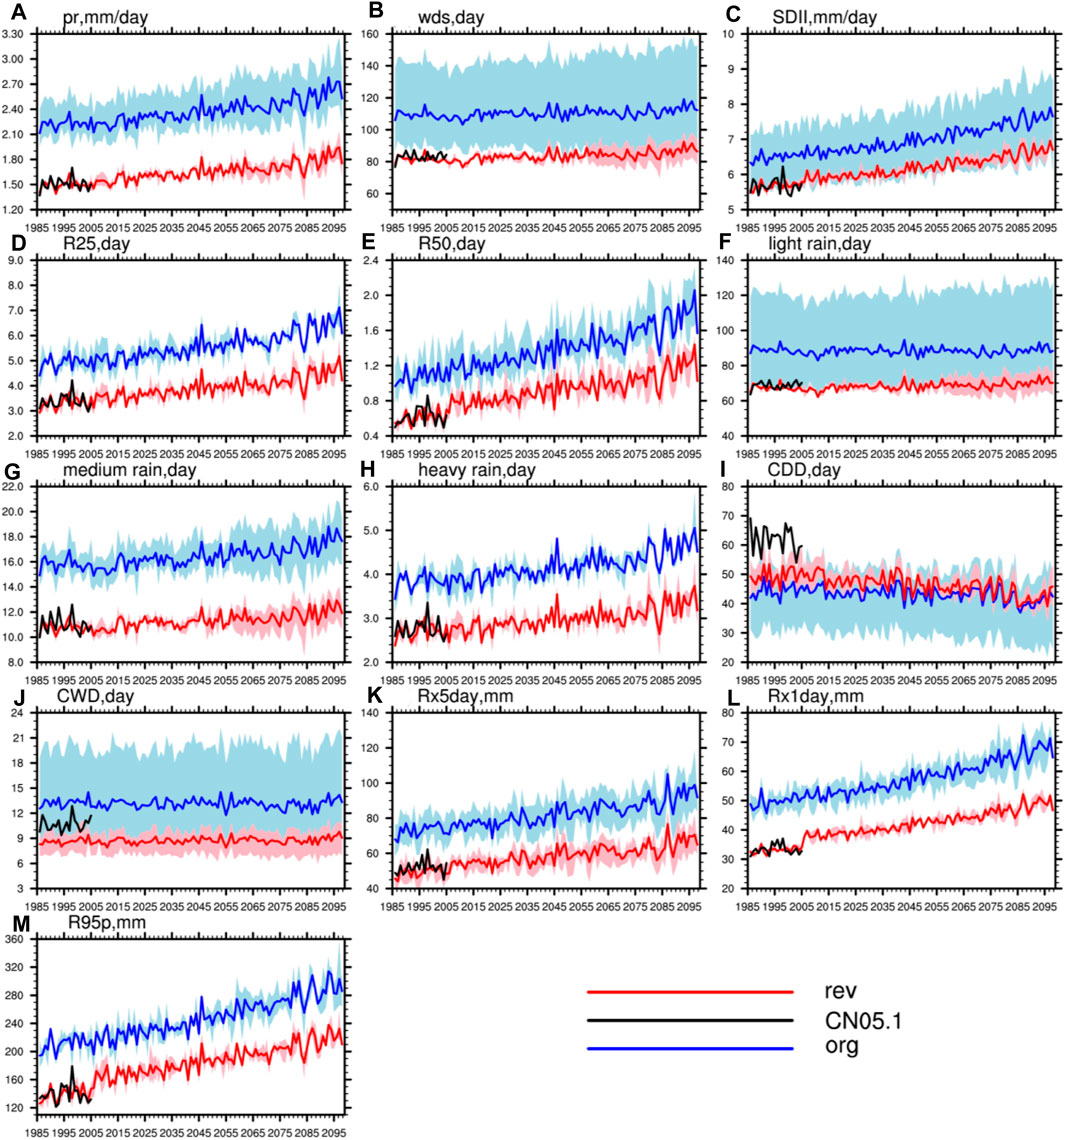
FIGURE 13. Interannual variations of mean precipitation (A–C), extreme precipitation (K–M), drought indexes (I,J) and precipitation days (D–H). The red shaded areas are the change range of simulations after correction, and the blue shaded areas present the change range of simulations before correction.
Figure 14 presents the standard deviation of the simulated indexes from the difRCM before and after correction in eight sub-regions. The projections from the difRCM have a relatively higher consistency in predicting future climate change after correction, but compared with the historical simulation, the consistency is relatively poor. For different precipitation levels, the predicted precipitation days of heavy rain, R50, and R25, difRCM does not perform well in the S region after correction. In terms of the Rx5day, Rx1day, and R95p, the projections from the difRCM after correction are generally consistent in most regions.
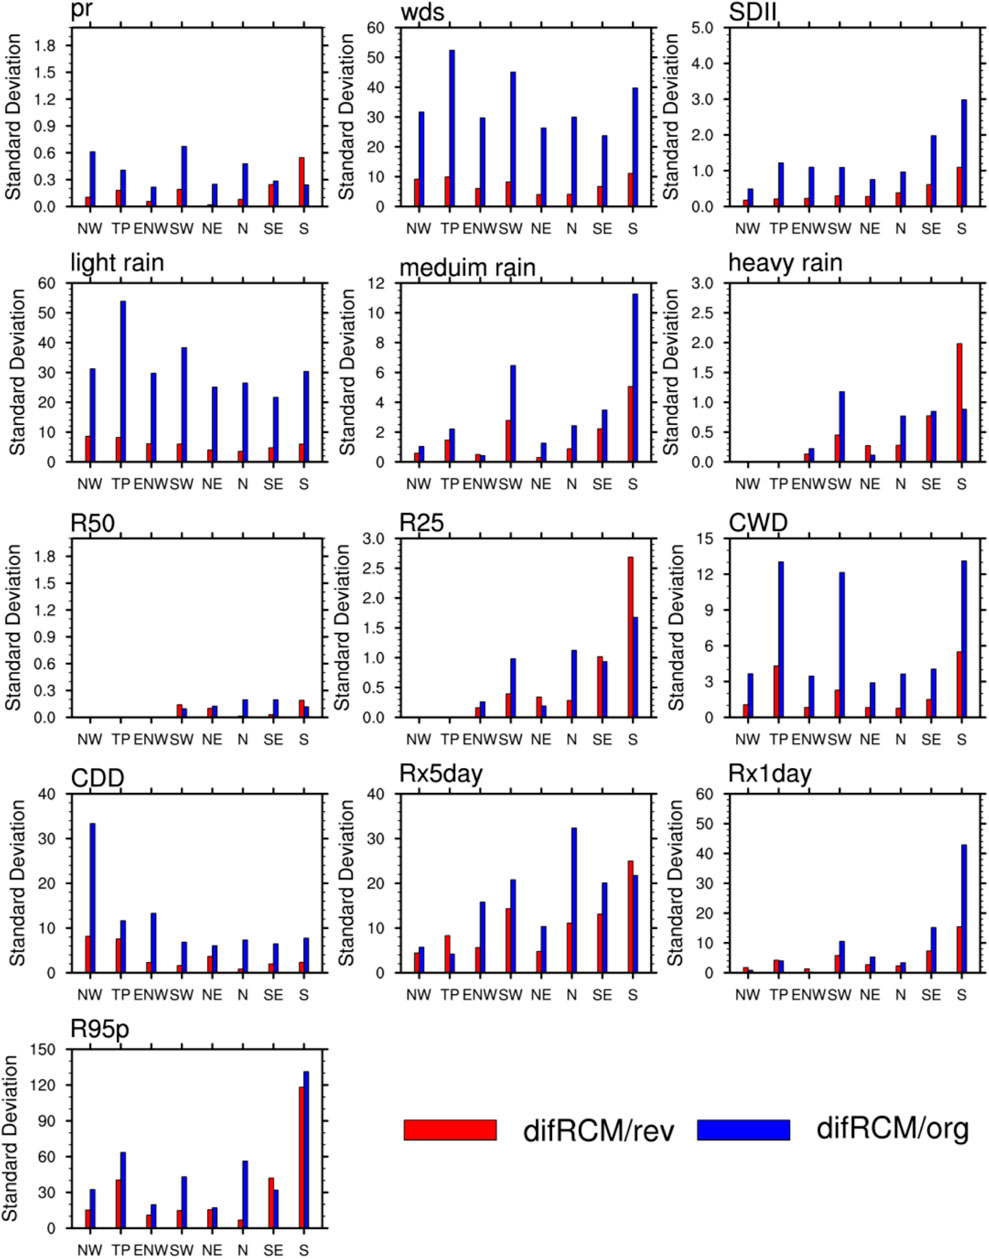
FIGURE 14. Same as Figure 9, but for the late 21st century.
Conclusion and Discussion
In this study, the CDF-t method was used to conduct a bias correction for the simulations from three RCMs (PRECIS, RegCM4, and REMO) driven by the HadGEM2-ES. We have divided the historical period into two different periods, i.e., the calibration period and the validation period. These two periods are 1986–1998 and 1999–2011, respectively. We then choose the period from 1986 to 2005 as the calibration period, and the data for the future 2006–2098 period was revised. After verifying the corrected historical simulations with the observations, the future precipitation changes in eight sub-regions of China were predicted and the differences of consistency of estimates before and after correction were analyzed.
In the historical period (1999–2011), the biases between the observations and simulations reduce greatly after correction, reflecting the effectiveness of the correction method in reducing systematic errors. The RCM simulations improve significantly after correction, with the simulated precipitation biases ranging between ±0.4 mm∙day−1. Compared with ±3.2 mm∙day−1 before correction, the biases were significantly decreased. After correction, the seasonal cycle of precipitation significantly reduced RMSE in arid and semi-arid regions compared with before correction. The precipitation probabilities of each precipitation level was consistent with the observations. Moreover, biases and correlation coefficients of all extreme precipitation indexes were improved. However, the improvements for the CDD and CWD are not as significant as other indexes. The consistency of the difRCM of model data was good after correction.
The average precipitation and extreme precipitation will increase in the future. However, after correction, the predicted precipitation indices will reduce compared with the projections before correction, even though the increasing trend remains unchanged. The average precipitation and the daily precipitation intensity show an increasing tendency in the future. The increasing tendency in extreme precipitation is greater than the average precipitation. Meanwhile, the future precipitation days of heavy rain and R50 will increase significantly. Moreover, drought events in southern China will increase, and extreme precipitation events will also increase, while the drought in northern arid areas will decrease. There are also some differences in the predicted ensemble mean precipitation before and after correction. Specifically, the predicted future precipitation intensity and extreme precipitation events in the southern region after correction are lower than the results before correction, and the reduction of the drought in the north is greater than the results before correction. For the projections of heavy rain, the increase in the southern region is also greater than before correction. The prediction consistency between each model after the correction was better than before the correction.
Despite these findings, there are still several questions remaining in relation to this study. Firstly, only the RCP8.5 scenario was selected for the climate change study. Thus, the future climate change analysis may not be comprehensive enough, and the RCP4.5 or RCP2.6 scenarios should be added to future studies. Secondly, only one bias correction method was used to correct the RCM data. Hence, different correction methods will be adopted in further study. Finally, the climate models selected in this study are not enough, which limits the increase in accuracy of the ensemble projections. In the future, more climate models can be selected to predict future climate change.
Data Availability Statement
The original contributions presented in the study are included in the article/Supplementary Material, further inquiries can be directed to the corresponding authors.
Author Contributions
Conceptualization, GD and DF; Data curation, YX, GD, and WW; Formal analysis, YX, GD, and YW; Methodology, GD, DF, ZT, YW, and MZ; Writing–original draft, YX and GD; Writing–review and editing, GD, DF, ZT, YX, and JT.
Funding
This work was supported by the National Key Research and Development Program of China (2018YFA0606204 and 2019YFE0124800), Natural Science Foundation of Shanghai (21ZR1457600), National Natural Science Foundation of China (51761135024, 41730959 and 41775095), the High-level Special Funding of the Southern University of Science and Technology (Grant No. G02296302, G02296402), and the Social Development Projects of STCSM (19DZ1201402, 19DZ1201500 and 20DZ1200401).
Conflict of Interest
The authors declare that the research was conducted in the absence of any commercial or financial relationships that could be construed as a potential conflict of interest.
Publisher’s Note
All claims expressed in this article are solely those of the authors and do not necessarily represent those of their affiliated organizations, or those of the publisher, the editors and the reviewers. Any product that may be evaluated in this article, or claim that may be made by its manufacturer, is not guaranteed or endorsed by the publisher.
Acknowledgments
We thank the sponsors of this study and Nanjing Hurricane Translation for reviewing the English language quality of this paper. We thank Dr. Jia Wu from NCC of CMA and Dr. Xuejie Gao from the Institute of Atmospheric Physics of the Chinese Academy of Sciences for providing the CN05.1 gridded dataset. We also thank the CORDEX-East Asia project team for providing their model simulation datasets (downloadable from https://esg-dn1.nsc.liu.se/projects/esgf-liu/). We thank Dr. Ying Xu from the National Climate Center (NCC) of China Meteorological Administration (CMA) for providing RegCM4 datasets.
References
Bao, J., Feng, J., and Wang, Y. (2015). Dynamical Downscaling Simulation and Future Projection of Precipitation over China. J. Geophys. Res. Atmos. 120, 8227–8243. doi:10.1002/2015JD023275
Bucchignani, E., Mercogliano, P., Panitz, H.-J., and Montesarchio, M. (2018). Climate Change Projections for the Middle East-North Africa Domain with COSMO-CLM at Different Spatial Resolutions. Adv. Clim. Change Res. 9 (1), 66–80. doi:10.1016/j.accre.2018.01.004
Chen, H., and Sun, J. (2015). Assessing Model Performance of Climate Extremes in China: an Intercomparison between CMIP5 and CMIP3. Climatic Change 129 (1-2), 197–211. doi:10.1007/s10584-014-1319-5
Chen, L., Ma, Z., Li, Z., Wu, L., Flemke, J., and Li, Y. (2018). Dynamical Downscaling of Temperature and Precipitation Extremes in China under Current and Future Climates. Atmosphere-Ocean 56 (1), 55–70. doi:10.1080/07055900.2017.1422691
Donat, M. G., Lowry, A. L., Alexander, L. V., O’Gorman, P. A., and Maher, N. (2016). More Extreme Precipitation in the World's Dry and Wet Regions. Nat. Clim Change 6 (5), 508–513. doi:10.1038/nclimate2941
Dong, G., Jiang, Z., Tian, Z., Buonomo, E., Sun, L., and Fan, D. (2020). Projecting Changes in Mean and Extreme Precipitation over Eastern China during 2041–2060. Earth Space Sci. 7 (9). doi:10.1029/2019ea001024
Dosio, A. (2016). Projections of Climate Change Indices of Temperature and Precipitation from an Ensemble of Bias-Adjusted High-Resolution EURO-CORDEX Regional Climate Models. J. Geophys. Res. Atmos. 121 (10), 5488–5511. doi:10.1002/2015jd024411
Flato, G., Marotzke, J., Abiodun, B., Braconnot, P., Chou, S. C., CollinsW, Cox. P., et al. (2013). “Evaluation Ofclimate Models,” in Climate Change 2013: The Physical Science Basis.Contribution of Working Group I to the Fifth Assessment Report Ofthe Intergovernmental Panel on Climate Change. Editors T. F. Stocker, D. Qin, G. K. Plattner, M. Tignor, S. K. Allen, J. Boschunget al. (Cambridge, UK: Cambridge University Press).
Fu, Y.-H., Gao, X.-J., Zhu, Y.-M., and Guo, D. (2021). Climate Change Projection over the Tibetan Plateau Based on a Set of RCM Simulations. Adv. Clim. Change Res. doi:10.1016/j.accre.2021.01.004
Gao, X.-J., Shi, Y., and Giorgi, F. (2016). Comparison of Convective Parameterizations in RegCM4 Experiments over China with CLM as the Land Surface Model. Atmos. Oceanic Sci. Lett. 9 (4), 246–254. doi:10.1080/16742834.2016.1172938
Hui, P., Tang, J., Wang, S., Niu, X., Zong, P., and Dong, X. (2018a). Climate Change Projections over China Using Regional Climate Models Forced by Two CMIP5 Global Models. Part I: Evaluation of Historical Simulations. Int. J. Climatol 38, e57–e77. doi:10.1002/joc.5351
Hui, P., Tang, J., Wang, S., Niu, X., Zong, P., and Dong, X. (2018b). Climate Change Projections over China Using Regional Climate Models Forced by Two CMIP5 Global Models. Part II: Projections of Future Climate. Int. J. Climatol 38, e78–e94. doi:10.1002/joc.5409
Jiang, Z., Li, W., Xu, J., and Li, L. (2015). Extreme Precipitation Indices over China in CMIP5 Models. Part I: Model Evaluation. J. Clim. 28 (21). doi:10.1175/jcli-d-15-0099.1
Jiang, Z., Tian, Z., Dong, G., Sun, L., Zhang, P., Buonomo, E., et al. (2020). High-Resolution Projections of Mean and Extreme Precipitation over China by Two Regional Climate Models. J. Meteorol. Res. 34 (5), 965–985. doi:10.1007/s13351-020-9208-5
Leng, X., Liu, X., Gao, Y., Liu, Y., Yang, Q., Sun, G., et al. (2020). Drought Assessment of Southwestern China Based on HadGEM2-ES Model under Representative Concentration Pathway 4.5 Scenario. Nat. Hazards 102 (1), 307–334. doi:10.1007/s11069-020-03928-7
Michelangeli, P. A., Vrac, M., and Loukos, H. (2009). Probabilistic Downscaling Approaches: Application to Wind Cumulative Distribution Functions. Geophys. Res. Lett. 36 (11). doi:10.1029/2009GL038401
Pang, G., Wang, X., Chen, D., Yang, M., and Liu, L. (2021). Evaluation of a Climate Simulation over the Yellow River Basin Based on a Regional Climate Model (REMO) within the CORDEX. Atmos. Res. 254. doi:10.1016/j.atmosres.2021.105522
Qin, P., Xie, Z., Zou, J., Liu, S., and Chen, S. (2021). Future Precipitation Extremes in China under Climate Change and Their Physical Quantification Based on a Regional Climate Model and CMIP5 Model Simulations. Adv. Atmos. Sci. doi:10.1007/s00376-020-0141-4
Remedio, A. R., Teichmann, C., Buntemeyer, L., Sieck, K., Weber, T., Rechid, D., et al. (2019). Evaluation of New CORDEX Simulations Using an Updated Köppen–Trewartha Climate Classification. Atmosphere 10 (11). doi:10.3390/atmos10110726
Shi, Y., Wang, G., and Gao, X. (2017). Role of Resolution in Regional Climate Change Projections over China. Clim. Dyn. 51 (5-6), 2375–2396. doi:10.1007/s00382-017-4018-x
Tong, Y., Gao, X., Han, Z., Xu, Y., Xu, Y., and Giorgi, F. (2020). Bias Correction of Temperature and Precipitation over China for RCM Simulations Using the QM and QDM Methods. Clim. Dyn. doi:10.1007/s00382-020-05447-4
Wang, F., Li, T., Xu, Y., and Chen, S. (2012). Inter Comparison of Long Term Simulations of Climate over China by PRECIS and RegCM3. Chin. J. Agrometeorology 33 (02), 159. doi:10.3969/j.issn.1000-6362.2012.02.001
Wang, G., Zhang, Q., Yu, H., Shen, Z., and Sun, P. (2020). Double Increase in Precipitation Extremes across China in a 1.5 °C/2.0 °C Warmer Climate. Sci. Total Environ. 746, 140807. doi:10.1016/j.scitotenv.2020.140807
Wang, J., Fonseca, R. M., Rutledge, K., Martín-Torres, J., and Yu, J. (2019). A Hybrid Statistical-Dynamical Downscaling of Air Temperature over Scandinavia Using the WRF Model. Adv. Atmos. Sci. 37 (1), 57–74. doi:10.1007/s00376-019-9091-0
Wu, J., and Gao, X. (2013). A Gridded Daily Observation Dataset over China Region and Comparison with the Other Datasets. Chin. J. Geophys. 56 (4), 1102–1111. (in Chinese). doi:10.6038/cjg20130406
Wu, W., Liang, Z., and Liu, X. (2018). Projection of the Daily Precipitation Using CDF-T Method at Meteorological Observation Site Scale. Platea Meteorology 37 (03), 796–805. (in Chinese). doi:10.7522/j.issn.1000-0534.2017.00064
Wu, Y., Guo, J., Lin, H., Bai, J., and Wang, X. (2021). Spatiotemporal Patterns of Future Temperature and Precipitation over China Projected by PRECIS under RCPs. Atmos. Res. 249. doi:10.1016/j.atmosres.2020.105303
Xiang-ling, T., Xin, L., and Yanwei, Z. (2020). Estimation of Future Extreme Precipitation Changes in Xinjiang Based on RegCM4.4 Simulations. Nat. Hazards 102 (1), 201–218. doi:10.1007/s11069-020-03920-1
Xu, J., Koldunov, N., Remedio, A. R. C., Sein, D. V., Zhi, X., Jiang, X., et al. (2018). On the Role of Horizontal Resolution over the Tibetan Plateau in the REMO Regional Climate Model. Clim. Dyn. 51 (11-12), 4525–4542. doi:10.1007/s00382-018-4085-7
Xu, J., Zhang, M., Jiang, X., Remedio, C., Sein, A., Dmitry, S., et al. (2016). The Assessment of Surface Air Temperature and Precipitation Simulated by Regional Climate Model REMO over China. Clim. Change Res. 12 (04), 286–293. (in Chinese). doi:10.12006/j.issn.1673-1719.2015.194
Xu, Y., and Richard, J. (2004). Validating PRECIS with ECMWF Reanalysis Data over China. Chin. J. Agrometeorology 25 (01), 5–9. (in Chinese). doi:10.3969/j.issn.1000-6362.2004.01.002
Yang, Y., Tang, J., Xiong, Z., Wang, S., and Yuan, J. (2018). An Intercomparison of Multiple Statistical Downscaling Methods for Daily Precipitation and Temperature over China: Future Climate Projections. Clim. Dyn. 52 (11), 6749–6771. doi:10.1007/s00382-018-4543-2
Yang, Y., Tang, J., Xiong, Z., Wang, S., and Yuan, J. (2019). An Intercomparison of Multiple Statistical Downscaling Methods for Daily Precipitation and Temperature over China: Present Climate Evaluations. Clim. Dyn. 53 (7-8), 4629–4649. doi:10.1007/s00382-019-04809-x
Yu, E., Zhang, R., Jiang, D., Ramstein, G., Zhang, Z., and Sun, J. (2018). High-resolution Simulation of Asian Monsoon Response to Regional Uplift of the Tibetan Plateau with Regional Climate Model Nested with Global Climate Model. Glob. Planet. Change 169, 34–47. doi:10.1016/j.gloplacha.2018.07.002
Yu, K., Hui, P., Zhou, W., and Tang, J. (2019). Evaluation of multi‐RCM High‐resolution Hindcast over the CORDEX East Asia Phase II Region: Mean, Annual Cycle and Interannual Variations. Int. J. Climatol 40 (4), 2134–2152. doi:10.1002/joc.6323
Zhang, L., Xu, Y., Meng, C., Li, X., Liu, H., and Wang, C. (2020a). Comparison of Statistical and Dynamic Downscaling Techniques in Generating High-Resolution Temperatures in China from CMIP5 GCMs. J. Appl. Meteorology Climatology 59 (2), 207–235. doi:10.1175/jamc-d-19-0048.1
Zhang, L., Yang, B., Li, S., Guo, A., and Huo, Z. (2020b). Potential Dry/wet Dynamic in China under RCP Scenarios. Theor. Appl. Climatology 141 (1-2), 443–454. doi:10.1007/s00704-020-03193-5
Zhang, X., Xiong, Z., Zheng, J., and Ge, Q. (2017). High-resolution Precipitation Data Derived from Dynamical Downscaling Using the WRF Model for the Heihe River Basin, Northwest China. Theor. Appl. Climatology 131 (3-4), 1249–1259. doi:10.1007/s00704-017-2052-6
Zhang, Y., Gao, H., and Lammel, G. (2005). Simulation of Monsoon Seasonal Variation of Rehional Climate Model REMO in East Asia. Clim. Environ. Res. (01), 41–55. (in Chinese). doi:10.3969/j.issn.1006-9585.2005.01.004
Keywords: regional climate models, bias correction, extreme precipitation, future climate projections, ensemble projection
Citation: Xie Y, Dong G, Wang Y, Fan D, Tian Z, Tan J, Wu W and Zhang M (2021) High-Resolution Ensemble Projection of Mean and Extreme Precipitation Over China Based on Multiple Bias-Corrected RCM Simulations. Front. Earth Sci. 9:771384. doi: 10.3389/feart.2021.771384
Received: 06 September 2021; Accepted: 29 September 2021;
Published: 18 October 2021.
Edited by:
Gen Li, Hohai University, ChinaReviewed by:
Xuchao Yang, Zhejiang University, ChinaXiong Zhe, Institute of Atmospheric Physics (CAS), China
Copyright © 2021 Xie, Dong, Wang, Fan, Tian, Tan, Wu and Zhang. This is an open-access article distributed under the terms of the Creative Commons Attribution License (CC BY). The use, distribution or reproduction in other forums is permitted, provided the original author(s) and the copyright owner(s) are credited and that the original publication in this journal is cited, in accordance with accepted academic practice. No use, distribution or reproduction is permitted which does not comply with these terms.
*Correspondence: Guangtao Dong, gtdong@163.com; Dongli Fan, fandl@sit.edu.cn
 Ye Xie1
 Guangtao Dong
 Zhan Tian