- 1Hubei Key Laboratory for Heavy Rain Monitoring and Warning Research, Institute of Heavy Rain, China Meteorological Administration, Wuhan, China
- 2Wuhan Meteorological Observatory, Wuhan, China
- 3State Key Laboratory of Numerical Modeling for Atmospheric Sciences and Geophysical Fluid Dynamics, Institute of Atmospheric Physics, Chinese Academy of Sciences, Beijing, China
- 4Plateau Atmosphere and Environment Key Laboratory of Sichuan Province, College of Atmospheric Science, Chengdu University of Information Technology, Chengdu, China
- 5College of Oceanography, Hohai University, Nanjing, China
Both the El Niño-Southern Oscillation (ENSO) and the 11-years solar cycle had been identified as important factors that may influence the wintertime southern China precipitation (SCP). However, the interactions between these two factors remain less noticed. In this study, the combined effects of the ENSO and the solar activity on mid-winter (January) SCP are investigated using observational and reanalysis data. Results suggest that both the ENSO and the solar activity are positively correlated with the SCP, although exhibiting distinct spatial patterns. Under different combinations of the ENSO and solar phases, the SCP anomalies show superposition of these two factors to some extent. Generally, the ENSO-related SCP anomalies tend to be enhanced (disturbed) when the ENSO and the solar activity are in-phase (out-of-phase). But this solar modulation effect appears more clear and significant under cold ENSO (cENSO) phase rather than under warm ENSO (wENSO) phase. Further analysis suggests, during the wENSO phase, solar influences on the Northern Hemisphere circulation are generally weak with little significance. In contrast, during the cENSO phase, the solar effect resembles the positive phase of the Arctic Oscillation but with an evident zonal asymmetric component. Its manifestation over the Asia-Pacific domain features by negative geopotential height anomaly over the West Asia and positive geopotential height anomaly over the East Asian coast, a pattern that is favorable for the SCP, thus causing a significant solar modulation on the cENSO-related precipitation anomalies. Further, the potential physical causes of solar effects on circulation are also discussed. Our results highlight the importance of considering solar cycle phase when ENSO is used to predict the East Asian winter climate.
Introduction
Dominated by the East Asian winter monsoon (EAWM), the winter climate over most part of China is characterized by low temperature and few precipitation owing to the influences of frequent cold surges. However, although winter precipitation accounts for a relatively small fraction of the total annual rainfall, it experiences large year-to-year variability (Zhang et al., 2014; Lu et al., 2017), particularly over the southern China (SC). The weather and climate disasters associated with precipitation anomalies, for example severe rainfall/snowstorms occasionally occur over this region, which can significantly impact agriculture, transportation, and water resources and cause enormous economic losses. For example, in January 2008, extreme freezing rain and snow occurred over the SC resulted in considerable loss of life (Wen et al., 2009). Although these extreme or disastrous winter precipitation events had attracted wide attention, their causes are still not fully understood and require further investigation.
As had been demonstrated by a number of previous studies, the year-to-year variability of the SC precipitation (SCP) in winter can be largely attributed to the tropical sea surface temperature (SST) anomalies, as well as the modes of circulation variability over the mid-to-high latitudes (Liu Y. et al., 2014; Huang et al., 2017). Among these factors, the El Niño-Southern Oscillation (ENSO), which is the most dominant atmosphere–ocean coupled mode on interannual time scale, had been recognized as a very important factor that influences the SCP. The ENSO has a significant positive correlation with the winter SCP. Above (below)-average winter precipitation tends to appear in SC during the El Niño (La Niña) years (Zhou and Wu, 2010). The ENSO impacts the SCP mainly through modulating circulation anomalies over the western North Pacific (WNP). In El Niño/La Niña winter, an anomalous anticyclone/cyclone appears over the WNP region, owing to the ENSO-related SST anomalies. The WNP anticyclone/cyclone then induces anomalous northward/southward flow over the South China Sea and transports more/less water vapor to SC, resulting in increased/decreased precipitation (Zhang et al., 1996; Wang et al., 2000; Chung et al., 2011). Some recent studies had also suggested that the ENSO could modulate the winter SCP by changing the sub-seasonal variation over East Asia (Guo et al., 2021). However, increasing evidence had demonstrated a fluctuating relationship between ENSO and the SCP (Li and Ma, 2012; Chen et al., 2014). Considering ENSO is an important source of SCP seasonal forecast skill, it is of predictive value to identify factors that influence the ENSO-SCP relationship and explore the possible mechanisms (Lu et al., 2017). Many studies had found that the Pacific Decadal Oscillation (PDO), the Atlantic Multidecadal Oscillation, the different spatial patterns of ENSO and even the mid-latitude circulation anomalies, have the potential to modulate the ENSO impacts on SCP (Wang et al., 2008; Geng et al., 2017; Wu and Mao, 2017; Jia et al., 2019; Jiang et al., 2019; He et al., 2020).
The SCP variability can also be potentially affected by natural external forcing factors such as the solar activity (Zhao and Wang, 2014). Solar activity is a non-negligible external forcing factor in the climate system. The 11-years cycle variability of the solar irradiance can affect surface climate through “bottom-up” and “top-down” mechanisms. The “bottom-up” mechanism refers to amplification of the direct total solar irradiance effect at the ocean surface via “wind-evaporation-precipitation” feedback processes (Meehl et al., 2008; Meehl and Arblaster, 2009). While the“top-down”mechanism concerns the variabilities in solar ultraviolet irradiance that produce temperature and circulation perturbations in the upper stratosphere, which are then transferred downward to the surface via the stratosphere-troposphere dynamical coupling process (Haigh, 1994; Ineson et al., 2011). Some studies had provided evidence that the “bottom-up” and the “top-down” mechanisms could act in concert to induce solar signatures in regional climate (Kodera et al., 2016). Notably, a detectable solar influence on East Asian circulation anomalies and hence the SCP during late winter and early spring (January to March) had been recently revealed, which is bridged by the atmospheric dynamical processes in mid-to-high latitudes (Hood et al., 2013; Ma et al., 2019). Recent studies also found that the 11-years solar cycle could also modulate the relationship between the ENSO and the East Asian winter-spring climate (Zhou et al., 2013; Ma et al., 2021). Zhou et al. (2013) found the connection between the ENSO and the EAWM tends to be more robust during low solar activity (LS) years than in high solar activity (HS) years. Correspondingly, the ENSO exerts a more significant influence on SCP in the LS phases, as the correlation between Nino 3.4 index and the SCP are evidently stronger during LS winters than in HS winters. A recent study of Ma et al. (2021) had revealed that there is also a solar cycle modulation upon the ENSO impact on SCP in early spring (February-March). But instead of strength, the major difference of ENSO signal between HS and LS years lies in the spatial distribution of the rainfall pattern. HS/LS tends to shift the ENSO-related precipitation anomaly southward/northward.
Most of these previous studies had focused on the individual impact of the ENSO or the solar activity, as well as the solar modulations on the ENSO teleconnection. However, the combined effects of ENSO and solar activity on East Asian winter climate remain less noticed. As indicated in Ma et al. (2019), although the solar signal in SCP persists through January to March, the February and March signals are relatively weaker. Whereas the strongest and most significant solar signal in SCP occurs in January, which is comparable to the ENSO signal in amplitude. Owing to the important roles of both ENSO and solar activity in modulating precipitation anomalies over SC, and the possibility of nonlinear interactions between these forcing factors, it is hence necessary to study their combined effects on the precipitation anomalies during the mid-winter (January). A better understanding of the interactions between ENSO and solar effects can benefit East Asian winter climate prediction. In the following, the data and methods employed in this study are introduced in Data and Methods. In Results and Discussion, the precipitation anomalies under different combinations of ENSO/solar phases and the circulation causes are analyzed. Finally, a summary of the results are given in Conclusion.
Data and Methods
Data
In this study, we used the monthly land surface precipitation data from the University of Delaware (v5.01), with a horizontal resolution of 0.5°. For the circulation variables, we used the monthly National Centers for Environmental Prediction/National Center for Atmospheric Research (NCEP/NCAR) reanalysis (Kalnay et al., 1996), with a horizontal resolution of 2.5°. The monthly Hadley Centre Sea-ice and Sea-surface Temperature Data Set Version 1 (HadISST1) at 1° resolution are also used in the present study (Rayner et al., 2003). Monthly sunspot numbers (SSN) data set is employed to quantify the solar activity, which is available at http://www.esrl.noaa.gov/psd/gcos_wgsp/Timeseries/SUNSPOT/. The SSN can well represent the variability of total and ultraviolet solar irradiance, both of which are important solar parameters that influence global and regional climate (Gray et al., 2010). In order to characterize the impacts from the major volcanic eruptions, the Northern Hemisphere averaged stratospheric aerosol optical depth (AOD) is used, which can be downloaded from https://data.giss.nasa.gov/modelforce/strataer/. The analysis period of this study is 1948–2016.
Methods
Both the solar activity and the climate variables exhibit inter-decadal variability or long-term trends. As seen in Figure 1A, the SSN shows slightly inter-decadal change and decreasing trend during the past decades. But the primary focus of the present study is the 11-years solar cycle modulation on the interannual relationship between ENSO and circulation/precipitation. For this purpose, in this study, the long-term trend, as well as the inter-decadal (greater than 15 years) component of the SSN/precipitation/SST/circulation had been removed. First, all variables are detrended. Then, they are smoothed using Lanczos low-pass filtering so that only time variations greater than 15 years were retained (Duchon 1979). Note that, a 15 years low-pass filtering requires additional 7 years at the beginning and the end of the time series. For variables that are not available before 1948 or after 2016, we extended the time series by repeating the first or last 7 years of the analysis period. This long-term signal is then subtracted from the original time series to obtain a shorter-period component that we refer to as the interannual-decadal component. After these processes, the potential impacts from the inter-decadal variations on composite analysis can be well eliminated, as in shown in Figures 1B–D for the time series of SSN, ENSO and SCP, these adjusted variables mainly show interannual or decadal variations.
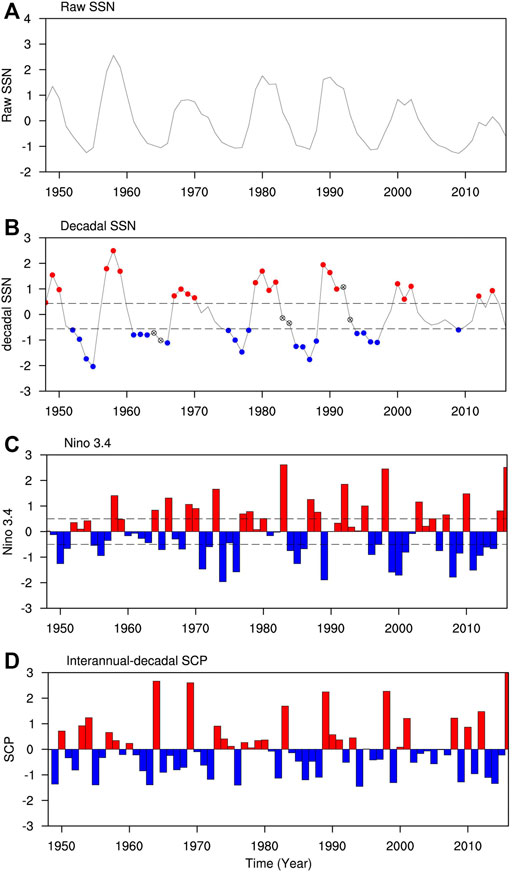
FIGURE 1. (A) shows time series of standardized wintertime original SSN. (B) is the same as (A), but showing interannual-decadal (time scale less than 15 years) component of the SSN, red (blue) dots in (B) denote HS (LS) years, the crosses in (b) represent the years influenced by the major volcanic eruptions. Long dashed lines in (B) show the upper and lower one third of the solar values over the 1948–2016 period. (C) shows the interannual-decadal component of the December-January averaged Niño 3.4 index (unit:°C). (D) shows the interannual-decadal component of the standardized January SCP anomalies (averaged over 110–120°E, 22–35°N).
Composite Analysis
The present study aims to analyze the different ENSO influences under HS and LS phases, respectively. Thus we segregate the climate data into HS and LS group according to the percentiles of the winter mean SSN during 1948–2016. HS (LS) is defined as years with SSN values above (below) the upper (lower) one-third. We divided the ENSO into two phases. The warm/cold ENSO (wENSO/cENSO) phase, corresponds to the El Niño/La Niña events, or El Niño/La Niña state, is defined as the year with December-January mean Niño-3.4 index (averaged SST anomalies over 5°N-5°S, 120°-170°W) higher (lower) than 0.5℃ (−0.5℃). Four groups of composites are divided according to the combinations of the ENSO and the solar activity phases, including the wENSO events under HS years (wENSO/HS), the cENSO events under HS years (cENSO/HS), the wENSO events under LS years (wENSO/LS) and the cENSO events under LS years (cENSO/LS). The corresponding years of each group are listed in Table 1. Notably, several wENSO/cENSO events under HS or LS years coincided with major volcanic eruptions (see Figure 1B). Considering major volcanic eruptions could induce a wENSO-like SST anomalies (e.g., Khodri et al., 2017), thus the 2 years after each volcanic eruption had been removed from the analysis, including 1964, 1965, 1983, 1984, 1992, and 1993. In addition, we also tried to compare the events defined in this study with those in previous studies of the similar topic. For example, Liu Z. et al. (2014) investigated the solar and ENSO impacts on Pacific and North America region. In their study, the cENSO/HS years listed are 1950, 1956, 1968, 1971, 1989, 1999, 2000, 2001. For our analysis period, if the SSN is not filtered to eliminate the inter-decadal component, the cENSO/HS years are 1950, 1956, 1968, 1989, 2000, 2001, very similar with those in Liu Z. et al. (2014). With the inter-decadal component removed by using the Lanczos filtering method, the cENSO/HS years shown in Table 1 become 1950, 1968, 1989, 2000, 2001, 2012, and 2014, still have large overlapping with Liu Z. et al. (2014). Moreover, we had also compared the composites using different definitions, for example the 30 and 40 percentile definition, the results are qualitatively consistent (not shown). For the composite analysis, the climatology period is 1948–2016, the statistical significance is tested using a two-tailed student’s t test.
Multiple Linear Regression
In order to isolate the respective impacts of the ENSO and the solar activity on climate, a multiple linear regression (MLR) method is used in this study. The MLR method had been widely used in the studies regarding the solar-climate linkage. Many studies had demonstrated that it can effectively derive solar or ENSO signal from other sources of climate variability (Lean and Rind 2008; Roy and Haigh 2010; Brugnara et al., 2013; Chen et al., 2015). Follow these studies, a climate variable
The four standardized indices employed in the MLR Eq. 1 are: (1) SSN: the (December-January) DJ mean SSN that represents solar activity; (2) VOLC: the Northern Hemisphere averaged stratospheric AOD in DJ that represents volcanic influences; (3) ENSO: the DJ mean Niño-3.4 index to represent ENSO; and (4) TREND: a linear trend term to roughly represent the anthropogenic forcing.
Results
Respective Impacts of ENSO and Solar Activity on East Asian Winter Climate
Respective ENSO and Solar Signals in Precipitation Anomalies
To compare the features of direct ENSO and solar influences on SCP, in this section, we analyze the ENSO and solar signals in mid-winter (January) precipitation obtained by the MLR method, as are shown in Figures 2A,B, respectively. Figure 2A suggests evident wet (dry) conditions over the SC region during wENSO (cENSO) phase, with most statistically significant signals detected around the coastal regions of the SC. While the solar signal exhibits a region of enhanced precipitation centered over the Yangtze River Valley (YRV) and extending across most of the eastern China.
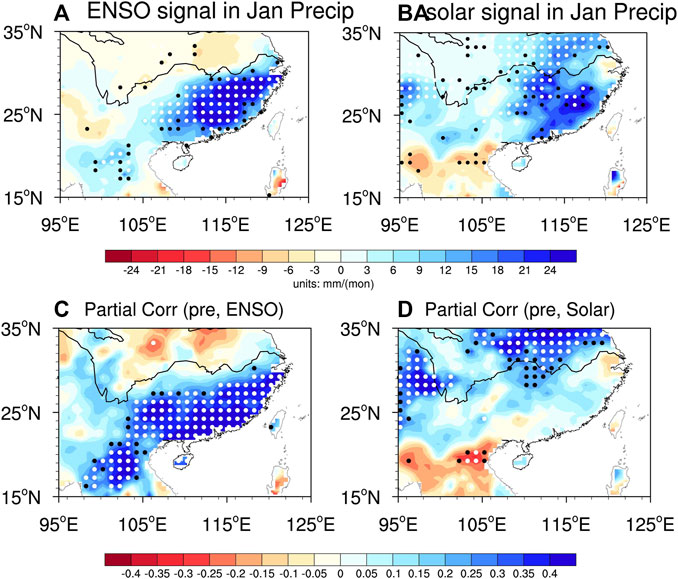
FIGURE 2. The estimated ENSO panel (A) and solar panel (B) signals in the mid-winter (January) precipitation obtained using MLR in Eq. 1 for the period 1948–2016. The ENSO/solar signals are defined as the MLR coefficients of ENSO/SSN multiplied by two standard deviation of the index, thus the units of these signals are mm/mon. panel (C) shows the partial correlation coefficients between the precipitation and the ENSO with solar effect excluded, panel (D) shows the partial correlation coefficients between the precipitation and the solar with ENSO effect excluded. Solid black (white) dots denote regions where the signals are statistically significant at the 10% (5%) level [i.e., p < 0.1 (p < 0.05)].
In addition, partial correlation was also used to investigate the individual relationship of the ENSO and the solar activity with precipitation. When excluding the impact of solar activity, correlation between ENSO and precipitation shows significant positive signals over the southeastern China (Figure 2C), generally consistent with the results from MLR analysis (Figure 2A). Similarly, as shown in Figure 2D, with the ENSO impact excluded, the solar correlation also shows a pattern that is consistent with the MLR analysis. Therefore, the results from partial correlation further confirm the results from the MLR analysis.
Respective ENSO and Solar Impacts on Northern Hemisphere Circulation Anomalies
The differences between the ENSO and the solar patterns of precipitation anomalies are very possibly owing to the different circulation patterns associated with ENSO and solar activity. Therefore, it is necessary to further discuss the respective impacts of ENSO and solar on atmospheric circulation. Figure 3A shows the ENSO signal in January sea level pressure (SLP) anomalies over the Northern Hemisphere obtained using the MLR method. In response to the SST anomalies over the tropical Pacific, massive positive SLP anomalies form over the WNP region, extending from the Philippine Sea to the Kuroshio extension, consistent with the many previous findings (e.g., Wang et al., 2000). This high pressure over the WNP is known to be a key system that bridges the ENSO and the winter SCP anomalies. Anomalous southwesterlies prevail to the northwest of this high pressure, leading to a weaker winter monsoon along the SC coast, as well as a wetter than normal condition in that region. Downstream of this anomalous high pressure is an anomalous low pressure centered around 50°N and 160°W, indicating a deepening of the wintertime Aleutian low. At 500 hPa (Figure 3C), positive geopotential height (GPH) anomalies can be seen throughout the lower latitudes, suggesting an intensified subtropical high, which is favorable for the wintertime precipitation over China. While in the extra-tropics, the most prominent circulation feature is the positive phase of the Pacific/North American (PNA) teleconnection pattern (Barnston and Livezey, 1987).
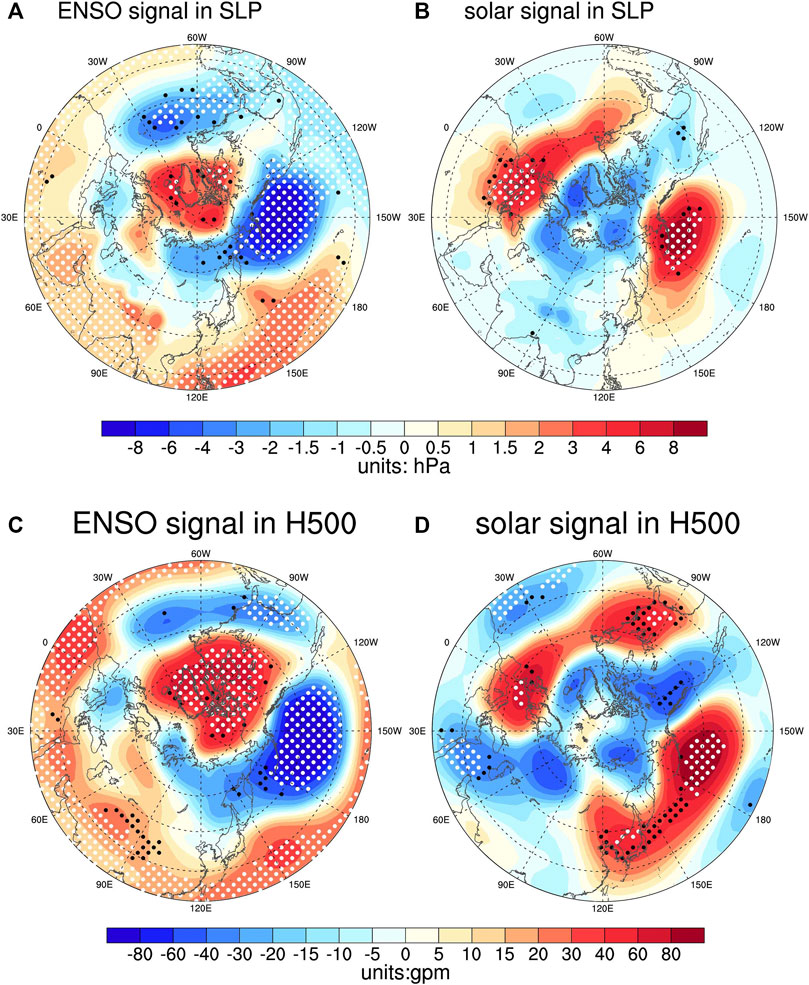
FIGURE 3. Same as Figures 2A,B, but for the estimated ENSO and solar signals in SLP [panels (A), (B), unit:hPa], and 500 hPa geopotential height [panels (C), (D), unit: gpm]. Solid black dots denote regions where the signals are statistically significant at the 5% level (i.e., p < 0.05).
Figure 3B shows the solar signal in SLP anomalies. As is seen, enhanced solar activity is linked with a positive Arctic Oscillation (AO) like pattern over the Northern Hemisphere, with significant positive SLP anomalies detected over the Aleutian low region and the southern Europe, while insignificant negative SLP anomalies are seen in the Arctic regions. The AO-like pattern and the significantly weakened Aleutian low are consistent with many previous findings (e.g., Roy and Haigh 2010; Hood et al., 2013). Despite AO, the solar pattern also shows notable zonal asymmetric feature. At 500 hPa (Figure 3D), the high pressure anomaly over the North Pacific expands more westward, with significant positive GPH anomalies detected around Japan, suggesting a weakening of the East Asian trough. As had been suggested by previous studies (e.g., Zhang et al., 2015), weakened East Asian trough would suppress the cold and dry air from the Siberia, thus favorable for the moisture transport and hence increase the SCP in winter. Moreover, in the upstream, wave train like circulation anomalies prevail over the Atlantic and Eurasian domain. Positive GPH appears over the western Europe, while negative ones exist over mid-lower latitudes of the North Atlantic, as well as the West Asia, projecting onto the East Atlantic/West Russia (EATL/WRUS) pattern. Liu Y. et al. (2014) had demonstrated that the EATL/WRUS pattern could significantly increase the winter SCP. Therefore, the solar associated zonal asymmetric circulation patterns over the Atlantic, Eurasian and North Pacific domain act in concert to produce significant positive SCP anomalies.
In summary, regressions of precipitation and atmospheric circulations upon ENSO and solar indices reveal distinct ENSO and solar impacts on regional climate in mid-winter. ENSO impacts SCP mainly through changing pressure anomalies over the WNP region. While the solar influences SCP primarily via its modulation on the extra-tropical circulation anomalies.
Combined Effects of ENSO and Solar Activity on SCP
In order to investigate the combined effects of the ENSO and the solar activity depending on their different phases, each year has been categorized into four groups (Table 1), i.e., the wENSO/HS years, the wENSO/LS years, the cENSO/HS years and the cENSO/LS years, based on the classification in Section 2. Figures 4A–D show the composites of rainfall anomalies under these four different combinations of ENSO and solar phases. For the wENSO, the rainfall anomalies show notable differences between the HS and the LS phase. Positive January rainfall anomalies appear over most areas of the SC in wENSO/HS years (Figure 4A), with the amplitude exceeding 30 mm/ month around the coastal area of SC. The statistically significant positive signal (90% confidence level) mainly distributes in the provinces of Hunan and Fujian (approximately located at 24°–28°N, 110°–118°E). Thus the rainfall pattern in wENSO/HS years is qualitatively consistent with that in the common wENSO years (as indicated in Figure 2A), featuring a wetter than normal condition over the SC. However, during the wENSO/LS (Figure 4C), the expected wENSO associated wet anomalies are almost missing. Instead, dry anomalies are detected over most of the SC, although with limited statistical significance.
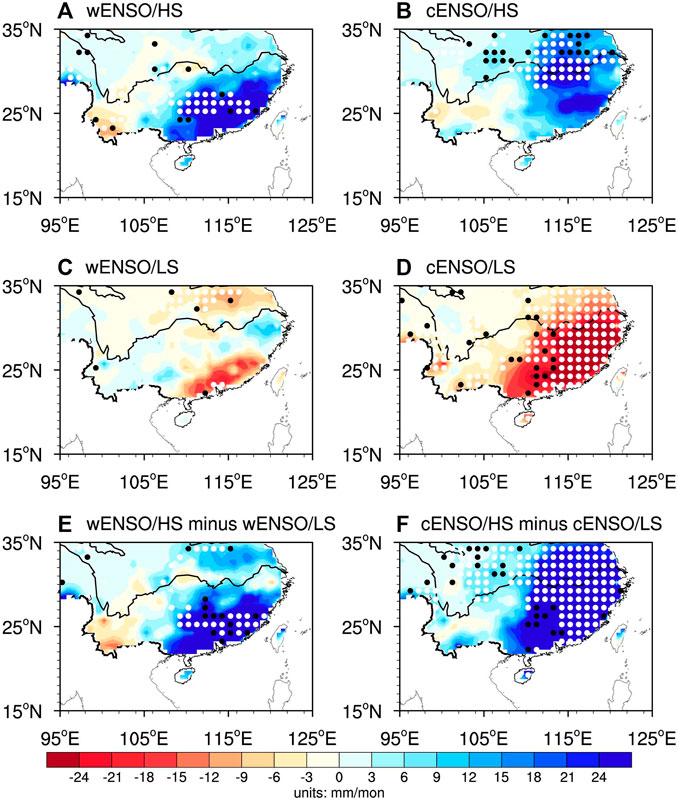
FIGURE 4. Mid-winter (January) precipitation anomaly (mm/mon) composites of (A) wENSO/HS years, (B) cENSO/HS years, (C) wENSO/LS years and (D) cENSO/LS years. (E) denotes composite differences between wENSO/HS and wENSO/LS years. (F) denotes composite differences between wENSO/HS and wENSO/LS years. Solid black (white) dots denote 90% (95%) confidence level. The data used here is monthly land surface precipitation data from the University of Delaware (v5.01) for 1948–2016, with a horizontal resolution of 0.5°.
Similarly, the cENSO associated precipitation anomalies are also very different under different solar phases. Generally, cENSO events correspond to dry anomalies over the SC. However, in cENSO/HS years, positive rainfall anomalies dominate the SC, with statistically significant (exceeding 95% confidence level) signals appear in most areas of the YRV region. While in the cENSO/LS years, the cENSO-related dry anomalies become evident. The rainfall pattern features statistically significant negative anomalies in most areas to the south of the Yangtze River. The negative center exceeds −25 mm/ month, locating at the coastal region of the SC. Therefore, we may conclude that when the ENSO and the solar activity are in phase, i.e., the wENSO/HS years and the cENSO/LS years, the ENSO-related precipitation anomalies are intensified. If they are out of phase, the known ENSO-SCP relationship is disturbed.
To further demonstrate the solar impacts on the ENSO precipitation, Figure 4E shows the rainfall difference between the wENSO/HS years and the wENSO/LS years, while the rainfall difference between the cENSO/HS years and the cENSO/LS years is shown in Figure 4F, the solar modulations on both the wENSO and the cENSO precipitation anomalies can be hence inferred. It is found that there are generally consistent patterns of solar influences on the wENSO and the cENSO associated precipitation anomalies, as both Figures 4E,F show mono-pole pattern of positive rainfall differences over the SC. Notably, as had been indicated in Figure 2B, the solar signal in January precipitation exhibits significant positive anomalies over eastern and southern part of China, the pattern of which bears some resemblance with those in Figures 4E,F. Therefore, to some extent, the solar modulations on wENSO and cENSO rainfall in mid-winter are possibly due to the background of solar signal superimposed onto the ENSO signal.
But we also note that the strength of solar modulation effect seems to be different between the wENSO and the cENSO phase. Seen in Figure 4E, although solar activity tends to increase the wENSO precipitation anomalies, the wENSO/HS minus wENSO/LS rainfall anomalies are mostly statistically insignificant. In contrast, the solar effects are stronger in amplitude and are more statistically significant during cENSO phase, with significant rainfall differences between the cENSO/HS years and the cENSO/LS years detected over most of the SC. Therefore, the solar modulating effects show clear asymmetries in strength between the wENSO and the cENSO events.
To further investigate this, we now focus attention on the area-averaged (110–120°E, 22–35°N) SCP anomalies, chosen because it shows evident precipitation difference between HS and LS under both ENSO phases. Scatter plots of standardized January SCP against DJ Niño-3.4 index are shown in Figure 5A, with the HS and LS years expressed by red and blue markers, respectively. Seen from Figure 5A, the correlation coefficient between the Niño 3.4 index and the SCP is 0.31 (p < 0.05). But the SCP anomalies under both wENSO and cENSO phases still show large spread, indicating other factors (e.g. atmospheric internal variability or external forcings) may also impact the precipitation. For wENSO phase, the average SCP is only slightly higher during HS than during LS, suggesting insignificant solar impact under this case. While for the cENSO phase, the HS and LS precipitation anomalies are quite distinguishable, as most cENSO/HS years have positive SCP anomalies while most cENSO/LS years have negative values. Thus solar forcing seems to play an important role under cENSO condition. These results are quite consistent with those derived from the composite analysis, also suggesting solar activity exerts different influences on wENSO and cENSO events. To further demonstrate this, Figures 5B,C show scatter plots of SCP against SSN under wENSO and cENSO years, respectively. The correlation between SCP and SSN is 0.11 and 0.59 (p < 0.01) for the two ENSO phases, respectively. Thus the solar impact on SCP is much stronger under cENSO than in wENSO, which confirms the results of Figures 4E,F.
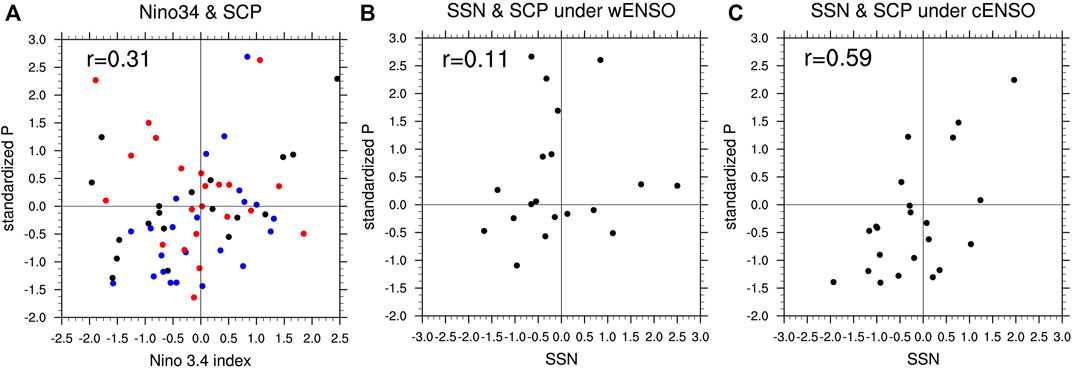
FIGURE 5. panel (A) shows scatter plot of standardized precipitation anomalies against Niño 3.4 index. Red (blue) dots denote HS (LS) phase, respectively. panels (B), (C) show scatter plots of standardized precipitation anomalies against SSN under wENSO and cENSO phase, respectively.
Possible Causes of the ENSO and Solar Combined Effects on SCP
How can we understand these combined solar/ENSO effects on precipitation? To investigate this, Figures 6A–F depict the composite SLP anomalies over the Northern Hemisphere in different ENSO/solar phase combinations, while Figures 7A–F are the same as Figures 6A–F, but displaying GPH anomalies at 500 hPa. At mid-high latitudes, both wENSO/HS and wENSO/LS years show a pattern that resembles the negative phase of the AO, possibly due to the tropical SST forcing on the polar vortex (Bell et al., 2009). Over the North Pacific, significant low pressure anomalies are seen at both surface and 500 hPa, reflecting the wENSO impacts on the Aleutian low and the PNA pattern, respectively. However, over East Asia, very few statistical significant circulation signals can be detected, except for the wENSO/LS case at 500 hPa. The wENSO/HS minus wENSO/LS circulation over this region exhibits a barotropical structure (consistent pattern at surface and 500 hPa), with positive pressure anomaly over northern East Asia and negative one over southern East Asia, but these anomalies are also with little significance. Considering the limited sample sizes of the wENSO/HS and wENSO/LS years may introduce uncertainties to the composite results, in Figures 6G, 7G the regression of circulation anomalies onto the solar index (i.e., SSN) under wENSO are shown as supplements to the composite analysis. The regression patterns, generally similar to the composite differences, show weak and insignificant solar influences on atmospheric circulation under wENSO phase. Therefore, it’s reasonable to see a relatively weak and statistically insignificant solar impact on SCP under wENSO.
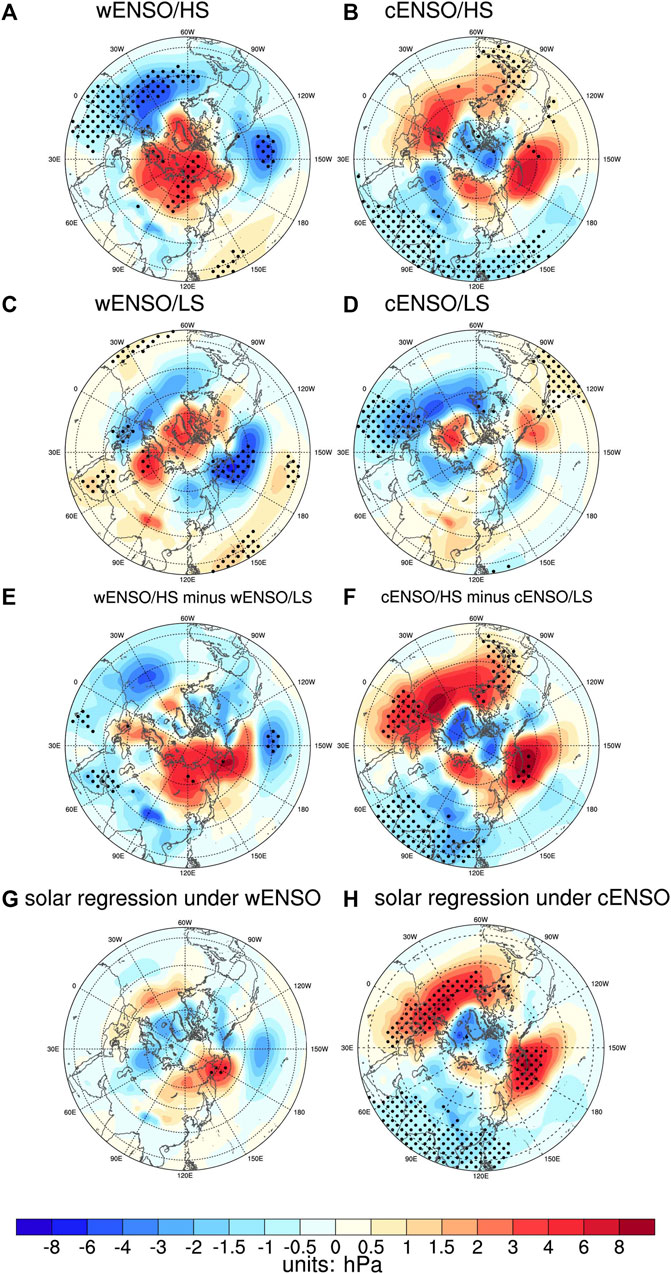
FIGURE 6. panels (A–F) are similar as Figure 4, but for composites of SLP anomaly (unit:hPa), panels (G), (H) show regression of SLP onto SSN under wENSO and cENSO phase, respectively. The regression coefficients are scaled as by multiplying two standard deviation of the SSN index, thus the units of these signals are hPa. Solid dots denote 95% confidence level.
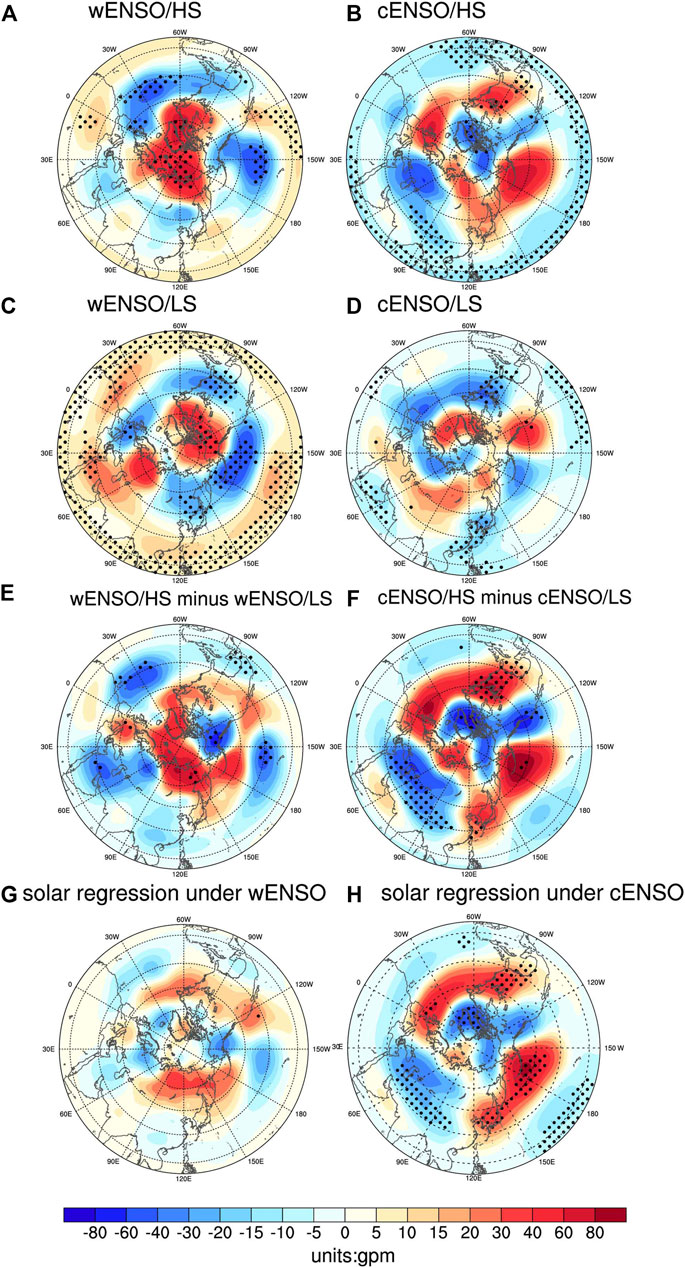
FIGURE 7. Similar as Figure 6, but for composites of geopotential height anomaly at 500 hPa (unit:gpm).
By contrast, the solar modulations on cENSO associated circulation patterns seem to be more clear and evident. In cENSO/HS years, significant negative SLP anomalies are seen in the tropical western Pacific and the Indian Ocean, reflecting a strengthened Walker Circulation associated with cENSO SST anomalies. In the extra-tropics, high pressure anomaly exists over the Aleutian region while low pressure anomaly occupies the Asian continent. Although these pressure systems show limited significance in most regions possibly due to the small sample sizes, we noted a statistically significant low GPH anomaly extending from the Tibet Plateau to Indochina Peninsula at 500 hPa, indicating the strengthening of the southern branch trough. This circulation system had been shown to closely related to the wintertime SCP (Li et al., 2017), which is able to explain the significant positive SCP under cENSO/HS.
The Asia-Pacific circulation patterns are almost reversed in the cENSO/LS years. Positive SLP anomaly is seen over the Asian continent while negative one located in the Aleutian region. Although these circulation anomalies at the surface are with little significance, significant negative GPH anomalies are detected over the East Asian coast at 500 hPa, indicative of an intensified East Asian trough. A deepened East Asian trough usually corresponds to a stronger cold air outbreaks over China, thus can provide reasonable explanation for the significant negative SCP anomalies shown in Figure 4D. As indicated by Figures 6F, 7F, the solar effect on circulation during cENSO resembles the positive phase of AO, similar with the MLR derived solar pattern shown in Figures 3B,D. The regressions of circulation onto SSN under cENSO are shown in Figures 6H, 7H. The derived patterns are similar with the composite difference patterns, showing a tendency towards positive AO under HS, but with much more statistical significance possibly because the sample size is larger. At the surface, significant positive SLP signals exist in both the Aleutian region and the Azores region. In addition, the SSN-AO correlation reaches 0.56 (p < 0.01) under cENSO phase, whereas it drops to near zero under wENSO phase.
Albeit the solar signal under cENSO phase resembles the AO pattern, it also exhibits evident zonal asymmetric component. Over the Asia-Pacific region, the GPH at 500 hPa is significantly increased over the East Asian coast and the North Pacific while significantly decreased over the Asian continent. In order to identify the circulation pattern favorable for the SCP, Figure 8A shows composite of 500 hPa GPH between high and low SCP years. It is found that enhanced SCP is associated with negative GPH anomaly over central-western part of Asia while positive anomaly around Japan, appearing as a “West Low East High (WLEH)” pattern. The WLEH pattern corresponds to a weakened East Asian trough, as well as an intensified trough over the West Asia, which would enhance the southerly along the East Asian coast and thus favoring the SCP. The solar pattern in Figure 7H also resembles WLEH pattern over the Asia-Pacific region, suggesting solar may modulate SCP through exerting a WLEH-like circulation pattern during cENSO. To further demonstrate this, we define a WLEH index (WLEHI) as 500 hPa GPH difference between 120–150°E, 30–40°N and 30–90°E, 22–35°N. The WLEHI is significantly correlated with the SCP (r = 0.55, p < 0.01) when all years in the analysis period are used, demonstrating its important role in the SCP variability. The correlation between SSN and WLEHI is 0.15 (p > 0.1) under wENSO and 0.54 (p < 0.01) under cENSO, thus the WLEH pattern seems to bridge the solar activity and the SCP during cENSO.
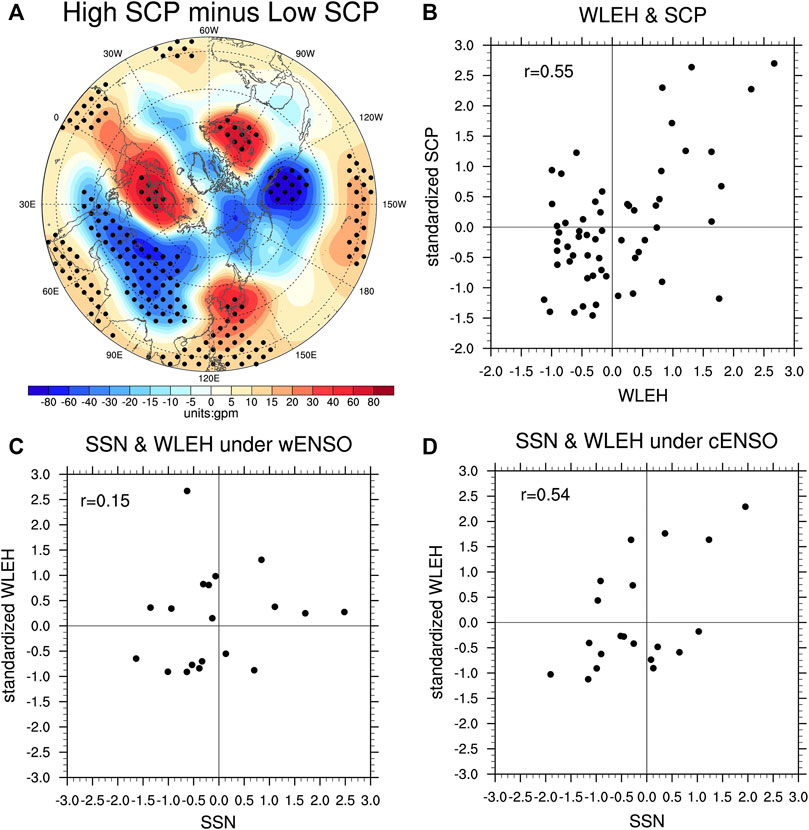
FIGURE 8. panel (A) shows composite differences of geopotential height anomalies between high and low SCP years. Solid dots denote 95% confidence level. High and low SCP years are defined as years with SCP values larger (lower) than +1 (−1) standard deviation. panel (B) shows scatter plot of standardized precipitation anomalies against WLEH index. panels (C), (D) show WLEH index against SSN under wENSO and cENSO phase, respectively.
Discussion
The above analysis interprets the direct causes of ENSO and solar combination effects on SCP from the perspective of atmospheric circulation anomalies. It is found that the solar effects on circulation are much stronger in cENSO phase than in wENSO phase, thus causing a stronger and more significant solar modulations of SCP in cENSO. However, several relevant mechanisms are still not well understood and require further discussions. These issues are as follows.
How Does Solar Activity Affect the Wintertime Extra-tropical circulation Anomalies?
Previous studies had noted solar influences in Northern Hemisphere winter circulation. Many of them pointed to a surface response over the extra-tropical regions that bears some resemblance to the AO/NAO pattern (Kodera and Kuroda, 2002; Woollings et al., 2010; Chen et al., 2015). However, the statistical significant signals are mostly found over the Aleutian low region rather than the Arctic region (e.g. Hood et al., 2013). These features revealed in the previous literature can be well reproduced in Figures 3B,D of the present study. The stratosphere provides a key link for solar irradiance variations to interact with the AO/NAO like circulation pattern. In HS years, the enhanced solar UV irradiance can intensify stratospheric zonal winds by affecting the amount of ozone and radiative heating in the mesosphere and the stratosphere. Then the solar-related stratospheric zonal wind anomalies would propagate downward to the surface through wave-mean flow interaction, ultimately impact the phase of the AO/NAO. The above mentioned process is known as the “top-down” mechanism. It is well established and had been demonstrated by a number of modelling studies (Haigh, 1994; Ineson et al., 2011). However, the solar signals are usually not quite strong in amplitude, with an order of approximately 3-4 hPa in each node of the AO/NAO (Gray et al., 2016). Due to the presence of strong internal noises, the derived solar signal is non-stationary and statistically insignificant over the Arctic regions. Instead, robust and significant signal appears at the mid-latitudes, particularly over the North Pacific region. In addition, the feedback from the Pacific and North Atlantic SST anomalies may also act to reinforce and reshape the solar pattern, giving rise to some zonal asymmetric features, including the North Pacific high pressure anomaly and the EATL/WRUS pattern (Brugnara et al., 2013; Hood et al., 2013; Chen et al., 2015).
As revealed in In Sect. 3.3, solar signal in NH circulation depends on the phase of ENSO. The circulation responses to solar activity are relatively weaker and insignificant under wENSO while stronger and significant under cENSO. These asymmetric solar signals in circulation are crucial for the different solar effects on SCP under different ENSO phases. To date, the underlying physical mechanisms remains unclear. Notably, the findings in a recent study of Guttu et al. (2021) provided insight on this issue. They found the “top-down” solar forcing be enhanced (suppressed) under negative (positive) phase of the PDO. Through modulating planetary wave activities, the SST anomalies in negative PDO phase favor negative meridional heatflux at upper troposphere and lower stratosphere, which amplifies the Arctic cooling and intensifies the polar vortex, and hence strengthen the solar-induced AO-like circulation pattern. It is known that the ENSO and PDO SST patterns are very similar, the cENSO can also modulate the upward planetary wave activities and strengthen the polar vortex (Bell et al., 2009). Therefore, the ENSO state may also modulate the “top-down” solar forcing through changing the background state as the PDO does.
Does Solar Modulation on ENSO-Related SST Anomalies Play a Role in SCP Anomalies?
Considering the ENSO could influence the East Asian climate by a teleconnection between tropics and extra-tropics (e.g., Liu and Zhu, 2019), thus an “oceanic pathway” mechanism of the solar effect is also possible, in which the distinct ENSO-related SST patterns between HS and LS hold a key. To verify this, the composites of the ENSO associated SST anomalies under different solar phases are displayed in Figure 8. In both HS and LS, the typical ENSO features over the tropical Pacific are evident, with positive (negative) SST anomalies in equatorial central-eastern Pacific and negative (positive) SSTAs in WNP during wENSO (cENSO) events (Figures 9A–D). But differences in SST distributions between the HS and LS years can be noted (Figures 9E,F). Both the SST differences between wENSO/HS years and the wENSO/LS years, and the SST differences between cENSO/HS years and the cENSO/LS years exhibit central-eastern Pacific cooling. In response to such SST anomalies, the zonal gradient of anomalous SLP in the tropical Indo-Pacific Ocean is stronger in the wENSO/LS group than the wENSO/HS one (Figure 6E), whereas the tropical circulation anomalies in the cENSO/HS category are more evident than the cENSO/LS one (Figure 6F). However, we found these solar modulations on ENSO SSTs over tropics unable to explain the observed SCP anomalies. Take the solar influences on cENSO as an example, HS tends to intensified the cENSO associated eastern Pacific cooling and the Walker Circulation, although not quite significantly. As is known, in winter, eastern Pacific cooling and intensified Walker Circulation usually corresponds to an enhanced EAWM and decreased SCP. However, significant increased SCP is seen in cENSO/HS years (Figure 4B).
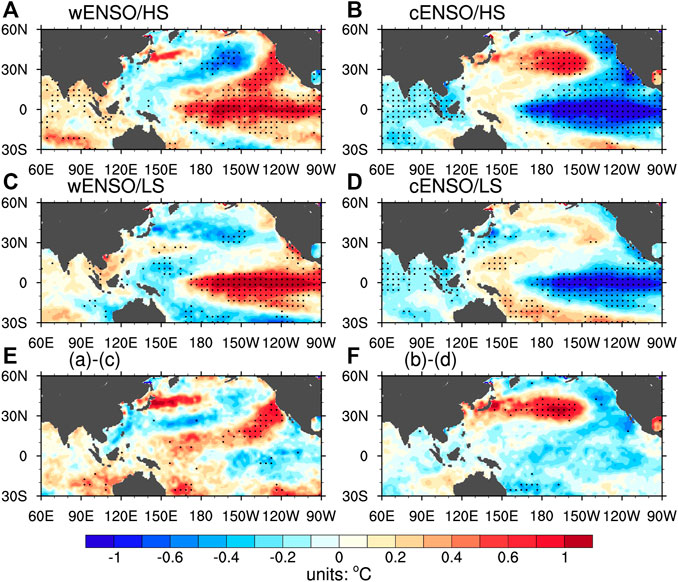
FIGURE 9. Same as Figure 4, but for composites of SST anomaly (shaded, unit:°C). Solid dots denote 95% confidence level for SST.
On the other hand, the SSTs over the mid-latitudes of the North Pacific Ocean may play a role in atmospheric circulation anomalies, since this region is situated at the confluence of warm and cold currents near 40°N, A hot spot region of climate variability. The common wintertime atmospheric responses to the mid-latitude Pacific SST anomalies tend to be an equivalent barotropic structure in the presence of transient eddy forcing, i.e., an anomalous atmospheric ridge over the negative (positive) mid-latitude SST anomalies (e.g., Fang and Yang, 2016). As shown in Figure 9F, the most significant SST differences between HS and LS years emerge in the mid-latitudes of the North Pacific under cENSO condition, which would exert a positive feedback onto the positive SLP/GPH anomalies over the North Pacific. Therefore, it is also possible that solar may modulate the cENSO associated climate effects through mid-latitude air-sea interactions.
Conclusion
Most previous studies had focused on the individual impact of the ENSO or the solar activity on SCP. However, the interactions between the impacts of these two factors remain less noticed. In the present study, the combined effects of the ENSO and the solar activity on SCP in mid-winter are investigated using observed precipitation and the NCEP/NCAR reanalysis data sets. Before analyzing the combined effects, the individual effects of the ENSO and the solar activity on East Asian climate are first examined. Results suggest both the ENSO and the solar activity are positively correlated with the SCP, but with slightly different spatial patterns. The influence of ENSO on mid-winter rainfall is mainly manifested in coastal region of the SC, whereas the solar activity tends to exert stronger influence on rainfall anomaly in the YRV region, generally consistent with the previous findings. Circulation analysis suggests the ENSO impacts China precipitation mainly through changing circulation anomalies over the WNP region. While the solar influence on precipitation is via its modulation on circulation anomalies over the mid-latitudes.
Under different combinations of the ENSO and solar phases, the SCP anomalies show superposition of these two factors to some extent. Generally, the ENSO-related SCP anomalies tend to be enhanced (disturbed) when the ENSO and the solar activity are in-phase (out-of-phase). But this solar modulation effect appears more clear and significant under cold ENSO (cENSO) phase rather than under warm ENSO (wENSO) phase. Further analysis suggests, during the wENSO phase, solar influences on the Northern Hemisphere circulation are generally weak with little significance. In contrast, during the cENSO phase, the solar effect resembles the positive phase of the Arctic Oscillation but with an evident zonal asymmetric component. Its manifestation over the Asia-Pacific domain features by negative geopotential height anomaly over the West Asia and positive geopotential height anomaly over the East Asian coast, a pattern that is favorable for the SCP, thus causing a significant solar modulation on the cENSO-related precipitation anomalies.
The potential physical causes of solar effects on circulation are also discussed. In mid-winter, the solar activity tends to produce an AO-like response pattern through the “top-down” mechanism, which involves stratosphere-troposphere dynamical coupling that conveys the stratospheric solar signals downward to the surface. But the strength of this solar signature depends on the phase of ENSO, it appears to be stronger and more significant during the cENSO phase. It is possibly because the phase of ENSO could modify the mean state in stratosphere and troposphere that may modulate the “top-down” solar forcing. On the other hand, the solar modulation on cENSO SST anomalies over mid-latitudes may also play a role, which exerts positive feedback onto the circulation anomalies and act to reinforce the solar signature. As a result, the solar effect on SCP is more evident under cENSO phase. Future research using a fully coupled high resolution climate model is needed to study the detailed physical mechanisms of these modulation effects.
Data Availability Statement
Publicly available datasets were analyzed in this study. This data can be found here: We acknowledge the National Centers for Environmental Prediction/National Center for Atmospheric Research (NCEP/NCAR) for providing NCEP/NCAR reanalysis, available at https://psl.noaa.gov/data/reanalysis/reanalysis.shtml.
Author Contributions
RW, HM, ZX, and XL contributed to conception and design of the study. YG and CG organized the database. XNL and XAL performed the statistical analysis. RW wrote the first draft of the manuscript. ZX, HM, and XNL wrote sections of the manuscript. All authors contributed to manuscript revision, read, and approved the submitted version.
Funding
This study was jointly supported by the National Key R&D Program of China (No. 2018YFC1507201), the Central Asia Atmospheric Science Program (No. CAAS202002), the National Natural Science Foundation of China (grants 41905080, 41905065 and 41905054) and the Shanghai Sailing Program (No. 19YF1443800).
Conflict of Interest
The authors declare that the research was conducted in the absence of any commercial or financial relationships that could be construed as a potential conflict of interest.
Publisher’s Note
All claims expressed in this article are solely those of the authors and do not necessarily represent those of their affiliated organizations, or those of the publisher, the editors and the reviewers. Any product that may be evaluated in this article, or claim that may be made by its manufacturer, is not guaranteed or endorsed by the publisher.
Acknowledgments
We acknowledge the University of Delaware for providing the UDEL precipitation data.
References
Barnston, A. G., and Livezey, R. E. (1987). Classification, Seasonality and Persistence of Low-Frequency Atmospheric Circulation Patterns. Mon. Wea. Rev. 115, 1083–1126. doi:10.1175/1520-0493(1987)115<1083:csapol>2.0.co;2
Bell, C. J., Gray, L. J., Charlton-Perez, A. J., Joshi, M. M., and Scaife, A. A. (2009). Stratospheric Communication of El Niño Teleconnections to European Winter. J. Clim. 22, 4083–4096. doi:10.1175/2009JCLI2717.1
Brugnara, Y., Brönnimann, S., Luterbacher, J., and Rozanov, E. (2013). Influence of the sunspot Cycle on the Northern Hemisphere Wintertime Circulation from Long Upper-Air Data Sets. Atmos. Chem. Phys. 13, 6275–6288. doi:10.5194/acp-13-6275-2013
Chen, H., Ma, H., Li, X., and Sun, S. (2015). Solar Influences on Spatial Patterns of Eurasian winter Temperature and Atmospheric General Circulation Anomalies. J. Geophys. Res. Atmos. 120, 8642–8657. doi:10.1002/2015JD023415
Chen, J., Wen, Z., Wu, R., Chen, Z., and Zhao, P. (2014). Interdecadal Changes in the Relationship between Southern China winter-spring Precipitation and ENSO. Clim. Dyn. 43, 1327–1338. doi:10.1007/s00382-013-1947-x
Chen, M., Xie, P., Janowiak, J. E., and Arkin, P. A. (2002). Global Land Precipitation: A 50-yr Monthly Analysis Based on Gauge Observations. J. Hydrometeor 3, 249–266. doi:10.1175/1525-7541(2002)003<0249:glpaym>2.0.co;2
Chung, P.-H., Sui, C.-H., and Li, T. (2011). Interannual Relationships between the Tropical Sea Surface Temperature and Summertime Subtropical Anticyclone over the Western North Pacific. J. Geophys. Res. 116, D13111. doi:10.1029/2010JD015554
Duchon, C. E. (1979). Lanczos Filtering in One and Two Dimensions. J. Appl. Meteorol. 18, 1016–1022. doi:10.1175/1520-0450(1979)018<1016:lfioat>2.0.co;2
Fang, J., and Yang, X.-Q. (2016). Structure and Dynamics of Decadal Anomalies in the Wintertime Midlatitude North Pacific Ocean-Atmosphere System. Clim. Dyn. 47, 1989–2007. doi:10.1007/s00382-015-2946-x
Geng, X., Zhang, W., Stuecker, M. F., Liu, P., Jin, F.-F., and Tan, G. (2017). Decadal Modulation of the ENSO-East Asian winter Monsoon Relationship by the Atlantic Multidecadal Oscillation. Clim. Dyn. 49, 2531–2544. doi:10.1007/s00382-016-3465-0
Gray, L. J., Beer, J., Geller, M., Haigh, J. D., Lockwood, M., Matthes, K., et al. (2010). Solar Influences on Climate. Rev. Geophys. 48, RG4001. doi:10.1029/2009RG000282
Gray, L. J., Woollings, T. J., Andrews, M., and Knight, J. (2016). Eleven-year Solar Cycle Signal in the NAO and Atlantic/European Blocking. Q.J.R. Meteorol. Soc. 142, 1890–1903. doi:10.1002/qj.2782
Guo, L., Zhu, C., and Liu, B. (2021). Regulation of the Subseasonal Variability of winter Rainfall in South China by the Diversity of El Niño Southern Oscillation. Clim. Dyn. 56, 1919–1936. doi:10.1007/s00382-020-05565-z
Guttu, S., Orsolini, Y., Stordal, F., Otteraa, O. H., and Omrani, N.-E. (2021). The 11-year Solar Cycle UV Irradiance Effect and its Dependency on the Pacific Decadal Oscillation. Environ. Res. Lett. 16, 064030. doi:10.1088/1748-9326/abfe8b
Haigh, J. D. (1994). The Role of Stratospheric Ozone in Modulating the Solar Radiative Forcing of Climate. Nature 370, 544–546. doi:10.1038/370544a0
He, D., Zhou, Z., Kang, Z., and Xu, G. (2020). Variational Method Study to Correct the Forecast Error of GRAPES Model. Torrential Rain and Disasters 39, 392–399. in Chinese.
Hood, L., Schimanke, S., Spangehl, T., Bal, S., and Cubasch, U. (2013). The Surface Climate Response to 11-yr Solar Forcing during Northern winter: Observational Analyses and Comparisons with GCM Simulations. J. Clim. 26, 7489–7506. doi:10.1175/JCLI-D-12-00843.1
Huang, D., Dai, A., Zhu, J., Zhang, Y., and Kuang, X. (2017). Recent winter Precipitation Changes over Eastern China in Different Warming Periods and the Associated East Asian Jets and Oceanic Conditions. J. Clim. 30, 4443–4462. doi:10.1175/JCLI-D-16-0517.1
Huo, W., and Xiao, Z. (2017). Modulations of Solar Activity on El Niño Modoki and Possible Mechanisms. J. Atmos. Solar-Terrestrial Phys. 160, 34–47. doi:10.1016/j.jastp.2017.05.008
Ineson, S., Scaife, A. A., Knight, J. R., Manners, J. C., Dunstone, N. J., Gray, L. J., et al. (2011). Solar Forcing of winter Climate Variability in the Northern Hemisphere. Nat. Geosci 4, 753–757. doi:10.1038/ngeo1282
Jia, X., You, Y., Wu, R., and Yang, Y. (2019). Interdecadal Changes in the Dominant Modes of the Interannual Variation of Spring Precipitation over China in the Mid‐1980s. J. Geophys. Res. Atmos. 124, 10676–10695. doi:10.1029/2019JD030901
Jiang, F., Zhang, W., Geng, X., Stuecker, M. F., and Liu, C. (2019). Impacts of Central Pacific El Niño on Southern China Spring Precipitation Controlled by its Longitudinal Position. J. Clim. 32, 7823–7836. doi:10.1175/JCLI-D-19-0266.1
Kalnay, E., Kanamitsu, M., Kistler, R., Collins, W., Deaven, D., Gandin, L., et al. (1996). The NCEP/NCAR 40-year Reanalysis Project. Bull. Amer. Meteorol. Soc. 77, 437–471. doi:10.1175/1520-0477(1996)077<0437:tnyrp>2.0.co;2
Khodri, M., Izumo, T., Vialard, J., Janicot, S., Cassou, C., Lengaigne, M., et al. (2017). Tropical Explosive Volcanic Eruptions Can Trigger El Niño by Cooling Tropical Africa. Nat. Commun. 8, 1–13. doi:10.1038/s41467-017-00755-6
Kodera, K., and Kuroda, Y. (2002). Dynamical Response to the Solar Cycle. J.‐Geophys.‐Res. 107, ACL-5. doi:10.1029/2002JD002224
Kodera, K., Thiéblemont, R., Yukimoto, S., and Matthes, K. (2016). How Can We Understand the Global Distribution of the Solar Cycle Signal on the Earth's Surface. Atmos. Chem. Phys. 16, 12925–12944. doi:10.5194/acp-16-12925-2016
Lean, J. L., and Rind, D. H. (2008). How Natural and Anthropogenic Influences Alter Global and Regional Surface Temperatures: 1889 to 2006. Geophys. Res. Lett. 35, L18701. doi:10.1029/2008gl034864
Li, C., and Ma, H. (2012). Relationship between ENSO and winter Rainfall over Southeast China and its Decadal Variability. Adv. Atmos. Sci. 29, 1129–1141. doi:10.1007/s00376-012-1248-z
Li, X., Chen, Y. D., and Zhou, W. (2017). Response of winter Moisture Circulation to the India-Burma Trough and its Modulation by the South Asian Waveguide. J. Clim. 30, 1197–1210. doi:10.1175/JCLI-D-16-0111.1
Liu, B., and Zhu, C. (2019). Weak Linkage of winter Surface Air Temperature over Northeast Asia with East Asian winter Monsoon during 1993-2003. Clim. Dyn. 53, 6107–6124. doi:10.1007/s00382-019-04915-w
Liu, Y., Wang, L., Zhou, W., and Chen, W. (2014a). Three Eurasian Teleconnection Patterns: Spatial Structures, Temporal Variability, and Associated winter Climate Anomalies. Clim. Dyn. 42, 2817–2839. doi:10.1007/s00382-014-2163-z
Liu, Z., Yoshimura, K., Buenning, N. H., and He, X. (2014b). Solar Cycle Modulation of the Pacific-North American Teleconnection Influence on North American winter Climate. Environ. Res. Lett. 9, 024004. doi:10.1088/1748-9326/9/2/024004
Lu, B., Scaife, A. A., Dunstone, N., Smith, D., Ren, H.-L., Liu, Y., et al. (2017). Skillful Seasonal Predictions of winter Precipitation over Southern China. Environ. Res. Lett. 12, 074021. doi:10.1088/1748-9326/aa739a
Ma, H., Chen, H., Lai, A., Li, X., Wang, R., and Gao, C. (2019). Robust Solar Signature in Late winter Precipitation over Southern China. Geophys. Res. Lett. 46, 9940–9948. doi:10.1029/2019GL084083
Ma, H., Wang, R., Lai, A., Li, X., Wang, F., Zhou, Z., et al. (2021). Solar Activity Modulates the El Niño‐Southern Oscillation‐induced Precipitation Anomalies over Southern China in Early spring. Int. J. Climatol. doi:10.1002/joc.7214
Meehl, G. A., and Arblaster, J. M. (2009). A Lagged Warm Event-like Response to Peaks in Solar Forcing in the Pacific Region. J. Clim. 22, 3647–3660. doi:10.1175/2009JCLI2619.1
Meehl, G. A., Arblaster, J. M., Branstator, G., and Van Loon, H. (2008). A Coupled Air-Sea Response Mechanism to Solar Forcing in the Pacific Region. J. Clim. 21, 2883–2897. doi:10.1175/2007JCLI1776.1
Rayner, N. A., Parker, D., Horton, E., Folland, C., Alexander, L., Rowell, D., et al. (2003). Global Analyses of Sea Surface Temperature, Sea Ice, and Night marine Air Temperature since the Late Nineteenth century. J. Geophys. Res. 108, 4407. doi:10.1029/2002JD002670
Roy, I., and Haigh, J. D. (2010). Solar Cycle Signals in Sea Level Pressure and Sea Surface Temperature. Atmos. Chem. Phys. 10, 3147–3153. doi:10.5194/acp-10-3147-2010
Wang, B., Wu, R., and Fu, X. (2000). Pacific-east Asian Teleconnection: How Does ENSO Affect East Asian Climate. J. Clim. 13, 1517–1536. doi:10.1175/1520-0442(2000)013<1517:peathd>2.0.co;2
Wang, L., Chen, W., and Huang, R. (2008). Interdecadal Modulation of PDO on the Impact of ENSO on the East Asian winter Monsoon. Geophys. Res. Lett. 35, L20702. doi:10.1029/2008GL035287
Wen, M., Yang, S., Kumar, A., and Zhang, P. (2009). An Analysis of the Large-Scale Climate Anomalies Associated with the Snowstorms Affecting China in January 2008. Mon. Wea. Rev. 137, 1111–1131. doi:10.1175/2008MWR2638.1
Woollings, T., Lockwood, M., Masato, G., Bell, C., and Gray, L. (2010). Enhanced Signature of Solar Variability in Eurasian winter Climate. Geophys. Res. Lett. 37, a–n. doi:10.1029/2010GL044601
Wu, X., and Mao, J. (2016). Interdecadal Modulation of ENSO-Related spring Rainfall over South China by the Pacific Decadal Oscillation. Clim. Dyn. 47, 3203–3220. doi:10.1007/s00382-016-3021-y
Zhang, L., Fraedrich, K., Zhu, X., Sielmann, F., and Zhi, X. (2015). Interannual Variability of winter Precipitation in Southeast China. Theor. Appl. Climatology 119 (1), 229–238. doi:10.1007/s00704-014-1111-5
Zhang, L., Zhu, X., Fraedrich, K., Sielmann, F., and Zhi, X. (2014). Interdecadal Variability of winter Precipitation in Southeast China. Clim. Dyn. 43, 2239–2248. doi:10.1007/s00382-014-2048-1
Zhang, R., Sumi, A., and Kimoto, M. (1996). Impact of El Niño on the East Asian Monsoon. J. Meteorol. Soc. Jpn. 74, 49–62. doi:10.2151/jmsj1965.74.1_49
Zhao, L., and Wang, J.-S. (2014). Robust Response of the East Asian Monsoon Rainband to Solar Variability. J. Clim. 27, 3043–3051. doi:10.1175/JCLI-D-13-00482.1
Zhou, L.-T., and Wu, R. (2010). Respective Impacts of the East Asian winter Monsoon and ENSO on winter Rainfall in China. J. Geophys. Res. 115, D02107. doi:10.1029/2009JD012502
Keywords: solar activity, El Niño-Southern Oscillation, southern China precipitation, East Asian winter monsoon, sea surface temperature
Citation: Wang R, Ma H, Xiao Z, Li X, Gao C, Gao Y, Lai A and Li X (2021) The Combined Effects of ENSO and Solar Activity on Mid-Winter Precipitation Anomalies Over Southern China. Front. Earth Sci. 9:771234. doi: 10.3389/feart.2021.771234
Received: 06 September 2021; Accepted: 13 October 2021;
Published: 08 November 2021.
Edited by:
Anning Huang, Nanjing University, ChinaReviewed by:
Haiming Xu, Nanjing University of Information Science and Technology, ChinaBoqi Liu, Chinese Academy of Meteorological Sciences, China
Copyright © 2021 Wang, Ma, Xiao, Li, Gao, Gao, Lai and Li. This is an open-access article distributed under the terms of the Creative Commons Attribution License (CC BY). The use, distribution or reproduction in other forums is permitted, provided the original author(s) and the copyright owner(s) are credited and that the original publication in this journal is cited, in accordance with accepted academic practice. No use, distribution or reproduction is permitted which does not comply with these terms.
*Correspondence: Hedi Ma, bWFoZWRpQHdoaWhyLmNvbS5jbg==
 Ruili Wang1,2
 Hedi Ma
 Ziniu Xiao
 Xing Li
 Chujie Gao