 Baoqiang Tian
 Ke Fan
94% of researchers rate our articles as excellent or good
Learn more about the work of our research integrity team to safeguard the quality of each article we publish.
Find out more
ORIGINAL RESEARCH article
Front. Earth Sci. , 15 October 2021
Sec. Atmospheric Science
Volume 9 - 2021 | https://doi.org/10.3389/feart.2021.771172
There were no TCs generated in July 2020 over the western North Pacific (WNP), which was the first time this had happened during since 1980. This study attempts to understand the cause of there having been no TCs generated in July 2020, and evaluates the prediction skill for the large-scale environmental conditions associated with the TC genesis number (TCGN). Results show that the main causes were the abnormal warming of sea surface temperature (SST) in the North Indian Ocean (NIO) and North Atlantic in July and the abnormal decrease in SST from April and May in the Niño4 region. The NIO SST can affect the large-scale environmental conditions via the SST–precipitation–wind feedback mechanism. Through the interaction between the tropical North Atlantic and the NIO, the abnormally warm North Atlantic SST further strengthened the impact of the NIO SST on the environmental conditions. The monthly difference (MD) of the Niño4 index from April to May is significantly correlated with the TCGN in July. Not only can the Niño4 MD in May affect the environmental conditions by affecting the WNP anticyclone, but it can also affect the NIO SST and precipitation anomalies through a shift in the position of the Walker circulation. Besides, the activity of the MJO also had a certain impact on the absence of TC genesis in July 2020. Although CFSv2 can successfully predict the local feedback affecting the July TCGN, it fails to forecast the large-scale environmental conditions associated with the absence of TC genesis over the WNP in July 2020.
The western North Pacific (WNP), including the South China Sea (SCS), is the most active tropical cyclone (TC) basin on the globe (Chan, 2005). WNP TCs cause serious meteorological disasters in China every year, resulting in huge economic losses and human casualties. Although the TC genesis number (TCGN) over the WNP decreased after the 1980s, the value of the economic loss is increasing significantly (Zhang et al., 2009; Xiao and Xiao, 2010).
The interannual variability of WNP TC activity and its physical mechanisms play an important role in the prediction of TCs in the WNP. Previous works have indicated that both El Niño–Southern Oscillation (ENSO) and Indian Ocean sea surface temperature (SST) anomalies impact upon the interannual variability of TCGN over the WNP (Chen et al., 1998; Chan, 2000; Wang and Chan, 2002; Zhan et al., 2011; Tao et al., 2012; Xie et al., 2016). Wang and Wang (2019) indicated that the subtropical high could integrate the effect of trans-basin SST on the interannual variability of TC genesis over the WNP. ENSO has a remarkable effect on the east–west shift in the upward and downward branches of the Walker circulation of the mean genesis location and accordingly contributes to intense TC activity (Nakazawa, 2001; Wang and Chan, 2002; Tao et al., 2012). Accompanying the decay of El Niño, tropical equatorial easterly anomalies in the WNP are driven by a Matsuno–Gill-type response to the specific SST anomaly pattern over the tropical Indo-Pacific sector, which induces anomalous large-scale environmental conditions unfavorable for WNP TCs (Chan, 2005; Zhao H. et al., 2019). An intensified impact of ENSO Modoki SST anomalies on the TC activity over the WNP after the early 1990s was reported by Cao et al. (2018). Zhao H. et al. (2019) also found that the WNP TC season onset date was affected by SST anomalies over the North Indian Ocean (NIO) and the tropical central Pacific. The interannual variability in the boreal spring regional Hadley circulation over the Indo-Pacific warm pool can affect the TC activity over the WNP via wind–precipitation–SST feedback (Cao et al., 2018; Guo and Tan, 2018). Besides ENSO and Indian Ocean SST anomalies, the TCGN in the WNP during July–October has a significantly negative correlation with SST anomalies in the tropical North Atlantic (Huo et al., 2015; Cao et al., 2016; Yu et al., 2016).
Previous studies have shown that the Madden−Julian−Oscillation (MJO) can also modulate the TC frequency over the WNP by exciting the wave activity (Sobel and Maloney, 2000; Hall et al., 2001; Maloney and Hartmann, 2001; Li and Zhou, 2013). The MJO has an asymmetric modulation on the WNP TC genesis, and an enhanced MJO modulation of TC genesis in the WNP during the El Niño events (Li et al., 2012). Zhao and Li (2019) found that the contribution of MJO-related relative humidity plays the most important role in modulating TC genesis in the WNP. The predicted MJO phase information is helpful to TC genesis prediction on intraseasonal time-scales (Zhao C. et al., 2019).
To date, many studies have focused on the prediction of seasonal-scale TC activity (Fan and Wang, 2009; Huang and Chan, 2014; Lu et al., 2018; Tian and Fan, 2019). The spring SST gradient between the tropical Indian Ocean and WNP warm pool in spring may act as a potential predictor for summer TC landfall number in China (Ueda et al., 2018; Wang and Chen, 2018). Compared with seasonal prediction, the subseasonal prediction of TC activity in the WNP is more complex and challenging.
As shown in Figure 1, there were 3.8 TCs generated in July on average in the WNP during 1981–2010, with two of them generally making landfall in China. However, the TCGN was zero in July 2020 over the WNP, for the first time in the past 41 years. Indeed, there was never a month without WNP TC genesis from August to October during 1980–2020 based on typhoon data from the China Meteorological Administration. The absence of WNP TCs in July 2020 led to less precipitation and higher temperatures in South China in July 2020, which subsequently induced severe meteorological drought. As shown in Figure 2A, there is a positive relationship between the July TCGN over the WNP and the standardized precipitation evapotranspiration index (SPEI) in South China. The occurrence of July drought in South China will be caused by a lower TCGN in the WNP. As shown in Figure 2A,B serious drought occurred in South China in July 2020. Figure 2C shows the interannual variability of July SPEI in South China (20°–27°N, 105°–120°E), which is defined as SPEI-SCI. The temporal correlation coefficient (TCC) between the July TCGN and July SPEI-SCI is 0.38 during 1980–2020, exceeding the 95% confidence level. The drought intensity in South China in July 2020 was the second highest in the past 41 years. Therefore, it is necessary to study the cause of the absence of TC genesis in July 2020.
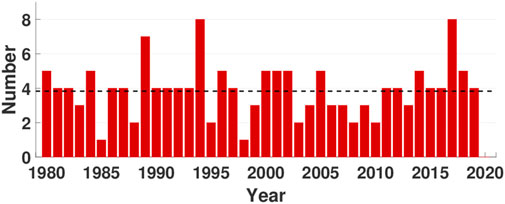
FIGURE 1. Interannual variability of the July TCGN over the WNP during 1980–2020. The average of the July TCGN is shown by the black dotted line.
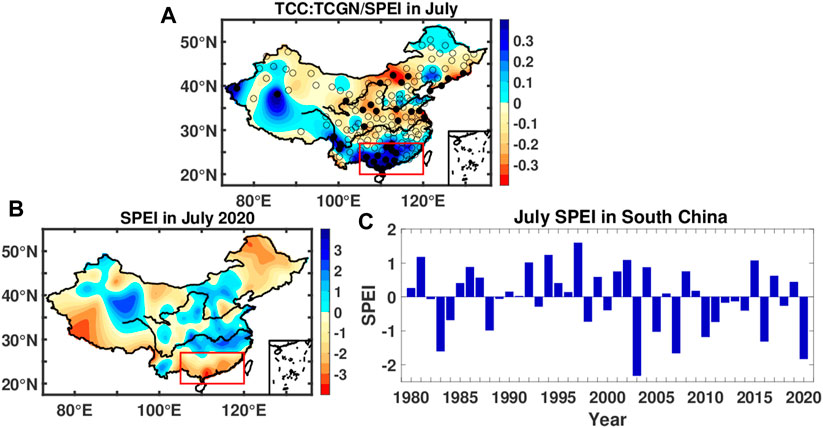
FIGURE 2. (A) TCC between the July TCGN and the July SPEI in China during 1980–2020. Filled and open circles represent sites that passed and failed the significance test at the 95% level. (B) Spatial distribution of SPEI. (C) Standardized regional-averaged July SPEI in South China (20°–27°N, 105°–120°E).
Previous studies have shown that the extremely unfavorable large-scale conditions that are associated with an anomalous WNP anticyclonic circulation driven by trans-basin SST anomalies across the tropical oceans, and an unprecedented long-stalled MJO event over the Indian Ocean sector, significantly contributed to the unprecedented absence of WNP TC in July 2020 (Liu et al., 2021; Wang et al., 2021). This paper not only explores the impact of Indian Ocean SST and MJO in July on the environmental conditions related to the absence of WNP TC in July 2020, but also shows the contribution of ENSO monthly difference to no TCs generated in July 2020. The prediction skill for the atmospheric circulation anomalies related to the WNP TCGN in July and its physical processes are also evaluated in this study.
The rest of the paper is structured as follows: Data and methods describes the data and methods used in this study. The causes of there having been no WNP TCs generated in July 2020 are described in Causes of no TCs generated over the WNP in July 2020. The predictability of the physical mechanism of no WNP TCs in July 2020 is presented in CFSv2 Prediction Skill for the Atmospheric Circulation Anomalies Related to the WNP TCGN in July and Its Physical Processes. Finally, Summary summarizes the key findings of this work.
The TCGN data are from the China Meteorological Administration, and cover the period 1951–2020 (Ying et al., 2014). The monthly precipitation and air temperature data are from the National Climate Center of the China Meteorological Administration, based on 160 observation stations in China. The monthly atmospheric circulation dataset, including sea level pressure (SLP), horizontal wind at 850 hPa (UV850), geopotential height at 500 hPa, and, vertical velocity, are from the National Centers for Environmental Prediction–National Center for Atmospheric Research (NCEP–NCAR) reanalysis dataset (horizontal resolution: 2.5° × 2.5°) for the period 1948–2020 (Kalnay et al., 1996). The monthly averaged SST data are from NOAA’s Extended Reconstructed Sea Surface Temperature dataset, version 5, with a horizontal resolution of 2.0° × 2.0° (Huang et al., 2017). The monthly outgoing longwave radiation (OLR) data, with a spatial resolution of 2.5° latitude × 2.5° longitude are from NOAA’s interpolated dataset (Liebmann and Smith, 1996). The monthly precipitation data are from the Global Precipitation Climatology Project (GPCP) dataset, version 2.3 (Adler et al., 2018). In this study, ENSO variability is characterized by a time series of averaged SST from the Niño4 region (160°E–150°W, 5°S–5°N) using monthly averaged ERSST.v5 data (https://psl.noaa.gov/data/correlation/nina4.data).
The coupled model used in this study is the NCEP’s Climate Forecast System, version 2 (CFSv2), which is a fully coupled dynamical seasonal prediction system developed at the Environmental Modeling Center, NCEP (Saha et al., 2014). The CFSv2-predicted data in July, starting on February 1st and May 1st during the period 1982–2020, are employed.
The ECHAM5 atmospheric general circulation model, developed by the Max Planck Institute for Meteorology, was employed to perform the following experiments (Roechner et al., 2003; Roeckner et al., 2006). First, a control experiment was run, in which the AMIP II climatological monthly SST was prescribed (Taylor et al., 2000), the simulation was integrated for 50 years, and the last 30 year’s results were used as the samples. Then, SST anomaly sensitivity experiments were run, for which observational SST anomalies added to the climatological SST were prescribed.
To explore the causes of there having been no TCs generated over the WNP in July 2020, the large-scale environmental conditions associated with the TCGN in July are investigated in this section. The climate systems, which affect the large-scale environmental conditions related to the July TCGN, are also analyzed.
Figure 3 shows the regression patterns of the July SLP anomaly, 500-hPa vertical velocity anomaly, 850-hPa relative vorticity anomaly, and VWS anomaly, upon the standardized July TCGN during 1980–2020. During the years with lower TCGN in July over the WNP, they are accompanied by positive SLP anomalies, anomalous downward motion, negative low-level relative vorticity anomalies, and positive VWS anomalies in the SCS and WNP (Figure 3).
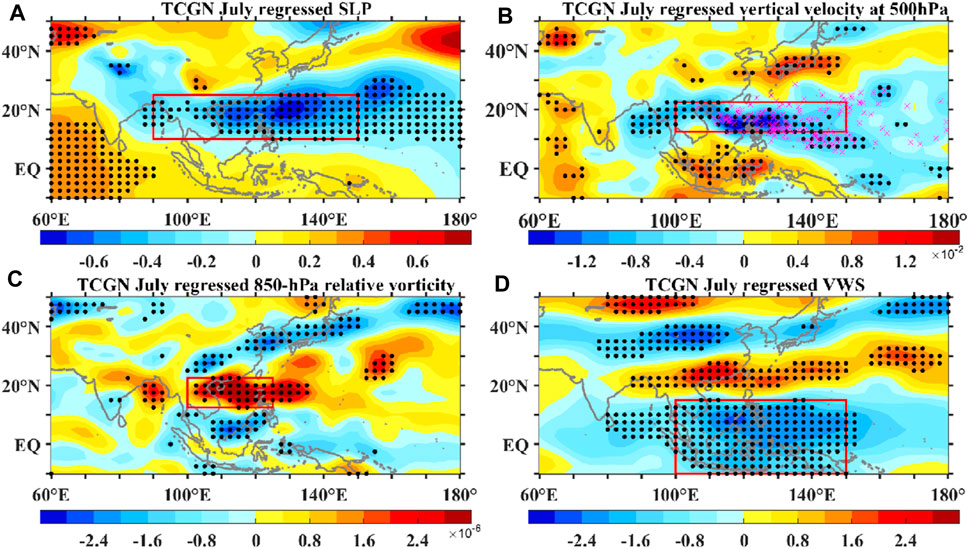
FIGURE 3. Regression patterns of the July. (A) SLP anomaly (units: hPa), (B) 500-hPa vertical velocity anomaly (units: Pa/s), (C) 850-hPa relative vorticity anomaly (units: 10–6 s), and (D) VWS anomaly between 850 and 200 hPa (units: m/s) upon the standardized July TCGN during 1980–2020. Dotted areas indicate statistical significance at the 95% level, as estimated by a Student’s t-test. The regions marked by the red rectangle are used to define four atmospheric circulation indices.
Four atmospheric circulation indices related to the July TCGN over the WNP are defined to facilitate our analyses. The SLP index is defined as the area-averaged SLP anomaly in the region (10°–25°N, 90°–150°E). The vertical velocity index is defined as the area-averaged 500-hPa vertical velocity anomaly in the region (12.5°–22.5°N, 100°–150°E). The relative vorticity index is defined as the area-averaged 850-hPa relative vorticity anomaly in the region (12.5°–22.5°N, 100°–125°E). The VWS index is defined as the area-averaged VWS anomaly in the region (10°S–15°N, 100°–150°E). Figure 4 shows the interannual variability of these four atmospheric circulation indices in July affecting the July TCGN over the WNP during 1980–2020. The TCCs between the four indices and the July TCGN are −0.53 for the SLP index, −0.57 for the vertical velocity index, 0.60 for the relative vorticity index, and −0.53 for the VWS index during 1980–2020, exceeding the 99% confidence level. The amplitudes of the positive anomaly of SLP index, positive anomaly of vertical velocity index, and negative anomaly of relative vorticity index in July 2020 are the top three in the past 41 years. In particular, the vertical velocity index and VWS index in July 2020 are the strongest during 1980–2020. These larger amplitude changes in large-scale environmental conditions were unfavorable for TC genesis over the WNP in July 2020, especially for the strongest descending motion over the WNP and VWS anomalies over the Maritime Continent in the last 41 years.
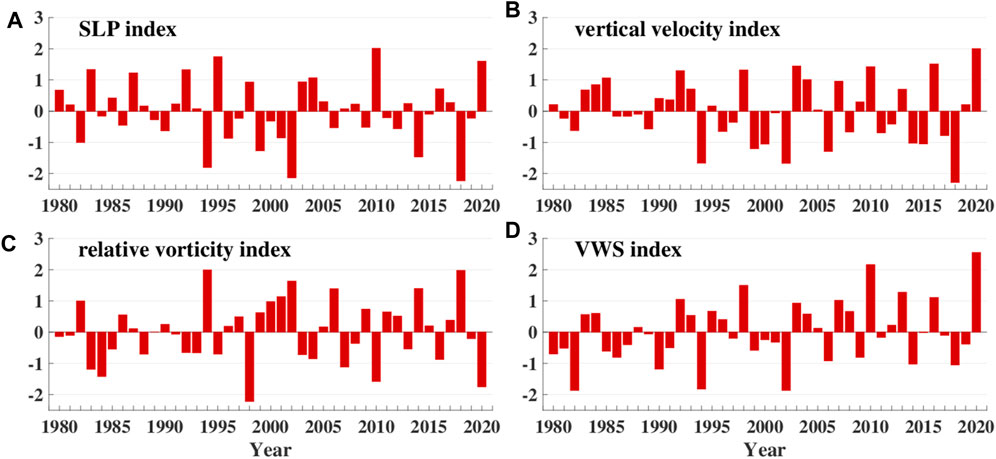
FIGURE 4. Interannual variability of the (A). SLP anomaly averaged over the region (10°–25°N, 90°–150°E), (B) 500-hPa vertical velocity anomaly averaged over the region (12.5°–22.5°N, 100°–150°E), (C) 850-hPa relative vorticity anomaly averaged over the region (12.5°–22.5°N, 100°–125°E), and (D) VWS anomaly averaged over the region (10°S–15°N, 100°–150°E), affecting the TCGN over the WNP during 1980–2020.
Recent studies have indicated that tropical Indian Ocean SST anomalies have a significant influence on the interannual variability of WNP TC activity (Du et al., 2011; Tao et al., 2012; Guo and Tan, 2018; Magee and Verdon-Kidd, 2018; Wang and Chen, 2018). In particular, eastern Indian Ocean SST anomalies affect the TCGN over the WNP through two possible physical mechanisms: the land–sea thermal contrast and equatorial Kelvin wave dynamics (Xie et al., 2009; Du et al., 2011; Zhan et al., 2011; Guo and Tan, 2018).
Recent research on the physical process by which Indian Ocean SST anomalies affect the TCGN over the WNP has focused mainly on the seasonal scale. But are their findings also applicable to the monthly scale? To answer this question, the relationship between the July TCGN and the SST, precipitation and UV850 in July are analyzed. Figure 5 presents the regression patterns of the July SST anomaly, precipitation anomaly, and UV850 upon the standardized July TCGN during 1980–2020. As can be seen, there is a significant negative correlation between the July TCGN and the July SST anomaly over the NIO (Figure 5A). When there is a high TCGN in July over the WNP, the precipitation over the Arabian Sea is simultaneously low, and the westerlies over the NIO to the WNP south of 20°N are stronger than normal (Figures 5B,C). Previous studies have shown a positive feedback among the precipitation anomalies over the WNP, surface winds, and local SST in the Bay of Bengal and the South China Sea (Guo and Tan, 2018). In this study, the precipitation–wind–SST feedback among the precipitation anomalies over the Arabian Sea, the surface wind, and SST anomalies in the NIO, is similar to this feedback but with some differences. The NIO warming and the eastern WNP cooling weakens the zonal SST gradient over the Philippine Sea. The weakened zonal SST gradient between the NIO–SCS and eastern WNP further enhances the easterly wind anomalies. The strengthened easterly wind anomalies reduce the total wind speed, which in turn warms the SST in the NIO by reducing the evaporation in the NIO. The strengthened easterly wind anomalies in the NIO enhance the July precipitation anomalies over the Arabian Sea by strengthening the upward motion in the Arabian Sea. The positive precipitation anomalies in the Arabian Sea stimulate a Gill–Matsuno response through the change in latent heat, subsequently triggering a Kelvin wave in the east of Arabian Sea and further strengthening the low-level easterly anomaly in the NIO and SCS. The easterly wind anomalies on the southern side of the anticyclonic circulation anomaly increase the VWS over the Maritime Continent, and decreases the 850 hPa-relative vorticity and SLP over the WNP, which are unfavorable to the WNP TC genesis in July.
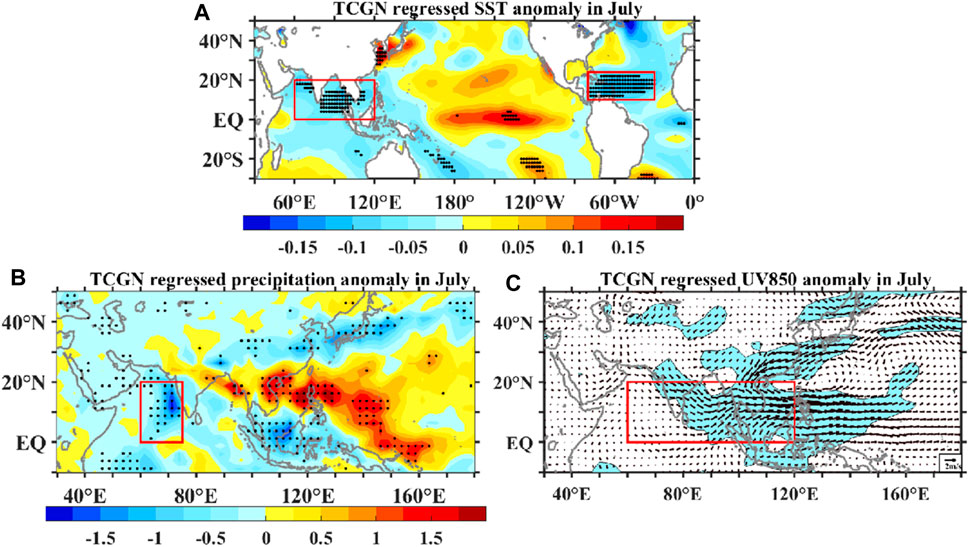
FIGURE 5. Regression patterns of the July. (A) SST anomaly (units: K), (B) precipitation anomaly (units: mm/day), and (C) UV850 (units: m/s) upon the standardized July TCGN during 1980–2020. Dotted (a, b) and shaded (c) areas indicate statistical significance at the 95% level, as estimated by a Student’s t-test. The regions marked by the red rectangle are used to define SSTI-NIO (0°–20°N, 60°–120°E), SSTI-ATL (10°–24°N, 30°–80°W), PRECI (0°–20°N, 60°–75°E), and U850I (0°–20°N, 60°–120°E).
But was the strongest descending motion over the WNP and VWS anomalies over the Maritime Continent in July 2020 during the past 41 years related to this feedback process? Figure 6 shows the SST anomaly, OLR, U850, and precipitation anomaly in July 2020. Dotted areas in the figure indicate that the value in July 2020 is the highest or lowest of the values in July 1980–2020. In July 2020, the anomalous amplitudes of the SST anomaly, low-level easterly wind anomaly in the NIO–SCS, OLR, and precipitation anomaly in the Arabian Sea are the largest during 1980–2020. With the strongest feedback process between the SST, precipitation, and low-level wind, the largest amplitude of the easterly wind anomaly in July 2020 leads to the strongest VWS in the WNP. Accordingly, there were no WNP TCs generated in July 2020, for the first time during the past 41 years.
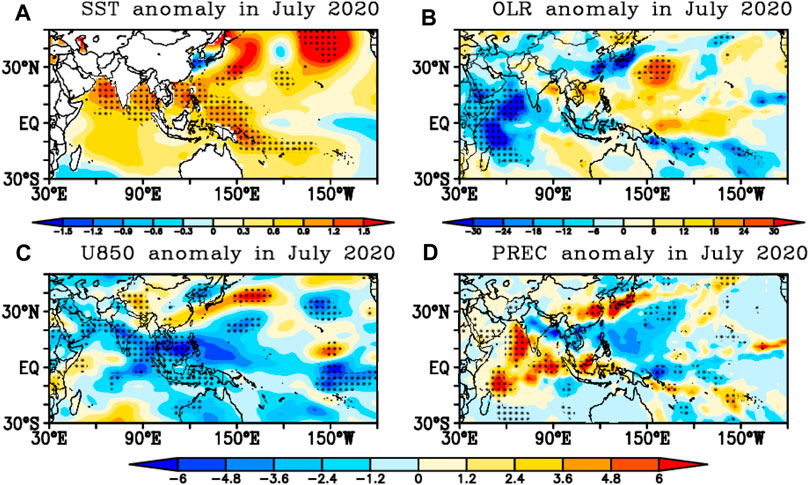
FIGURE 6. The (A) SST anomaly (units: K), (B) OLR (units: W/m2), (C) 850-hPa zonal wind anomaly (units: m/s), and (D) precipitation anomaly (units: mm/day) in July 2020. Dotted areas indicate that the value in July 2020 is the highest or lowest of the values in July 1980–2020.
To further verify the influence of the SST anomaly over the NIO on the July TCGN over the WNP, the relationship between the SST anomaly in the NIO and the large-scale environmental conditions related to the July TCGN over the WNP are explored in this study. The SSTI-NIO index is defined as the area-averaged SST anomaly in the region (0°–20°N, 60°–120°E). Figure 7 presents the regression patterns of the July SLP anomaly, 500-hPa vertical velocity anomaly, 850-hPa relative vorticity anomaly, and VWS anomaly upon the standardized July SSTI-NIO index during 1980–2020. As shown in Figure 7, warm NIO SST anomalies in July can lead to positive SLP anomalies, anomalous downward motion, negative relative vorticity at 850 hPa, and positive VWS in the Maritime Continent, which suppress the July TC genesis over the WNP via the local feedback between the SST, precipitation and low-level zonal wind over the NIO. This further shows that the absence of WNP TCs in July 2020 was closely related to the warmest NIO SST anomalies in July 2020.
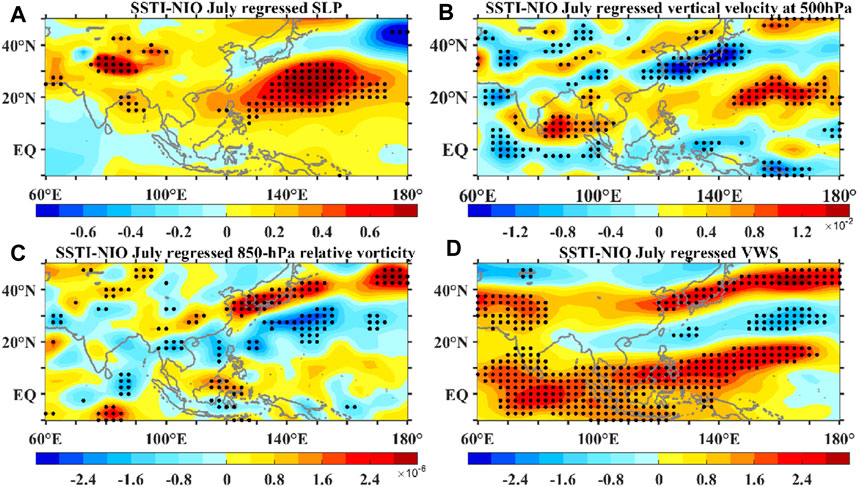
FIGURE 7. Regression patterns of the July. (A) SLP anomaly (units: hPa), (B) 500-hPa vertical velocity anomaly (units: Pa/s), (C) 850-hPa relative vorticity anomaly (units: 10–6 s), and (D) VWS anomaly between 850 and 200 hPa (units: m/s) upon the standardized July SSTI-NIO index during 1980–2020. Dotted areas indicate statistical significance at the 95% level, as estimated by a Student’s t-test.
Previous studies have pointed out that the SST anomalies over the northern tropical Atlantic affect the TC activity over the WNP through an Atlantic–Pacific teleconnection (Huo et al., 2015; Cao et al., 2016). Numerical experiments also confirm the warm SST anomalies in the tropical Atlantic exert a remote impact on the atmospheric circulation over the WNP related to the TCGN through the Indian Ocean relay effect, and easterly anomalies are induced over the NIO in response to the forcing of cold SST anomalies in the tropical North Atlantic (Yu et al., 2016). There is a negative relationship between the July TCGN and the SST anomalies in July over the tropical North Atlantic (Figure 7A). An index, referred to as SSTI-ATL, is defined as the regional-averaged SST anomalies in the Atlantic (10°–24°N, 30°–80°W). The TCC between the July TCGN and SSTI-ATL is −0.39 during 1980–2020, exceeding the 95% confidence level. There is also a close relationship between the SSTI-NIO and SSTI-ATL, with a TCC of 0.60 during 1980–2020, exceeding the 99% confidence level. The SSTI-ATL in July is the second warmest since 1980 (figure not shown). Through the interaction between the tropical North Atlantic and the NIO, the abnormally warm North Atlantic SST further strengthens the impact of the NIO SST on the large-scale environmental conditions related to the WNP TCGN. Thus, the warm SST anomalies in the North Atlantic also contributed to the absence of WNP TCs in July 2020.
The ECHAM5 atmospheric general circulation model was employed to confirm the impact of SST over the NIO and tropical Pacific on the large-scale circulation over the WNP basin. In this sensitivity experiment, the July SST anomaly over the NIO (0°–20°N, 60°–120°E) was superimposed onto climatological SST during 1971–2000. Figure 8 shows the 850-hPa horizontal wind anomaly and precipitation anomaly during 1971–2000 for the control experiment (EXP NIO-CTRL). In the sensitivity runs, the results of EXP-July-NIO demonstrate that warmer SSTs in the NIO induce locally enhanced precipitation in the east Arabian Sea and lower-level easterlies over the NIO. The physical processes of the SST over the NIO and tropical Pacific are partly confirmed by the numerical experiments. Meanwhile, the results of EXP-July-NIO demonstrate that warmer NIO SSTs induce locally enhanced positive VWS anomalies over the Maritime Continent and decreases the 850 hPa-relative vorticity and SLP over the WNP, which are unfavorable to the WNP TC genesis in July (figure not shown).
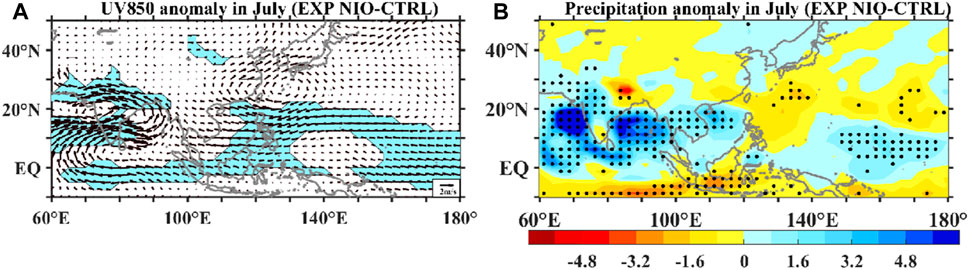
FIGURE 8. (A) 850-hPa horizontal wind anomaly (units: m/s) and (B) precipitation anomaly (units: mm/day) in July during 1971–2000 from EXP NIO-CTRL. Shaded (a) and dotted (b) areas indicate statistical significance at the 95% level, as estimated by a Student’s t-test.
Both ENSO and tropical Indian Ocean SST anomalies play important roles in modulating the TC activity over the WNP (Du et al., 2011; Zhan et al., 2011; Tao et al., 2012). Wang and Chan (2002) indicated that the relationship between WNP TC activity and ENSO depends strongly on the intensity of ENSO episodes. Strong El Niño or La Niña events have significant impacts on WNP TC activity, but moderate warm events do not show definite significant impacts during ENSO neutral conditions (Magee and Verdon-Kidd, 2018).
Therefore, was the lack of TC genesis in the WNP in July 2020 related to ENSO? The Niño4 MD is defined as the difference in the Niño4 SST index between the current month and the previous month. As shown in Figure 9A, the relationship between the WNP TCGN in July and the SST in the Niño4 region from December to July is not significant. However, there is a significant correlation between the July TCGN and the Niño4 MD from March to May, especially in May. The TCC between the July TCGN and Niño4 MD is 0.36 for March, 0.37 for April, and 0.50 for May, exceeding the 95% confidence level. Thus, the contribution of the SST in the Niño4 region to there being no WNP TCs generated in July is relatively small. However, the Niño4 MD in March–May might make a certain contribution to the July TCGN over the WNP.
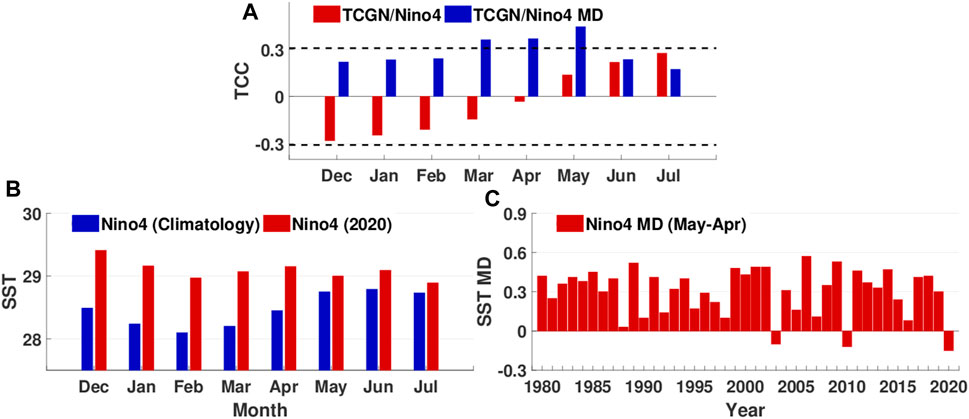
FIGURE 9. (A) The TCCs between the TCGN in July and the Niño4 index (red bars), as well as the Niño-4 index MD (blue bars) from December to July during 1980–2020. (B) Climatological monthly evolution of SST in the Niño4 region during 1981–2020 (blue bars), and the monthly evolution of the Niño4 index in 2020 (red bars). (C) Interannual variability of the SST MD between May and April in the Niño4 region during 1980–2020. Units: K. The black lines indicate statistical significance at the 95% confidence level, as estimated by a Student’s t-test.
Previous studies have indicated that there is a close relationship between the SST in the Indian Ocean and ENSO, and the linkage between them operates through the Indo-western Pacific ocean capacitor and atmospheric bridge (Klein et al., 1999; Alexander et al., 2002; Xie et al., 2016). We also investigate the relationship between the July SST anomalies over the NIO and ENSO. The significant statistical relationship between the Niño4 MD in May and the Indian Ocean SST anomaly can also last from May to July, with TCCs of −0.41 in May, −0.45 in June, and −0.51 in July during 1980–2020. But were the extremely warm NIO SST anomalies in July 2020 affected by ENSO? Figure 9B shows the climatological monthly evolution of SST in the Niño4 region during 1981–2010, and the monthly evolution of the Niño4 index in 2020. Due to the weak El Niño state in the first half of 2020, the direct impact of ENSO on the NIO SST anomalies in July 2020 is weak. In the monthly evolution of the Niño4 index, the SST in the Niño4 region decreases anomalously from April to May, which is different from the evolutionary characteristics of the SST climatology in the Niño4 region. A negative Niño4 MD only appears in May 2003, 2010, and 2020 (Figure 9C). The year with the largest cooling amplitude of Niño4 from April to May is 2020. Because the Niño4 MD in May is significantly correlated with the July TCGN and the July SST anomalies over the NIO, the Niño4 MD in May 2020 may have made an important contribution to the warm NIO SST anomalies and the lack of TC genesis in July 2020. There were only two WNP TCs generated in July 2003 and 2010, and their anomalous amplitudes were less than one negative standard deviation. Thus, the negative Niño4 MD in May 2003 and 2010 also made a certain contribution to the lack of TC genesis in July 2003 and 2010.
The signal of Niño4 MD in May can last from May to July, and the lag correlation coefficients between the Niño4 MD in May and the Niño4 MD in June and July are 0.43 and 0.39 during 1980–2020, exceeding the 99% confidence level. As shown in Figure 10A, the Niño4 MD in May affect the environmental conditions related to the July TCGN directly, by affecting the south side of the WNP anticyclone in the following June and July. Without the assistance of the NIO SST anomaly in July, the cooling of SST in the Niño4 region from April to May can also strengthen the WNP anticyclonic anomaly (figure not shown).
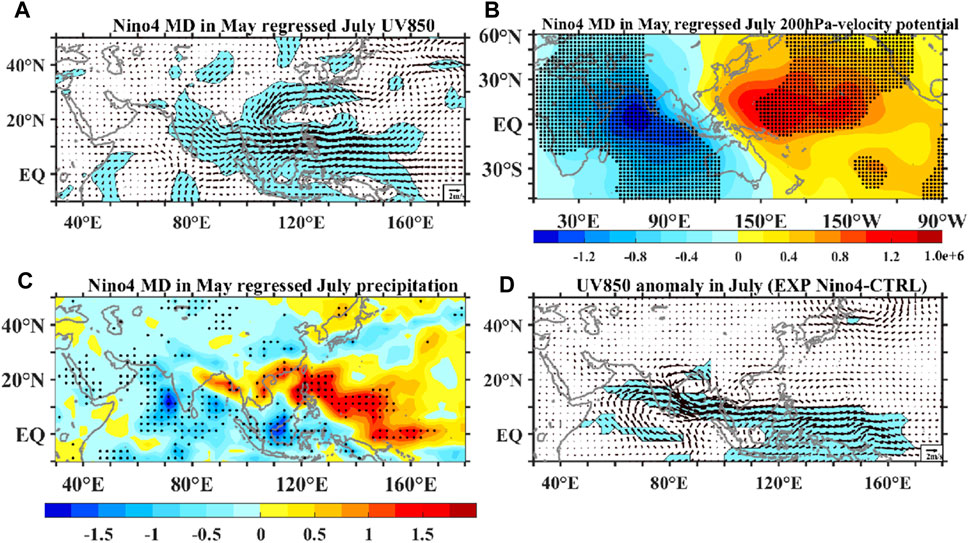
FIGURE 10. Regression patterns of the July (A) UV850 anomaly (units: m/s), (B) velocity potential at 200 hPa (units: 106 m2/s), and (C) precipitation anomaly (units: mm/day) upon the standardized July Niño4 MD index during 1980–2020. (D) UV850 (units: m/s) in July during 1971–2000 from EXP Niño4-CTRL. Dotted (b, c) and shaded (a, d) areas indicate statistical significance at the 95% level, as estimated by a Student’s t-test.
The Niño4 MD in May can also affect the SST and precipitation anomalies in the NIO through the Walker circulation, and then affect the environmental conditions by strengthening the local feedback between the precipitation, SST and low-level wind. The patterns of velocity potential in the upper troposphere comprise one divergent anomaly center over the central tropical Pacific and a convergent anomaly center over the tropical Indian Ocean (Figure 10B). As the SST in the Niño4 region decreases from April to May, there is a strengthened ascending branch of Walker circulation over the Indian Ocean in July, which is conducive to the increase of precipitation over the Indian Ocean in July (Figure 10C). The positive precipitation anomalies in the Arabian Sea stimulate a Gill–Matsuno response through the change in latent heat, subsequently triggering a Kelvin wave in the east of Arabian Sea and strengthening the low-level easterly anomaly in the NIO and SCS, which contributes to SST warming in July by reducing evaporation in the NIO. Then the WNP TC in July can be affected by the precipitation–wind–SST feedback. The results of EXP Niño4-CTRL, in which SST MD in the Niño4 region from April to May was superimposed onto climatological SST, demonstrate the effect of the Niño4 MD in May on the easterly anomaly over the WNP in the following July (Figure 10D).
Previous studies have shown that the convection of the Madden–Julian Oscillation (MJO) affects the frequency and location of TC genesis over the WNP through modulating the large-scale environmental conditions (Nakazawa, 2006; Pan et al., 2010; You et al., 2019). Indeed, the successful prediction of the modulation of the large-scale fields by the intraseasonal variability resulted in an accurate TC genesis forecast in 2004 (Nakano et al., 2015).
The impact of the MJO’s activity on the absence of TCs in July 2020 is also explored. Figure 11A shows the RMM (Real-time Multivariate MJO) index phase space diagram for July 2020. A consecutive MJO active period of 1–31 July can be identified. This MJO event starts in phase 1, passes through phase 2, and ends in phase 3. The convective activities mainly remain situated over Africa and the Arabian Sea in July 2020. The TCC between the July TCGN and the number of days when the July MJO is in Phases 1–2 is −0.54 during 1980–2020, exceeding the 99% confidence level. As shown in Figure 11B, the MJO remains in Phases 1–2 for 28 days in July 2020, which is the most days in July for the period 1980–2020. The MJO phase remaining over Africa and the Arabian Sea was conducive to the increase in precipitation in July over the Arabian Sea. These precipitation anomalies can affect the large-scale environmental conditions related to the July TCGN via the SST–precipitation–wind feedback mechanism. The July MJO in Phases 1–2 is closely related to the SST–precipitation–wind feedback and the large-scale environmental conditions. The PRECI is defined as the area-averaged precipitation anomaly in the region 0°–20°N, 60°–75°E). The U850I is defined as the area-averaged 850-hPa zonal wind anomaly in the region (0°–20°N, 60°–120°E). The TCCs between the days of the July MJO in Phases 1–2 and the three factors in the feedback process are 0.44 for SSTI-NIO, −0.70 for U850I, and 0.44 for PRECI during 1980–2020, exceeding the 99% confidence level. The TCCs between the four atmospheric circulation indices and the days of the July MJO in Phases 1–2 are 0.67 for the SLP index, 0.69 for the vertical velocity index, −0.64 for the relative vorticity index, and −0.63 for the VWS index during 1980–2020, exceeding the 99% confidence level. The relatively more active MJO over Africa and the Arabian Sea provided unfavorable atmospheric circulation conditions for TC genesis, leading to the absence of WNP TC genesis in July 2020. Thus, the activity of the MJO also had a certain impact on the absence of WNP TC genesis in July 2020.
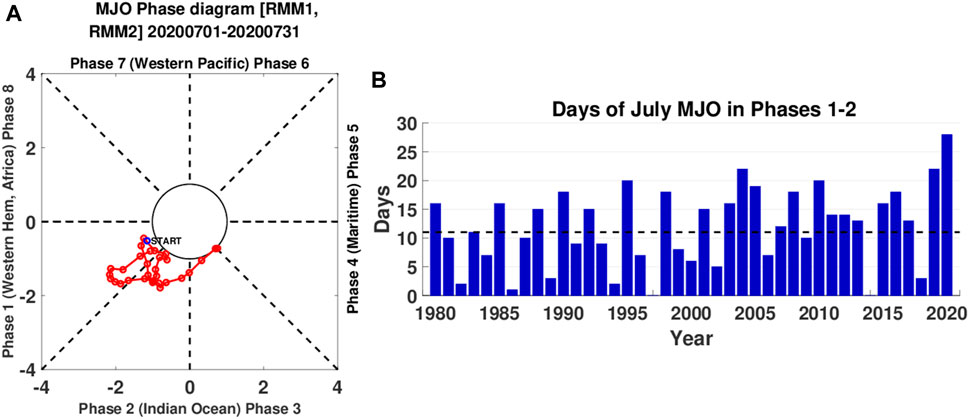
FIGURE 11. (A) RMM index phase–space diagram in July 2020. (B) Days of the July MJO in Phases 1–2 during 1980–2020. The average of the days is shown by the black dotted line.
Next, we address whether the CFSv2 model can reasonably reproduce the large-scale environmental conditions related to the WNP TCGN in July and its associated physical mechanism. Specifically, the relationship between the WNP TCGN in July and the large-scale atmospheric circulation, the physical process of the SST over the NIO, and ENSO affecting the July TCGN in the WNP, are evaluated in this section. Since consultation over the summer climate in China takes place mainly in February and May of each year, we evaluate the CFSv2 prediction skill for the atmospheric circulation anomalies related to the WNP TCGN in July at 4- and 2-months leads (February and May).
Figure 12 shows the interannual variability of CFSv2-predicted July SLP index, relative vorticity index, and VWS index at 4- and 2-months leads, affecting the July TCGN over the WNP during 1980–2020. It is found that CFSv2 shows low prediction skill for the July SLP index and VWS index in February, with TCCs of 0.29 for the SLP index and 0.28 for the VWS index, below the 95% confidence level. The interannual variability of the SLP index and VWS index in July can be well predicted by CFSv2 at a 2-months lead, with TCCs of 0.64 for SLPI and 0.53 for the VWS index, exceeding the 99% confidence level. For 4- and 2-months leads, CFSv2 shows high prediction skill for the July relative velocity at 850 hPa associated with the July TCGN over the WNP. The TCC between the observed and predicted the relative vorticity index is 0.52 at a 4-months lead, and 0.64 at a 2-months lead, exceeding the 99% confidence level. However, the CFSv2 model seriously underestimates the intensity of the three environmental conditions related to the observed WNP TCGN in July 2020 at 4- and 2-months leads.

FIGURE 12. Interannual variability of the CFSv2-predicted July (A) SLP anomaly averaged over the region (10°–25°N, 90°–150°E), (B) 850-hPa relative vorticity anomaly averaged over the region (12.5°–22.5°N, 100°–125°E), and (C) VWS anomaly averaged over the region (10°S–15°N, 100°–150°E) at 4- (red bars) and 2-months (blue bars) leads, affecting the TCGN over the WNP during 1982–2020.
We also evaluate the CFSv2 prediction skill for the large-scale environmental conditions associated with the July TCGN over the WNP. Figure 13 shows the regression patterns of the CFSv2-predicted July SLP anomaly, 850-hPa relative vorticity anomaly, and VWS anomaly in February and May upon the standardized July TCGN in the WNP during 1980–2020. As shown in Figure 13A, the CFSv2 model shows poor skill in reproducing the relationship between the July TCGN and the SLP anomaly in February. However, the model shows a certain predictive ability for the relationship between the July TCGN and the relative vorticity at 850 hPa and VWS at 4-months leads (Figures 13B,C). At 2-months leads, CFSv2 shows high skill with respect to the relationships between the WNP TCGN and the CFSv2-predicted SLP, relative vorticity at 850 hPa, and VWS in the WNP (Figures 13D–F).
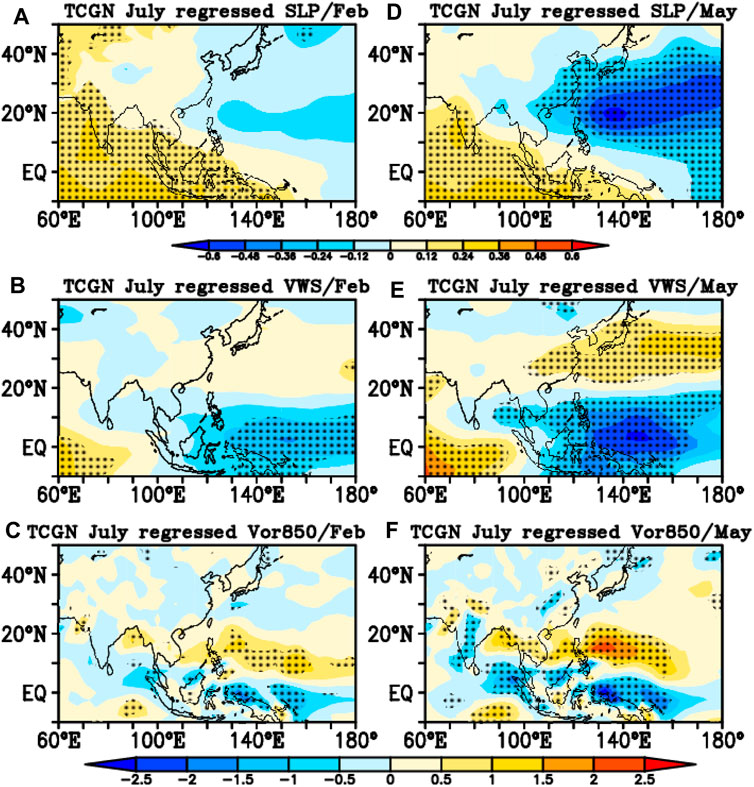
FIGURE 13. Regression patterns of the CFSv2-predicted July (a, d) SLP anomaly (units: hPa) (b, e) 850-hPa relative vorticity anomaly (units: 10–6 s), and (c, f) VWS anomaly between 850 and 200 hPa (units: m/s), at (A–C) 4- and (D–F) 2-months leads, upon the standardized July TCGN during 1982–2020. Dotted areas indicate statistical significance at the 95% level, as estimated by a Student’s t-test.
The CFSv2 prediction skill for the physical processes of NIO SST affecting the July TCGN over the WNP is also evaluated in this study. The SST in the NIO–SCS affects the July TCGN via the local feedback between the SST, precipitation, and low-level wind. As shown in Figure 14, the CFSv2 model shows very high prediction skill for the interannual variability of the July SST over the NIO at 4- and 2-months leads, with TCCs of 0.78 for February and 0.83 for May during 1982–2020, exceeding the 99% confidence level. The CFSv2 model also shows certain skill in predicting the interannual variability of zonal wind at 850 hPa in the NIO, with TCCs of 0.33 for February and 0.55 for May, exceeding the 95% confidence level. Although the CFSv2 model predicts the warming NIO SST anomaly in July 2020, it shows low predictive ability for the spatial distribution of July SST anomalies in the NIO, with anomaly pattern correlation coefficients of −0.09 for February and −0.22 for May. The model also has little predictive skill for the interannual variability of July precipitation over the Arabian Sea, with TCCs of −0.22 for February and −0.21 for May. The CFSv2 model can only predict the anomalous warming of the SST anomalies over the NIO. It underestimates the intensity of precipitation over the Arabian Sea and the low-level wind over the NIO in July 2020. As shown in Figure 15, the CFSv2 model can reasonably reproduce the local feedback process between the July SST, precipitation, and low-level wind affecting the July TCGN at 4- and 2-months leads. Although the CFSv2 model can successfully predict the local feedback affecting the July TCGN, if the CFSv2 model can not accurately predict regional SST/precipitation/winds anomalies, it will lead to the failure of WNP TCGN. The CFSv2 model underestimated the intensity of the largest amplitude regional SST/precipitation/winds in the past 41 years, which led to the failure to predict the environmental conditions associated with the absence of TC genesis over the WNP in July 2020.
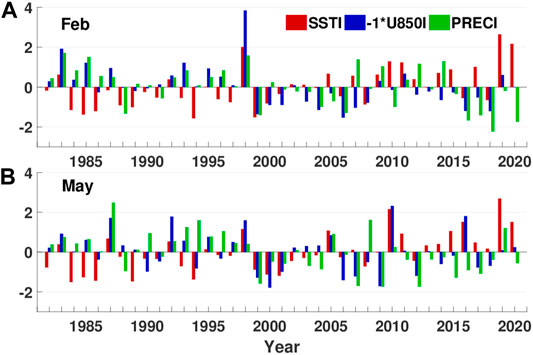
FIGURE 14. Interannual variability of the CFSv2-predicted July SSTI (red bars), −U850I (blue bars), and PRECI (green bars), at (A) 4- (February) and (B) 2-months (May) leads.
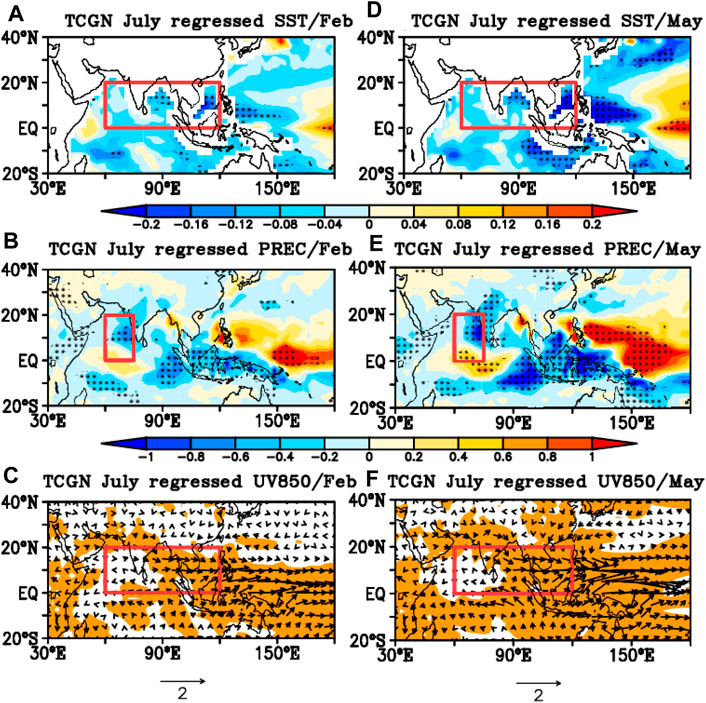
FIGURE 15. Regression patterns of the CFSv2-predicted July (a, d) SST anomaly (units: K) (b, e) precipitation anomaly (units: mm/day), and (c, f) UV850 anomaly (units: m/s), at (A–C) 4- and (D–F) 2-months leads, upon the standardized July TCGN during 1982–2020. Dotted (a, b, d, e) and shaded (c, f) areas indicate statistical significance at the 95% level, as estimated by a Student’s t-test. The regions marked by the red rectangle are used to define SSTI-NIO (0°–20°N, 60°–120°E), PRECI (0°–20°N, 60°–75°E), and U850I (0°–20°N, 60°–120°E).
In July 2020, there were no TCs generated over the WNP, for the first time in the past 41 years. The absence of WNP TCs in July 2020 led to less precipitation and higher temperatures in South China in July 2020, which then induced severe meteorological drought. The absence of TC genesis over the WNP in July 2020 may have been due to the joint action of the three tropical oceans. Warm NIO SST anomalies in July can lead to positive SLP anomalies, anomalous downward motion, negative relative vorticity at 850 hPa, and positive VWS in the WNP, which suppress July TC genesis over the WNP via the local feedback between the SST, precipitation, and low-level zonal wind over the NIO. The physical processes of SST over the NIO and tropical Pacific were partly confirmed by numerical experiments. With the strongest feedback process between the strongest amplitude of SST, precipitation, and low-level wind in July over the NIO, the largest amplitude of the easterly wind anomaly in July 2020 led to the strongest VWS in the WNP.
The SSTI-ATL in July 2020 was the second warmest since 1980. Through the interaction between the tropical North Atlantic and the NIO, the abnormally warm North Atlantic SST further strengthened the impact of the NIO SST on the large-scale environmental conditions related to the WNP TCGN. Thus, the warm SST anomalies in the North Atlantic also contributed to the absence of WNP TCs in July 2020.
Due to the weak El Niño state in the first half of 2020, the direct impact of ENSO on the NIO SST anomalies in July 2020 was weak. In the monthly evolution of the Niño4 index, the SST in the Niño4 region decreases anomalously from April to May, which is different from the evolutionary characteristics of the SST climatology in the Niño4 region. A negative Niño4 MD only appears in May 2003, 2010, and 2020. The year with the largest cooling amplitude of Niño4 index from April to May is 2020. Along with the cooling of SST in the Niño4 region from April to May in 2020, low-level anomalous westerlies can be found in the equatorial regions in the eastern part of the WNP. This would have created negative low-level relative vorticity anomalies, thus providing unfavorable environmental conditions for TC genesis over the WNP in July 2020. Not only can the Niño4 MD in May affect the environmental conditions related to the July TCGN directly, by affecting the anticyclone in the WNP, but it can also affect the SST and precipitation anomalies in the NIO through a shift in the position of the Walker circulation, subsequently affecting the environment conditions by strengthening local feedback.
The activity of the MJO also had a certain impact on the absence of WNP TC genesis in July 2020. The MJO stayed in Phases 1–2 for 28 days in July 2020, which was the most days in July during 1980–2020. The MJO phase remaining over Africa and the Arabian Sea was conducive to the increase in precipitation in July over the Arabian Sea. These precipitation anomalies affected the large-scale environmental conditions related to the July TCGN via the SST–precipitation–wind feedback mechanism.
The CFSv2 model can reasonably reproduce the local feedback process between the July SST, precipitation, and low-level wind affecting the July TCGN at 4- and 2-months leads. Although the CFSv2 model can successfully predict the local feedback affecting the July TCGN, it fails to forecast the large-scale environmental conditions associated with the absence of TC genesis over the WNP in July 2020. In future work, it is necessary to combine the prediction skill of the coupled model for the environmental conditions with the physical mechanism of TCGN to improve the subseasonal prediction of TCGN.
The original contributions presented in the study are included in the article/Supplementary Material, further inquiries can be directed to the corresponding author.
KF contributed to conception and design of the study. BT wrote the first draft of the manuscript. All authors contributed to manuscript revision, read, and approved the submitted version.
This research was jointly supported by the National Natural Science Foundation of China (Grant 42088101), the National Key R&D Program of China (Grant 2017YFA0603802), the National Natural Science Foundation of China (Grant 41730964), and the Innovation Group Project of Southern Marine Science and Engineering Guangdong Laboratory (Zhuhai) (Grant 311021001).
The authors declare that the research was conducted in the absence of any commercial or financial relationships that could be construed as a potential conflict of interest.
All claims expressed in this article are solely those of the authors and do not necessarily represent those of their affiliated organizations, or those of the publisher, the editors, and the reviewers. Any product that may be evaluated in this article, or claim that may be made by its manufacturer, is not guaranteed or endorsed by the publisher.
Adler, R. F., Sapiano, M., Huffman, G. J., Wang, J., Gu, G., Bolvin, D., et al. (2018). The Global Precipitation Climatology Project (GPCP) Monthly Analysis (New Version 2.3) and a Review of 2017 Global Precipitation. Atmosphere (Basel) 9, 14.doi:10.3390/atmos9040138
Alexander, M. A., Bladé, I., Newman, M., Lanzante, J. R., Lau, N.-C., and Scott, J. D. 2002). The Atmospheric Bridge: The Influence of ENSO Teleconnections on Air-Sea Interaction over the Global Oceans. J. Clim. 15, 2205–2231.doi:10.1175/1520-0442(2002)015<2205:tabtio>2.0.co;2
Cao, X., Chen, S., Chen, G., and Wu, R. (2016). Intensified Impact of Northern Tropical Atlantic SST on Tropical Cyclogenesis Frequency over the Western North Pacific after the Late 1980s. Adv. Atmos. Sci. 33, 919–930.doi:10.1007/s00376-016-5206-z
Cao, X., Wu, R., and Xiao, X. (2018). A New Perspective of Intensified Impact of El Niño-Southern Oscillation Modoki on Tropical Cyclogenesis over the Western North Pacific Around 1990s. Int. J. Climatol 38, 4262–4275.doi:10.1002/joc.5667
Chan, J. C. L. (2005). Interannual and Interdecadal Variations of Tropical Cyclone Activity over the Western North Pacific. Meteorol. Atmos. Phys. 89, 143–152.doi:10.1007/s00703-005-0126-y
Chan, J. C. L. (2000). Tropical Cyclone Activity over the Western North Pacific Associated with El Niño and La Niña Events. J. Clim. 13, 2960–2972.doi:10.1175/1520-0442(2000)013<2960:tcaotw>2.0.co;2
Chen, T.-C., Weng, S.-P., Yamazaki, N., and Kiehne, S. (1998). Interannual Variation in the Tropical Cyclone Formation over the Western North Pacific. Mon. Wea. Rev. 126, 1080–1090.doi:10.1175/1520-0493(1998)126<1080:ivittc>2.0.co;2
Du, Y., Yang, L., and Xie, S.-P. (2011). Tropical Indian Ocean Influence on Northwest Pacific Tropical Cyclones in Summer Following Strong El Niño*. J. Clim. 24, 315–322.doi:10.1175/2010jcli3890.1
Fan, K., and Wang, H. (2009). A New Approach to Forecasting Typhoon Frequency over the Western North Pacific. Weather Forecast. 24, 974–986.doi:10.1175/2009waf2222194.1
Guo, Y.-P., and Tan, Z.-M. (2018). Impacts of the Boreal Spring Indo-Pacific Warm Pool Hadley Circulation on Tropical Cyclone Activity over the Western North Pacific. J. Clim. 31, 1361–1375.doi:10.1175/jcli-d-17-0422.1
Hall, J. D., Matthews, A. J., and Karoly, D. J. (2001). The Modulation of Tropical Cyclone Activity in the Australian Region by the Madden-Julian Oscillation. Mon. Wea. Rev. 129, 2970–2982.doi:10.1175/1520-0493(2001)129<2970:tmotca>2.0.co;2
Huang, B., Thorne, P. W., Banzon, V. F., Boyer, T., Chepurin, G., Lawrimore, J. H., et al. (2017). Extended Reconstructed Sea Surface Temperature, Version 5 (ERSSTv5): Upgrades, Validations, and Intercomparisons. J. Clim. 30, 8179–8205.doi:10.1175/jcli-d-16-0836.1
Huang, W.-R., and Chan, J. C. L. (2014). Dynamical Downscaling Forecasts of Western North Pacific Tropical Cyclone Genesis and Landfall. Clim. Dyn. 42, 2227–2237.doi:10.1007/s00382-013-1747-3
Huo, L., Guo, P., Hameed, S. N., and Jin, D. (2015). The Role of Tropical Atlantic SST Anomalies in Modulating Western North Pacific Tropical Cyclone Genesis. Geophys. Res. Lett. 42, 2378–2384.doi:10.1002/2015gl063184
Kalnay, E., Kanamitsu, M., Kistler, R., Collins, W., Deaven, D., Gandin, L., et al. (1996). The NCEP/NCAR 40-year Reanalysis Project. Bull. Amer. Meteorol. Soc. 77, 437–471.doi:10.1175/1520-0477(1996)077<0437:tnyrp>2.0.co;2
Klein, S. A., Soden, B. J., and Lau, N.-C. (1999). Remote Sea Surface Temperature Variations during ENSO: Evidence for a Tropical Atmospheric Bridge. J. Clim. 12, 917–932.doi:10.1175/1520-0442(1999)012<0917:rsstvd>2.0.co;2
Li, R. C. Y., Zhou, W., Chan, J. C. L., and Huang, P. (2012). Asymmetric Modulation of Western North Pacific Cyclogenesis by the Madden-Julian Oscillation under ENSO Conditions. J. Clim. 25, 5374–5385.doi:10.1175/jcli-d-11-00337.1
Li, R. C. Y., and Zhou, W. (2013). Modulation of Western North Pacific Tropical Cyclone Activity by the ISO. Part I: Genesis and Intensity. J. Clim. 26, 2904–2918.doi:10.1175/jcli-d-12-00210.1
Liebmann, B., and Smith, C. A. (1996). Description of a Complete (Interpolated) Outgoing Longwave Radiation Dataset. Bull. Am. Meteorol. Soc. 77, 1275–1277.doi:10.1175/1520-0477-77.12.fmi
Liu, C., Zhang, W., Jiang, F., Stuecker, M. F., and Huang, Z. (2021). Record-low WNP Tropical Cyclone Activity in Early Summer 2020 Due to Indian Ocean Warming and Madden-Julian Oscillation Activity. Geophys. Res. Lett. 48, e2021GL094578.doi:10.1029/2021gl094578
Lu, M.-M., Lee, C.-T., and Wang, B. (2018). Predictability of Late-Season Tropical Cyclone Accumulated Kinetic Energy Around Taiwan 2 Months Ahead. Int. J. Climatol 38, 1938–1952.doi:10.1002/joc.5307
Magee, A. D., and Verdon-Kidd, D. C. (2018). On the Relationship between Indian Ocean Sea Surface Temperature Variability and Tropical Cyclogenesis in the Southwest Pacific. Int. J. Climatology 38, E774–E795.doi:10.1002/joc.5406
Maloney, E. D., and Hartmann, D. L. (2001). The Madden-Julian Oscillation, Barotropic Dynamics, and North Pacific Tropical Cyclone Formation. Part I: Observations. J. Atmos. Sci. 58, 2545–2558.doi:10.1175/1520-0469(2001)058<2545:tmjobd>2.0.co;2
Nakano, M., Sawada, M., Nasuno, T., and Satoh, M. (2015). Intraseasonal Variability and Tropical Cyclogenesis in the Western North Pacific Simulated by a Global Nonhydrostatic Atmospheric Model. Geophys. Res. Lett. 42, 565–571.doi:10.1002/2014gl062479
Nakazawa, T. (2006). Madden-Julian Oscillation Activity and Typhoon Landfall on Japan in 2004. Sola 2, 136–139.doi:10.2151/sola.2006-035
Nakazawa, T. (2001). Suppressed Tropical Cyclone Formation over the Western north Pacific in 1998. J. Meteorol. Soc. Jpn. 79, 173–183.doi:10.2151/jmsj.79.173
Pan, J., Li, C., and Song, J. (2010). The Modulation of Madden-Julian Oscillation on Typhoons in the Northwestern Pacific Ocean. Chin. J. o f Atmos. Sci. 34, 1059–1070.
Roechner, E., Bauml, G., Bonaventura, L., Brokopf, R., Esch, M., Giorgetta, M., et al. (2003). The Atmospheric General Circulation Model ECHAM 5. PART I: Model Description. Hamburg, Germany: Max Planck Institute for Meteorology Rep 349, 127 pp. [Available from MPI for Meteorology, Bundesstr. 153, 20146 Hamburg, Germany].
Roeckner, E., Brokopf, R., Esch, M., Giorgetta, M., Hagemann, S., Kornblueh, L., et al. (2006). Sensitivity of Simulated Climate to Horizontal and Vertical Resolution in the ECHAM5 Atmosphere Model. J. Clim. 19, 3771–3791.doi:10.1175/jcli3824.1
Saha, S., Moorthi, S., Wu, X., Wang, J., Nadiga, S., Tripp, P., et al. (2014). The NCEP Climate Forecast System Version 2. J. Clim. 27, 2185–2208.doi:10.1175/jcli-d-12-00823.1
Sobel, A. H., and Maloney, E. D. (2000). Effect of ENSO and the MJO on Western North Pacific Tropical Cyclones. Geophys. Res. Lett. 27, 1739–1742.doi:10.1029/1999gl011043
Tao, L., Wu, L., Wang, Y., and Yang, J. (2012). Influence of Tropical Indian Ocean Warming and ENSO on Tropical Cyclone Activity over the Western North Pacific. J. Meteorol. Soc. Jpn. 90, 127–144.doi:10.2151/jmsj.2012-107
Taylor, K. E., Williamson, D., and Zwiers, F. (2000). The Sea Surface Temperature and Sea-Ice Concentration Boundary Conditions for AMIP II Simulations. PCMDI Tech. Rep. 60, 24 pp. [Available online at http://www-pcmdi.llnl.gov/publications/pdf/60.pdf.].
Tian, B., and Fan, K. (2019). Seasonal Climate Prediction Models for the Number of Landfalling Tropical Cyclones in China. J. Meteorol. Res. 33, 837–850.doi:10.1007/s13351-019-8187-x
Ueda, H., Miwa, K., and Kamae, Y. (2018). Seasonal Modulation of Tropical Cyclone Occurrence Associated with Coherent Indo-Pacific Variability during Decaying Phase of El Niño. J. Meteorol. Soc. Jpn. 96, 381–390.doi:10.2151/jmsj.2018-044
Wang, B., and Chan, J. C. L. (2002). How Strong ENSO Events Affect Tropical Storm Activity over the Western North Pacific*. J. Clim. 15, 1643–1658.doi:10.1175/1520-0442(2002)015<1643:hseeat>2.0.co;2
Wang, C., and Wang, B. (2019). Tropical Cyclone Predictability Shaped by Western Pacific Subtropical High: Integration of Trans-basin Sea Surface Temperature Effects. Clim. Dyn. 53, 2697–2714.doi:10.1007/s00382-019-04651-1
Wang, C., Wu, K., Wu, L., Zhao, H., and Cao, J. (2021). What Caused the Unprecedented Absence of Western North Pacific Tropical Cyclones in July 2020? Geophys. Res. Lett. 48, doi:10.1029/2020GL092282
Wang, L., and Chen, G. (2018). Impact of the Spring SST Gradient between the Tropical Indian Ocean and Western Pacific on Landfalling Tropical Cyclone Frequency in China. Adv. Atmos. Sci. 35, 682–688.doi:10.1007/s00376-017-7078-2
Xiao, F. J., and Xiao, Z. N. (2010). Characteristics of Tropical Cyclones in China and Their Impacts Analysis. Nat. Hazards 54, 827–837.
Xie, S.-P., Hu, K., Hafner, J., Tokinaga, H., Du, Y., Huang, G., et al. (2009). Indian Ocean Capacitor Effect on Indo-Western Pacific Climate during the Summer Following El Niño. J. Clim. 22, 730–747.doi:10.1175/2008jcli2544.1
Xie, S.-P., Kosaka, Y., Du, Y., Hu, K., Chowdary, J. S., and Huang, G. (2016). Indo-western Pacific Ocean Capacitor and Coherent Climate Anomalies in post-ENSO Summer: A Review. Adv. Atmos. Sci. 33, 411–432.doi:10.1007/s00376-015-5192-6
Ying, M., Zhang, W., Yu, H., Lu, X., Feng, J., Fan, Y., et al. (2014). An Overview of the China Meteorological Administration Tropical Cyclone Database. J. Atmos. Oceanic Technol. 31, 287–301.doi:10.1175/jtech-d-12-00119.1
You, L., Gao, J., Lin, H., and Chen, S. (2019). Impact of the Intra‐seasonal Oscillation on Tropical Cyclone Genesis over the Western North Pacific. Int. J. Climatol 39, 1969–1984.doi:10.1002/joc.5927
Yu, J., Li, T., Tan, Z., and Zhu, Z. (2016). Effects of Tropical North Atlantic SST on Tropical Cyclone Genesis in the Western North Pacific. Clim. Dyn. 46, 865–877.doi:10.1007/s00382-015-2618-x
Zhan, R., Wang, Y., and Lei, X. (2011). Contributions of ENSO and East Indian Ocean SSTA to the Interannual Variability of Northwest Pacific Tropical Cyclone Frequency*. J. Clim. 24, 509–521.doi:10.1175/2010jcli3808.1
Zhang, Q., Wu, L., and Liu, Q. (2009). Tropical Cyclone Damages in China 1983-2006. Bull. Amer. Meteorol. Soc. 90, 489–496.doi:10.1175/2008bams2631.1
Zhao, C., and Li, T. (2019). Basin Dependence of the MJO Modulating Tropical Cyclone Genesis. Clim. Dyn. 52, 6081–6096.doi:10.1007/s00382-018-4502-y
Zhao, C., Ren, H. L., Eade, R., Wu, Y., Wu, J., and Maclachlan, C. (2019a). MJO Modulation and its Ability to Predict Boreal Summer Tropical Cyclone Genesis over the Northwest Pacific in Met Office Hadley Centre and Beijing Climate Center Seasonal Prediction Systems. Q.J.R. Meteorol. Soc. 145, 1089–1101.doi:10.1002/qj.3478
Keywords: absence of tropical cyclone genesis in July 2020, North Indian Ocean, sea surface temperature, monthly difference, Niño4, prediction, CFSv2
Citation: Tian B and Fan K (2021) Absence of Tropical Cyclone Genesis Over the Western North Pacific in July 2020 and Its Prediction by CFSv2. Front. Earth Sci. 9:771172. doi: 10.3389/feart.2021.771172
Received: 06 September 2021; Accepted: 05 October 2021;
Published: 15 October 2021.
Edited by:
Liguang Wu, Fudan University, ChinaReviewed by:
Chao Wang, Nanjing University of Information Science and Technology, ChinaCopyright © 2021 Tian and Fan. This is an open-access article distributed under the terms of the Creative Commons Attribution License (CC BY). The use, distribution or reproduction in other forums is permitted, provided the original author(s) and the copyright owner(s) are credited and that the original publication in this journal is cited, in accordance with accepted academic practice. No use, distribution or reproduction is permitted which does not comply with these terms.
*Correspondence: Ke Fan, ZmFuazhAbWFpbC5zeXN1LmVkdS5jbg==
Disclaimer: All claims expressed in this article are solely those of the authors and do not necessarily represent those of their affiliated organizations, or those of the publisher, the editors and the reviewers. Any product that may be evaluated in this article or claim that may be made by its manufacturer is not guaranteed or endorsed by the publisher.
Research integrity at Frontiers
Learn more about the work of our research integrity team to safeguard the quality of each article we publish.