 Yu Huang
 Hong-Li Ren
 Minghong Liu
94% of researchers rate our articles as excellent or good
Learn more about the work of our research integrity team to safeguard the quality of each article we publish.
Find out more
ORIGINAL RESEARCH article
Front. Earth Sci. , 12 October 2021
Sec. Interdisciplinary Climate Studies
Volume 9 - 2021 | https://doi.org/10.3389/feart.2021.771155
This article is part of the Research Topic The Adaptation to and Mitigation of Climate-Sensitive Natural Hazards View all 21 articles
Strong Eastern-Pacific type El Niño (EP-El Niño) events have significant impacts on the decaying-summer precipitation over East Asia (EA). It has been demonstrated that frequency of strong EP-El Niños will increase and associated precipitation will become more severe and complex under future high emission scenarios. In this study, using simulations of CMIP5 and CMIP6, changes of the summer precipitation pattern related to strong EP-El Niño during its decay phase and the possible mechanism as responding to high emission scenarios are examined. Precipitation anomaly patterns over EA of strong EP events show a large inter-model spread in historical simulations between the CMIP models where CMIP6 is not superior to CMIP5. Under high emission scenarios, changes of summer precipitation anomalies related to strong EP events tend to increase over the southern EA and decrease around the northern EA from CMIP5, while there is an overall increase in the whole EA from CMIP6. The common change is featured by the increase of precipitation over southeastern China under high emission scenarios. This could be mainly attributed to the anticyclonic circulation from the South China Sea to the western North Pacific as a delayed response to more frequent strong EP-El Niños, which favors an increase in water vapor fluxes converging into the southeastern China.
As a major factor of global warming, the change of CO2 concentration has received a number of attentions nowadays. IPCC AR5 pointed out that global mean surface air temperature (SAT) as well as sea surface temperature (SST) has been rising since industrialization, and the projected temperature tends to rise under future scenarios with different amplitudes of increases. The high temperatures and heat waves would become more severe under higher emission scenarios but with regional differences. The warmer air contains more water vapor according to the Clausius-Clapeyron equation, which would affect the global water cycle through the variation of moisture and the change of water vapor transport induced by the circulation anomaly (Richard and Brian, 2008; O’Gorman et al., 2010; Balcerak and Ernie, 2013).
In general, higher CO2 concentration tends to produce more global precipitation and regional extreme events. Compared with the representative concentration pathway (RCP) 4.5 experiment, the extreme precipitation may increase from 7 to 11% in the RCP8.5 experiment but varies with different areas and the certain areas tend to suffer from more floods or droughts (Lau et al., 2013; Li et al., 2018). It can be also projected that the precipitation variability tends to be more evident over China (Hu et al., 2017). Based on a set of SSP5-85 experiments from CMIP6, more summer precipitation tends to appear over most parts of South Asia, especially the semiarid regions (Almazroui et al., 2020). The summer precipitation anomaly over East Asia (EA) is closely connected with the location and intensity variation of the western Pacific subtropical high (WPSH), which can be further connected with synergic effects between Indian and tropical Pacific Oceans (Qian and Guan, 2018). The Hadley circulation is simulated to slightly northward expansion in response to high emission scenarios (Vallis et al., 2015), which may influence the shift of WPSH, as well as the circulation and precipitation anomalies at mid-high latitudes.
El Niño-Southern Oscillation (ENSO), as the most prominent mode of interannual climate variability in tropics, plays an important role in a series of anomalous climate events. Besides the effect on climate anomalies, ENSO has been well proved to generate extreme precipitation events (Gershunov, 1998; Cai et al., 2015). Although El Niño usually reaches its peak during wintertime and decays afterwards, SST anomaly signal can impact the precipitation anomaly in the following summer. Based on gauged data in China, the precipitation anomaly can be observed to increase over the Yangtze-Huaihe River valley during strong El Niño events in the following summer (Jin et al., 1999; Zhang et al., 1999; Wang and Feng, 2011). For example, following the strong El Niño events, the Yangtze-Huaihe River valley suffered from the catastrophic floods in the summer of 1998 and 2016.
Nitta (1987) and Huang and Li (1988) put forward an important atmospheric teleconnection pattern named Pacific-Japan (PJ) pattern or the East Asia-Pacific (EAP) teleconnection pattern, the associated convections around the Philippines and Japan are important to the eastern Asian climate. It has been proved that the positive phase of the EAP pattern is beneficial for the increasing number of typhoons that come to the land (Huang and Wang, 2010). Prior studies indicated that during strong El Niño events, the anomalous Walker circulation intensifies combined with the anomalous divergence over Maritime Continent (MC), which leads to the enhanced anticyclonic anomaly driven by the Gill-type response and also influences on WPSH (Qian and Guan, 2017). Climate variabilities induced by the regular and supper El Niño events tend to be nonlinear, which makes research more challenging. In general, the mechanisms behind the precipitation anomaly connected with the strong Eastern-Pacific type (EP) events could be complex and contributed to by many factors.
Several possible mechanisms have been proposed about how the El Niño events influence the Western North Pacific Anti-cyclone (WNPAC) and precipitation anomalies over East Asia. The anomalous anticyclone over Western North Pacific (WNP) has been widely seen to act as the critical bridge between climate anomaly over mid-latitudes and the tropical SSTA. Generally, El Niño can modulate the WNPAC during its decaying phase by impacting both the WNP local air-sea interactions through the wind-evaporation-SST feedback (Wang et al., 2000) and the remote effect from ENSO-associated moist enthalpy advection and Rossby wave (Wu et al., 2017). Besides, the El Niño-induced Indian Ocean (IO) anomaly might persist into the following summer and contribute to the maintenance of WNPAC, namely, the so-called IO capacitor effect (Yang et al., 2007; Xie et al., 2009). Moreover, recent studies proposed that in strong El Niño events, an ENSO combination mode can be derived from the nonlinear interactions between ENSO and the tropical seasonal cycle (Stuecker et al., 2013), which has been argued to play a critical role in the genesis and maintenance of WNPAC (Stuecker et al., 2015), thus contributing to the pronounced summer rainfall events in the Yangtze River basin (Zhang et al., 2016).
The ENSO could induce the global extreme weather through the nonlinear interactions from various atmospheric teleconnections. It has been proved that the change of SSTA over tropical Pacific Oceans has influence on the intensity and frequency of ENSO events. In response to higher emission scenarios, the SST would increase but with regional differences (Vecchi and Soden, 2007; Liu et al., 2017), and the walker circulation could be weakened, corresponding to the increase of SSTA for tropical Pacific, especially over the tropical eastern Pacific (EP) (Liu et al., 2005; Vecchi et al., 2006; Xie et al., 2010). It has been observed that the El Niño with the maximum warming over the eastern-equatorial Pacific, called Eastern-Pacific type El Niño (EP-El Niño), tends to be stronger than the other types. Furthermore, the EP-El Niño events show the more significant impact on the precipitation anomaly over EA, for example, the catastrophic floods in 1998 and 2016, it is valuable and necessary to figure out how the EP-El Niño events change in the future emission scenarios, and investigate the associated precipitation anomaly as well as the possible mechanisms. Further studies demonstrated that the variability of SSTA connected with EP-ENSO would increase in response to the higher emission levels, which leads to the more frequent EP-El Niño events (Cai et al., 2015; Cai et al., 2018). The recent study shows that the high CO2 concentration level could generate the most prominent SST warming over the eastern tropical Pacific, and the associated summer extreme precipitation tends to increase over the south EA (Huang et al., 2021). According to the to the Clausius-Clapeyron relationship, saturation vapor pressure increases nearly exponentially with increasing temperature, therefore, the increased water vapor responding to the temperature variability is larger under a warmer climate, and thus the cataclysmic events connected with ENSO would occur more frequently with rising CO2 concentration (Hu et al., 2021). However, the interactions between the extreme events and ENSO remain as an open question due to the larger inter-model uncertainty as the model simulations show (Cai et al., 2015).
Since the precipitation anomaly over East Asia is contributed to by various of physical mechanisms, combined with the lack of research into physical processes, the model simulations for the precipitation over EA as well as the relevant circulation anomalies, especially during summertime, are still imperfect (He and Zhou, 2014). For the future scenarios, the uncertainties from the emission levels and climate models act as important resources of future simulation uncertainty (Sun and Ding, 2010). The lasted CMIP6 can produce the models with higher resolution and is designed with the improved dynamical processes, including the improved parameterizations for cloud microphysical processes and the better design of physical processes in the earth system such as biogeochemical cycles and ice sheets, furthermore, a set of new Shared Socioeconomic Pathways (SSPs) emission scenarios are applied in CMIP6 (Eyring et al., 2019). In this study, the model performance for the summer precipitation anomaly over EA during strong EP events from CMIP5 and CMIP6 are estimated, and based on the representative models, the changes of precipitation anomaly during strong EP events in response to different emission scenarios, as well as the possible mechanisms behind the changes of precipitation anomaly in response to high emission scenarios are investigated.
The models used in this study are from CMIP5 and CMIP6. For CMIP5, we applied the monthly outputs from 27 model simulations, and 20 models are used for CMIP6 (Table 1). For both of CMIP5 and CMIP6, the historical experiments are applied as a control run. Note that the experimental designs for the historical experiments are different for the two datasets, which may lead to the inconsistent results (Nie et al., 2019). For the future emission scenario, a set of Representative Concentration Pathway (RCP) experiments are applied in CMIP5, specifically, they are RCP2.6, RCP4.5, and RCP8.5 experiments, representing the low, moderate, and the extreme emission scenario, respectively. For CMIP6, a set of Shared Socioeconomic Path (SSP) experiments are used in this study. The SSPs describe the future socioeconomic development without the interventions of climate change or climate policies and is combined with the different radiative forcings which are similar to CMIP5 (O’Neill et al., 2016). The different emission experiments are SSP1-26, SSP2-45, and SSP5-85, respectively, representing the low, medium, and high level of CO2 concentrations. As the previous studies show, the model simulations are imperfect for the results of precipitation over EA, especially during summertime, CMIP6 generally produces the models with finer resolution and the better dynamical processes.
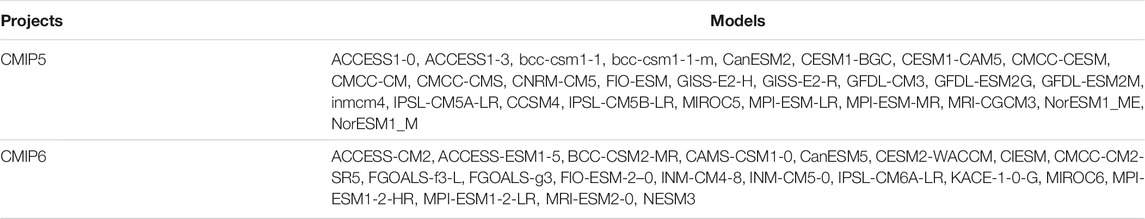
TABLE 1. The models applied in this study.
It has been observed that the strong EP-El Niño produce the anomalous precipitation around the Yangtze-Huaihe River Valley (YHRV) in the following summer, while it is usually hard to capture the features of precipitation anomalies over EA well in the models, especially in the following summer. To start with, the model simulations for precipitation anomaly during strong EP-El Niño events are estimated by comparing with the observational results, and the results for only the well-performed models are considered. The spatial correlation coefficient for domain (22–35°N, 112–122°E) and the root mean square error (RMSE) over the region (27–30°N, 112–118°E) between model simulations in the historical experiment and the observational results are calculated.
The Nino3 index can be used to effectively identify EP events, it is defined as the standardized regional averaged winter (DJF) SSTA over the Nino3 region: 90°W-150°W, 5°N-5°S. Since the background climate state would be significantly influenced by different emission scenarios, especially at high CO2 level, the Nino3 index for both CMIP5 and CMIP6 are quadratically de-trended to remove the impact from the distinct emission scenarios. The strong EP event is defined as the year the Nino3 index is greater than 1.5 standard deviation.
In reference to Huang et al. (2006), the East Asia-Pacific (EAP) teleconnection index is defined as:
Where U′ represents the standardized zonal wind anomaly at 850 hPa, and A is the regional average for domain (10–20°N, 150–130°W), B represents domain (27.5–35°N, 120–150°E), and C is for (45–52.5°N, 130–160°E).
The different terms in moisture budget can contribute to the distinction of precipitation anomalies. The moisture tendency equation can be written as:
Where q represents the specific humidity, V is the horizontal wind vector, p stands for the pressure, ω denotes the vertical pressure velocity, L and Q represent the latent heat of condensation and the atmospheric apparent moisture sink, respectively. The
Specifically, for both of the horizontal and vertical moisture transports, the first terms (
During the historical experiment, the features of precipitation anomalies are quite inconsistent with the observations as most of the model results depict (Figure 1). In reference to the model selection criteria, the models with the spatial correlation coefficient greater than 0.4 and RMSE less than 2.0 are chosen as the representative models for CMIP5. As for the CMIP6, the simulation results show the larger contrasting precipitation anomaly compared with observation (Figure 2), to guarantee the representation of the selected models, the criteria are adjusted slightly. The spatial correlation coefficient greater than 0.4 and RMSE less than 2.0 are chosen as the representative models for CMIP6. For both datasets, there are 5 models selected as the representative models as Table 2 shows.
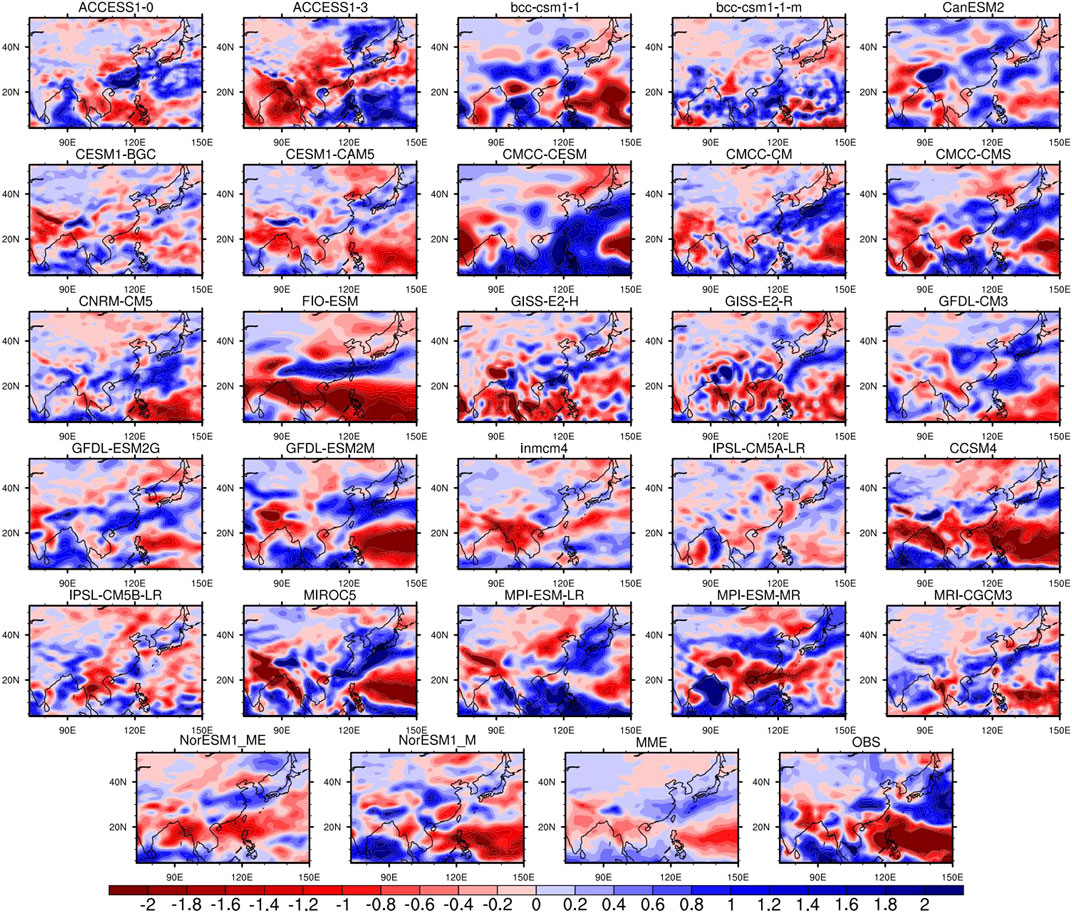
FIGURE 1. The distributions of precipitation anomaly (mm/day) during strong EP events in the following summer over East Asia for the historical experiments in CMIP5 models, their MME and corresponding observation.
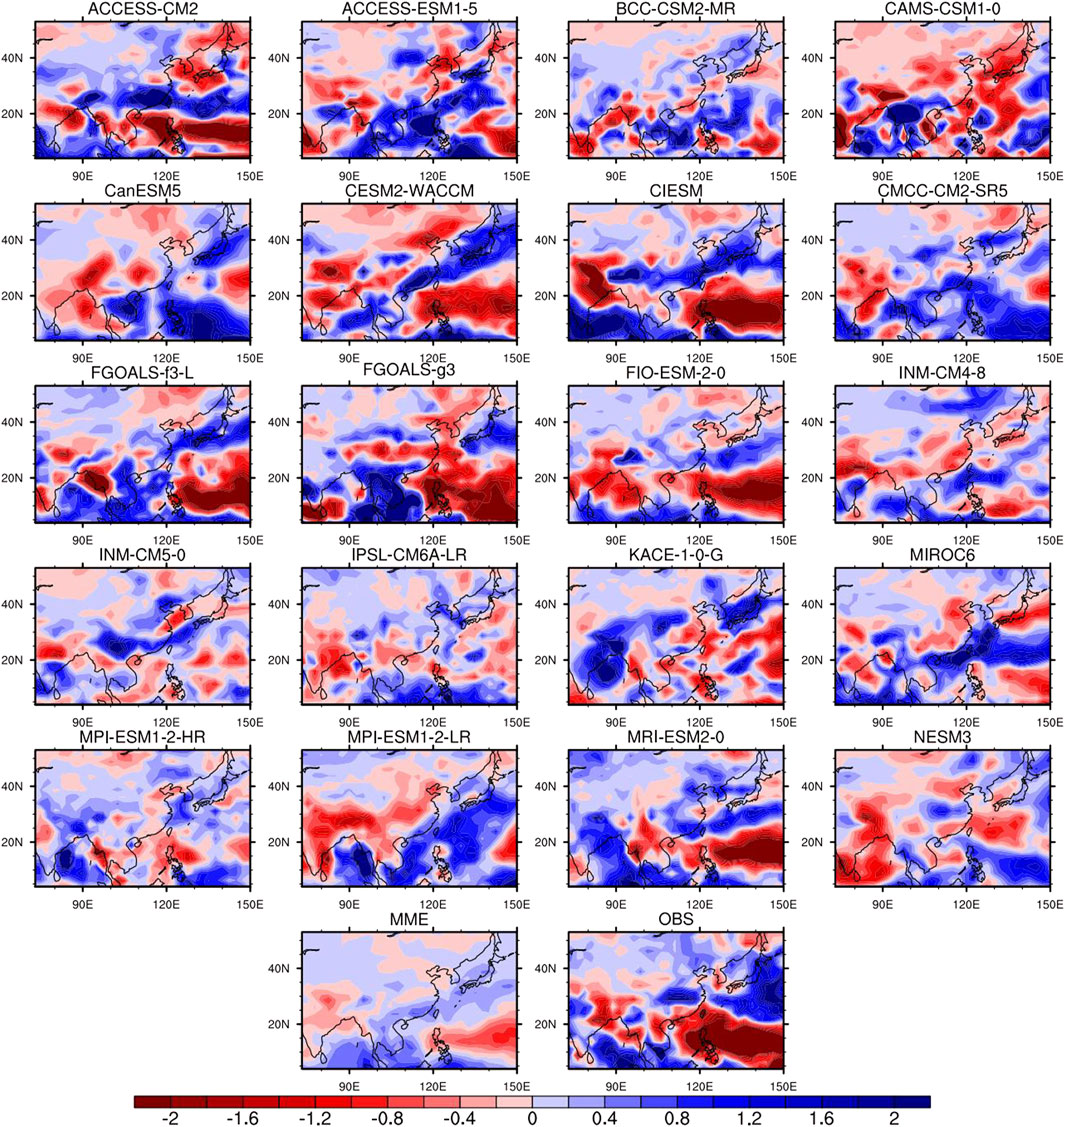
FIGURE 2. Same as Figure 1, but for the CMIP6 models.

TABLE 2. The selected representative models.
It has been demonstrated that the CMIP6 models have the relatively higher capability in producing the climate variabilities over mid and high latitudes of Asia than CMIP5 models, while there seems to be no substantial improvement for summer precipitation anomaly during strong EP events over East Asia in CMIP6. Although the higher resolution and the improved physical process are designed in CMIP6, the slightly different external forcings could lead to the inconsistent results between CMIP5 and CMIP6. Specifically, the variation of the distribution for the greenhouse gas (GHG) concentration in CMIP6 is different from CMIP5 (Meinshausen et al., 2017), furthermore, the model simulations in CMIP6 exhibit the higher sensitivity to GHG compared with CMIP5. Although the higher climate sensitivity in CMIP6 could improve the capacity for the extreme events, it may also cause the large biases and the inter-model uncertainty as the precipitation anomalies during strong EP events show (Nie et al., 2019; Almazroui et al., 2020). Here we should also notice that the future emission scenarios are different for CMIP5 and CMIP6, for example, in CMIP6 the influence from SSPs should also be considered, which could contribute to the large uncertainty for CMIP6. As the model performance in CMIP5 is generally better than CMIP6 for the precipitation anomaly during strong EP events, we mainly focus on the results from CMIP5 in this study.
The change of precipitation anomaly can be examined by taking the difference between the precipitation anomaly for the future emission scenario and historical experiments. For the three CO2 levels, the changes of the precipitation anomaly exhibit the dipole pattern with negative values over the Northern East Asia (NEA) and positive values over the Southern East Asia (SEA) for CMIP5, while it is obvious that the changes for the three emission levels show quite contrasting results in CMIP6 (Figure 3).
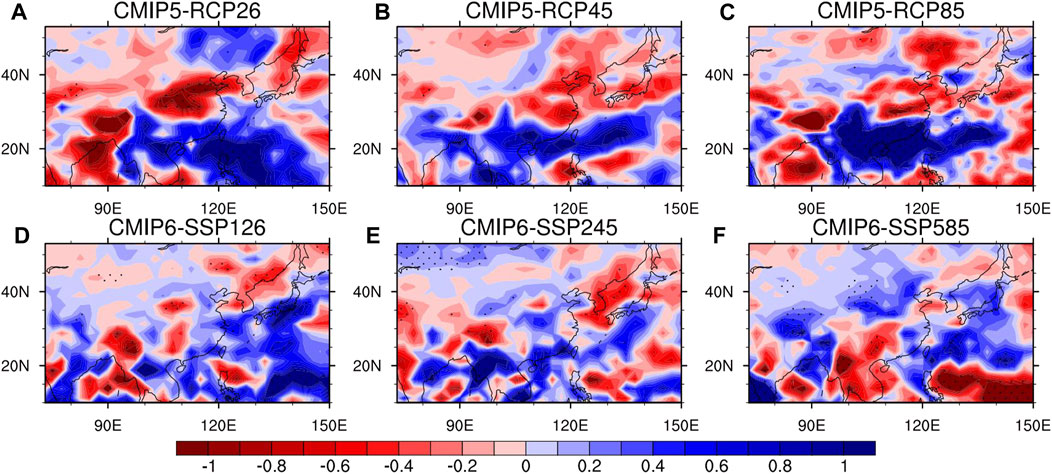
FIGURE 3. The changes for the precipitation anomalies (mm/day) during strong EP events in the following summer for the different RCPs experiments in CMIP5 (A. RCP2.6, B. RCP4.5, C. RCP8.5) and SSPs experiments in CMIP6 (D. SSP1-26, E. SSP2-45, F. SSP5-85).
It has been proved that the frequency of strong EP events tends to grow under higher emission scenarios. Here we further investigate the changes of strong EP events as well as the precipitation anomalies in response to different emission scenarios. To estimate the changes of precipitation anomaly quantitatively, the regional mean values over NEA and SEA are calculated, and the features of frequency and intensity for the strong EP events are estimated. As Figure 4 shows, the frequency and intensity for the strong EP events increase with the higher emission scenarios, and both show the most significant increase responding to RCP8.5 experiment in CMIP5, while the feature of increase of strong EP events with higher emission can hardly be seen in CMIP6. Despite that the trend features are not significant over SEA for the two datasets, the precipitation anomaly increases most significantly in response to RCP8.5 experiment in CMIP5. For NEA, the large discrepancy exists between CMIP5 and CMIP6. In general, the precipitation anomalies decrease for the three CO2 emission levels in CMIP5, while the results for CMIP6 depict the positive values, and we can also notice that the precipitation anomaly decreases with the higher CO2 levels regardless the noticeable bias exists between the two datasets. Taking the model performance into account, we can infer that the change of precipitation anomaly tends to be more remarkable with rising emission concentrations.
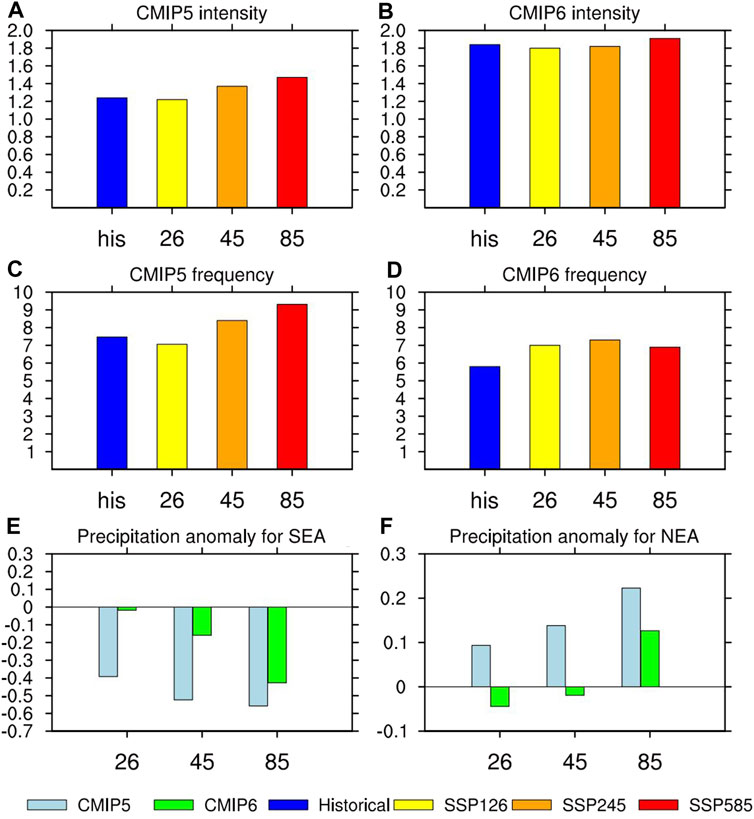
FIGURE 4. The changes of the intensities (A,B) and frequencies (C,D) for strong EP events, and the precipitation anomalies over southern East Asia (22–26°N, 115–120°E) and northern East Asia (28–32°N, 112–120°E) (E,F) responding to the different emission scenarios in CMIP5 and CMIP6.
During strong EP events in response to the highest CO2 level, the multi-model ensemble mean from CMIP5 produces the significant anomalous precipitation over SEA and the anomalous decrease exits around NEA, and we can see that the rainfall belt shifts southward compared with the historical result (Figure 5). The CMIP6 shows the wide range of inter-model uncertainty, for multi-model ensemble mean, the precipitation anomaly increases over the south and east of EA, and the dipole pattern shown in CMIP5 is not significant (Figure 6).
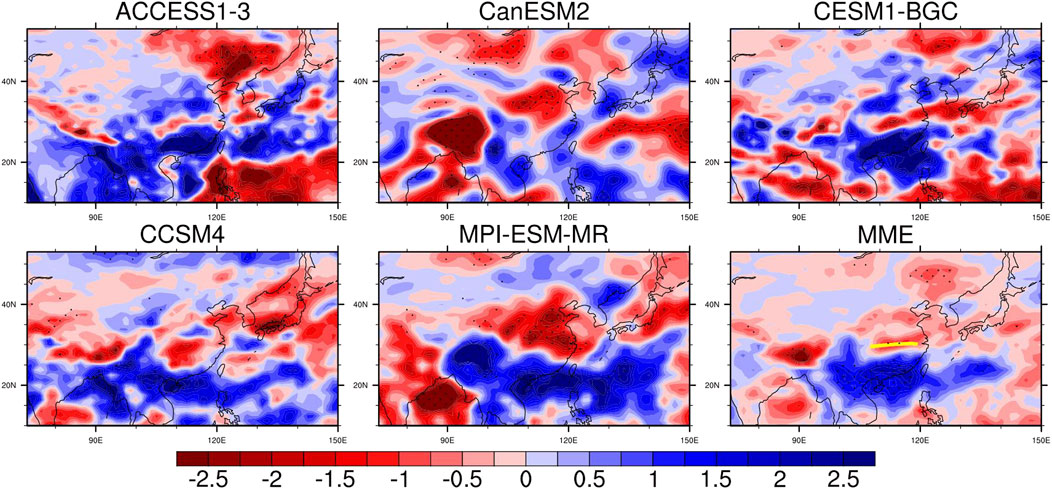
FIGURE 5. The changes of the precipitation anomaly (mm/day) during strong EP events in the following summer between the RCP8.5 and historical experiments for CMIP5 (RCP8.5-historical, the yellow curve is constituted with the maximum precipitation anomaly during strong EP events in historical experiment).
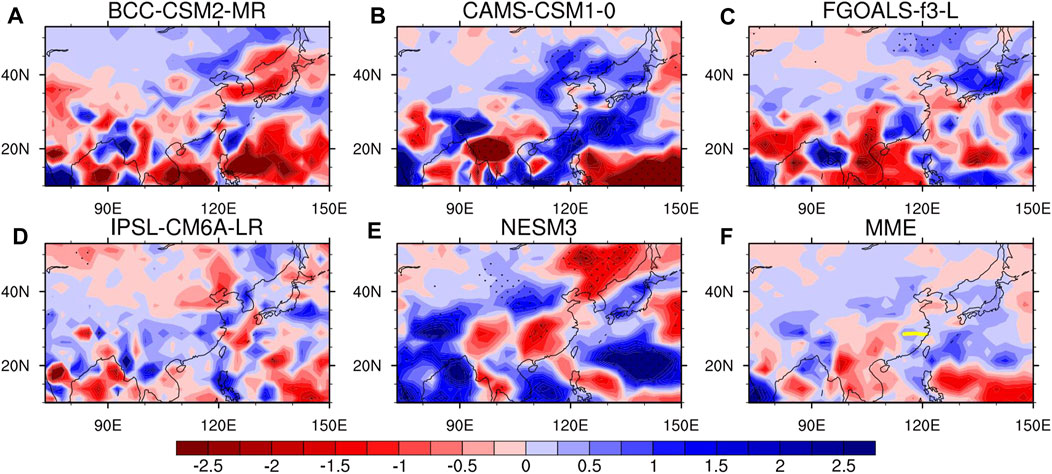
FIGURE 6. The changes of the precipitation anomaly (mm/day) during strong EP events in the following summer between the SSP5-85 and historical experiments for CMIP6 (SSP5-85-historical, the yellow curve is constituted with the maximum precipitation anomaly during strong EP events in historical experiment).
The reasons leading to the precipitation anomaly over EA is complex, and the change of East Asia summer monsoon (EASM) is crucial and needs to be taken into concentration. Under high emission scenario, the change of 850 hPa wind anomaly exhibited a tripolar pattern over EA, with the cyclonic circulation anomaly over SEA and an anticyclonic change around Bohai Sea, and a cyclonic anomaly to the north in CMIP5 Figure 7A). We can see that the change pattern is similar to the circulation anomaly connected with East Asia-Pacific (EAP) teleconnection. According to Huang et al. (2006), the EAP index (EAPI) is calculated to further estimate the change of EAP. In CMIP5, the change of EAPI is 0.56; that is to say, the EAP shows the positive pattern in response to RCP8.5 experiment during strong EP events. It has been pointed out that the positive phase of EAP tends to enhance the convection over the south of EA and produce the increase of precipitation around the southern and northern East Asia while decreasing the precipitation in the middle region (Huang et al., 1988; Xiao et al., 2002), which is consistent with the change of precipitation anomaly responding to RCP8.5 experiment as the results show. As we can see that the change of precipitation anomalies is inconsistent between CMIP5 and CMIP6, the corresponding change of 850 hPa wind anomalies also shows the large discrepancy, where the cyclonic anomaly prevails over the East Asia land areas in CMIP6. In CMIP5, the change of 850 hPa moisture flux anomaly exhibits the negative value over SEA, and it decreases around the Yangtze-Huaihe River valley, which is beneficial to increased rainfall over SEA (Figure 8A). It can be inferred that the precipitation could increase over the SEA since both CMIP5 and CMIP6 produce the circulation anomalies which are beneficial to the increased precipitation anomaly over the SEA, while the relatively large inconsistence is depicted around the NEA.
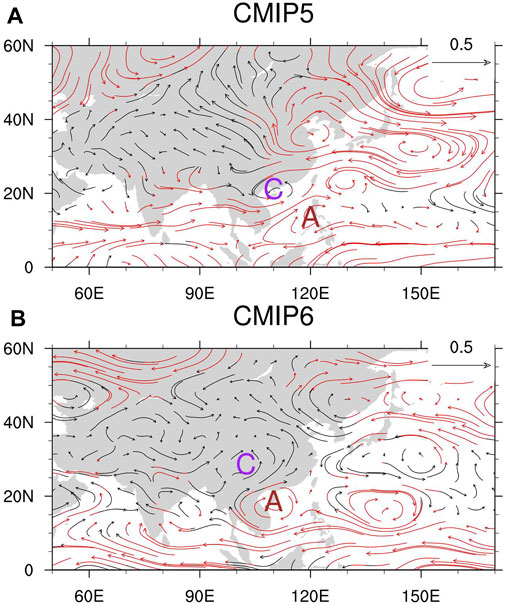
FIGURE 7. The changes of the 850 hPa U, V wind anomaly (m/s) during strong EP events in the following summer for CMIP5 (A. RCP8.5-historical) and CMIP6 (B. SSP5-85-historical) MME results, with the red vectors exceeding the 95% confidence level. Letters “A” and “C” represent the changes of anticyclone anomaly and cyclone anomaly, respectively.
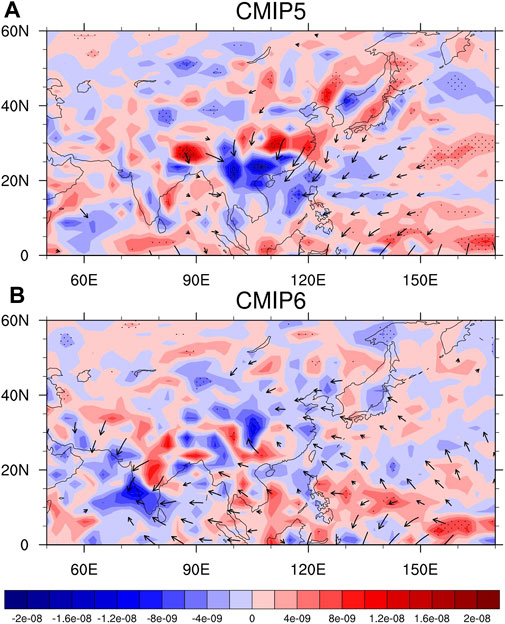
FIGURE 8. The changes of the 850 hPa moisture flux divergence anomaly (shadings, g/(m2 · s)) and moisture transport anomaly (vectors) during strong EP events in the following summer for CMIP5 (A. RCP8.5-historical) and CMIP6 (B. SSP5-85-historical) MME results.
The intensity and location of western Pacific subtropical highs (WPSH) are crucial for the location as well as the intensity of precipitation anomalies over EA in summer. Since the high emission scenario has a noticeable impact on the air temperature, as well as the geopotential height, here the change of 500 hPa stream function anomaly is investigated to figure out the change of WPSH. As Figure 9A shows, in CMIP5, the positive center of the stream function is located over the south of EA in historical experiment, which reflects the southward shift of WPSH as well as the rainfall center during strong EP events. In response to the RCP8.5 experiment, the positive center appears around The Philippines, it can be inferred that the southward shift of the precipitation anomaly is contributed to by the change of WPSH. While in CMIP6, the increasing CO2 seems to have no significant effect on the shift of the WPSH anomaly. Owning to the amount of heat transport, the change of SSTA is crucial for the change of convection and the connected circulations, especially over the tropical regions. The prevailing decrease of SSTA shows over the most parts of tropical Pacific Ocean as CMIP5 shows (Figure 9G), and may weaken the convection over the tropical regions, as well as the downdraft around the Philippines. Since the mechanisms associated with the change of WNPAC have been explained by various previous studies, the change of WNPAC as a result of both CMIP5 and CMIP6 can generate the change of precipitation anomaly over EA. It has been proved that the high emission scenario would lead to more frequent strong EP events; that is to say, the increased SSTA emerges over the eastern tropical Pacific in winter, while the SSTA decreases during the following summer. It has been confirmed that compared with the regular EP events, the SSTA in the equatorial central and eastern Pacific increases more significantly and lasts even longer during strong EP events (Lei and Xu. 2016), and the projected faster mean warming over the Maritime Continent (MC) than the central Pacific as well as the increased frequency of extreme El Niño events are conducive to the development of the extreme La Nina events (Cai et al., 2015). Although a large discrepancy is shown between CMIP5 and CMIP6, we can also see the decrease of SSTA in most parts of tropical Pacific Oceans as Figure 9 depicts. The outgoing long-wave radiation (OLR) anomaly at the top of the atmosphere can reflect the state of convection. In CMIP5, the change of OLR increases over most parts of the tropical Pacific Ocean, while it decreases around the Philippines. Furthermore, we can see that the vertical velocity at 500 hPa is enhanced enhances over SEA; that is to say, the convection enhances over the most parts of SEA, and is favorable for the positive precipitation anomaly around this area. In CMIP6, the change of convection is not remarkable leading to the inconsistence between the two datasets. As the difference of precipitation anomaly during strong EP events between CMIP6 and the observational result is large, we mainly focus on the results from CMIP5 in this study. It can be inferred that the decrease of SSTA over the tropical Pacific Ocean weakens the convection in the tropics, and on the other hand, the downdraft also weakens in the subtropical regions. To further estimate the change of vertical motion anomaly from the tropical to subtropical areas, the change of zonal mean vertical wind anomaly is investigated. Under high emission scenarios, the updraft wind over the tropical regions and the downdraft in the subtropics weaken as expected. Here the meridional mean of vertical wind over 10–20°N is also calculated, and the result shows the intensified updraft in the subtropical regions, which is probably caused by the weakened circulation anomaly in the tropical regions connected with the decrease of SSTA (Figure 10).
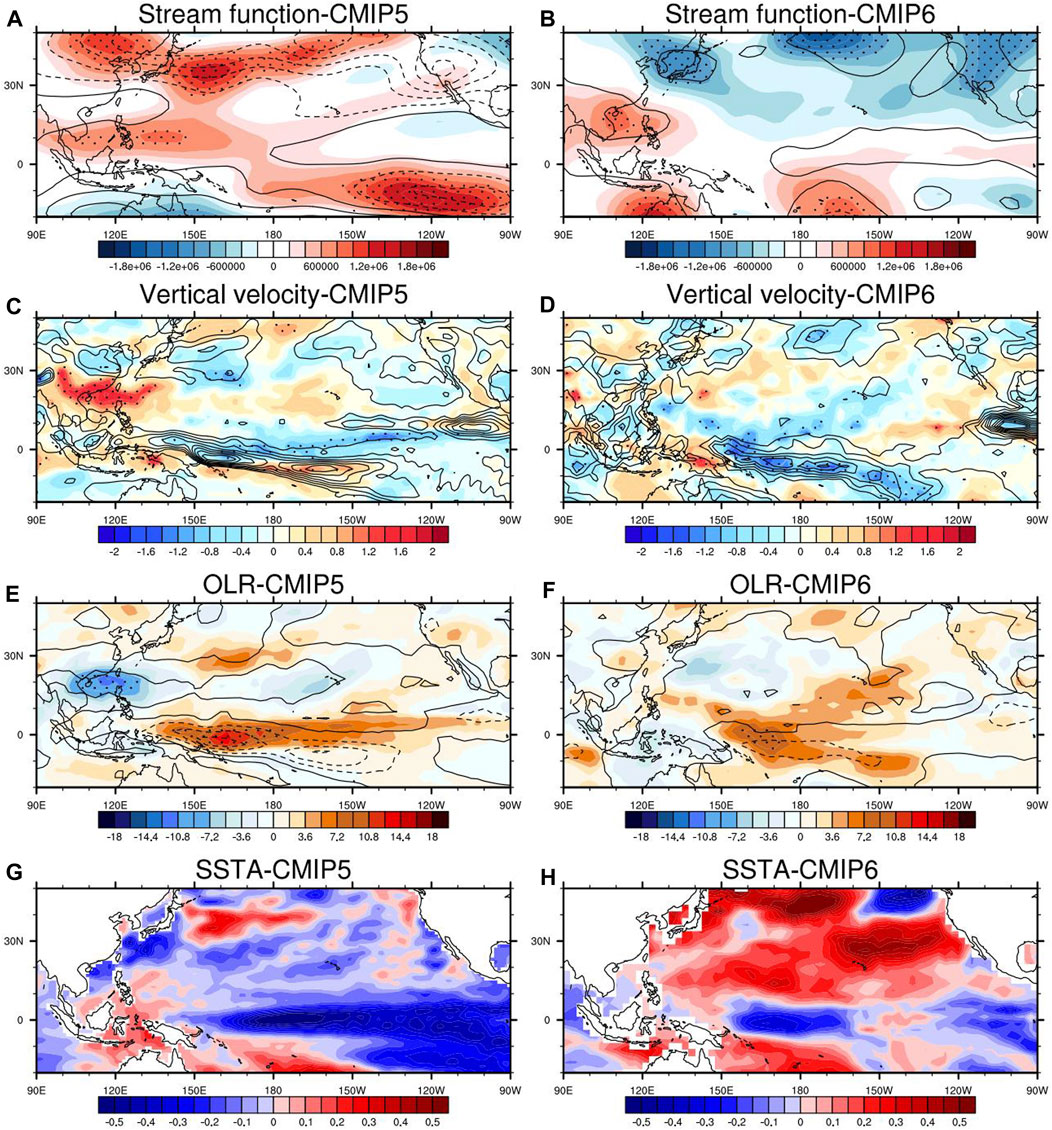
FIGURE 9. The changes of the 850 hPa stream function anomaly (kg/s), the 500 hPa vertical velocity anomaly (kg/s), the OLR anomaly (W/m2), and the SSTA (D, °C) during strong EP events in the following summer for CMIP5 (A, C, E, G. RCP8.5-historical) and CMIP6 (B, D, F, H. SSP5-85-historical) MME results.
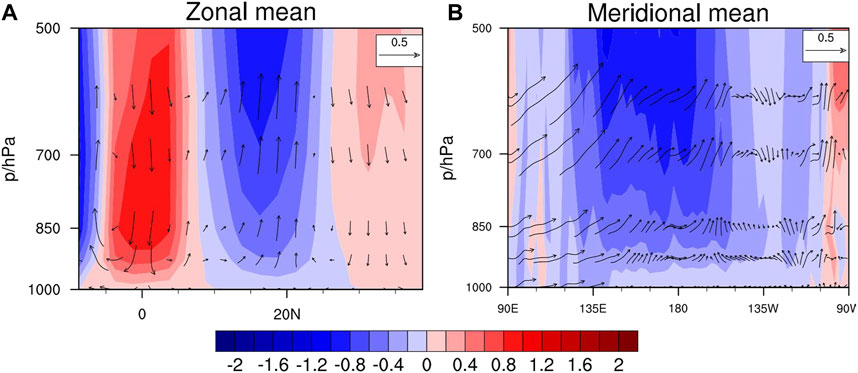
FIGURE 10. The changes of the (A) zonal mean (120–180°E) and (B) meridional mean (10–20°N) vertical wind anomaly (m/s) during strong EP events in the following summer (vectors are for the changes of wind anomaly, and the shadings are for the anomalies in historical experiment).
In reference to the section of methods, the water vapor transports contributed to the formation of precipitation are analyzed. Figure 11 shows the vertically integrated moisture budget from 1000 to 500 hPa for each term in CMIP5. We can see that the first and fourth terms exhibit the relatively more remarkable contribution. The first term has the significant effect on the negative contribution for most parts of land regions, and the fourth term plays an important role in the positive contribution of precipitation. The regional mean values over SEA and NEA are calculated to estimate each term quantitatively (Figure 12). As the results show, the combination effect from the horizontal circulation in the historical experiment and the change of moisture anomaly between two experiments could lead to the increased precipitation over SEA, while the term combined with the change of horizontal circulation anomaly and the water vapor for historical state may contribute to the negative moisture transport for NEA. It can be inferred that in the following summer, the change of moisture anomaly or the thermal effect is more crucial for the formation of precipitation anomalies over SEA.
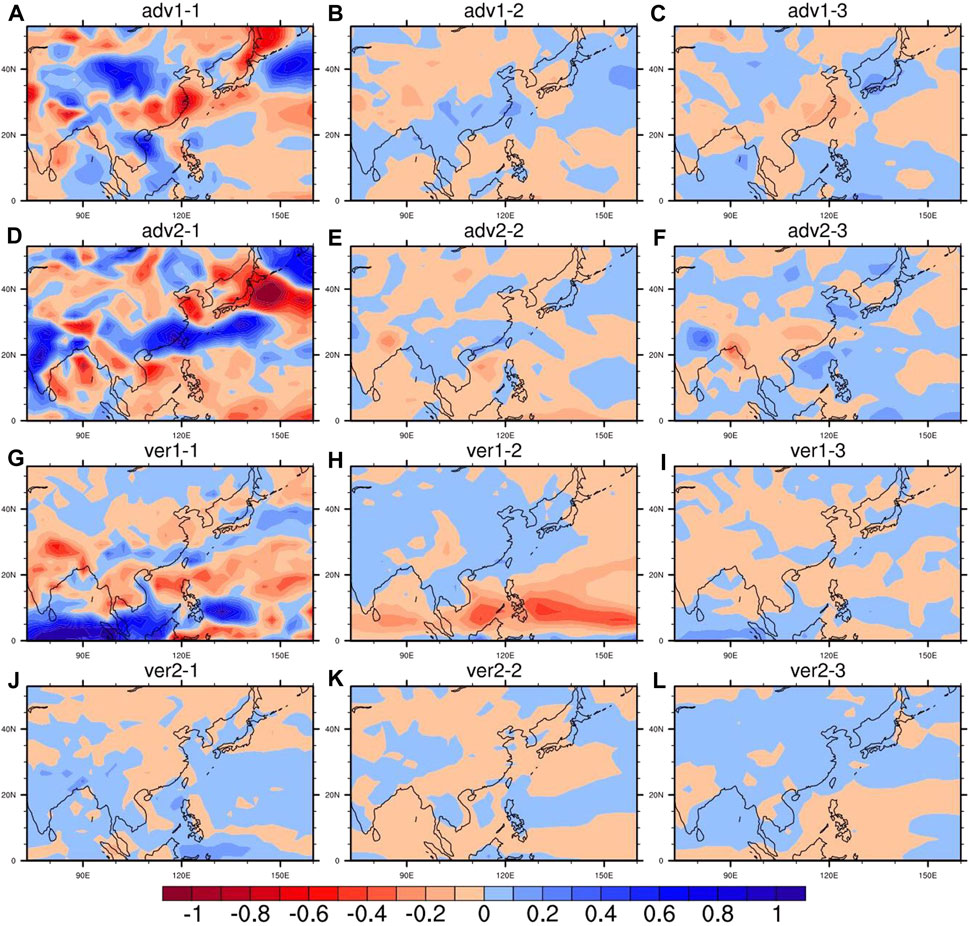
FIGURE 11. The MME changes of the moisture budget for different terms (A)
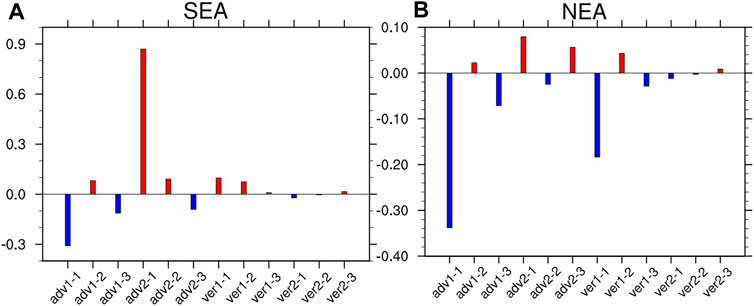
FIGURE 12. The regional averaged moisture budget for each term (adv1-1,
The CO2 concentration is observed to rise since the industrialization began. The increase of CO2 concentration not only leads to global warming but possibly has an impact on climate variability. The precipitation anomaly over EA is proved to be influenced by various factors and is a challenging issue. EP events have a significant impact on the precipitation anomaly over EA, therefore it is necessary to investigate the precipitation anomaly associated with the EP events responding to the future emission scenarios. It has been observed that the frequency and intensity of strong EP events tend to increase under future high emission scenarios, and the associated precipitation anomaly would become more severe and complex in the following summer. Based on a set of RCPs and SSPs experiments from CMIP5 and CMIP6, the precipitation anomaly pattern related to strong EP events during its decay phase and the possible mechanism were explored, the results in this study can be concluded as follows:
The model simulations for the precipitation anomaly during strong EP events in the following summer show the relatively large inconsistencies between the observational result and historical experiment in CMIP5 and CMIP6. In general, the result for CMIP6 could be not as satisfying as CMIP5. Although the improvements of model resolution and dynamical process have been added to CMIP6, the higher climate sensitivity in CMIP6 could also cause the large biases and the inter-model uncertainty, especially over East Asia as the results show, where the precipitation anomaly is influenced by various factors. The models available for CMIP5 and CMIP6 are considered in this study. However, considering that the experimental designs are inconsistent for CMIP5 and CMIP6, in addition, the model capacities for both CMIP5 and CMIP6 were estimated, and the well-performed models are different in CMIP5 and CMIP6. The representative models should give the more precise results, therefore the selected models are different between two datasets, though the different models may lead to different results.
The frequency of strong EP events and the change of precipitation anomalies over SEA tend to increase with higher CO2 concentrations. In response to high emission scenarios, the precipitation anomaly associated with the strong EP events increases over SEA while it decreases around NEA in the following summer, and the anomalous precipitation moves southward compared with the historical experiment as shown in CMIP5. The results for CMIP6 show the large inter-model uncertainty but the positive precipitation anomaly can also be seen in SEA.
During strong EP events in the following summer, the 850 hPa wind shows the cyclonic anomaly over SEA, and the positive EAP pattern is also beneficial to the anomalous precipitation over SEA and the anomalous decrease in precipitation in NEA as the change of precipitation anomaly shows. The possible connections between El Niño and the anticyclone anomaly around The Philippines have been discussed from the previous studies, and the WNPAC is demonstrated to be crucial for the precipitation anomaly in East-Asian regions (Zhang et al., 1999; Wang et al., 2000; Xie et al., 2009). It is worth noting that for both CMIP5 and CMIP6, the SSTA depicts the remarkable negative value over most parts of tropical Pacific Ocean areas, which could be related to the weakened convection in the tropics and the downdraft around subtropical regions, leading to the southward shift to WPSH as well as the precipitation anomaly in the following summer as the results in CMIP5 and CMIP6 show. The change of moisture budget indicates the important contribution of the thermal effect on the increase of precipitation anomaly over SEA, and the change of circulation anomaly is unfavorable for the formation of precipitation in NEA.
It is obvious that the large uncertainty exists over the model simulations in CMIP6, for both the change of precipitation anomaly and the connected mechanisms, also, the model capacity for the precipitation anomaly during strong EP events seems to be no improvement for CMIP6. However, there is a possibility that the results may be produced more exactly with experimental design for CMIP6, since the CMIP6 take the different shared economic paths with distinct economic developments into account, which could produce the more comprehensive results, while the uncertainty of future emission and the multifactorial assessment could also drive the large inter-model spread as the results show. It can also be noticed that during strong EP events in the following summer the SSTA decreases over most parts of tropical Pacific Ocean, especially over the eastern equatorial Pacific. It is pointed out that the increased frequency of extreme El Niño events is in turn conducive to the occurrence of extreme La Nina events. This can be understood as the process of the shoaling tropical Pacific thermocline following the extreme El Niño, which increases the upper ocean vertical temperature gradient and produces the stronger discharged state, and is favorable for the increased frequency of extreme La Nina (Jin, 1997; Cai et al., 2015). However, owing to the complex physical mechanisms and the imperfect model simulations, the connected reasons still need further study.
Publicly available datasets were analyzed in this study. This data can be found here: https://esgf-node.llnl.gov/search/cmip5/; https://esgf-node.llnl.gov/search/cmip6/.
H-LR provides the idea and written methods, YH processes data and writes the manuscript, and ML investigates the related mechanism issues. All the three authors proofread this manuscript.
The study is jointly sponsored by the China National Science Foundation under Grant 41975094, and the National Key Research and Development Program on Monitoring, Early Warning and Prevention of Major Natural Disaster (2017YFC1502302, 2018YFC1506000).
The authors declare that the research was conducted in the absence of any commercial or financial relationships that could be construed as a potential conflict of interest.
All claims expressed in this article are solely those of the authors and do not necessarily represent those of their affiliated organizations, or those of the publisher, the editors and the reviewers. Any product that may be evaluated in this article, or claim that may be made by its manufacturer, is not guaranteed or endorsed by the publisher.
Almazroui, M., Saeed, S., Saeed, F., Islam, M. N., and Ismail, M. (2020). Projections of Precipitation and Temperature Over the South Asian Countries in CMIP6. Earth Syst. Environ. 4 (2), 297–320. doi:10.1007/s41748-020-00157-7
Balcerak, E. (2013). Statistically Linking Extreme Precipitation to Global Warming. Eos Trans. AGU 94 (41), 372. doi:10.1002/2013eo410016
Cai, W., Santoso, A., Wang, G., Yeh, S.-W., An, S.-I., Cobb, K. M., et al. (2015). ENSO and Greenhouse Warming. Nat. Clim. Change 5, 849–859. doi:10.1038/nclimate2743
Cai, W., Wang, G., Dewitte, B., Wu, L., Santoso, A., Takahashi, K., et al. (2018). Increased Variability of Eastern Pacific El Niño Under Greenhouse Warming. Nature 564, 201–206. doi:10.1038/s41586-018-0776-9
Eyring, V., Cox, P. M., Flato, G. M., Gleckler, P. J., Abramowitz, G., Caldwell, P., et al. (2019). Taking Climate Model Evaluation to the Next Level. Nat. Clim Change 9, 102–110. doi:10.1038/s41558-018-0355-y
Gershunov, A. (1998). ENSO Influence on Intraseasonal Extreme Rainfall and Temperature Frequencies in the Contiguous US: Implications for Long-Range Predictability. J. Clim. 11, 3192–3203. doi:10.1175/1520-0442(1998)011<3192:EIOIER>2.0.CO;2
He, C., and Zhou, T. (2014). Responses of the Western North Pacific Subtropical High to Global Warming under RCP4.5 and RCP8.5 Scenarios Projected by 33 CMIP5 Models: The Dominance of Tropical Indian Ocean-Tropical Western Pacific SST Gradient. J. Clim. 28, 365–380. doi:10.1175/JCLI-D-13-00494.1
Hu, K., Huang, G., Huang, P., Kosaka, Y., and Xie, S.-P. (2021). Intensification of El Niño-Induced Atmospheric Anomalies Under Greenhouse Warming. Nat. Geosci. 14, 377–382. doi:10.1038/s41561-021-00730-3
Huang, R. H., and Li, W. J. (1988). Influence of Heat Source Anomaly Over the Western Tropical Pacific on the Subtropical High over East Asia and its Physical Mechanism. Chin. J. Atmos. Sci. 12 (s1), 107–116.
Huang, R. H., and Wang, L. (2010). Interannual Variation of the Landfalling Locations of Typhoons in China and its Association with the Summer East Asia/Pacific Pattern Teleconnection. Chin. J. Atmos. Sci. (in Chinese) 34 (5), 853–864. doi:10.3724/SP.J.1037.2010.00186
Huang, R. H., Chen, J. L., Huang, G., and Zhang, Q. L. (2006). The Quasi-Biennial Oscillation of Summer Monsoon Rainfall in China and its Cause. Chin. J. Atmos. Sci. 30 (4), 546–560. doi:10.1063/1.3187794
Huang, Y., Ren, H. L., Chadwick, R., and Deng, Yi. (2021). Decomposition of Projected Summer Rainfall Change over East Asia Based on Timeslice Experiments. Clim. Dyn. 56 (5), 2531–2549. doi:10.1007/s00382-020-05602-x
Jin, Z. H., and Tao, S. Y. (1999). A Study on the Relationships between ENSO Cycle and Rainfalls during Summer and winter in Eastern China. Chin. J. Atmos. Sci. 23 (6), 663–672.
Jin, F.-F. (1997). An Equatorial Ocean Recharge Paradigm for ENSO. Part I: Conceptual Model. J. Atmos. Sci. 54, 811–829. doi:10.1175/1520-0469(1997)054<0811:aeorpf>2.0.co;2
Lau, W. K.-M., Wu, H.-T., and Kim, K.-M. (2013). A Canonical Response of Precipitation Characteristics to Global Warming from CMIP5 Models. Geophys. Res. Lett. 40 (12), 3163–3169. doi:10.1002/grl.50420
Li, W., Jiang, Z., Zhang, X., Li, L., and Sun, Y. (2018). Additional Risk in Extreme Precipitation in China from 1.5 °C to 2.0 °C Global Warming Levels. Sci. Bull. 63 (4), 228–234. doi:10.1016/j.scib.2017.12.021
Liu, Z., Vavrus, S., He, F., Wen, N., and Zhong, Y. (2005). Rethinking Tropical Ocean Response to Global Warming: The Enhanced Equatorial Warming. J. Clim. 18, 4684–4700. doi:10.1175/jcli3579.1
Meinshausen, M., Vogel, E., Nauels, A., Lorbacher, K., Meinshausen, N., Etheridge, D. M., et al. (2017). Historical Greenhouse Gas Concentrations for Climate Modelling (CMIP6). Geosci. Model. Dev. 10 (5), 2057–2116. doi:10.5194/gmd-10-2057-2017
Nie, Y., Li, L., Tang, Y., and Wang, B. (2019). Impacts of Changes of External Forcings from CMIP5 to CMIP6 on Surface Temperature in FGOALS-G2. SOLA 15, 211–215. doi:10.2151/sola.2019-038
Nitta, T. (1987). Convective Activities in the Tropical Western Pacific and Their Impact on the Northern Hemisphere Summer Circulation. J. Meteorol. Soc. Jpn. 65, 373–390. doi:10.2151/jmsj1965.65.3_373
O’Gorman, P. A., and Muller, C. J. (2010). How Closely Do Changes in Surface and Column Water Vapor Follow Clausius-Clapeyron Scaling in Climate Change Simulations. Environ. Res. Lett. 5 (2), 025207. doi:10.1088/1748-9326/5/2/025207
O’Neil, B. C., Tebaldi, C., van Vuuren, D. P., Eyring, V., Friedlingstein, P., Hurtt, G., et al. (2016). The Scenario Model Intercomparison Project (ScenarioMIP) for CMIP6. Geoscientific Model. Develop. 9 (9), 3461–3482. doi:10.5194/gmd-9-3461-2016
Qian, D. L., and Guan, Z. Y. (2017). Different Features of Super and Regular El Niño Events and Their Impacts on the Variation of the West Pacific Subtropical High. Acta Meteorologica Sinica 76 (3), 394–407. doi:10.11676/qxxb2018.011
Richard, P. A., and Brian, J. S. (2008). Atmospheric Warming and the Amplification of Precipitation Extremes. Science 321 (5895), 1481–1484. doi:10.1126/science.1160787
Stuecker, M. F., Timmermann, A., Jin, F.-F., McGregor, S., and Ren, H.-L. (2013). A Combination Mode of the Annual Cycle and the El Niño/Southern Oscillation. Nat. Geosci. 6, 540–544. doi:10.1038/ngeo1826
Stuecker, M. F., Jin, F.-F., Timmermann, A., and McGregor, S. (2015). Combination Mode Dynamics of the Anomalous Northwest Pacific Anticyclone*. J. Clim. 28 (3), 1093–1111. doi:10.1175/jcli-d-14-00225.1
Sun, Y., and Ding, Y. H. (2010). A Projection of Future Changes in Summer Precipitation and Monsoon in East Asia. Sci. China Earth Sci. 53 (002), 284–300. doi:10.1007/s11430-009-0123-y
Vallis, G. K., Zurita-Gotor, P., Cairns, C., and Kidston, J. (2015). Response of the Large-Scale Structure of the Atmosphere to Global Warming. Q.J.R. Meteorol. Soc. 141, 1479–1501. doi:10.1002/qj.2456
Vecchi, G. A., and Soden, B. J. (2007). Global Warming and the Weakening of the Tropical Circulation. J. Clim. 20 (17), 4316–4340. doi:10.1175/jcli4258.1
Vecchi, G. A., Soden, B. J., Wittenberg, A. T., Held, I. M., Leetmaa, A., and Harrison, M. J. (2006). Weakening of Tropical Pacific Atmospheric Circulation Due to Anthropogenic Forcing. Nature 441, 73–76. doi:10.1038/nature04744
Wang, B., Wu, R., and Fu, X. (2000). Pacific-east Asian Teleconnection: How Does ENSO Affect East Asian Climate. J. Clim. 13 (9), 1517–1536. doi:10.1175/1520-0442(2000)013<1517:peathd>2.0.co;2
Wang, B., Xiang, B., and Lee, J.-Y. (2013). Subtropical High Predictability Establishes a Promising Way for Monsoon and Tropical Storm Predictions. Proc. Natl. Acad. Sci. 110 (8), 2718–2722. doi:10.1073/pnas.1214626110
Wu, B., Zhou, T., and Li, T. (2017). Atmospheric Dynamic and Thermodynamic Processes Driving the Western North Pacific Anomalous Anticyclone during El Niño. Part II: Formation Processes. J. Clim. 30 (23), 9637–9650. doi:10.1175/jcli-d-16-0495.1
Xiao, Z. N., Yan, H. M., and Chong-Yin, L. I. (2002). The Relationship between Indian Ocean Ssta Dipole Index and the Precipitation and Temperature over china. J. Trop. Meteorology 18, 335–344. doi:10.16032/j.is.sn.1004-4965.2002.04.006
Xie, S.-P., Hu, K., Hafner, J., Tokinaga, H., Du, Y., Huang, G., et al. (2009). Indian Ocean Capacitor Effect on Indo-Western Pacific Climate during the Summer Following El Niño. J. Clim. 22, 730–747. doi:10.1175/2008JCLI2544.1
Xie, S.-P., Deser, C., Vecchi, G. A., Ma, J., Teng, H., and Wittenberg, A. T. (2010). Global Warming Pattern Formation: Sea Surface Temperature and Rainfall*. J. Clim. 23 (4), 966–986. doi:10.1175/2009jcli3329.1
Yang, J., Liu, Q., Xie, S.-P., Liu, Z., and Wu, L. (2007). Impact of the Indian Ocean SST Basin Mode on the Asian Summer Monsoon. Geophys. Res. Lett. 34, L02708. doi:10.1029/2006GL028571
Zhang, R., Sumi, A., and Kimoto, M. (1999). A Diagnostic Study of the Impact of El Niño on the Precipitation in China. Adv. Atmos. Sci. 16 (2), 229–241. doi:10.1007/bf02973084
Keywords: strong EP-El Niño events, east-asian summer precipitation, high emission scenarios, anticyclonic circulation, moisture budget
Citation: Huang Y, Ren H-L and Liu M (2021) Change of East-Asian Summer Precipitation Associated With Strong El Niño Under the Future Emission Scenarios. Front. Earth Sci. 9:771155. doi: 10.3389/feart.2021.771155
Received: 06 September 2021; Accepted: 22 September 2021;
Published: 12 October 2021.
Edited by:
Anning Huang, Nanjing University, ChinaReviewed by:
Liantong Zhou, Institute of Atmospheric Physics (CAS), ChinaCopyright © 2021 Huang, Ren and Liu. This is an open-access article distributed under the terms of the Creative Commons Attribution License (CC BY). The use, distribution or reproduction in other forums is permitted, provided the original author(s) and the copyright owner(s) are credited and that the original publication in this journal is cited, in accordance with accepted academic practice. No use, distribution or reproduction is permitted which does not comply with these terms.
*Correspondence: Hong-Li Ren, cmVuaGxAY21hLmdvdi5jbg==
Disclaimer: All claims expressed in this article are solely those of the authors and do not necessarily represent those of their affiliated organizations, or those of the publisher, the editors and the reviewers. Any product that may be evaluated in this article or claim that may be made by its manufacturer is not guaranteed or endorsed by the publisher.
Research integrity at Frontiers
Learn more about the work of our research integrity team to safeguard the quality of each article we publish.