 Wenjian Hua
 Xuan Dong
 Qingyuan Liu
 Liming Zhou3
 Haishan Chen
 Shanlei Sun
94% of researchers rate our articles as excellent or good
Learn more about the work of our research integrity team to safeguard the quality of each article we publish.
Find out more
ORIGINAL RESEARCH article
Front. Earth Sci., 03 November 2021
Sec. Interdisciplinary Climate Studies
Volume 9 - 2021 | https://doi.org/10.3389/feart.2021.770826
This article is part of the Research TopicThe Adaptation to and Mitigation of Climate-Sensitive Natural HazardsView all 21 articles
Regional climate models with high-resolution simulation are particularly useful for providing a detailed representation of land surface processes, and for studying the relationship between land surface processes and heat events. However, large differences and uncertainties exist among different land surface schemes (LSSs). This study comprehensively assesses the sensitivity to different LSSs based on two extreme heat events in eastern China using the Weather Research and Forecasting (WRF) model. Among the five LSSs (i.e., 5TD, CLM4, Noah, Noah-MP and RUC), Noah is closest to observations in reproducing the temperatures and energy fluxes for both two heat events. The modeled warm biases result mainly from the underestimation of evapotranspirative cooling. Our results show that how each LSS partitions the evapotranspiration (ET) and sensible heat largely determines the relationship between the temperature and turbulent fluxes. Although the simulated two extreme heat events manifest similar biases in the temperatures and energy fluxes, the land surface responses (ET and soil moisture) are different.
Extreme heat events, such as hot days, heat waves or multi-day heat events, have become more frequent over a large majority of global land areas under global warming (Hartmann et al., 2013), and have drawn an increasing amount of attention (e.g., Beniston, 2004; García-Herrera et al., 2010; Barriopedro et al., 2011; Trenberth and Fasullo, 2012). Extreme heat events have significant impacts on society and ecosystems. For instance, the mega European heat wave of 2003 and the Russian heat wave of 2010 caused many types of heat-related illnesses and more than 80,000 deaths (WMO, 2013). Hence, understanding the nature and cause of extreme heat events and improving the ability of its prediction and projection are of significant societal, economic and environmental importance.
Many studies have explored regional changes in extreme heat events (Hartmann et al., 2013, also see their citations). In eastern China, the rapid increase in summer warm extremes has been documented in recent years (Sun, 2014; Zhou et al., 2014; Freychet et al., 2017; Chen et al., 2019; Zhou et al., 2019). Multi-day heat events are often directly associated with large-scale atmospheric anticyclonic circulation anomalies that produce prolonged hot conditions at the surface (e.g., Wang et al., 2016). However, the causes of long-term changes in the persistence of the quasi-stationary anticyclonic circulation anomalies are very complex. The rapid increase in the intensity of summer heat waves was attributed to anthropogenic influences (Sun et al., 2014; Stott, 2016; Ma S. et al., 2017; Hua et al., 2021). External SST forcing and internal atmospheric variability also contribute to the changes of summer heat waves (Arblaster and Alexander 2012; Chen and Zhou, 2018; Deng et al., 2019; Liu et al., 2019). Furthermore, warm extremes can be amplified by pre-existing dry soil conditions, and the persistence of soil moisture anomalies (Fischer et al., 2007a; Lorenz et al., 2010; Seneviratne et al., 2010; Zhang and Wu, 2011). The amplification of soil moisture-temperature feedbacks was suggested to modulate the duration of extreme summer heat waves (Hirschi et al., 2011). Given that the summer warm extremes were felt more profoundly in urban areas of eastern China, urban warming also contributed to the intensity of heat waves (Zhou et al., 2004; Yang et al., 2017a; Wang et al., 2017).
Regional climate models (RCMs) are particularly useful tools for studying extreme heat events. RCMs could produce high horizontal resolutions, that provide additional details beyond global reanalysis or climate simulations and realistically describe refined atmospheric and land surface processes and features (Feser et al., 2011). For example, an increase in RCM resolution (e.g., from 50 to 12 km) does enable better simulation of warm extremes (Seneviratne et al., 2012; Vautard et al., 2013), and increases extreme wind speeds more than the mean wind speed (Pryor et al., 2012). Several factors including domain size, location, lateral boundary condition and process parameterizations also contribute to the quality of RCM results (Xue et al., 2007; Laprise, 2008; Leduc and Laprise, 2009; Kanamitsu et al., 2010; Køltzow et al., 2011; Mooney et al., 2013). Note that the errors and uncertainties of RCM are largely owing to the shortcomings in physical parameterizations, including radiation, microphysics, convection, planetary boundary layer and land surface parameterization schemes (Foley 2010; Flaounas et al., 2011; Crétat et al., 2012; Evans et al., 2012; Gianotti et al., 2012; Roy et al., 2012; Solman and Pessacg, 2012; Güttler et al., 2014; Ratna et al., 2014). Previous studies have suggested that dynamic downscaling of RCM studies, long-term climate simulations, and short-range heat weather are sensitive to land surface processes (Zeng et al., 2011; Sato and Xue, 2013; Zeng et al., 2015; Li et al., 2016). The representation of land surface processes in RCM is therefore important, particularly for simulating monsoon regions (e.g., Boone et al., 2010).
The Weather Research and Forecasting (WRF) model is a currently widely used RCM with a broad range of applications across scales ranging from air quality, wind energy and hydrological research studies (Zeng et al., 2014; Powers et al., 2017; Xia et al., 2019), especially for producing realistic simulations in the monsoon regions of eastern China. With the land surface models (LSMs) embedded in WRF, it can describe the details of land surface processes, such as diurnal cycle of temperature, features of warm extremes and also give better understanding of land surface and atmosphere coupling than other RCMs. As previous studies show that the RCM at higher resolutions can produce better simulations of extreme heat waves (Seneviratne et al., 2012) and land surface processes that affect the extreme heat events over eastern China (Yang et al., 2017a; Wang et al., 2017), it is important to know whether the WRF is able to simulate extreme heat waves with fine horizontal (e.g., grid size of 1 km) and whether such simulations depend on land surface schemes.
Considering the complexity of land-atmosphere interactions and the challenges in observing and modeling such interactions, it is extremely difficult to separate different physical processes involved in extreme heat waves and attributing the causes from various confounding contributors in the fully coupled land-atmosphere system (Zhou, 2021; Zhou et al., 2021). Here we focus on the land surface contribution via WRF simulations using different land surface schemes (LSSs) forced by the same initial and lateral boundary conditions and described by the same physical parameterizations. Doing so will help us to isolate the impacts of land surface processes while minimizing the complication of other factors.
With this in mind, the present study aims to examine the sensitivity to land surface schemes in heat events with fine-scale simulation and understand the role of land surface processes in simulating extreme heat events, rather than investigate the role of atmospheric circulation anomalies. As eastern China has experienced rapid increases in summer warm extremes in recent years, we chose two cases of extreme heat events over eastern China, including the early August 2013 and late July 2017 to explore the similarities and differences.
The Advanced Research WRF (ARW) model, version 4.0, is employed in this study to conduct high resolution simulations. As a state-of-the art regional modeling system, the WRF model has been used for weather and climate research across various spatial scales (Skamarock et al., 2008). The model domain is centered at 35°N, 110°E with a total of 481 × 361 grid points at 15 km spacing (Figure 1). This domain is optimal for modeling regional climate over China (Liang et al., 2019). In order to better simulate the regional feature and structure, we used three two-way interactive domains, the resolutions of two inner domains are 3 and 1 km (Figure 1A). The middle domain has 706 × 706 grid points with a resolution of 3 km whereas the small domain includes 802 × 802 grid points at 1 km spacing. The model consists of 42 vertical levels with a top at 50 hPa. If not otherwise specified, we focus on the outputs of the smallest domain.

FIGURE 1. (A) Model domain and terrain heights (units: m). The inner boxes represent the domains for the 3 km (d02) and 1 km (d03) resolution experiments, respectively. (B) The land cover map derived from MODIS covering the domain d03.
WRF offers an option among multiple land surface schemes that can be used to describe the heat, moisture and momentum exchange across the surface-atmosphere interface. We use five land surface schemes (LSSs) in this study (Table 1). The 5-layer thermal diffusion scheme (hereafter 5TD) is based on the same module of the mesoscale model MM5 5-layer soil temperature model (Dudhia, 1996). There are five layers with the thicknesses of 1, 2, 4, 8, and 16 cm. Below these the temperature is fixed at diurnal average. The energy budget includes radiation, sensible, and latent heat flux. The Noah land surface scheme was developed from the Oregon State University land surface model (Chen and Dudhia, 2001). The Noah predicts the temperature and moisture contents in four soil layers by using the force-restore method and includes detailed descriptions of the vegetation canopy and hydrological processes, such as the evapotranspiration, soil drainage and runoff. In particular, Noah includes an improved urban treatment that takes into account the urban emissivity properties on temperature. The Rapid Update Cycle (hereafter RUC) LSM contains energy and moisture transfer equations, together with energy and moisture budget equations for the ground surface, and uses an implicit scheme for computing the surface fluxes (Smirnova et al., 2016). The RUC LSM currently uses 9 levels (0, 1, 4, 10, 30, 60, 100, 160, and 300 cm) in soil with higher resolution near the interface with the atmosphere. The Noah-MP LSM (Niu et al., 2011) is based on the Noah model and uses multiple options for key land-atmosphere interaction processes (e.g., dynamic vegetation option). It also introduces various augmentations in the initial model (e.g., a vegetation canopy layer to calculate the canopy and ground surface temperatures separately). The Community Land Model, version 4 (CLM4, Lawrence et al., 2011) has a vertical structure of a single-layer vegetation canopy, a five-layer snowpack, and a ten-layer soil column. It contains sophisticated treatment of biogeophysics, hydrology, biogeochemistry and dynamic vegetation.
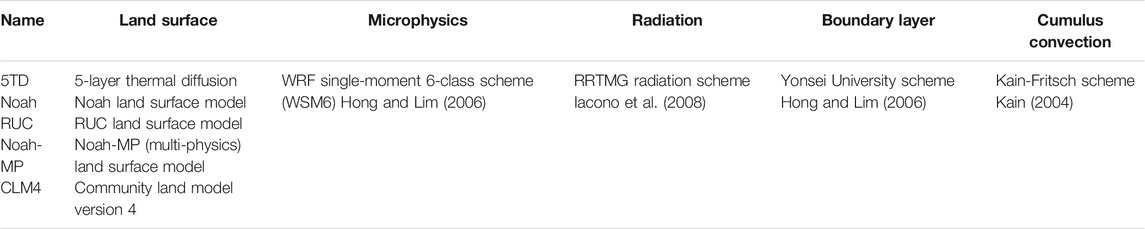
TABLE 1. Overview of the physical parameterizations used in this study. The microphysics, radiation, boundary layer and cumulus convection schemes were the same for different LSSs.
To assess the sensitivity of WRF simulations to land surface schemes in simulating the extreme heat events in eastern China, we conducted five experiments with the 5TD, Noah, RUC, Noah-MP and CLM4. All the physics options except for the LSS are the same and briefly summarized in Table 1. Differences between these simulations are mainly attributed to different parameterizations and parameters of land surface processes. The National Centers for Environmental Prediction (NCEP) Final Operational Global Analysis (FNL) data with a horizontal resolution of 1° × 1° was used as initial and boundary conditions for the WRF simulations with a time interval of 6 h. The specified boundary conditions are only used in the outmost domain. The rows and columns of the relax zone in the boundary conditions are both 4 points. The grid nudging analysis is only applied to the outmost domain to maintain stability of the boundary conditions for the nested two domains. The temperature and vapor from the FNL data are used in the grid nudging analysis, and we also apply the horizontal winds above the PBL to the grid nudging analysis.
In the summer of 2013 and 2017, extremely hot weather events occurred in eastern China, especially over the urban area of Shanghai (Zhou et al., 2019). Therefore, we chose the summer of 2013 and 2017 as two case studies. For the 2013 case, the simulations were carried out from 0000 UTC, August 6 through 0000 UTC, August 10. For the 2017 cases, the simulations were carried out from 0000 UTC, July 20 through 0000 UTC, July 24. We took the first day as a model spin-up and analyze the remaining days. We also performed the 6-day simulations for further validation and analyses and treated the first 3 days as spin-up. The modeling results are shown to be insensitive to the length of simulations and choice of the days of spin-up. Note that no special initialization procedures are used in the simulations. For all the experiments, the meteorological and land surface fields (e.g., soil moisture and temperature) are the same.
The Chinese observed daily temperature data sets from meteorological stations are collected and processed by the National Meteorological Center of the China Meteorological Administration (https://data.cma.cn). The data sets include the daily mean, maximum and minimum surface air temperature. Figure 2 shows the locations of these stations in 2013 and 2017, which are well distributed across eastern China. We also used the gridded datasets (referred to CN05.1) based on observations from more than 2,400 surface meteorological stations to provide better support for high-resolution climate change research and model validation over the Chinese region (Wu and Gao, 2013).
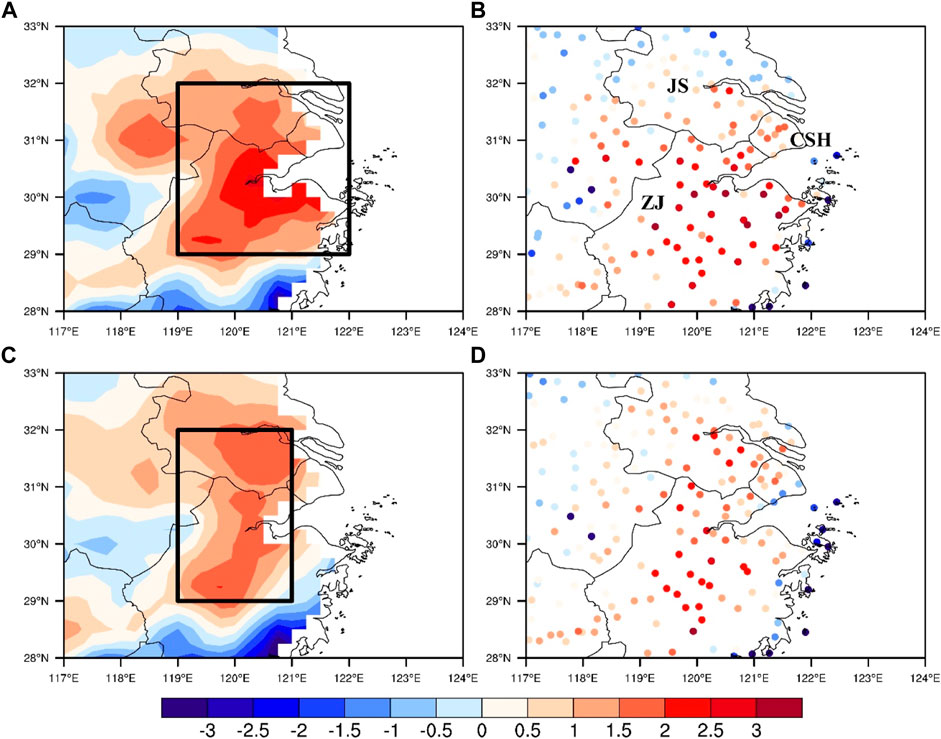
FIGURE 2. (A) Observed daily maximum air temperature anomalies (°C) in eastern China during the 2013 summer for (A) CN05.1, (B) station-based observations. (C,D) Same as (A,B), but for the summer of 2017. The abbreviations of CSH, JS, and ZJ in (B) stand for the city of Shanghai, Jiangsu and Zhejiang provinces. The outlined boxes in (A) and (C) depict the local areas for further regional analysis.
To further demonstrate the model’s capability in simulating surface energy fluxes in eastern China, we use the observed radiative fluxes (including upward and downward shortwave and longwave radiation) and clouds obtained from Clouds and the Earth’s Radiant Energy System (CERES) SYN1deg (Wielicki et al., 1996).
The satellite-based evapotranspiration (ET) and surface soil moisture products from 2003 to 2018 were derived from GLEAM (Global Land Evaporation Amsterdam Model) v3.3b (Miralles et al., 2011; Martens et al., 2017). The GLEAM v3.3b used a new data assimilation strategy and assimilated microwave soil moisture observations into GLEAM satellite-derived soil moisture, as this approach allows the correction of potential seasonal biases between the modelled and observed soil moisture states (Martens et al., 2017). The GLEAM products (e.g., ET) have been validated against eddy covariance towers worldwide (Miralles et al., 2011; Michel et al., 2016; Miralles et al., 2016). GLEAM is more consistent with daily gauge observations than other products, and shows the best consistency with point observations and basin-scale benchmark data over China (Yang et al., 2017b; Bai and Liu, 2018).
Because of the very high resolution (i.e., 1 km) of model simulations and relatively coarse resolution of CN05.1 (0.25° × 0.25°) data, the model simulations are validated against the station-based observations by converting the gridded outputs using bilinear interpolation to match the observations. Our study also compares the coarse resolution energy fluxes (1° × 1°), ET and soil moisture (0.25° × 0.25°) products with the fine-scale WRF simulations. However, the typically coarse spatial resolution fields can be significantly biased over complex and heterogeneous terrain at local scales. Furthermore, large scale systematic model biases exist in simulating heterogeneous land surface processes due to biases in lateral and lower boundary conditions derived from coarse resolution reanalysis data (Moalafhi et al., 2016). The direct comparison using absolute values does not make much sense (Zhou et al., 2012; Hua et al., 2014). Using reference values computed over the inner domain (d03, Figure 1A) for the same time period establishes a baseline from which anomalies are calculated. This effectively normalizes the data so they can be compared among the simulations from different LSMs and combined to more accurately represent the spatial patterns of fine-scale features. For these reasons, anomalies more accurately describe climate variability over larger areas than absolute temperatures do. Herein, the time series of the regional average fields over eastern China is used as the baseline. Both the modeled and observed anomaly fields are obtained by subtracting the baseline at each grid. We measure the quality of model simulations with reference to the observational data by calculating the mean bias, root mean square error (RMSE) and statistical correlation.
To examine the impacts of the two extreme heat events with regards to their land surface conditions using observed temperatures and GLEAM data from a longer time scales, we calculate the standardized anomalies of temperature, ET, soil moisture and energy fluxes for the summer of 2013 and 2017 following Xu et al. (2011). The standardized anomalies are expressed as a=(x−m)/s, where a is the standardized anomaly of a given variable (e.g., temperature, ET and soil moisture) in a specific year (2013 or 2017). x denotes the values in 2013 or 2017. m and s represent the long term mean and standard deviation over a reference period from 2003 to 2018, but excluding 2013 and 2017.
Multi-day averaged maximum temperature anomalies during the summer of 2013 are shown in Figure 2. On average, the observed daily maximum temperatures exhibit remarkable warming in the eastern areas of the study region, with largest magnitudes (>2°C) in Shanghai and north of Zhejiang province around 30°N (Figures 2A,B). For the 2017 case, the magnitude is weaker than that in 2013 (Figures 2C,D). There are two warming centers in 2017, one with a strong maximum around 29 °N and the other near Shanghai (Figures 2C,D).
For the model simulations, almost all of them show higher warming near Shanghai and north of Zhejiang province (Figure 3 and Figure 4). Despite their differences in magnitude, all the LSSs have statistically significant spatial correlations (r > 0.54, p < 0.05, n = 180, where r is the correlation coefficient and n is the sample size hereafter) with the station-based observations over eastern China. A closer inspection shows that Noah has the significant positive correlation with the reference data, with r = 0.58 (p < 0.05). For the daily mean and minimum temperatures, the simulations with Noah and Noah-MP show generally consistent spatial distributions compared with the observed fields (Supplementary Figures S1–S4). Overall, most LSSs-induced experiments manifest similar distributions, with stronger warming in north of ∼31°N latitude than south of ∼29°N latitude in Figures 3,4, but the simulations of extreme values (i.e., maximum and minimum temperatures) are very sensitive to the LSSs choice.

FIGURE 3. Multi-day averaged daily maximum surface air temperature anomalies (°C) in eastern China during the 2013 summer from five individual experiments with (A) 5TD, (B) CLM4, (C) Noah, (D) Noah-MP and (E) RUC land surface schemes.

FIGURE 4. Same as Figure 3, but for the summer of 2017.
We further examine the model performances using the quantitative bias analysis. The comparison with observation demonstrates that all the simulations show a tendency to overestimate the maximum temperature around Shanghai and south of Jiangsu province (Table 2). For the 2017 case, the bias pattern is similar to that in 2013, except that CLM4 underestimates the daytime temperatures in Shanghai (Supplementary Figures S5,S6). We also examine the biases in the daily mean and minimum temperatures (Supplementary Figures S7–S10). All the simulations basically overestimate the temperatures over the west of east China, but underestimate the temperature fields in Shanghai. Table 2 shows the statistics for spatially averaged temperatures and diurnal temperature range (DTR) for the two summer heat events in eastern China. Basically, Noah shows the least biases and RMSE in describing the maximum, minimum, mean temperatures and DTR against the observational data relative to the other LSMs. Thus, Noah outperforms other LSSs for the temperature fields.
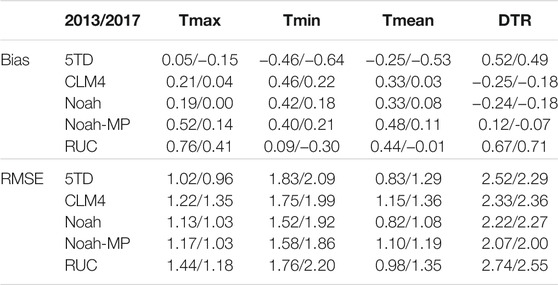
TABLE 2. Statistics for the mean biases and RMSE for the spatially averaged temperature (°C) and DTR (°C) from the model simulations against the observational data for the 2013 and 2017 cases. The study regions are outlined in Figure 2.
Note that various LSSs can produce different surface energy budgets that further affect the simulated temperature fields. We next assess the model’s performance in simulating the surface radiative fluxes against satellite observations from the CERES. We focus on the areal mean of the study region over eastern China (Figure 2A), as the CERES relatively has the lower spatial resolution compared to the model outputs. Note that model errors (i.e., RMSE) are typically higher for DTR, indicating that the representation of the diurnal cycle remains a long-standing issue in current models (Zhou et al., 2009; Zhou et al., 2010; Davin et al., 2016).
Because of the same lateral-boundary forcings, the LSS-simulated downward shortwave radiation (Sin) are almost the same. However, there is a positive bias of Sin (4–11 W m−2) that leads to overestimate of solar energy absorbed (Figure 5A). For the upward shortwave radiation (Sout), LSS-simulated Sout also exhibit positive biases, with Noah-MP and CLM4 have the largest magnitudes (Figure 5B). Note that the 2013 and 2017 cases share similar biases, indicating that systematic biases exist in simulating the surface shortwave radiations (Figures 5A,B), which may be due to lateral and lower boundary conditions derived from reanalysis data (Moalafhi et al., 2016). Furthermore, changing the LSSs can also substantially change the surface longwave radiative fluxes. For instance, 5TD, CLM4 and RUC underestimate the amplitudes of the upward longwave radiation (Figure 5C). For the downward longwave radiation, the model simulations show negative biases in the summer of 2017 (Figure 5D), leading to an underestimation of the net longwave radiations (Figure 5E). We also examine the surface net radiation (Rnet) (Figure 5F). The models all overestimate the amplitudes of observed Rnet. By comparison, Noah is the best relative to CERES, with the mean bias of ∼5 W m−2 (Figure 5F).
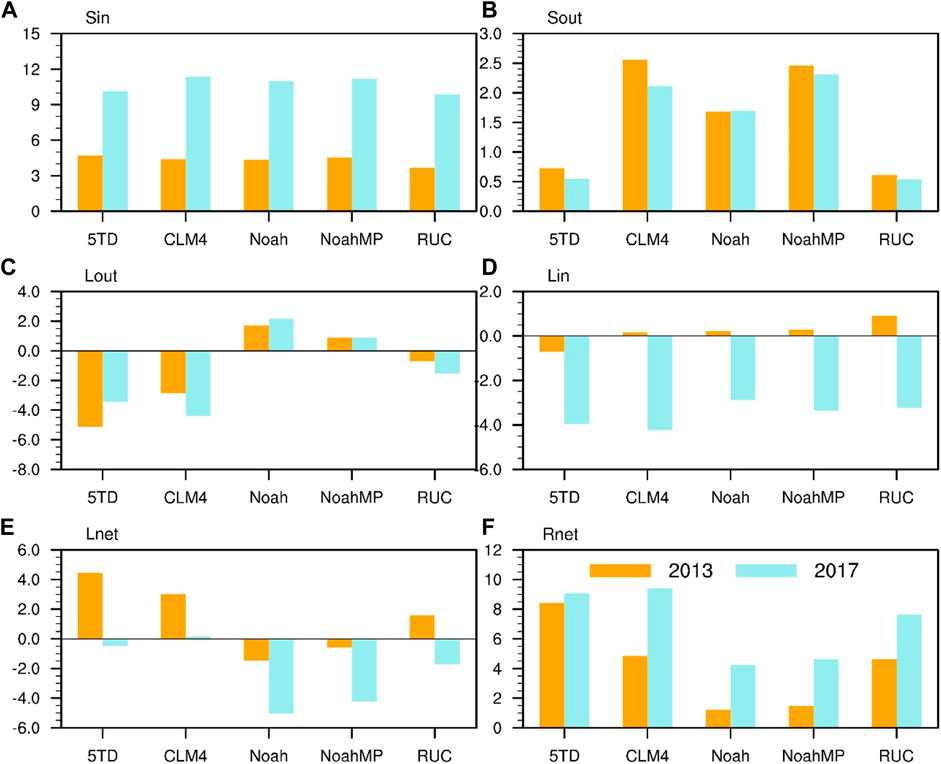
FIGURE 5. The differences in areal mean surface energy fluxes (W m−2) over the study region (outlined boxes in Figure 2A) between the model simulations and CERES data for the summer of 2013 (yellow) and 2017 (blue) for (A) downward shortwave radiation (Sin), (B) upward shortwave radiation (Sout), (C) upward longwave radiation (Lout), (D) downward longwave radiation (Lin), (E) net longwave radiation (Lnet), and (F) net radiation (Rnet).
The aforementioned sections have shown that the simulated surface energy fluxes and multi-day heat events can be influenced by different LSSs. Most LSSs overestimate the daytime temperatures (Table 2). These biases indicate that land surface processes may modulate the available energy partitioning between sensible and latent heat fluxes, leading to an underestimation of cloud formations (Figure 6) and a systematic overestimation of surface shortwave radiation (Figures 5A,B). For example, all the LSSs in fact underestimate the ET fields and 5TD show the least ET biases (Figure 7). The reduced ET could lead to a decline in cloud cover and an increase in surface shortwave radiation. To further examine the daytime warm biases around Shanghai, Figure 8 shows the relationship between the daily maximum temperature and ET. Most LSSs (except for CLM4 in 2017, discussed below) indeed underestimate the ET in Shanghai and the magnitudes of this underestimation correlates well with the daytime warm biases (Figures 8A,B). That is, the modeled warm biases result mainly from the negative ET biases. Note that 5TD has the smallest ET biases (Figure 7), which would lead to the smallest temperature biases. However, the 5TD scheme is an exception. It is the simplest among the five LSSs, only calculated soil temperature and ignores the representations of snow, vegetation, and soil moisture processes (Dudhia, 1996). This simplicity does not consider detailed land-surface hydrological and biosphere processes in computing the soil temperature and moisture which may result in unrealistic representation of surface energy balance and Bowen’s ratio. Furthermore, 5TD has the largest positive Rnet biases in particular in the summer of 2013 (Figure 5F). So least ET biases will not point to least warm biases.
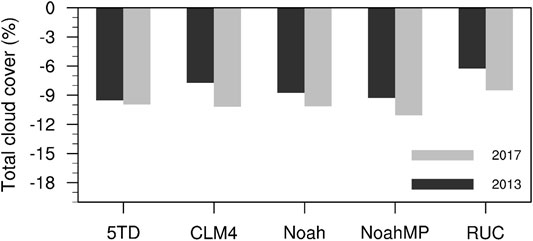
FIGURE 6. The differences in areal mean total cloud cover over the study region (outlined boxes in Figure 2A) between the model simulations and CERES data for the summer of 2013 (black) and 2017 (gray).
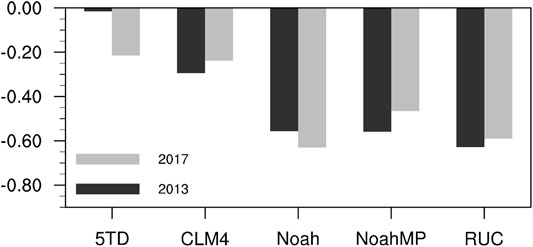
FIGURE 7. The differences in areal mean ET (mm day−1) over the study region (outlined boxes in Figure 2A) between the model simulations and GLEAM data for the summer of 2013 (black) and 2017 (gray).
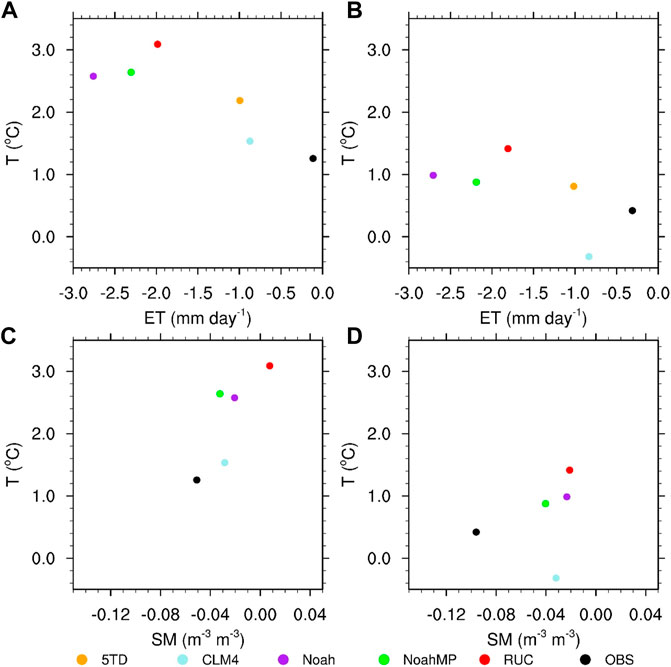
FIGURE 8. The relationship between daily maximum temperature and ET for (A) 2013 and (B) 2017. (C,D) Same as (A,B), but for surface soil moisture over Shanghai (30.8°–31.5°N 120.7°–122°E).
In model simulations, the air temperatures or daily maximum temperatures in Noah, Noah-MP and RUC are closely related to sensible and latent heat fluxes with respect to the spatial patterns (p < 0.05, n = 376). The modeled temperatures in CLM4 have statistically significant spatial correlations with the sensible heat (r > 0.4, n = 376), but have weak connections with the latent heat. Instead, 5TD shows strong relationship between the temperatures and the latent heat (r > 0.53, n = 376), but weak relationship between temperatures and the sensible heat. These results suggest that how each LSS partitions the surface energy into the ET and sensible heat would largely determine the relationship between the temperature and turbulent fluxes.
LSS-induced surface energy changes (e.g., through alteration of the surface albedo, ET and roughness) could control the variations of surface temperatures. As Noah is the “best” LSS in capturing the spatiotemporal characteristics of temperatures and surface radiative processes, we also use Noah as the reference data to explain the differences among the model simulations (Figure 9). Results show that 5TD, CLM4, and RUC exhibit similar albedo variations, whereas Noah-MP yields remarkably larger albedo values. Previous studies have indicated that Noah-MP produces higher modeled surface albedo (e.g., Ma N. et al., 2017). Tian et al. (2004) indicated that discrepancies in the albedos between the observation and land surface models were related to the uncertainty in quantifying leaf area index (LAI) and stem area index (SAI) in the model. Higher modeled surface albedo in Noah-MP could lead to remarkably larger Sout (Figure 5B).
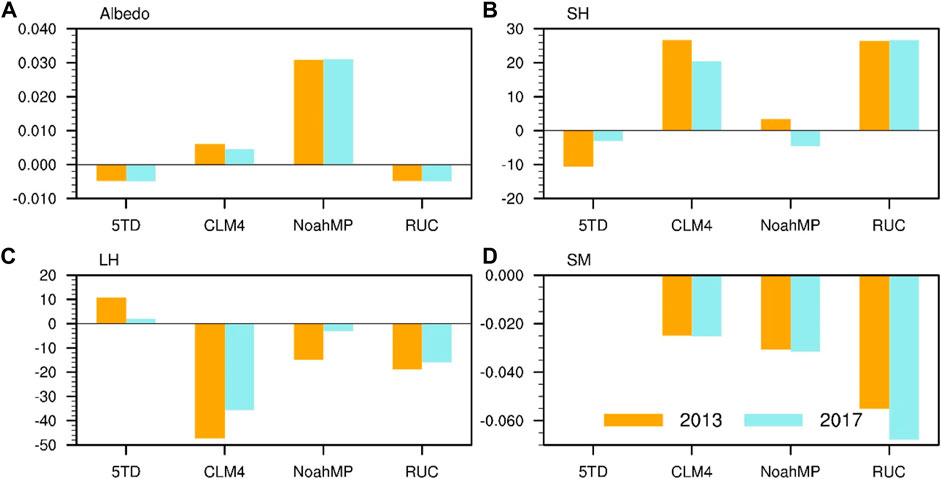
FIGURE 9. The areal mean differences between Noah and other four LSSs in (A) albedo, (B) SH, (C) LH and (D) soil moisture over the study region (outlined boxes in Figure 2A) for the summer of 2013 (yellow) and 2017 (blue).
The land energy and water balances are coupled through the ET (Seneviratne et al., 2010). Thus, soil moisture plays a key role through its impact on the energy partitioning at the surface. Soil moisture-temperature interactions or couplings have been shown in particular to be associated with the occurrence of the drought, extremely hot temperatures and heat waves (Seneviratne et al., 2006; Fischer et al., 2007b; Fischer et al., 2017a; Dirmeyer et al., 2021). There is generally a positive relationship between soil dryness and heat (e.g., Fischer et al., 2007b; Hirsch et al., 2014; Dirmeyer et al., 2021).
For observations, the air temperatures or daily maximum temperatures in CN05.1 have statistically significant spatial correlations with the GLEAM ET data over eastern China (Supplementary Figure S11). This indicates atmospheric control on ET, rather than soil moisture on ET and temperatures (e.g., Seneviratne et al., 2006). Most simulations (except for CLM4) also reproduce the positive relationships between the temperatures and ET over eastern China. The positive correlations in the observations and models show an agreement with the relationship between the daytime temperatures and soil moisture (Figures 8C,D). That is, the partitioning of net radiation at the surface into sensible and latent heat fluxes determines the soil wetness evolution, rather than strong soil moisture-temperature coupling on ET and temperatures.
We also calculate the standardized anomalies for the summer of 2013 and 2017 to attribute the differences between these two events. We characterize the anomalies more (less) than 1 (−1) as the extreme values. The extreme heat events in 2013 and 2017 impact the entire eastern region of China, in particular around Shanghai, south of Jiangsu and northern Zhejiang (Figures 10A,B). For the heat events in 2013, ET anomalies are related to the extensive warming, in particular in Shanghai where the surface soil moisture anomalies are relatively weak (Figures 10C,E). Thus, the modeled temperature biases result mainly from the ET biases, especially in Shanghai (Figure 8A). For example, RUC produces the largest ET biases (Figure 7), leading to warm the surface and increase the daytime temperature, in particular in Shanghai (Figure 8A). In contrast, 5TD and CLM4 show a relatively weak underestimation of the ET (Figure 7), resulting in slightly increases in surface temperatures. Note that the soil moisture anomalies (i.e., dryness) are very strong over the west parts of our study regions (Figure 10E). Accurate simulations of soil moisture are very important in simulating the temperature over these regions.

FIGURE 10. Spatial patterns of standardized anomalies of air temperature for (A) 2013 and (B) 2017. The standardized anomaly is shown as a reference period (i.e., August 7–9, 2013 or July 21–23, 2017) calculated from its long term mean and standard deviation from 2003 to 2018, excluding 2013 and 2017. (C,D) Same as (A,B), but for ET. (E,F) Same as (A,B), but for surface soil moisture.
For the 2017 case, the observed warming over eastern China is not relevant to the ET changes (Figure 10D). The soil moisture anomalies or surface dryness may play an important role (Figure 10F). We also examine the soil moisture variations for the LSS-induced simulations. Regardless of the inconsistencies in the soil layering, the temporal variations are relatively consistent across four LSSs in the top layer and in the top 1 m layer (5TD does not provide this output). Basically, RUC overestimates the magnitudes of surface dryness, resulting in more surface warming over eastern China around Shanghai (Figure 8D, Figure 10F). It’s interesting to note that CLM4 produces the lowest daytime temperatures around Shanghai in 2017 (Figure 8D). This bias reflects a systematic overestimation of latent heating over the southern of Shanghai (not shown). Overall, although the simulated extreme heat events in the summer of 2013 and 2017 manifest similar temperature and radiation biases, the land surface responses are different.
In this study, high-resolution (∼1 km) WRF simulations of two extreme heat events (i.e., August 7–9, 2013, July 21–23, 2017) were conducted. Five land surface schemes (LSSs) (i.e., 5TD, CLM4, Noah, Noah-MP and RUC) were used to investigate their impacts on regional temperatures and energy fluxes in eastern China. We first assess the sensitivity to different LSSs on WRF simulations of extreme heat events over eastern China based on the quality-controlled gauge-based observations, and then analyze the possible causes of different LSSs in describing land-atmosphere interactions.
Our results indicate that all the model simulations show similar warming patterns (e.g., extensive warming over the urban areas of eastern China), analogous to the observations. Most LSSs show a tendency to overestimate the daily maximum temperature around Shanghai and Jiangsu province. Noah is closest to observations for the spatial variations over eastern China. Thus, the simulations of extreme heat values are very sensitive to the LSSs choice.
To attribute the distinct differences in the heat events among the LSS-induced simulations, we also examine the surface radiative fluxes. Noah is closest to CERES in reproducing the net radiations and has the smallest biases. Basically, the modeled daytime temperature biases result mainly from the ET biases. The underestimated and reduced ET could also lead to a decline in cloud cover and an increase in surface shortwave radiation. In model simulations, the temperatures in Noah, Noah-MP and RUC are closely related to sensible and latent heat fluxes. However, the temperatures in CLM4 (5TD) have statistically significant correlations with the sensible (latent) heat, but weak connections with the latent (sensible) heat. CLM4 has the largest Bowen ratio, whereas 5TD has the smallest one. That is, how each LSS partitions the ET and sensible heat largely determines the relationship between the temperature and turbulent fluxes.
Although the simulated temperature and radiative fluxes in the two extreme heat events manifest similar biases, the observed land surface responses are different. Extensive warming is related to the ET anomalies during the heat events in 2013, while the ET is insignificant in 2017. Instead, the soil moisture anomalies play an important role in 2017 in particular in Shanghai. Note that the simulated surface radiative flux bias in 2013 is much lower than that in 2017. These results suggest that the simulated surface radiative flux and non-radiative processes (e.g., ET, turbulence, or indirect effect of cloud) for the summer of 2013 and 2017 may be different, although they show similar biases in the temperature. Thus, it is important to account for the combined effects of radiative and non-radiative at the land-atmosphere interface regarding different extreme heat events.
We also find that the nighttime simulations in eastern China are very sensitive to LSSs. The possible causes of the nighttime temperature biases can be due to underestimation of surface longwave radiations, and underestimation of could cover and ET. Furthermore, we should note that the model performance is largely affected by the initial and boundary conditions, and physical parameterizations. Using more suites of model settings to investigate the LSS effects would help understand the LSS-induced sensitivity of extreme heat events.
The original contributions presented in the study are included in the article/Supplementary Material, further inquiries can be directed to the corresponding author.
WH and QL designed the study. WH and XD performed the model simulations and the data analysis. All authors contributed to the writing of the manuscript.
This work was supported by the National Key R&D Program of China (2017YFC1502101), the National Natural Science Foundation of Jiangsu Province (BK20200096) and the National Natural Science Foundation of China (42075022, 42021004, 42075189). LZ was supported by National Science Foundation (AGS-1535426).
The authors declare that the research was conducted in the absence of any commercial or financial relationships that could be construed as a potential conflict of interest.
All claims expressed in this article are solely those of the authors and do not necessarily represent those of their affiliated organizations, or those of the publisher, the editors and the reviewers. Any product that may be evaluated in this article, or claim that may be made by its manufacturer, is not guaranteed or endorsed by the publisher.
We thank Wu Jia (China Meteorological Administration) for providing the gridded dataset CN05.1 (the data set is available from Wu upon request). CERES data products were achieved from CERES (https://ceres.larc.nasa.gov/data/). GLEAM ET and soil moisture data sets were obtained from GLEAM (https://www.gleam.eu/).
The Supplementary Material for this article can be found online at: https://www.frontiersin.org/articles/10.3389/feart.2021.770826/full#supplementary-material
Arblaster, J. M., and Alexander, L. V. (2012). The Impact of the El Niño‐Southern Oscillation on Maximum Temperature Extremes. Geophys. Res. Lett. 39, L20702. doi:10.1029/2012GL053409
Bai, P., and Liu, X. (2018). Intercomparison and Evaluation of Three Global High-Resolution Evapotranspiration Products across China. J. Hydrol. 566, 743–755. doi:10.1016/j.jhydrol.2018.09.065
Barriopedro, D., Fischer, E. M., Luterbacher, J., Trigo, R. M., and García-Herrera, R. (2011). The Hot Summer of 2010: Redrawing the Temperature Record Map of Europe. Science 332, 220–224. doi:10.1126/science.1201224
Beniston, M. (2004). The 2003 Heat Wave in Europe: A Shape of Things to Come? an Analysis Based on Swiss Climatological Data and Model Simulations. Geophys. Res. Lett. 31 (2), L02202. doi:10.1029/2003GL018857
Boone, A. A., Poccard-Leclercq, I., Xue, Y., Feng, J., and de Rosnay, P. (2010). Evaluation of the WAMME Model Surface Fluxes Using Results from the AMMA Land-Surface Model Intercomparison Project. Clim. Dyn. 35, 127–142. doi:10.1007/s00382-009-0653-1
Chen, F., and Dudhia, J. (2001). Coupling an Advanced Land Surface-Hydrology Model with the Penn State-NCAR MM5 Modeling System. Part I: Model Implementation and Sensitivity. Mon. Wea. Rev. 129, 569–585. doi:10.1175/1520-0493(2001)129<0569:CAALSH>2.0.CO;2
Chen, R., Wen, Z., Lu, R., and Wang, C. (2019). Causes of the Extreme Hot Midsummer in Central and South China during 2017: Role of the Western Tropical Pacific Warming. Adv. Atmos. Sci. 36, 465–478. doi:10.1007/s00376-018-8177-4
Chen, X., and Zhou, T. (2018). Relative Contributions of External SST Forcing and Internal Atmospheric Variability to July-August Heat Waves over the Yangtze River valley. Clim. Dyn. 51, 4403–4419. doi:10.1007/s00382-017-3871-y
Crétat, J., Pohl, B., Richard, Y., and Drobinski, P. (2012). Uncertainties in Simulating Regional Climate of Southern Africa: Sensitivity to Physical Parameterizations Using WRF. Clim. Dyn. 38, 613–634. doi:10.1007/s00382-011-1055-8
Davin, E. L., Maisonnave, E., and Seneviratne, S. I. (2016). Is Land Surface Processes Representation a Possible Weak Link in Current Regional Climate Models? Environ. Res. Lett. 11, 074027. doi:10.1088/1748-9326/11/7/074027
Deng, K., Yang, S., Ting, M., Zhao, P., and Wang, Z. (2019). Dominant Modes of China Summer Heat Waves Driven by Global Sea Surface Temperature and Atmospheric Internal Variability. J. Clim. 32, 3761–3775. doi:10.1175/JCLI-D-18-0256.1
Dirmeyer, P. A., Balsamo, G., Blyth, E. M., Morrison, R., and Cooper, H. M. (2021). Land‐Atmosphere Interactions Exacerbated the Drought and Heatwave over Northern Europe during Summer 2018. AGU Adv. 2, e2020AV000283. doi:10.1029/2020AV000283
Dudhia, J. (1996). “A Multi-Layer Soil Temperature Model for MM5,” in 6th PSU/NCAR Mesoscale Model Users’ Workshop. Bouilder: Colo, 49–50.
Evans, J. P., Ekstroem, M., and Ekström, F. (2012). Evaluating the Performance of a WRF Physics Ensemble over South-East Australia. Clim. Dyn. 39, 1241–1258. doi:10.1007/s00382-011-1244-5
Feser, F., Rockel, B., von Storch, H., Winterfeldt, J., and Zahn, M. (2011). Regional Climate Models Add Value to Global Model Data: a Review and Selected Examples. Bull. Amer. Meteorol. Soc. 92, 1181–1192. doi:10.1175/2011BAMS3061.1
Fischer, E. M., Seneviratne, S. I., Vidale, P. L., Lüthi, D., and Schär, C. (2007a). Soil Moisture-Atmosphere Interactions during the 2003 European Summer Heat Wave. J. Clim. 20, 5081–5099. doi:10.1175/JCLI4288.1
Fischer, E. M., Seneviratne, S. I., Lüthi, D., and Schär, C. (2007b). Contribution of Land-Atmosphere Coupling to Recent European Summer Heat Waves. Geophys. Res. Lett. 34, L06707. doi:10.1029/2006GL029068
Flaounas, E., Bastin, S., and Janicot, S. (2011). Regional Climate Modelling of the 2006 West African Monsoon: Sensitivity to Convection and Planetary Boundary Layer Parameterisation Using WRF. Clim. Dyn. 36, 1083–1105. doi:10.1007/s00382-010-0785-3
Foley, A. M. (2010). Uncertainty in Regional Climate Modelling: a Review. Prog. Phys. Geogr. Earth Environ. 34, 647–670. doi:10.1177/0309133310375654
Freychet, N., Tett, S., Wang, J., and Hegerl, G. (2017). Summer Heat Waves over Eastern China: Dynamical Processes and Trend Attribution. Environ. Res. Lett. 12, 024015. doi:10.1088/1748-9326/aa5ba3
García-Herrera, R., Díaz, J., Trigo, R. M., Luterbacher, J., and Fischer, E. M. (2010). A Review of the European Summer Heat Wave of 2003. Crit. Rev. Environ. Sci. Technology 40, 267–306. doi:10.1080/10643380802238137
Gianotti, R. L., Zhang, D., and Eltahir, E. A. B. (2012). Assessment of the Regional Climate Model Version 3 over the Maritime Continent Using Different Cumulus Parameterization and Land Surface Schemes. J. Clim. 25, 638–656. doi:10.1175/JCLI-D-11-00025.1
Güttler, I., Branković, Č., O’Brien, T. A., Coppola, E., Grisogono, B., and Giorgi, F. (2014). Sensitivity of the Regional Climate Model RegCM4.2 to Planetary Boundary Layer Parameterisation. Clim. Dyn. 43, 1753–1772. doi:10.1007/s00382-013-2003-6
Hartmann, D. L., Klein Tank, A. M. G., Rusticucci, M., Alexander, L., Brönnimann, S., Charab, Y., et al. (2013). “Observations: Atmosphere and Surface,” in Climate Change 2013: The Physical Science Basis. Contribution of Working Group I to the Fifth Assessment Report of the Intergovernmental Panel on Climate Change. Editor T. F. Stocker, D. Qin, G. K. Plattner, M. Tignor, S. K. Allen, J. Boschunget al. (Cambridge, United Kingdom and New York: Cambridge University Press), 159–254.
Herring, S. C., Hoerling, M. P., Peterson, T. C., and Stott, P. A. (2014). Explaining Extreme Events of 2013 from a Climate Perspective. Bull. Amer. Meteorol. Soc. 95, S1–S104. doi:10.1175/1520-0477-95.9.S1.1
Hirsch, A. L., Pitman, A. J., Seneviratne, S. I., Evans, J. P., and Haverd, V. (2014). Summertime Maximum and Minimum Temperature Coupling Asymmetry over Australia Determined Using WRF. Geophys. Res. Lett. 41, 1546–1552. doi:10.1002/2013GL059055
Hirschi, M., Seneviratne, S. I., Alexandrov, V., Boberg, F., Boroneant, C., Christensen, O. B., et al. (2011). Observational Evidence for Soil-Moisture Impact on Hot Extremes in southeastern Europe. Nat. Geosci 4, 17–21. doi:10.1038/ngeo1032
Hong, S.-Y., and Lim, J. J. (2006). The WRF Single-Moment 6-Class Microphysics Scheme (WSM6). J. Korean Meteorol. Soc. 42, 129–151.
Hong, S.-Y., Noh, Y., and Dudhia, J. (2006). A New Vertical Diffusion Package with an Explicit Treatment of Entrainment Processes. Mon. Wea. Rev. 134, 2318–2341. doi:10.1175/MWR3199.1
Hua, W., Chen, H., and Sun, S. (2014). Uncertainty in Land Surface Temperature Simulation over China by CMIP3/CMIP5 Models. Theor. Appl. Climatol. 117, 463–474. doi:10.1007/s00704-013-1020-z
Hua, W., Qin, M., Dai, A., Zhou, L., Chen, H., and Zhang, W. (2021). Reconciling Human and Natural Drivers of the Tripole Pattern of Multidecadal Summer Temperature Variations over Eurasia. Geophys. Res. Lett. 48, e2021GL093971. doi:10.1029/2021GL093971
Iacono, M. J., Delamere, J. S., Mlawer, E. J., Shephard, M. W., Clough, S. A., and Collins, W. D. (2008). Radiative Forcing by Long-Lived Greenhouse Gases: Calculations with the AER Radiative Transfer Models. J. Geophys. Res. 113, D13103. doi:10.1029/2008JD009944
Kain, J. S. (2004). The Kain-Fritsch Convective Parameterization: An Update. J. Appl. Meteorol. 43, 170–181. doi:10.1175/1520-0450(2004)043<0170:TKCPAU>2.0.CO;2
Kanamitsu, M., Yoshimura, K., Yhang, Y.-B., and Hong, S.-Y. (2010). Errors of Interannual Variability and Trend in Dynamical Downscaling of Reanalysis. J. Geophys. Res. 115, D17115. doi:10.1029/2009JD013511
Køltzow, M. A. Ø., Iversen, T., and Haugen, J. E. (2011). The Importance of Lateral Boundaries, Surface Forcing and Choice of Domain Size for Dynamical Downscaling of Global Climate Simulations. Atmosphere 2, 67–95. doi:10.3390/atmos2020067
Laprise, R. (2008). Regional Climate Modelling. J. Comput. Phys. 227, 3641–3666. doi:10.1016/j.jcp.2006.10.024
Lawrence, D. M., Oleson, K. W., Flanner, M. G., Thornton, P. E., Swenson, S. C., Lawrence, P. J., et al. (2011). Parameterization Improvements and Functional and Structural Advances in Version 4 of the Community Land Model. J. Adv. Model. Earth Syst. 3, a–n. doi:10.1029/2011MS00045
Leduc, M., and Laprise, R. (2009). Regional Climate Model Sensitivity to Domain Size. Clim. Dyn. 32, 833–854. doi:10.1007/s00382-008-0400-z
Li, W., Guo, W., Xue, Y., Fu, C., and Qiu, B. (2016). Sensitivity of a Regional Climate Model to Land Surface Parameterization Schemes for East Asian Summer Monsoon Simulation. Clim. Dyn. 47, 2293–2308. doi:10.1007/s00382-015-2964-8
Liang, X.-Z., Sun, C., Zheng, X., Dai, Y., Xu, M., Choi, H. I., et al. (2019). CWRF Performance at Downscaling China Climate Characteristics. Clim. Dyn. 52, 2159–2184. doi:10.1007/s00382-018-4257-5
Liu, Q., Zhou, T., Mao, H., and Fu, C. (2019). Decadal Variations in the Relationship between the Western Pacific Subtropical High and Summer Heat Waves in East China. J. Clim. 32, 1627–1640. doi:10.1175/JCLI-D-18-0093.1
Lorenz, R., Jaeger, E. B., and Seneviratne, S. I. (2010). Persistence of Heat Waves and its Link to Soil Moisture Memory. Geophys. Res. Lett. 37, a–n. doi:10.1029/2010GL042764
Ma, N., Niu, G.-Y., Xia, Y., Cai, X., Zhang, Y., Ma, Y., et al. (2017). A Systematic Evaluation of Noah-MP in Simulating Land-Atmosphere Energy, Water, and Carbon Exchanges over the continental United States. J. Geophys. Res. Atmos. 122, 12245–12268. doi:10.1002/2017JD027597
Ma, S., Zhou, T., Stone, D. A., Angélil, O., and Shiogama, H. (2017). Attribution of the July-August 2013 Heat Event in Central and Eastern China to Anthropogenic Greenhouse Gas Emissions. Environ. Res. Lett. 12, 054020. doi:10.1088/1748-9326/aa69d2
Martens, B., Miralles, D. G., Lievens, H., van der Schalie, R., de Jeu, R. A. M., Fernández-Prieto, D., et al. (2017). GLEAM V3: Satellite-Based Land Evaporation and Root-Zone Soil Moisture. Geosci. Model. Dev. 10, 1903–1925. doi:10.5194/gmd-10-1903-2017
Michel, D., Jiménez, C., Miralles, D. G., Jung, M., Hirschi, M., Ershadi, A., et al. (2016). The WACMOS-ET Project - Part 1: Tower-scale Evaluation of Four Remote-Sensing-Based Evapotranspiration Algorithms. Hydrol. Earth Syst. Sci. 20, 803–822. doi:10.5194/hess-20-803-2016
Miralles, D. G., Holmes, T. R. H., de Jeu, R. A. M., Gash, J. H., Meesters, A. G. C. A., and Dolman, A. J. (2011). Global Land-Surface Evaporation Estimated from Satellite-Based Observations. Hydrol. Earth Syst. Sci. 15, 453–469. doi:10.5194/hess-15-453-2011
Miralles, D. G., Jiménez, C., Jung, M., Michel, D., Ershadi, A., McCabe, M. F., et al. (2016). The WACMOS-ET Project - Part 2: Evaluation of Global Terrestrial Evaporation Data Sets. Hydrol. Earth Syst. Sci. 20, 823–842. doi:10.5194/hess-20-823-2016
Moalafhi, D. B., Evans, J. P., and Sharma, A. (2016). Evaluating Global Reanalysis Datasets for Provision of Boundary Conditions in Regional Climate Modelling. Clim. Dyn. 47, 2727–2745. doi:10.1007/s00382-016-2994-x
Mooney, P. A., Mulligan, F. J., and Fealy, R. (2013). Evaluation of the Sensitivity of the Weather Research and Forecasting Model to Parameterization Schemes for Regional Climates of Europe over the Period 1990-95. J. Clim. 26, 1002–1017. doi:10.1175/JCLI-D-11-00676.1
Niu, G.-Y., Yang, Z.-L., Mitchell, K. E., Chen, F., Ek, M. B., Barlage, M., et al. (2011). The Community Noah Land Surface Model with Multiparameterization Options (Noah-MP): 1. Model Description and Evaluation with Local-Scale Measurements. J. Geophys. Res. 116, D12109. doi:10.1029/2010JD015139
Powers, J. G., Klemp, J. B., Skamarock, W. C., Davis, C. A., Dudhia, J., Gill, D. O., et al. (2017). The Weather Research and Forecasting Model: Overview, System Efforts, and Future Directions. Bull. Amer. Meteorol. Soc. 98, 1717–1737. doi:10.1175/BAMS-D-15-00308.1
Pryor, S. C., Nikulin, G., and Jones, C. (2012). Influence of Spatial Resolution on Regional Climate Model Derived Wind Climates. J. Geophys. Res. 117, a–n. doi:10.1029/2011JD016822
Ratna, S. B., Ratnam, J. V., Behera, S. K., Rautenbach, C. J. d., Ndarana, T., Takahashi, K., et al. (2014). Performance Assessment of Three Convective Parameterization Schemes in WRF for Downscaling Summer Rainfall over South Africa. Clim. Dyn. 42, 2931–2953. doi:10.1007/s00382-013-1918-2
Roy, P., Gachon, P., and Laprise, R. (2012). Assessment of Summer Extremes and Climate Variability over the north-east of North America as Simulated by the Canadian Regional Climate Model. Int. J. Climatol. 32, 1615–1627. doi:10.1002/joc.2382
Sato, T., and Xue, Y. (2013). Validating a Regional Climate Model's Downscaling Ability for East Asian Summer Monsoonal Interannual Variability. Clim. Dyn. 41, 2411–2426. doi:10.1007/s00382-012-1616-5
Seneviratne, S., Nicholls, N., Easterling, D., Goodess, C. M., Kanae, S., Kossin, J., et al. (2012). “Changes in Climate Extremes and Their Impacts on the Natural Physical Environment,”. IPCC WGI/WGII Special Report on Managing the Risks of Extreme Events and Disasters to Advance Climate Change Adaptation (SREX). Editor C. B. Field, V. Barros, T. F. Stocker, and Q. Dahe (Cambridge, ENGLAND: Cambridge University Press), 109–230. The Edinburgh Building, Shaftesbury Road, Cambridge CB2 8RU ENGLAND.
Seneviratne, S. I., Corti, T., Davin, E. L., Hirschi, M., Jaeger, E. B., Lehner, I., et al. (2010). Investigating Soil Moisture-Climate Interactions in a Changing Climate: A Review. Earth-Science Rev. 99, 125–161. doi:10.1016/j.earscirev.2010.02.004
Seneviratne, S. I., Lüthi, D., Litschi, M., and Schär, C. (2006). Land-atmosphere Coupling and Climate Change in Europe. Nature 443, 205–209. doi:10.1038/nature05095
Skamarock, W. C., Klemp, J. B., Dudhia, J., Gill, D. O., Barker, D. M., Wang, W., et al. 2008. A Description of the Advanced Research WRF Version 3. Boulder, CO: NCAR Technical note -475+STR.doi:10.5065/D68S4MVH
Smirnova, T. G., Brown, J. M., Benjamin, S. G., and Kenyon, J. S. (2016). Modifications to the Rapid Update Cycle Land Surface Model (RUC LSM) Available in the Weather Research and Forecasting (WRF) Model. Mon. Wea. Rev. 144, 1851–1865. doi:10.1175/MWR-D-15-0198.1
Solman, S. A., and Pessacg, N. L. (2012). Regional Climate Simulations over South America: Sensitivity to Model Physics and to the Treatment of Lateral Boundary Conditions Using the MM5 Model. Clim. Dyn. 38, 281–300. doi:10.1007/s00382-011-1049-6
Stott, P. (2016). How Climate Change Affects Extreme Weather Events. Science 352, 1517–1518. doi:10.1126/science.aaf7271
Sun, J. (2014). Record-breaking SST over Mid-North Atlantic and Extreme High Temperature over the Jianghuai-Jiangnan Region of China in 2013. Chin. Sci. Bull. 59, 3465–3470. doi:10.1007/s11434-014-0425-0
Sun, Y., Zhang, X., Zwiers, F. W., Song, L., Wan, H., Hu, T., et al. (2014). Rapid Increase in the Risk of Extreme Summer Heat in Eastern China. Nat. Clim Change 4, 1082–1085. doi:10.1038/nclimate2410
Tian, Y., Dickinson, R. E., Zhou, L., Zeng, X., Dai, Y., Myneni, R. B., et al. (2004). Comparison of Seasonal and Spatial Variations of Leaf Area index and Fraction of Absorbed Photosynthetically Active Radiation from Moderate Resolution Imaging Spectroradiometer (MODIS) and Common Land Model. J. Geophys. Res. 109, D01103. doi:10.1029/2003JD003777
Trenberth, K. E., and Fasullo, J. T. (2012). Climate Extremes and Climate Change: The Russian Heat Wave and Other Climate Extremes of 2010. J. Geophys. Res. 117, a–n. doi:10.1029/2012JD018020
Vautard, R., Gobiet, A., Jacob, D., Belda, M., Colette, A., Déqué, M., et al. (2013). The Simulation of European Heat Waves from an Ensemble of Regional Climate Models within the EURO-CORDEX Project. Clim. Dyn. 41, 2555–2575. doi:10.1007/s00382-013-1714-z
Wang, J., Yan, Z., Quan, X.-W., and Feng, J. (2017). Urban Warming in the 2013 Summer Heat Wave in Eastern China. Clim. Dyn. 48, 3015–3033. doi:10.1007/s00382-016-3248-7
Wang, W., Zhou, W., Li, X., Wang, X., and Wang, D. (2016). Synoptic-scale Characteristics and Atmospheric Controls of Summer Heat Waves in China. Clim. Dyn. 46, 2923–2941. doi:10.1007/s00382-015-2741-8
Wielicki, B. A., Barkstrom, B. R., Harrison, E. F., Lee, R. B., Louis Smith, G., and Cooper, J. E. (1996). Clouds and the Earth's Radiant Energy System (CERES): An Earth Observing System experiment. Bull. Amer. Meteorol. Soc. 77, 853–868, doi:10.1175/1520-0477(1996)077<0853:CATERE>2.0.CO;2
WMO (2013). The Global Climate 2001–2010: A Decade of Climate Extremes. WMO-No. 1103: 119pp. Switzerland: World Meteorological Organization.
Wu, J., and Gao, X. (2013). A Gridded Daily Observation Dataset over China Region and Comparison with the Other Datasets. Chin. J. Geophys. 56, 1102–1111. doi:10.6038/cjg2013040610.1007/s11431-013-5390-3
Xia, G., Zhou, L., Minder, J. R., Fovell, R. G., and Jimenez, P. A. (2019). Simulating Impacts of Real-World Wind Farms on Land Surface Temperature Using the WRF Model: Physical Mechanisms. Clim. Dyn. 53, 1723–1739. doi:10.1007/s00382-019-04725-0
Xu, L., Samanta, A., Costa, M. H., Ganguly, S., Nemani, R. R., and Myneni, R. B. (2011). Widespread Decline in Greenness of Amazonian Vegetation Due to the 2010 Drought. Geophys. Res. Lett. 38, a–n. doi:10.1029/2011GL046824
Xue, Y., Vasic, R., Janjic, Z., Mesinger, F., and Mitchell, K. E. (2007). Assessment of Dynamic Downscaling of the Continental U.S. Regional Climate Using the Eta/SSiB Regional Climate Model. J. Clim. 20, 4172–4193. doi:10.1175/JCLI4239.1
Yang, X., Ruby Leung, L., Zhao, N., Zhao, C., Qian, Y., Hu, K., et al. (2017a). Contribution of Urbanization to the Increase of Extreme Heat Events in an Urban Agglomeration in east China. Geophys. Res. Lett. 44, 6940–6950. doi:10.1002/2017GL074084
Yang, X., Yong, B., Ren, L., Zhang, Y., and Long, D. (2017b). Multi-scale Validation of GLEAM Evapotranspiration Products over China via ChinaFLUX ET Measurements. Int. J. Remote Sensing 38, 5688–5709. doi:10.1080/01431161.2017.1346400
Zeng, X.-M., Wang, B., Zhang, Y., Song, S., Huang, X., Zheng, Y., et al. (2014). Sensitivity of High-Temperature Weather to Initial Soil Moisture: a Case Study Using the WRF Model. Atmos. Chem. Phys. 14, 9623–9639. doi:10.5194/acp-14-9623-2014
Zeng, X.-M., Wang, N., Wang, Y., Zheng, Y., Zhou, Z., Wang, G., et al. (2015). WRF-simulated Sensitivity to Land Surface Schemes in Short and Medium Ranges for a High-Temperature Event in East China: A Comparative Study. J. Adv. Model. Earth Syst. 7, 1305–1325. doi:10.1002/2015MS000440
Zeng, X., Wu, Z., Xiong, S., Song, S., Zheng, Y., and Liu, H. (2011). Sensitivity of Simulated Short-Range High-Temperature Weather to Land Surface Schemes by WRF. Sci. China Earth Sci. 54, 581–590. doi:10.1007/s11430-011-4181-6
Zhang, J., and Wu, L. (2011). Land-atmosphere Coupling Amplifies Hot Extremes over China. Chin. Sci. Bull. 56, 3328–3332. doi:10.1007/s11434-011-4628-3
Zhou, C., Wang, K., Qi, D., and Tan, J. (2019). Attribution of a Record-Breaking Heatwave Event in Summer 2017 over the Yangtze River Delta. Bull. Amer. Meteorol. Soc. 100, S97–S103. doi:10.1175/BAMS-D-18-0134.1
Zhou, L., Dickinson, R. E., Dai, A., and Dirmeyer, P. (2010). Detection and Attribution of Anthropogenic Forcing to Diurnal Temperature Range Changes from 1950 to 1999: Comparing Multi-Model Simulations with Observations. Clim. Dyn. 35, 1289–1307. doi:10.1007/s00382-009-0644-2
Zhou, L., Dickinson, R. E., Dirmeyer, P., Dai, A., and Min, S.-K. (2009). Spatiotemporal Patterns of Changes in Maximum and Minimum Temperatures in Multi-Model Simulations. Geophys. Res. Lett. 36, a–n. doi:10.1029/2008GL036141
Zhou, L., Dickinson, R. E., Tian, Y., Fang, J., Li, Q., Kaufmann, R. K., et al. (2004). Evidence for a Significant Urbanization Effect on Climate in China. Proc. Natl. Acad. Sci. 101, 9540–9544. doi:10.1073/pnas.0400357101
Zhou, L. (2021). Diurnal Asymmetry of Desert Amplification and its Possible Connections to Planetary Boundary Layer Height: a Case Study for the Arabian Peninsula. Clim. Dyn. 56, 3131–3156. doi:10.1007/s00382-021-05634-x
Zhou, L., Tian, Y., Baidya Roy, S., Thorncroft, C., Bosart, L. F., and Hu, Y. (2012). Impacts of Wind Farms on Land Surface Temperature. Nat. Clim Change 2, 539–543. doi:10.1038/nclimate1505
Keywords: land surface schemes, WRF model, high-resolution simulation, heatwaves, evapotranspiration
Citation: Hua W, Dong X, Liu Q, Zhou L, Chen H and Sun S (2021) High-Resolution WRF Simulation of Extreme Heat Events in Eastern China: Large Sensitivity to Land Surface Schemes. Front. Earth Sci. 9:770826. doi: 10.3389/feart.2021.770826
Received: 05 September 2021; Accepted: 20 October 2021;
Published: 03 November 2021.
Edited by:
Gen Li, Hohai University, ChinaReviewed by:
Xuezhen Zhang, Institute of Geographic Sciences and Natural Resources Research (CAS), ChinaCopyright © 2021 Hua, Dong, Liu, Zhou, Chen and Sun. This is an open-access article distributed under the terms of the Creative Commons Attribution License (CC BY). The use, distribution or reproduction in other forums is permitted, provided the original author(s) and the copyright owner(s) are credited and that the original publication in this journal is cited, in accordance with accepted academic practice. No use, distribution or reproduction is permitted which does not comply with these terms.
*Correspondence: Wenjian Hua, d2VuamlhbkBudWlzdC5lZHUuY24=
Disclaimer: All claims expressed in this article are solely those of the authors and do not necessarily represent those of their affiliated organizations, or those of the publisher, the editors and the reviewers. Any product that may be evaluated in this article or claim that may be made by its manufacturer is not guaranteed or endorsed by the publisher.
Research integrity at Frontiers
Learn more about the work of our research integrity team to safeguard the quality of each article we publish.