 Zhipeng Fu
 Anning Huang
 Qu Guo2*
- 1School of Atmospheric Sciences, Nanjing University, Nanjing, China
- 2Chongqing Climate Center, Chongqing Meteorological Administration, Chongqing, China
A bias correction scheme has been developed based on the singular value decomposition (SVD) analysis in this study, and it is further validated and used to improve the skill of sub-seasonal precipitation over Eastern China in summer predicted by the Beijing Climate Center sub-seasonal to seasonal forecast system (BCC_S2SFS). Results show that the BCC_S2SFS prediction skill of summer precipitation over Eastern China at the sub-seasonal scale is up to 1 days in advance and exhibits clear regional and inter-annual differences. Further adopting the bias correction scheme can significantly improve the skill of BCC_S2SFS in predicting the sub-seasonal precipitation over Eastern China in summer with different lead time especially longer than 10 days. Compared to the original prediction of BCC_S2SFS, the temporal (spatial) correlation coefficient between the bias corrected predictions and observations over Eastern China can be increased by 0.15, 0.55, and 0.56 (0.14, 0.17, and 0.19) during the forecast lead time of 0–10, 11–20, and 21–30 days, respectively. The bias correction scheme developed in this study shows large potential application prospects in the operational forecast.
Introduction
Sub-seasonal to seasonal (S2S) meteorological forecasts (15–60 days) take the key time range for linking short-term weather forecast to seasonal climate prediction (Jie et al., 2017). However, the processes of the S2S predictions are overly complex due to the interactions of external forcing factors and initial conditions (Lorenz, 1975). Hence, the meteorological prediction with the S2S time range has long been considered a “desert of predictability” (Vitart, 2017; Olaniyan et al., 2018). It is urgent to improve the accuracy of the S2S forecast to meet the increasing demand of reliable meteorological services. With the increase in extreme weather events (e.g., continuous rain, drought, and snowstorm), the meteorological departments were expected to make more accurate predictions on the dynamics and duration of these events. In addition, the S2S forecast also has strong guiding and prompting effects on power dispatching, fishery production, agricultural development, and other industries closely related to weather and climate conditions (Tang et al., 2017).
Due to the chaotic characteristics inherent in the atmosphere (Lorenz, 1963), current dynamical climate models cannot forecast the daily weather beyond 2 weeks (Merryfield et al., 2020). Forecasts at sub-seasonal time scale are beyond the range of predictability of daily weather, but some predictable components, like some planetary scale motions, could be predicted very well (Chou et al., 2010). A major source of predictability at the sub-seasonal scale is the Madden–Julian oscillation (MJO) (Woolnough, 2019), which can be skillfully predicted by S2S project models up to 3–4 weeks in advance (Vitart 2017). The predictability at the sub-seasonal scale also originates from the sudden stratospheric warmings (Kidston et al., 2015; Butler et al., 2019), Boreal Summer Intraseasonal Oscillation (BSISO) (Zhu et al., 2021), El Niño–Southern Oscillation (ENSO) (DelSole et al., 2017), sea ice (Chevallier et al., 2019), soil moisture and temperature (Koster et al., 2016; Yang et al., 2019), snow cover (Jeong et al., 2013), and vegetation states (Williams et al., 2016).
To bridge the time gap between the weather forecast and climate prediction, many organizations have conducted a lot of corresponding studies on S2S prediction and advanced the progress to meet the urgent service demands. The National Center for Environmental Prediction (NCEP) of the United States, the European Centre for Medium-Range Weather Forecasts (ECMWF), the United Kingdom Met Office, and the Korea Meteorological Administration have developed their models for meteorological predictions with different timeliness (Saha et al., 2012; Sun et al., 2018). In China, the Institute of Atmospheric Physics of the Chinese Academy of Sciences and the China Meteorological Administration have also developed a series of models (Zheng et al., 2006; Wu et al., 2013; Wu et al., 2014; Shan et al., 2018). The research project “S2S Climate Prediction” that focused on the prediction from 2-week to 2-month time scales was conducted in 2014 (Vitart et al., 2016), it aimed to investigate the skills of S2S prediction and promote the theoretical research achievements transformation into operational services at the international operational centers and the applications community. The Beijing Climate Center Climate System Model version 1.2 (BCC_CSM1.2) developed by the China National Climate Center is the only model in China that joined in the S2S climate prediction project (Liu et al., 2015). It is skillful for sub-seasonal and seasonal meteorological predictions by optimizing the initial conditions, the prediction skill of BCC_CSM1.2 was significantly improved in forecasting the MJO (Liu et al., 2015; Liu et al., 2017) and BSISO (Zhu et al., 2021).
However, the uncertainties are inevitably generated in S2S climate predictions due to the uncertain initial conditions, the simplified physical processes, and the low horizontal resolutions of the dynamic models (Wu et al., 2017; Wu et al., 2019). Hence, more attentions have been paid to the corrections of the unsatisfactory prediction skills of climate models (Wang et al., 2016; Vitart, 2017; White et al., 2017; Mariotti et al., 2018; Vitart and Robertson, 2018). In addition, due to the difficulties arising from the different hindcast frequency and start dates in the S2S dataset, the construction of a multi-model is hard to implement (de Andrade et al., 2019). Previous researches have pointed out that the prediction skills could be improved by combing the dynamic models with statistical models or using multi-type climate models (Liu et al., 2014; Gong et al., 2018; Zhang et al., 2019; Zheng et al., 2019; Materia et al., 2020). Nevertheless, the prediction skills on the S2S time scale are still unacceptable (Wang et al., 2014; de Andrade et al., 2019). Therefore, it is still a long-term need to continuously improve the climate models and prediction methods for acceptable S2S predictions.
The singular value decomposition (SVD) bias correction method has been widely used to improve the prediction skills of precipitation in different seasons and regions. It could extract the main features of the predictors and corresponding space fields and take the differences between observation and the forecast in space and time (Feddersen et al., 1999; Xu et al., 2018) into consideration. Qin et al. (2011) used the SVD strategy to correct the seasonal hindcasts of summer and autumn precipitation in China. The anomaly correlation coefficient (ACC) values were increased from –0.09 and –0.07 to 0.36 and 0.30 for the predictions in summer and autumn, respectively. However, the ability of the SVD bias correction method has not yet been evaluated in increasing the prediction skills of summer precipitation on the sub-seasonal scale over Eastern China, which is in the East Asian monsoon region.
In this study, the SVD bias correction scheme is established for the S2S summer precipitation predictions over Eastern China based on the observations and hindcasts of the Beijing Climate Center S2S forecast system (BCC_S2SFS) during 1994–2013. The main objectives are to 1) evaluate the prediction skill of the BCC_S2SFS for the summer precipitation over Eastern China at the sub-seasonal scale; and 2) reveal to what extent the SVD bias correction scheme can improve the prediction skill of BCC_S2SFS.
Model, Data, and Methods
Model
The BCC_S2SFS is developed based on the BCC_CSM1.2 model with moderate resolution (Liu et al., 2015; Liu et al., 2017; Zheng et al., 2020), which is a fully atmosphere-ocean-ice-land coupled climate model (Wu et al., 2013; Wu et al., 2014) and contains different modules, including the atmospheric component BCC_AGCM2.2 with the horizontal resolution of T106 (∼110km) and 40 vertical levels, the land component BCC_AVIM1.1, the global ocean circulation model MOM4_L40v1, and the Sea Ice Simulator (SIS) model (Dong et al., 2018; Zhang et al., 2019; Song et al., 2020). The BCC_AVIM1.1 land surface model has the same horizontal resolution as the BCC_AGCM2.2 model. The MOM4_L40v1 ocean model adopts the horizontal resolution of 1°×1° poleward of 30°N and 30°S the meridional resolution gradually descending to 0.33° over the region between 30°N and 30°S with 40 vertical layers. The SIS sea ice model shares the same horizontal resolution as the MOM4_L40v1 ocean model (Liu et al., 2017). The model initial conditions for the BCC_S2SFS were produced by a nudging strategy, in which the atmospheric component was nudged toward the 6-h NCEP-FNL atmospheric reanalysis and the ocean component was nudged toward the daily observed SST (Liu et al., 2017; Zheng et al., 2020; Zhu et al., 2021).
Data
The data used in the current study are listed as follows: 1) The precipitation hindcast product of the daily rolling forecast of 60-days using the BCC_S2SFS from January 1, 1994 to December 31, 2013 with 4 lagged average forecasting ensemble members initialized at 00:00 UTC of the first forecast day and 06:00, 12:00, and 18:00 UTC of the previous day, respectively (Liu et al., 2017; Zheng et al., 2020). To reduce the uncertainties from initial conditions, we focus on the analysis of the ensemble mean of the 4 forecast members. 2) The daily gauge observed precipitation data at 397 stations over Eastern China (Figure 1) from January 1, 1994 to December 31, 2013, which is collected and quality controlled by the National Meteorological Information Center of China Meteorological Administration.
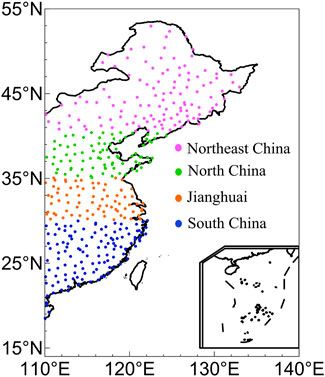
FIGURE 1. Locations of the 397 weather stations in Eastern China. Each sub-region is indicated by different colors.
Method
To compare the predictions with the observations, we first adopted the inverse distance weighting method (Bartier and Keller, 1996) to interpolate the observed precipitation onto the BCC_S2SFS model grids with the horizontal resolution of T106 (∼110km) within a radius of 1° around each grid box over Eastern China (east to 110°E, Figure 1). Then the observed daily precipitation in each summer (June to August) of 1994–2013 is converted into 10-day moving accumulated precipitation (i.e., the first 10-day moving accumulated precipitation is the total precipitation during June1st∼10th; the second 10-day moving accumulated precipitation is the total precipitation during June 2nd∼11th, and so on) to filter out the weather disturbance (Lin et al., 2019). After that, we have 83 (June 1 to August 22) values of the observed 10-day moving accumulated precipitation at each grid in each summer of 1994–2013. Correspondingly, for a given forecast lead time, the daily S2S precipitation hindcast product is also converted into 10-day moving accumulated precipitation at each grid during each summer of 1994–2013. Adopting the same data processing method for the predictions with 0, 1, 2,...., 30 days in advance, we have 83 values of predicted 10-day moving accumulated precipitation at each grid during each summer of 1994–2013 for each forecast lead time. The 10-day moving accumulated precipitation anomalies from observations and forecasts with different forecast lead times are further obtained by removing the corresponding climatology of the 20 years. All analyses are conducted based on the 10-day moving accumulated precipitation anomalies mentioned above.
To give the detailed prediction skill in different parts of Eastern China, which is divided into 4 sub-regions (Figure 1) with the consideration of the distinct climates over these sub-regions dominated by different components of the East Asian summer monsoon (Ding and Chan, 2005; Huang et al., 2013; Wang et al., 2017). The 4 sub-regions of Eastern China are listed as follows: Northeast China (north to 40°N), North China (35°–40°N), Jianghuai Basin (30°–35°N), and Southeast China (south to 30°N).
The temporal correlation coefficient (TCC) and spatial correlation coefficient (SCC) (Wei, 2007) were used to evaluate the prediction skills in producing the precipitation anomalies on the sub-seasonal time scale. The TCC and SCC values between the predictions and observations with different forecast lead time were calculated for each sub-region and the entire Eastern China in each summer, respectively. Note that the significance testing is the basic procedure for conducting forecast tests, but in the case of S2S predictions, it is difficult to pass the significance test or the level of significance is not high enough due to the complexity of the sources of predictability, and some sub-seasonal scale studies are based on empirical thresholds (Li et al., 2019; Zhou et al., 2019). Due to the reasons mentioned above, we did not conduct statistical significance test for SCC and TCC in this study. We just show to what extent the bias correction scheme can improve the prediction skill of BCC_S2SFS through the comparison of TCC (SCC) produced by the original and bias corrected predictions.
The SVD bias correction method has been applied to reduce the errors of the precipitation predictions to improve the dynamic models’ forecast skill (Feddersen et al., 1999; Qin et al., 2011). More details about the SVD analysis can refer to Bretherton et al. (1992). In this study, the SVD bias correction scheme was developed and adopted to correct the S2S precipitation predictions generated by the BCC_S2SFS. To correct the precipitation predictions for a given year with a given forecast lead time independently, we used the predictions with a given forecast lead time and observations in the 19 years out of the 20 years excluding the target year to conduct SVD analysis (Golub and Loan, 1996). Based on the SVD results for the observations and predictions with a given forecast lead time in the 19 years, we further establish a bias correction scheme to correct the precipitation predictions of the target year with a given forecast lead time. The main steps for the setup of the SVD bias correction scheme are summarized in Figure 2:
Step 1: We set the prediction field at a given lead time as the left field (X field) and the observation field as the right field (Y field) as follows:
where
Step 2: Based on the time coefficient
where
Step 3: In the
where
Step 4: According to Equation 3, the bias-corrected predictions in the
where
Step 5: To avoid the small deviation of the individual eigenvector for the prediction in the cross-validation year, an adjustment coefficient was introduced for the final correction (Kharin and Zwiers, 2001):
where c is the adjustment coefficient:
where Cov and Var are the covariance and the variance function, respectively.

FIGURE 2. Flowchart of the singular value decomposition (SVD) bias correction approach.
We can get 20 years (1994–2013) of bias-corrected predictions with different lead time by repeating the processes in Steps 1-5.
Results
Figure 3 shows the normalized time series of mean 10-day moving accumulated precipitation anomalies in observation and prediction over the forecast lead time of 0–10 days regionally averaged in Eastern China during June 1st to August 22nd in each year of 1994–2013. The prediction skill of BCC_S2SFS shows exceptionally large inter-annual fluctuation with the TCC ranging from −0.05 to 0.77. Since the S2S forecast has significant business service demand, the low skill of the original prediction skill cannot meet the operational needs. Hence, conducting the correction of original predictions of climate models is essential to improve the skills in the regional meteorological forecast (Tang et al., 2017). Compared to the original predictions, the skills of the bias-corrected forecasts with lead 0–10 days are remarkably improved in most years (15 years out of the 20 years) in terms of TCC. Meanwhile, the 20-year mean TCC is increased from 0.35 to 0.50 (Table 1), indicating that the skill of the original forecast can be significantly improved by about 43% through the bias correction.
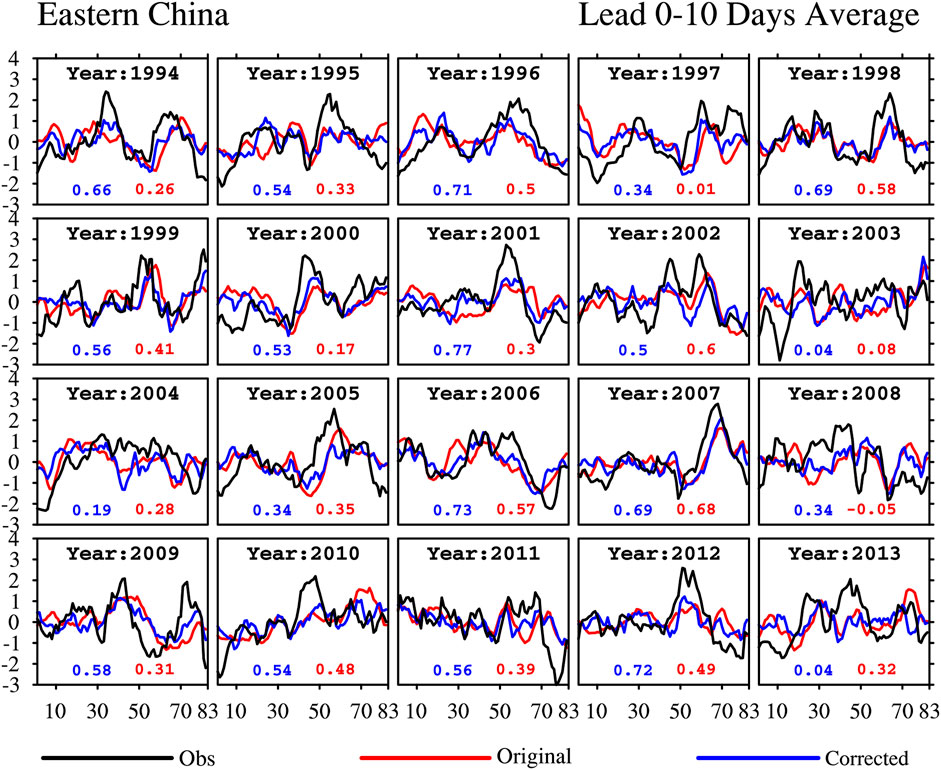
FIGURE 3. Normalized time series of the observed (black line), originally predicted, and the bias corrected 10-day moving accumulated precipitation anomalies with the forecast lead time of 0–10 days regionally averaged over Eastern China in each year of 1994–2013. The blue and red marked values represent the TCC values between the predictions with or without the bias correction and observations, respectively.
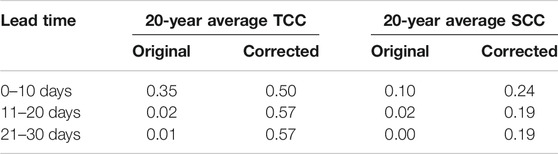
TABLE 1. The 20-year average TCC (SCC) for the original and bias-corrected 10-day moving accumulated precipitation anomaly predictions over Eastern China shown in Figures 3–5 (Figure 9J).
From Table 1, the 20-year mean TCC in the BCC_S2SFS forecasts with 11–20 days in advance is only 0.02, which is reduced by 0.33 relative to the original predictions with the lead time of 0–10 days. Even negative skills are noted in 7 years (i.e., 1994, 1997, 2000, 2001, 2006, 2009, and 2011) out of the 20 years for the original forecasts (Figure 4). However, no negative TCC values are generated in the bias-corrected predictions. It is noted that the prediction skills can be improved by the bias correction scheme in all years. The 20-year mean TCC is increased from 0.02 to 0.57 (Table 1).
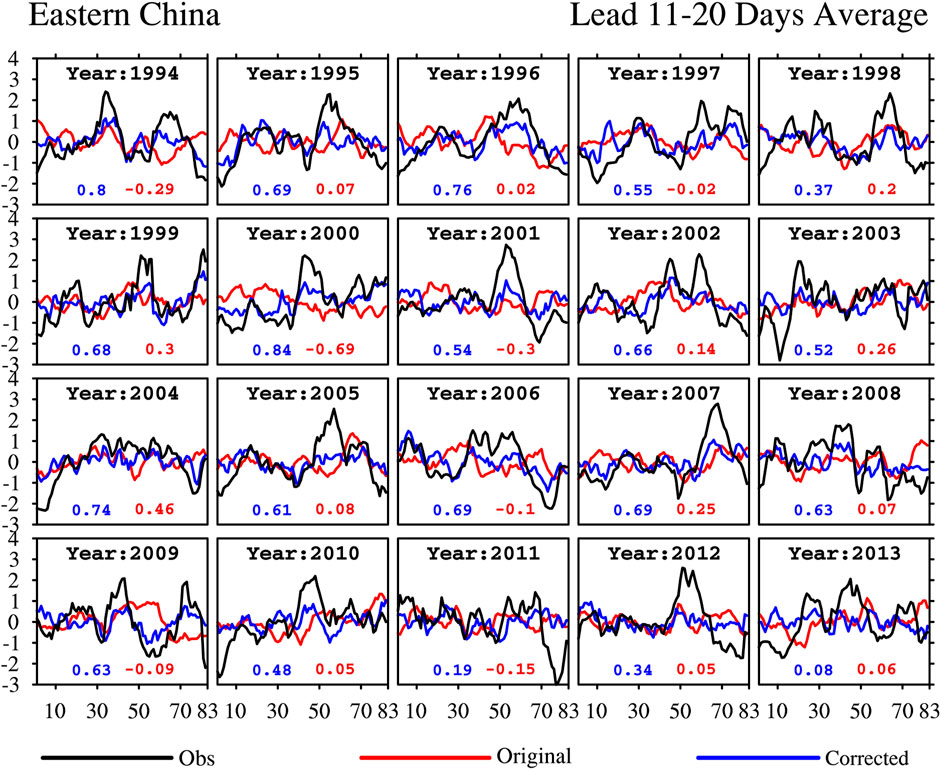
FIGURE 4. Same as Figure 3, but for the predictions with the forecast lead time of 11–20 days.
Compared to the predictions with lead 0–10 days and 11–20 days, the mean TCC of the 20 years produced by the BCC_S2SFS forecasts with 21–30 days in advance is reduced by 0.34 and 0.01 (Table 1), respectively. From Figure 5, the BCC_S2SFS forecasts with 21–30 days in advance even show opposite temporal variations of precipitation anomalies compared to the observation in 9 years (2000, 2001, 2004, 2006, 2007, 2009, 2010, 2012, and 2013) with the lowest TCC (−0.62) in 2009, which is followed by 2010 with a TCC of −0.38. The skills for the predictions with lead 21–30 days are remarkably improved by adopting the bias correction scheme in most years (17 years out of the 20 years) despite slightly deteriorated skills in the remaining 3 years (1998, 2005, and 2011). Overall, the 20-year mean TCC is increased from 0.01 in original forecasts to 0.57 in the bias corrected forecasts with 21–30 days in advance (Table 1).
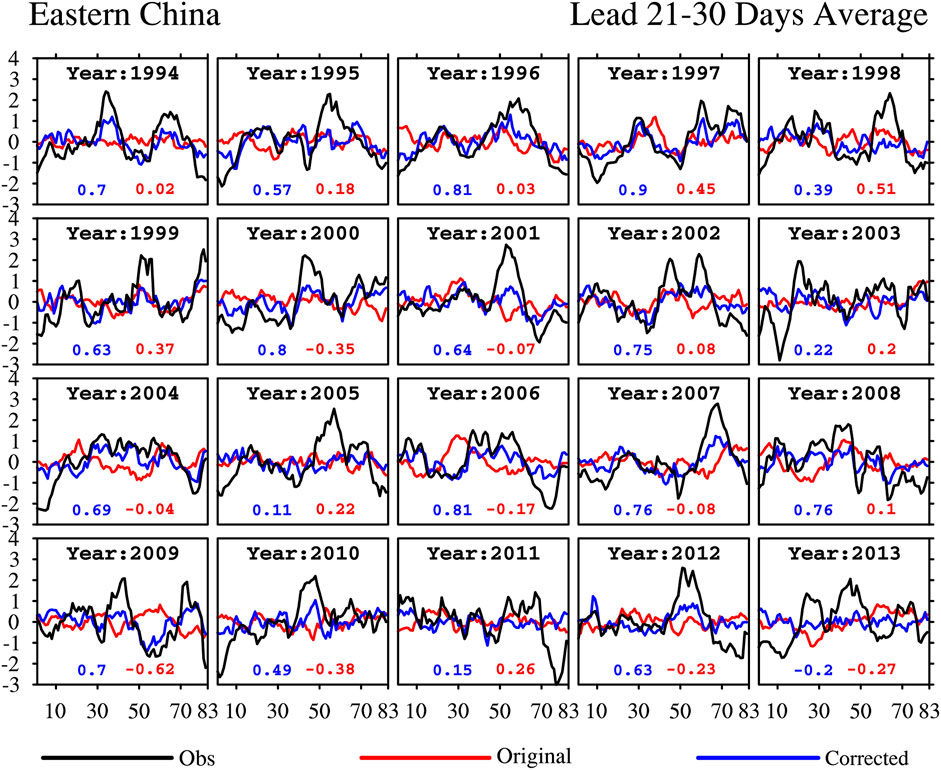
FIGURE 5. Same as Figure 3, but for the predictions with the forecast lead time of 21–30 days.
Figure 6 shows the distribution of the 20-year mean TCC values of the original predictions (Figures 6A1–A7), the bias corrected predictions (Figures 6B1–B7) with different forecast lead time, and the corresponding differences in TCC between corrected and original results. From Figures 6A1–A7, the TCC produced by the BCC_S2SFS tends to decrease with the forecast lead time increased. Meanwhile, clear regional differences in the prediction skills can be noted: The lowest skills are in North China and the eastern part of South China. Relatively higher skills are found in the areas south to the lower Yangtze River Valley and Northeast China. The forecast skills are dramatically decreased with the forecast lead time longer than 5 days. Meanwhile, the spatial distributions of the prediction skills are similar to the situation with the forecast lead time of 0 days. Compared to the original predictions of the BCC_S2SFS, the prediction skills with different forecast lead time over most Eastern China can be significantly improved by adopting the bias correction scheme (Figures 6B1–B7). It is noted that the skills of the bias corrected predictions decline with the lead time up to 15 days, after which the skill reduction trend with the forecast lead time further increased is not clear.
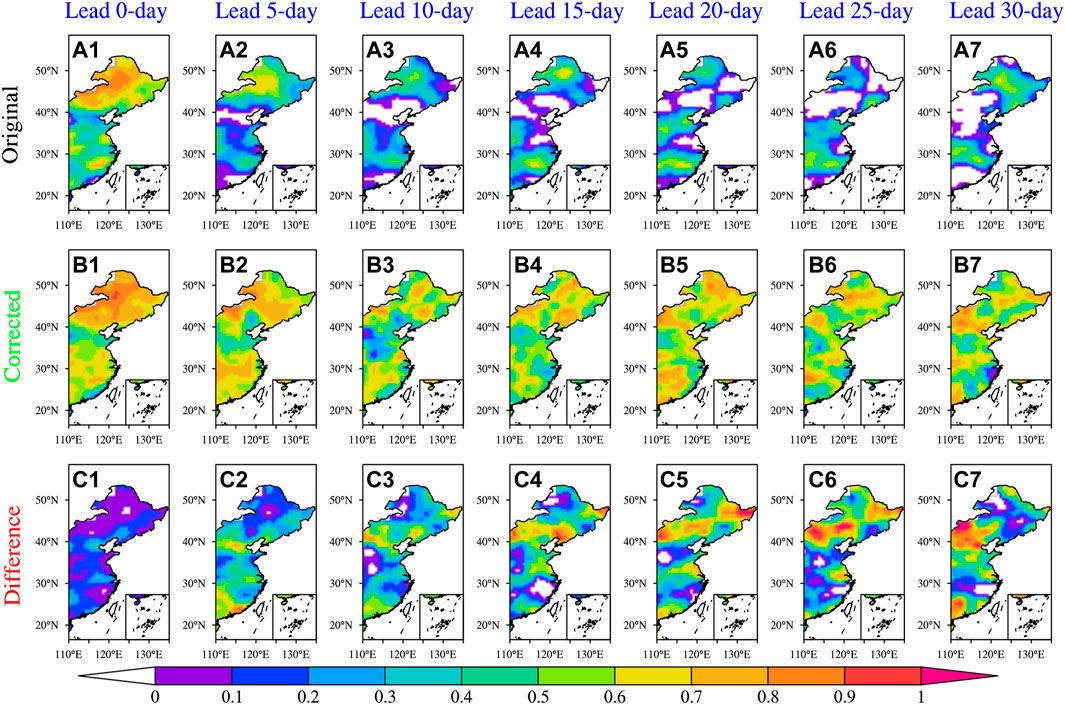
FIGURE 6. Distributions of the 20-year average TCC of the original predictions (A1–A7), the bias corrected predictions (B1–B7) with observations and their differences (bias corrected predictions—original predictions) (C1–C7) for the summer precipitation with different forecast lead time in Eastern China during 1994–2013.
The skills of the original forecasts improved by the bias corrected scheme exhibit clear regional differences (Figures 6C1–C7): Relatively larger improvements can be widely noted in North China, South China, and east parts of Northeast China with different forecast time longer than 5 days. In addition, the improvements tend to increase with the forecast lead time increased.
Figure 7 further shows the TCC of the original predictions with the forecast lead time of 0–30 days regionally averaged over each sub-region and Eastern China in 1994–2013. The TCC over all regions shows a clear reduction trend with the forecast lead time increased. In most areas, most TCC values with the forecast lead time longer than 5 days are less than 0.1. Compared to the original forecasts, the bias corrected predictions show clearly improved skills (with most TCC differences larger than 0.1) at the forecast lead time longer than 5 days in most years (Figures 7B1–B5), indicating stable improvements of the prediction skills by adopting the bias correction scheme.
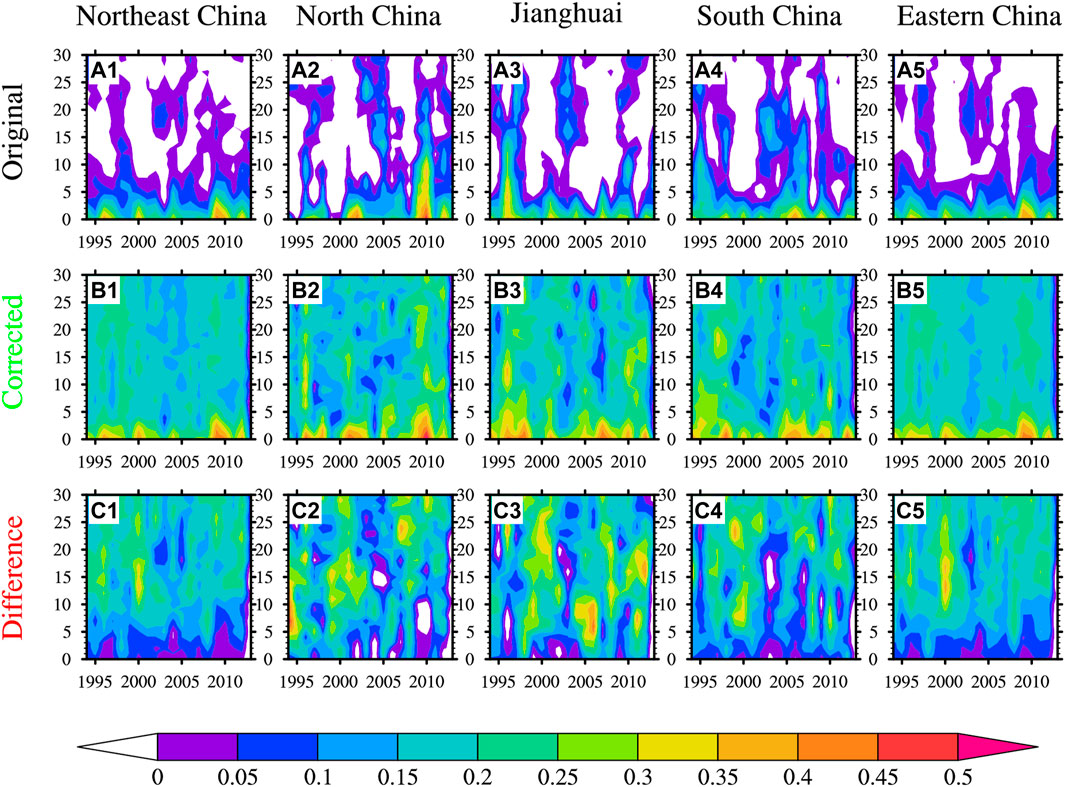
FIGURE 7. The temporal correlation coefficient (TCC) between the original (A1–A5), bias corrected predictions (B1–B5), and observations with the forecast lead time of 0–30 days (y-axis) in summer over each region during 1994–2013. The differences in TCC between the bias corrected predictions and original predictions for each region are shown in (C1–C5).
Figure 8 shows the differences in the 20-year average prediction skills between the bias corrected and original predictions with different forecast lead time in the 4 sub-regions and the entire Eastern China. Generally, the skill in each region is improved in most years. Among the 4 sub-regions of Eastern China, the improvements of the prediction skill in Northeast China are much smaller. Since the original forecast in Northeast China already has much higher skill than the other sub-regions (Figures 6A–A7), adopting the bias correction scheme can obtain limited improvements. Meanwhile, the bias corrected scheme tends to produce much larger improvements of prediction skill over the Jianghuai Basin and South China compared to other sub-regions. Compared to the TCC with the 0–10 days in advance, a relatively larger improvement is obtained with lead 11–20 days. The prediction skills can be further improved with the forecast lead time increased to 21–30 days. The improvements of the prediction skill with lead 11–20 days are much larger than the improvements in the forecast lead time of 0–10 days. It is also noted that further improvements of prediction skills are hard to obtain with the forecast lead time of 21–30 days relative to the forecast lead time of 11–20 days. The bias corrected predictions show lower skill during the lead time of 0–10 days in the year 2013 relative to the original forecasts, however, most cases with the lead time of 11–30 days are improved by adopting the bias correction scheme. Due to the improvements for most cases in the 20 years (Figure 9), we believe that the bias correction developed in this study can efficiently improve the dynamical model predictions despite degraded skill in very few years.
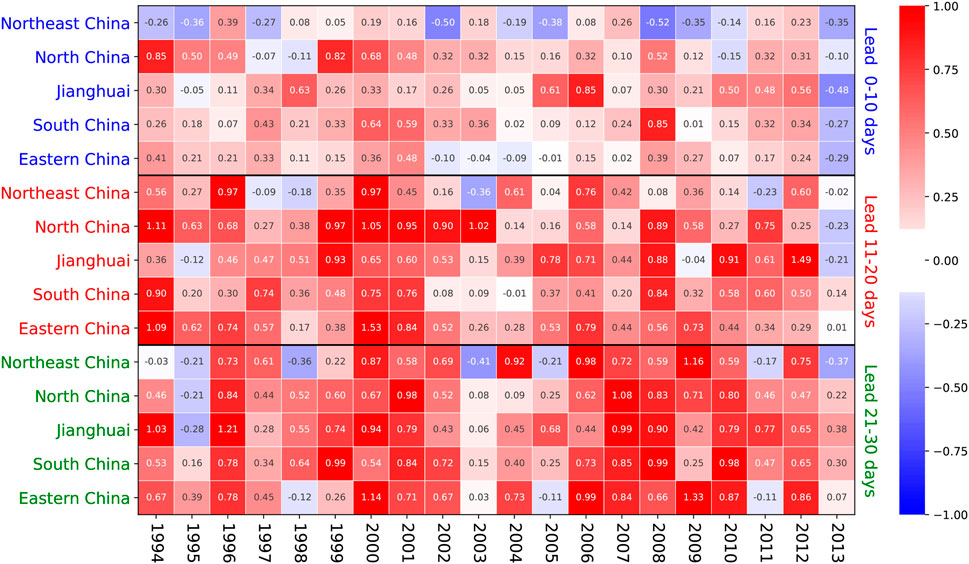
FIGURE 8. The differences in TCC between the bias corrected predictions and original predictions with different forecast lead time in each region during 1994–2013.
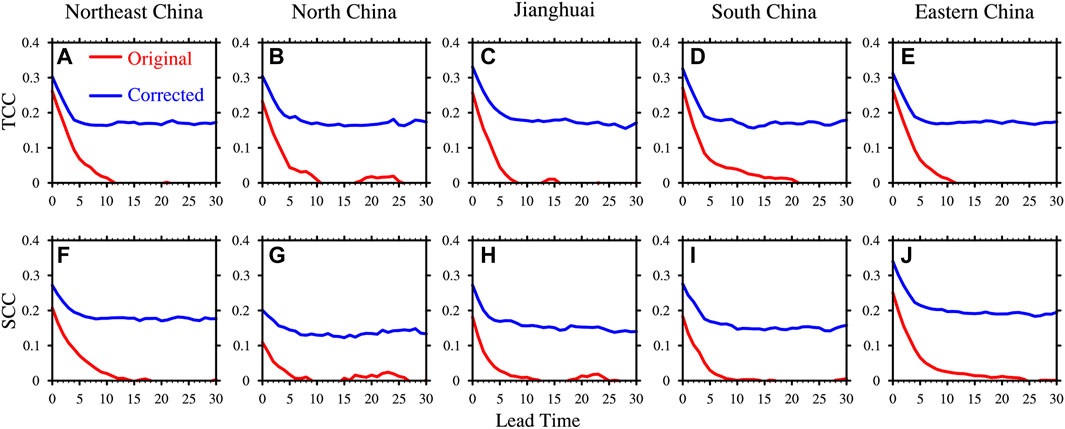
FIGURE 9. The 20-year average TCC (A–E) and SCC (F–J) of the original and bias corrected predictions with different forecast lead time (days) with observations averaged over each region.
Figure 9 shows the 20-year mean TCC and SCC values of the original and bias corrected predictions with different forecast lead time over each region. From Figures 9A–E, for the original predictions with the TCC values greater than 0, the shortest prediction timeline (about 7 days) is noted over Jianghuai Basin while the longest prediction timeline (about 20 days) is found in South China. The bias corrected predictions produced much higher TCC than the original forecasts with slight (much larger) improvements with the forecast lead time shorter (longer) than 5 days. In addition, SCC is further used to evaluate the skill in reproducing the spatial distribution of the observed precipitation anomalies (Figures 9F–J), it shows decreasing trend with the forecast lead time increased, which is similar to TCC. Meanwhile, similar improvements in the SCC can be obtained by adopting the bias correction scheme, i.e., relative to the original predictions, the 20-year mean SCC over Eastern China is increased by 0.14, 0.17, and 0.19 during the forecast lead time of 0–10 days, 11–20 days, and 21–30 days, respectively (Table 1). It is also noted that the skill of bias corrected forecasts is not degraded with the forecast lead time longer than 5 days despite a sharp decreasing trend during the forecast lead time less than 5 days, which is similar to the original forecast, implying that the predictive skills may not be degraded moving away from the initial conditions.
Conclusion and Discussion
In this study, the prediction skills of the BCC_S2SFS in forecasting the summer precipitation in Eastern China during 1994–2013 have been systematically evaluated. Meanwhile, a bias correction scheme based on SVD analysis has been developed to correct the BCC_S2SFS predictions and thereafter further improve the prediction skill of the summer precipitation over Eastern China at the sub-seasonal scale. The main findings are shown as follows:
The skills of the BCC_S2SFS in predicting the summer precipitation over Eastern China with different forecast lead time show remarkable regional and inter-annual differences. The prediction skills of summer precipitation over Eastern China sharply decrease with the forecast lead time increased and are lost after the lead time of 5 days over most Eastern China in most years. The 20-year mean TCC values produced by BCC_S2SFS with 0–10 days, 11–20 days, and 21–30 days in advance over Eastern China are 0.35, 0.02, and 0.01, respectively.
Adopting the bias correction scheme can efficiently improve the skill of BCC_S2SFS in predicting the sub-seasonal precipitation in summer over Eastern China with much larger improvements in the forecast lead time longer than 10 days. The relatively lower improvements for the predictions with lead 0–10 days are due to the much higher impact of the predictability of weather patterns on the model results, which cannot be overcome by the distilling of the specific climate features through the bias correction scheme. However, the bias corrections can be finally reconstructed in longer lead times when the impact of weather patterns becomes lost due to the limited predictability. Overall, the TCC (SCC) produced by the bias corrected predictions with 0–10 days, 11–20 days, and 21–30 days in advance can be increased by 0.15, 0.55, and 0.56 (0.14, 0.17, and 0.19) relative to the BCC_S2SFS original forecasts, respectively. The bias correction scheme developed in the current study shows large potential application prospects in the operational forecast.
Kug et al. (2008) and Wang et al. (2017) reported that the regression models established with the observations less than 30 years were unstable, and the prediction skill would decrease further with the reduction of data involved. In this study, only 20-year observations and predictions of summer precipitation were used to establish the bias correction scheme. In future studies, more data should be used to establish the bias correction scheme to further improve the prediction skill, and the information of slow-changing physical background would be employed in the coordinate correction to improve the understanding of the physical mechanism of summer precipitation in Eastern China.
Data Availability Statement
The original contributions presented in the study are included in the article/Supplementary Material. Further inquiries can be directed to the corresponding authors.
Author Contributions
ZF: Data curation; methodology; formal analysis; investigation; visualization; writing–original draft. AH: Supervision; writing–review and editing; validation. QH: Supervision; writing–review and editing; validation.
Funding
This study was partially supported by the National Key R&D Program of China (2016YFA0602104), the National Natural Science Foundation of China (41975081 and 41875111), and the Specific Project for Numerical Model Development of China Meteorological Administration (YBSZMSXM (2019)-03).
Conflict of Interest
The authors declare that the research was conducted in the absence of any commercial or financial relationships that could be construed as a potential conflict of interest.
Publisher’s Note
All claims expressed in this article are solely those of the authors and do not necessarily represent those of their affiliated organizations, or those of the publisher, the editors, and the reviewers. Any product that may be evaluated in this article, or claim that may be made by its manufacturer, is not guaranteed or endorsed by the publisher.
Acknowledgments
We appreciate the three reviewers for the constructive and detailed comments on both scientific analysis and presentation to improve our manuscript.
References
Bartier, P. M., and Keller, C. P. (1996). Multivariate Interpolation to Incorporate Thematic Surface Data Using Inverse Distance Weighting (IDW). Comput. Geosciences 22 (7), 795–799. doi:10.1016/0098-3004(96)00021-0
Bretherton, C. S., Smith, C., and Wallace, J. M. (1992). An Intercomparison of Methods for Finding Coupled Patterns in Climate Data. J. Clim. 5, 541–560. doi:10.1175/1520-0442(1992)005<0541:aiomff>2.0.co;2
Butler, A., Charlton-Perez, A., Domeisen, D. I. V., Garfinkel, C., Gerber, E. P., Hitchcock, P., et al. (2019). “Sub-Seasonal Predictability and the Stratosphere,” in Sub-Seasonal to Seasonal Prediction: The Gap between Weather and Climate Forecasting. Editors A. W. Robertson, and F. Vitart (Amsterdam, Netherlands: Elsevier), 223–241. doi:10.1016/b978-0-12-811714-9.00011-5
Chevallier, M., Massonnet, F., Goessling, H., GuémasandJung, V. T., and Jung, T. (2019). “The Role of Sea Ice in Sub-seasonal Predictability,” in Sub-Seasonal to Seasonal Prediction: The Gap between Weather and Climate Forecasting. Editors A. W. Robertson, and F. Vitart (Amsterdam, Netherlands: Elsevier), 201–221. doi:10.1016/b978-0-12-811714-9.00010-3
Chou, J., Zheng, Z., and Sun, S. (2010). The Think about 10-30 D Extended Range Numerical Weather Prediction Strategy Facing the Atmosphere Chaos. Sci. Meteorol. Sin. 30 (5), 569–573. (in Chinese).
de Andrade, F. M., Coelho, C. A. S., and Cavalcanti, I. F. A. (2019). Global Precipitation Hindcast Quality Assessment of the Subseasonal to Seasonal (S2S) Prediction Project Models. Clim. Dyn. 52, 5451–5475. doi:10.1007/s00382-018-4457-z
DelSole, T., Trenary, L., Tippett, M. K., and Pegion, K. (2017). Predictability of Week-3-4 Average Temperature and Precipitation over the Contiguous United States. J. Clim. 30, 3499–3512. doi:10.1175/jcli-d-16-0567.1
Ding, Y., and Chan, J. C. (2005). The East Ammer Monsoon: An Overview. Meteorology Atmos. Phys. 89 (1-4), 117–142. doi:10.1007/s00703-005-0125-z
Dong, M., Wu, T. W., Zuo, Q. J., and Gao, S. (2018). A Simulation Comparison Study on the Climatic Characteristics of the South Asia High by the BCC Climate System Model. Plateau Meteorology 37 (2), 455–468. (in Chinese).
Feddersen, H., Navarra, A., and Ward, M. N. (1999). Reduction of Model Systematic Error by Statistical Correction for Dynamical Seasonal Predictions. J. Clim. 12, 1974–1989. doi:10.1175/1520-0442(1999)012<1974:romseb>2.0.co;2
Golub, G. H., and Loan, C. F. V. (1996). Matrix Computations. 3rd ed. Baltimore: Johns Hopkins University Press.
Gong, Z., Dogar, M. M., Qiao, S., Hu, P., and Feng, G. (2018). Assessment and Correction of BCC_CSM's Performance in Capturing Leading Modes of Summer Precipitation over North Asia. Int. J. Climatol 38 (5), 2201–2214. doi:10.1002/joc.5327
Huang, R. H., Liu, Y., and Feng, T. (2013). Interdecadal Change of Summer Precipitation over Eastern China Around the Late-1990s and Associated Circulation Anomalies, Internal Dynamical Causes. Chin. Sci. Bull. 58, 1339–1349. (in Chinese). doi:10.1007/s11434-012-5545-9
Jeong, J.-H., Linderholm, H. W., Woo, S.-H., Folland, C., Kim, B.-M., Kim, S.-J., et al. (2013). Impacts of Snow Initialization on Subseasonal Forecasts of Surface Air Temperature for the Cold Season. J. Clim. 26, 1956–1972. doi:10.1175/jcli-d-12-00159.1
Jie, W., Vitart, F., Wu, T., and Liu, X. (2017). Simulations of the Asian Summer Monsoon in the Sub-seasonal to Seasonal Prediction Project (S2S) Database. Q.J.R. Meteorol. Soc. 143 (706), 2282–2295. doi:10.1002/qj.3085
Kharin, V. V., and Zwiers, F. W. (2001). Skill as a Function of Time Scale in Ensembles of Seasonal Hindcasts. Clim. Dyn. 17, 127–141. doi:10.1007/s003820000102
Kidston, J., Scaife, A. A., Hardiman, S. C., Mitchell, D. M., Butchart, N., Baldwin, M. P., et al. (2015). Stratospheric Influence on Tropospheric Jet Streams, Storm Tracks and Surface Weather. Nat. Geosci 8, 433–440. doi:10.1038/ngeo2424
Koster, R. D., Chang, Y., Wang, H., and Schubert, S. D. (2016). Impacts of Local Soil Moisture Anomalies on the Atmospheric Circulation and on Remote Surface Meteorological fields during Boreal Summer: A Comprehensive Analysis over North America. J. Clim. 29, 7345–7364. doi:10.1175/jcli-d-16-0192.1
Kug, J.-S., Lee, J.-Y., and Kang, I.-S. (2008). Systematic Error Correction of Dynamical Seasonal Prediction of Sea Surface Temperature Using a Stepwise Pattern Project Method. Monthly Weather Rev. 136 (9), 3501–3512. doi:10.1175/2008mwr2272.1
Li, W., Chen, J., Li, L., Chen, H., Liu, B., Xu, C.-Y., et al. (2019). Evaluation and Bias Correction of S2S Precipitation for Hydrological Extremes. J. Hydrometeorology 20 (9), 1887–1906. doi:10.1175/jhm-d-19-0042.1
Lin, R., Zhu, J., and Zheng, F. (2019). The Application of the SVD Method to Reduce Coupled Model Biases in Seasonal Predictions of Rainfall. J. Geophys. Res. Atmos. 124 (22), 11837–11849. doi:10.1029/2018jd029927
Liu, X., Wu, T., Yang, S., Jie, W., Nie, S., Li, Q., et al. (2015). Performance of the Seasonal Forecasting of the Asian Summer Monsoon by BCC_CSM1.1(m). Adv. Atmos. Sci. 32 (8), 1156–1172. doi:10.1007/s00376-015-4194-8
Liu, X., Wu, T., Yang, S., Li, Q., Cheng, Y., Liang, X., et al. (2014). Relationships between Interannual and Intraseasonal Variations of the Asian-Western Pacific Summer Monsoon Hindcasted by BCC_CSM1.1(m). Adv. Atmos. Sci. 31 (5), 1051–1064. doi:10.1007/s00376-014-3192-6
Liu, X. W., Wu, T. W., Yang, S., Li, T., Jie, W. H., Zhang, L., et al. (2017). MJO Prediction Using the Sub-seasonal to Seasonal Forecast Model of Beijing Climate Center. Clim. Dyn. 48 (9-10), 3283–3307. doi:10.1007/s00382-016-3264-7
Lorenz, E. (1975). Climate Predictability: The physical Basis of Climate Modeling. ARP Publication Series 16, WMO, 132–136.
Lorenz, E. N. (1963). Deterministic Nonperiodic Flow. J. Atmos. Sci. 20, 130–141. doi:10.1175/1520-0469(1963)020<0130:dnf>2.0.co;2
Mariotti, A., Ruti, P. M., and Rixen, M. (2018). Progress in Subseasonal to Seasonal Prediction through a Joint Weather and Climate Community Effort. npj Clim. Atmos. Sci. 1 (1), 636–646. doi:10.1038/s41612-018-0014-z
Materia, S., Muñoz, Á. G., Álvarez-Castro, M. C., Mason, S. J., Vitart, F., and Gualdi, S. (2020). Multimodel Subseasonal Forecasts of Spring Cold Spells: Potential Value for the Hazelnut Agribusiness. Weather Forecast. 35 (1), 237–254. doi:10.1175/waf-d-19-0086.1
Merryfield, W. J., Baehr, J., Batté, L., Becker, E. J., Butler, A. H., Coelho, C. A. S., et al. (2020). Current and Emerging Developments in Subseasonal to Decadal Prediction. Bull. Am. Meteorol. Soc. 101 (6), E869–E896. doi:10.1175/BAMS-D-19-0037.1
Olaniyan, E., Adefisan, E. A., Oni, F., Afiesimama, E., Balogun, A. A., and Lawal, K. A. (2018). Evaluation of the ECMWF Sub-Seasonal to Seasonal Precipitation Forecasts during the Peak of West Africa Monsoon in Nigeria. Front. Environ. Sci. 6, 4–16. doi:10.3389/fenvs.2018.00004
Qin, Z. K., Lin, Z. H., Chen, H., and Sun, Z. B. (2011). The Bias Correction Methods Based on the EOF/SVD for Short-Term Climate Prediction and Their Applications. Acta Meteorologica Sinica 69 (2), 289–296. (in Chinese).
Saha, S., Moorthi, S., Wu, X., Wang, J., and Becker, E. (2012). The NCEP Climate Forecast System Version 2. J. Clim. 27 (6), 2185–2208. doi:10.1175/JCLI-D-12-00823.1
Shan, J. K., Liang, X. Y., Wu, T. W., Liu, X. W., and Li, Q. P. (2018). Simulation of the Asian-Pacific Oscillation Using the BCC-CSM1.1(m) Model. Chin. J. Geophys. 61 (1), 106–118. (in Chinese).
Song, M. H., Wu, T. W., Zhang, Y., Zhang, S. B., Long, Y. P., and Li, Y. (2020). Evaluation on Simulated Snow Depth over Qinghai-Tibetan Plateau with BCC-CSM(m) Model during Recent 30 Years and its Impact on Precipitation in Summer. Plateau Meteorology 39 (1), 15–23. (in Chinese).
Sun, J. Q., Ma, J. H., Chen, H. P., Wang, J., Yu, E. T., and Tian, B. Q. (2018). Application of Downscaling Methods in the East Asian Climate Prediction. Chin. J. Atmos. Sci. 42 (4), 806–822. (in Chinese).
Tang, H. Y., Li, Y. H., He, H. G., Dong, X. L., and Zhang, C. (2017). Application of Analogous Precursor Circulation Anomaly Method to Extended-Range Weather Forecast in Chongqing. Meteorol. Sci. Technol. 45 (1), 72–78. (in Chinese).
Vitart, F., Ardilouze, C., Bonet, A., Brookshaw, A., Chen, M., Codorean, C., et al. (2016). The Subseasonal to Seasonal (S2S) Prediction Project Database. Bull. Am. Meteorol. Soc. 98 (1), 163–173. doi:10.1175/BAMS-D-16-0017.1
Vitart, F. (2017). Madden-Julian Oscillation Prediction and Teleconnections in the S2S Database. Q.J.R. Meteorol. Soc. 143 (706), 2210–2220. doi:10.1002/qj.3079
Vitart, F., and Robertson, A. W. (2018). The Sub-Seasonal to Seasonal Prediction Project (S2S) and the Prediction of Extreme Events. npj Clim. Atmos. Sci. 1 (1), 3549–3560. doi:10.1038/s41612-018-0013-0
Wang, L., Ren, H. L., Cheng, Q. L., Tian, B., and Liu, Y. (2017). Statistical Correction of ENSO Prediction in BCC_CSM1.1m Based on Stepwise Pattern Projection Method. Meteorol. Monthly 43 (3), 294–304. (in Chinese).
Wang, Q., Huang, A., Zhao, Y., Zhou, Y., Yang, B., Zhang, L., et al. (2016). Evaluation of the Precipitation Seasonal Variation over Eastern China Simulated by BCC_CSM Model with Two Horizontal Resolutions. J. Geophys. Res. Atmos. 121 (14), 8374–8389. doi:10.1002/2016jd024959
Wang, Z., Duan, A., and Wu, G. (2014). Time-Lagged Impact of Spring Sensible Heat over the Tibetan Plateau on the Summer Rainfall Anomaly in East China: Case Studies Using the WRF Model. Clim. Dyn. 42 (11-12), 2885–2898. doi:10.1007/s00382-013-1800-2
Wei, F. Y. (2007). Modern Climate Statistical Diagnosis and Prediction Technology. 2nd ed. Beijing: China Meteorological Press, 10–28. (in Chinese).
White, C. J., Carlsen, H., Robertson, A. W., Klein, R. J. T., Lazo, J. K., Kumar, A., et al. (2017). Potential Applications of Subseasonal-To-Seasonal (S2S) Predictions. Met. Apps 24, 315–325. doi:10.1002/met.1654
Williams, I. N., Lu, Y., Kueppers, L. M., Riley, W. J., Biraud, S. J., Bagley, E., et al. (2016). Land–atmosphere Coupling and Climate Prediction over the US Southern Great Plains. J. Geophys. Res. Atmospheres 121, 12125–12144. doi:10.1002/2016jd025223
Woolnough, S. J. (2019). “The Madden-Julian Oscillation,” in Sub-Seasonal to Seasonal Prediction: The Gap between Weather and Climate Forecasting. Editors A. W. Robertson, and F. Vitart (Amsterdam, Netherlands: Elsevier), 93–117. doi:10.1016/b978-0-12-811714-9.00005-x
Wu, J., Ren, H. L., Zhang, S., Liu, Y., and Liu, X. W. (2017). Evaluation and Predictability Analysis of Seasonal Prediction by BCC Second-Generation Climate System Model. Chin. J. Atmos. Sci. 41 (6), 1300–1315. (in Chinese).
Wu, L. Q., Li, Q. Q., Ding, Y. H., Wang, L. J., Xin, X. G., and Wei, M. (2019). Preliminary Assessment on the Seasonal Hindcast Skill of the Arctic Oscillation with Decadal experiment by BCC_CSM1.1 Climate Model. Clim. Change Res. 15 (1), 1–11. (in Chinese).
Wu, T., Li, W., Ji, J., Xin, X., Li, L., Wang, Z., et al. (2013). Global Carbon Budgets Simulated by the Beijing Climate Center Climate System Model for the Last century. J. Geophys. Res. 118 (10), 4326–4347. doi:10.1002/jgrd.50320
Wu, T. W., Song, L. C., Li, W. P., Wang, Z. Z., Zhang, H., Xin, X. G., et al. (2014). An Overview on Progress in Beijing Climate Center Climate System Model-Its Development and Application to Climate Change Studies. Acta Meteorologica Sinica 72 (1), 12–29. (in Chinese).
Xu, M., Luo, L. S., Cheng, Z., and Duan, C. F. (2018). Verification and Correction of Hindcast in Summer over East Asia Based on MRI Coupled Ocean-Atmosphere General Circulation Mode1. Acta Meteorologica Sinica 76 (1), 32–46.
Yang, Z., Zhang, J., and Wu, L. (2019). Spring Soil Temperature as a Predictor of Summer Heatwaves over Northwestern China. Atmos. Sci. Lett. 20, e887. doi:10.1002/asl.887
Zhang, D. Q., Sun, F. H., and Zhang, Y. C. (2019). Evaluation of Seasonal Prediction for Summer Rainfall in China Based on BCC Second-Generation Short-Range Climate Forecast System. Plateau Meteorology 38 (6), 1229–1240. (in Chinese).
Zheng, F., Zhu, J., Zhang, R.-H., and Zhou, G.-Q. (2006). Ensemble Hindcasts of SST Anomalies in the Tropical Pacific Using an Intermediate Coupled Model. Geophys. Res. Lett. 33 (19), L19604. doi:10.1029/2006gl026994
Zheng, L., Zhang, Y., and Huang, A. (2020). Sub-seasonal Prediction of the 2008 Extreme Snowstorms over South China. Clim. Dyn. 55, 1979–1994. doi:10.1007/s00382-020-05361-9
Zheng, R., Liu, J. H. M., and Ma, Z. F. (2019). Application of an Interannual Increment Method for Summer Precipitation Forecast in Southwest China. Acta Meteorologica Sinica 77 (3), 489–496. (in Chinese).
Zhou, Y., Yang, B., Chen, H., Zhang, Y., Huang, A., and La, M. (2019). Effects of the Madden-Julian Oscillation on 2-m Air Temperature Prediction over China during Boreal winter in the S2S Database. Clim. Dyn. 52 (11), 6671–6689. doi:10.1007/s00382-018-4538-z
Keywords: summer precipitation, Eastern China, sub-seasonal to seasonal forecast, singular value decomposition, bias correction
Citation: Fu Z, Huang A and Guo Q (2022) Improvements of the Sub-Seasonal Precipitation Predicted by the BCC_S2S Forecast System Over Eastern China in Summer Using the Singular Value Decomposition Bias Correction Method. Front. Earth Sci. 9:770167. doi: 10.3389/feart.2021.770167
Received: 03 September 2021; Accepted: 22 December 2021;
Published: 09 February 2022.
Edited by:
Tomas Halenka, Charles University, CzechiaReviewed by:
Chenghai Wang, Lanzhou University, ChinaStefano Materia, Fondazione Centro Euro-Mediterraneo sui Cambiamenti Climatici (CMCC), Italy
Copyright © 2022 Fu, Huang and Guo. This is an open-access article distributed under the terms of the Creative Commons Attribution License (CC BY). The use, distribution or reproduction in other forums is permitted, provided the original author(s) and the copyright owner(s) are credited and that the original publication in this journal is cited, in accordance with accepted academic practice. No use, distribution or reproduction is permitted which does not comply with these terms.
*Correspondence: Anning Huang, anhuang@nju.edu.cn; Qu Guo, guoqu510@163.com