 René Mania
 Simone Cesca
 Thomas R. Walter
 Ivan Koulakov2,3,4
94% of researchers rate our articles as excellent or good
Learn more about the work of our research integrity team to safeguard the quality of each article we publish.
Find out more
ORIGINAL RESEARCH article
Front. Earth Sci. , 16 December 2021
Sec. Volcanology
Volume 9 - 2021 | https://doi.org/10.3389/feart.2021.765668
This article is part of the Research Topic Remote Sensing in Volcanology View all 7 articles
Explosive eruptions at steep-sided volcanoes may develop with complex precursor activity occurring in a poorly-understood magma plumbing system so that timelines and possible interactions with the geologic surrounding are often unresolved. Here we investigate the episode prior to the energetic December 20, 2017 eruption at Bezymianny volcano, Kamchatka. We compare degassing activity inferred from time-lapse camera images, seismicity and real-time seismic amplitude (RSAM) data derived from a temporary station network, as well as high-resolution InSAR displacement maps. Results show that the first changes can be identified in low-frequency seismicity and degassing at least 90 days before the eruption, while the first volcano-tectonic (VT) seismicity occurred 50 days before the eruption. Coinciding with significant changes of the RSAM, surface displacements affect the volcanic flanks at least 9 days prior to the eruption. Inversion modeling of the pre-eruptive surface deformation as well as deflation-type, co-eruptive surface changes indicate the presence of a shallow and transient reservoir. We develop a conceptual model for Bezymianny volcano initiating with deep seismicity, followed by shallow events, rockfalls, steaming and an inflating reservoir. The eruption is then associated with subsidence, caused by deflation of the same reservoir. This sequence and conceivable causality of these observations are providing a valuable contribution to our understanding of the shallow magma plumbing system beneath Bezymianny and may have relevance for volcano monitoring and early warning strategies at similar volcanoes elsewhere.
Eruptions of volcanoes are commonly preceded by the arrival of new magma, or its mobilization by other factors internal or external to the magma plumbing system (Jaupart and Allègre, 1991). The magmatic system of volcanoes stretches through the entire crust and is commonly composed of multiple magmatic reservoirs interconnected by magma conduits within a largely crystalline mush zone (e.g., Cashman et al., 2017). Interstitial melt within the mush can coalesce to form new magma within the plumbing system. In arc environments, the uppermost reservoir is thought to be volumetrically small and transient (e.g., Cashman et al., 2017) that becomes intermittently reactivated by the ascent of small batches of magma and/or volatiles until either a crucial amount of eruptible magma has accumulated (Parks et al., 2012), the critical buoyancy is achieved (Caricchi et al., 2014), or the overpressure becomes critical due to accumulation of exsolved volatiles at the reservoir roof (Tait et al., 1989; Cashman et al., 2017). Ultimate destabilization of the shallow reservoir and upper conduit formation may be accomplished by pressurization of the shallow reservoir tapping the magmatic bulk of the deeper reservoir (Scandone et al., 2007; Roman and Cashman, 2018). To better understand the distribution, migration, and accumulation of magmatic fluids within the magma plumbing system of active volcanoes, it is crucial to combine different geophysical and geochemical disciplines (Burchardt and Galland, 2016; Magee et al., 2018).
Numerous physical signals perceptible at the surface are considered to reflect the state of magma migration through the plumbing system and are therefore now routinely used to detect and forecast volcanic activity (Scarpa and Gasparini, 1996; Sparks, 2003). These include ground- and space-based techniques to monitor earthquakes, ground deformation, volcanic gas emissions, as well as thermal anomalies, amongst others (e.g., Tilling, 2008; Coppola et al., 2020). A number of studies worldwide showed that seismic and geodetic changes preceding eruption events may be spatially and temporally closely related, although recent studies suggest that seismicity and deformation highlight different processes (Lundgren et al., 2017). Based on the frequency content, seismicity may be broken down into very long period (VLP), long-period (LP), and higher frequent volcano-tectonic (VT) events to distinguish between gas-rich fluid migration causing oscillations in the host rock (LPs) and fracturing processes (VTs) associated with migration of viscous magma (Chouet and Matoza, 2013). VT earthquakes at many volcanoes occur in distal swarms days to years before and are peaking at the time of the imminent eruption (White and McCausland, 2016). The initial conduit formation connecting the different storage levels may be marked by shallow precursor VT events long before the ultimate run-up VT seismicity commences, such as observed at Mount St. Helens, Redoubt, or Augustine volcanoes (Roman and Cashman, 2018). But also aseismic processes including passive degassing of H2O and CO2 may point out the beginning of the formation of magmatic pathways (Girona et al., 2015; Caricchi et al., 2018). Associated seismic signals are very weak and may remain undetected when a dense seismic station network around the volcano is absent. Otherwise, dedicated techniques used for the detection of weak seismic sequences, such as approaches that are based on arrival time coherence (Heimann et al., 2017), may be appropriate. Microseismic monitoring may allow for the identification of subtle changes occurring inside a volcano plumbing system but may require additional qualitative information, such as degassing behavior derived from optical time-lapse camera images.
Surface deformation associated with the migration of magmatic fluids, faulting, dike intrusions, or magma chamber in- and deflation can be traced with modern geodetic monitoring techniques (e.g., Biggs and Pritchard, 2017). Satellite-based synthetic aperture radar (SAR), for instance, measures the timing between emitted electromagnetic pulses and the backscattered signal, which mainly depends on the acquisition geometry as well as roughness and dielectric properties of the surface (Massonnet and Feigl, 1998). With the advantage of its all-day and all-weather capability of the signal emitted at the microwave spectrum, associated radar phase changes computed between two acquisitions (phase interferometry or InSAR) are now routinely used to analyze large- and small-scale volcanic deformation (Valade et al., 2019; Biggs and Wright, 2020). The scale and expression of the deformation field then allow for inferring the depth and geometry of the corresponding deformation source even at remote volcanoes (Biggs and Pritchard, 2017). Here we decipher the chronology of observed changes of seismic, visual, and geodetic monitoring data showing a gradual evolution of unrest and preparation for a magmatic eruption on December 20, 2017 at Bezymianny volcano, one of the most active volcanoes in the world. To gain a better understanding of the timing of magmatic processes leading to this eruption, we here compare the seismic records with a new analysis of the real-time seismic amplitude measurements (RSAM). We compare the temporal evolution of the seismic results with the visual records inferred from time-lapse camera images and we also performed the first high resolution ground deformation analysis derived from interferometric processing of high-resolution TerraSAR-X data.
By comparing the location and timing of the observed precursors, we show that a rather broad region is affected by unrest and that the eruption initiated at least 3 months in advance. Based on an identified seismic unrest, near-simultaneous pre-eruptive inflation and short co-eruptive deflation, we propose a conceptual model. In this, seismicity and tremors occur in pulses at crustal depth beneath the edifice, followed by more shallow inflation of a reservoir at the base of the edifice. We speculate that gas-rich fluid and/or magma migration within the shallowest level of the volcano’s plumbing system is responsible for these observations. Significant deviations between topographically inferred and source-inversion derived volumetric changes indicate that the shallow reservoir ultimately tapped the bulk of the erupted volcanic products. We further note a striking anti-correlation between the course of the seismic amplitudes and atmospheric data and discuss possible external pressure changes that may have contributed to some degree to the variations of the seismic activities. Our results further contribute to the complexity of precursor activity at the remotely located Bezymianny volcano showing that the preparation can last for several months without any indications in the absence of a dense monitoring network.
Bezymianny is a strongly degassing (López et al., 2013; Zelenski et al., 2015), basaltic-andesitic to dacitic dome-building stratovolcano (Ozerov et al., 1997; Turner et al., 2013) that lies in the subarctic region of the high-relief Klyuchevskoy Group of Volcanoes (KGV) in Kamchatka, Far East Russia (Figures 1A,B). In 1956, a cryptodome intrusion, similar to that of Mount St. Helens, caused a significant sector collapse triggering a cataclysmic lateral blast eruption (Gorshkov, 1959; Lipman et al., 1981; Voight et al., 1981; Bogoyavlenskaya et al., 1985; Belousov, 1996). Subsequent continuous volcanic activity was characterized by 1 or 2 explosive eruptions per year accompanied by almost constant dome growth, which now nearly reached the height of the pre-1956 edifice (Girina, 2013; Shevchenko et al., 2020). The plumbing system of the Bezymianny volcano may root deeply, with modulations that are possibly affected by pressurization of the deep reservoir beneath the nearby Tolbachik volcano (Shapiro et al., 2017). Seismic investigations showed that the magmatic transport system beneath Bezymianny is characterized by at least two reservoirs located at ca. 18 and 8 km depth (Fedotov et al., 2010; Thelen et al., 2010; Ivanov et al., 2016; Koulakov et al., 2017), which agrees with temperature and pressure conditions of amphibole crystallization (Turner et al., 2013). Further petrologic data indicated the existence of a shallow reservoir located at ca. 3 km depth (Shcherbakov et al., 2011), and seismicity of Bezymianny’s eruption sequence in 2007 suggest a volatile zone to be located at 1.5—1 km depth (Thelen et al., 2010).
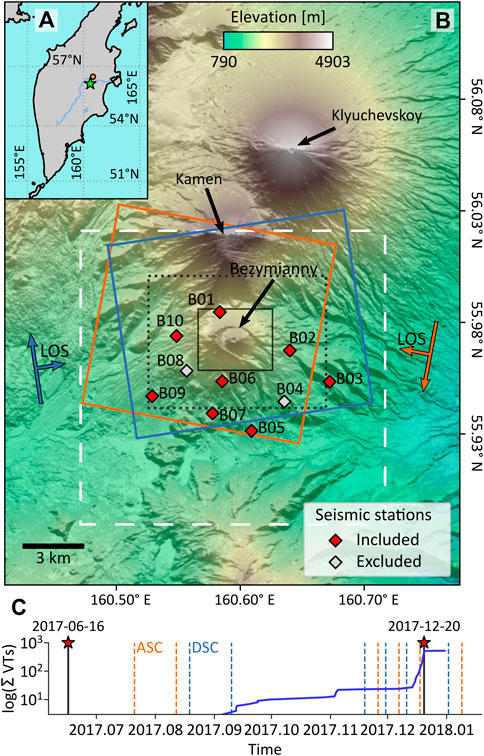
FIGURE 1. (A) Overview map of Kamchatka, Far East Russia. The green star and orange point denote the location of Bezymianny volcano and the town of Klyuchi, respectively. (B) Topographic map (TanDEM-X elevation model) of the studied Bezymianny volcano and neighboring edifices (Klyuchevskoy, Kamen). Locations of the temporary (2017–2018) seismic stations are indicated by diamonds. Ascending (ASC) and descending (DSC) TerraSAR-X/TanDEM-X acquisition footprints are indicated by the red and blue boxes, respectively, and arrows show the corresponding flight direction as well as the Line-Of-Sight (LOS) direction of the satellites. Black dashed rectangle delineates the extent of the high-resolution Digital Elevation Models used for interferometric analysis. The White dashed box shows the search extent of the Lassie analysis. Red symbols denote stations used for the analysis of Bezymianny’s December 20, 2017 eruption as highlighted by the gray vertical line and a red star in (C): Investigated timeline showing the ASC and DSC acquisitions at Bezymianny as well as cumulative volcano-tectonic (VT) events for Bezymianny (Koulakov et al., 2021). The red star and vertical line on 2017-06-16 depict the previous eruption of Bezymianny.
Geodetic investigations on ground surface changes related to the magma plumbing system of Bezymianny are scarce and challenging. Prior to eruptions between 2005 and 2010, a campaign GPS network revealed minor deformation associated with the presence of a shallow but small (1–4 × 10⁻⁴ km3) reservoir (Grapenthin et al., 2013). Since only one GPS station of this campaign showed deviations in the north component, other stations were damaged by the action of bears and harsh outdoor conditions, Grapenthin and co-authors (2013) could not resolve details on the geometry and potential variations of this source. During the 2016–2017 eruption sequence, a satellite-based Synthetic Aperture Radar (SAR) study provided first detailed information on recurrent extrusions of the solidified conduit as well as shallow intrusions that might be related to magmatic processes within the upper carapace of Bezymianny’s evolved dome (Mania et al., 2019). This study revealed extrusion occurrences and displacements affecting the summit region of the central cone of Bezymianny. A deformation on the volcano’s outer flanks was not identified.
A combined seismic and geodetic data analysis the second half of 2017 greatly advanced our understanding of Bezymianny’s magma plumbing system (Figure 1B), where seismicity and summit deformations were recorded before, during, and after the December 20, 2017 eruption, which was one of the largest eruptions in recent times producing a 15-km-high ash column (Girina et al., 2018; Koulakov et al., 2021). Related seismic tomography results revealed two closely neighboring, strong seismic anomalies that stretch down from 2 km to >6 km below the surface (Koulakov et al., 2021). The authors indicate that the corresponding pressure (Vp) and shear wave (Vs) anomalies may reflect the co-existence of a magma reservoir and a highly permeable gas reservoir governing the eruptive activity at Bezymianny. The associated seismicity was characterized by a proximal small VT swarm and exponentially increasing run-up VTs occurring 50 and 7 days before the December 20, 2017 eruption, respectively, (Figure 1C), which is typical for Bezymianny (Senyukov, 2013). The ultimate precursor seismicity was associated with upward migration of gas-rich magma that induced pressurization of the shallowest (2–0 km) part of Bezymianny’s uppermost conduit system. The corresponding deformation was evident by SAR amplitude data at the uppermost summit region again, causing fracture opening likely related to the extrusion of the conduit plug (Koulakov et al., 2021), which is also a common precursor for Bezymianny (Belousov et al., 2002; Girina, 2013; Mania et al., 2019).
Both, installation of field stations at Bezymianny and tasking of high resolution spotlight TerraSAR-X satellite images was initiated and realized before the eruption of the volcano. Below we outline the data and methods which aim to compare the occurrence of seismicity, as identified by volcano-tectonic (VT) events, microseismicity, and noise analysis, to a novel set of high-resolution satellite radar interferograms generated by TerraSAR-X data, to explore the chronology and location of events prior to the December 22, 2017 eruption.
In August 2017, a local broadband array of 10 stations was deployed in the vicinity of Bezymianny (Figure 1B) and re-collected in July 2018, thus well covering the December 2017 eruption investigated in this work. In combination with continuous seismic data derived from the regional permanent station network and 6 stations of the temporary network, Koulakov et al. (2021) detected and located 523 local seismic volcano-tectonic (VT) events manually by using the interactive DIMAS software (Droznin and Droznina, 2011). This dataset served 1) to generate a tomographic model describing the magma plumbing system beneath Bezymianny, and 2) allowed analyzing the chronology of events. Specifically, a small cluster was detected at the beginning of November 2017 and one large cluster started to emerge on December 14, 2017 increasing exponentially until the anticipated eruption on December 20, 2017 (Figure 1C). To further shed light on the very small seismicity (microseismicity) and to gain a better understanding of the preparatory phase of the volcano, we first use the Pyrocko library (Heimann et al., 2017) to calculate the power spectral density for the waveforms by applying a 1 h time window with no overlap. The resulting spectrogram is created for station B01 north of Bezymianny. Second, we investigate the real-time seismic amplitude measurement (RSAM) similar to Endo and Murray (1991) but by calculating the median of the absolute amplitude of the bandpass filtered (1–10 Hz) waveforms based on a 1 h time window and select the N-component as a proxy for the corresponding station noise.
Third, we study the continuous waveforms recorded by the local array with an automatic detection algorithm (the freely available “Lassie” tool1; Heimann et al., 2017). Our aim is here to derive a seismic catalog that is particularly concentrating on identifying weak, previously undetected events and thus to better track the temporal evolution of the seismicity rate. The approach is considered complimentary to the accurate seismic event location study previously published in Koulakov et al. (2021). While the Koulakov study provides the locations for the largest events, we here show the presence of very small hidden events using the Lassie approach. Lassie explores the bandpass-filtered (4th order Butterworth bandpass filter between 1 and 10 Hz) waveforms, detecting coherent P and S wave arrivals at each station; a hypocentral location is also estimated for each event (López-Comino et al., 2017; Adinolfi et al., 2019). Travel time corrections are calculated for a 3D grid of 15 × 15 × 15 km in size and a grid spacing of 500 m (grid center at 55.9553°N, 160.5938°E; Figure 1B) using a homogenous velocity. We applied Lassie for the time between October and December 2017, considering only 8 stations for our analysis as two stations (B04, B08) were out of order, in consequence of the harsh natural conditions (including damages induced by the behavior of bears) in Kamchatka. Furthermore, we corrected the coherence of detected events for times when two further stations (B07, B09) were only intermittently running properly (mostly during December). For the detection of local seismicity, we choose a moderate coherence threshold of 1, which improves the completeness of the manual catalog, still limiting the number of false detections (López-Comino et al., 2017). For validation of the results, we search the catalog of the 523 manually picked reference events (see above; Koulakov et al., 2021) for Lassie events with an origin time difference of ≤5 s. To compare the seismic evolution with degassing processes at Bezymianny, we further use optical imagery recorded with time-lapse cameras located near stations B04 and B06 (cf. Figure 1B).
The steep sided Bezymianny volcano is usually challenging to observe surface changes using standard satellite radar observations, due to decorrelation, frequent topographic changes and strong seasonal changes, snow and rainfall (Mania et al., 2019). Here we process a new set of high resolution radar scenes acquired in 2-m-resolution spotlight mode from the TerraSAR-X (TSX) and TanDEM-X (TDX) satellites. We process the spotlight scenes with the GAMMA Remote Sensing Software (Werner et al., 2000), and produce 8 descending (DSC) and ascending (ASC) interferograms with temporal baselines between 11 and 22 days (Table 1, Supplementary Table S1, Figure 1, Supplementary Figure S7, Supplementary Figure S8). The interferograms are multilooked and filtered using the adaptive phase filter (Goldstein and Werner, 1998). To accurately correct the topographical phase component, which is especially of importance for X-band satellite data (Richter et al., 2013), we use a digital elevation model generated from a photogrammetric survey conducted in 2017 (Shevchenko et al., 2020). Before phase unwrapping with the minimum cost flow algorithm (Chen and Zebker, 2001), regions of strong slope motion (such as rock glaciers to the northeast of Bezymianny) are masked out. For atmospheric correction of the unwrapped interferograms and subsequent source inversion, we select the reference point in a low relief region to the southeast of Bezymianny (Supplementary Figure S9).

TABLE 1. Key parameters of the ascending (ASC) and descending (DSC) TSX/TDX tracks. The acquisition time is given in coordinated universal time (UTC).
We realize an improved deformation accuracy of InSAR at Bezymianny by application of the Generic Atmospheric Correction Service (GACOS, Yu et al., 2018), which is based on the combination of weighted continuous GPS tropospheric delay estimates and a high-resolution (for our study region: 0.0008°) global weather model provided by the European Centre for Medium-Range Weather Forecasts (ECMWF). The data are available every 6 h interpolated to the timing of the SAR acquisitions (Table 1) using an iterative tropospheric decomposition model (Yu et al., 2017). We converted the provided zenith tropospheric delay to the corresponding line-of-sight (LOS), resampled the raster to the size of the investigated interferograms, and detrended the corrected interferograms. To visualize the near-vertical and the near-horizontal displacement field before the December 2017 eruption, we follow the approach from Wright et al. (2004) by assuming that the north component is negligible.
To allow interpretation of the InSAR deformation data, we perform a source inversion model (Lisowski, 2007) separately for the ASC and DSC differential displacement fields. We did the modeling for high quality InSAR data only, specifically for the interferograms acquired shortly before the December 20, 2017 eruption. Other interferograms lack coherence (such as the co-eruptive interferograms), or are mostly affected by deformation other than crustal sources, such as snow, ice and cooling lava flows (such as the interferograms earlier to the ones we model). We approximate deformation source parameters and uncertainties by employing the Matlab-based Geodetic Bayesian Inversion Software (GBIS; Bagnardi and Hooper, 2018). The software uses a Markov-Chain-Monte-Carlo method integrating the Metropolis-Hastings algorithm. We apply a non-linear inversion on the additionally implemented point Compound Dislocation Model (pCDM; Nikkhoo et al., 2017), which, compared to the isotropic Mogi point source (Mogi, 1958), defines a moment tensor with three mutually orthogonal force dipoles that can freely rotate in the elastic half-space.
GBIS uses an adaptive quadtree sampling method, which significantly reduces the computational load. For inversion of the ASC and DSC data, we sample the posterior probability functions of the 9 pCDM parameters through 1,000,000 iterations and quantify uncertainties by calculating semivariograms for both acquisitions. Given that partial source information indicates a potentially shallow source (e.g., Koulakov et al., 2021), we use a priori boundaries as noninformative as possible but acknowledging the volcanological setting of Bezymianny (Table 2).
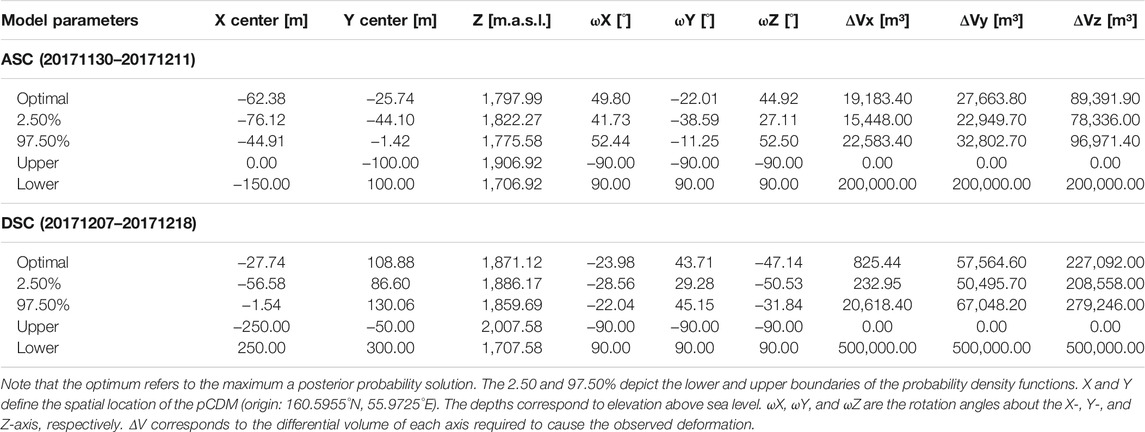
TABLE 2. Results of the Bayesian inversion using the pCDM.
To compare the resulting inversion source volumes with the actual volume of the eruptive products, we use two high-resolution Digital Elevation Models (DEMs) acquired in 2017 and 2018 before and after the eruption, respectively. The 2018 DEM is generated from a combination of drone and Pléiades 1-A satellite imagery, an updated version of the one generated in 2017 (Shevchenko et al., 2020). To compute the difference between these DEMs, we first align the DEMs in the vertical direction by subtracting the mean elevation difference of an unchanged area from every elevation point of the 2018 DEM. Then we subtract the 2017 DEM from the 2018 DEM for a selected area and multiply this difference with the squared pixel size (2 × 2 m) to determine corresponding volume change.
We detected 4,950 micro-seismic events by applying the Lassie algorithm (Heimann et al., 2017) for the time between September and December 2017 (Supplementary Figures S1A,B). The 2D kernel density estimation of the lateral distribution of these events reveals a high density within the amphitheater of Bezymianny, although another small higher density area exists to the southeast of the volcano (Supplementary Figure S1A). Out of the 523 events, which were manually picked by Koulakov et al. (2021), 377 events were automatically detected within a time frame of 5 s with respect to each corresponding reference event (Supplementary Figures S1A,C). Most of the referenced Lassie events are located beneath the amphitheater of the Bezymianny volcano, and close to the surface at 2–3 km depth, with a few events located off-centered to the northeast. Also, the Lassie catalog contains reference events that agree in their timing (beginning of November) with manually picked reference events (Koulakov et al., 2021; Supplementary Figure S1). While the focal depths of the latter lie between 4 and 8 km below sea level (bsl), the depths of the referenced Lassie events range between 2.5 km above sea level (asl) and 12 km bsl. The distribution of the Lassie coherence values, which can be regarded as a proxy for the local magnitudes, is similar to that of the reference local magnitude distribution.
We classify the bandpass filtered (1–10 Hz) continuous waveform of each earthquake in the Lassie catalog based on their dominant frequencies, which is an indicator for the concentration of the signal energy in the frequency domain of each detected seismic event (Zhou et al., 2007). Based on the distribution of dominant frequencies (median in 0.1 Hz bins), we selected four major event types reflecting different processes prior to the eruption (indicated with arrows in Supplementary Figure S2). We neglected the highest peak in the distribution, as the coherence and hence the signal quality is lowest. Based on example waveforms for the four major event types (Supplementary Figure S3), we regard events with dominant frequencies of 1.2 and 2.1 Hz as long-period (LP) events and events with dominant frequencies of 2.8 and 3.5 Hz as volcano-tectonic (VT) events, since the latter show clear p- and s-wave onsets. Based on the occurrence and type of the events we are able to distinguish the following different phases.
1) During phase 1 (110–90 days), two stations (B07, B09) were showing data gaps and the studied seismic activity was relatively low (<12 events/day) with only a few LP and VT events detected at various depths (Figures 2A–C).
2) Phase 2 (days 90–23) starts with a sudden increase in the detection rate (100–300 events/day) and is characterized by discontinuous LP activity and alternating bursts of events with quiescence periods. The highest LP rate is found in days 85–75 (up to 38 LPs/day, Figures 2A–C). The real-time seismic amplitude measurement (RSAM), which characterizes all seismic ground motion accumulated during time (including seismic noise due to ocean waves, wind and other atmospheric phenomena as well as volcanic tremors), does not present significant fluctuations that can explain the alternation of high and low detection periods (Figure 2D). Phase 2 is marked by a high rate of LP events, but some VTs are also detected. Compared to VT events, LP events often present a lower coherence. The VT focal depths are mostly below 8 km bsl, while the majority of LPs are shallower, between 4 km bsl and 3 km asl, i.e., very close to the summit. The median depths lie mostly at around sea level, but many LP and a few higher coherent VT events indicate activity between 4 and 12 km bsl. After day 75, the LP rate slowly decreases, while the mean focal depth occasionally decreases (days 53–32) to depths between 3 and 6 km bsl close to the depths of manually detected VT events (4–8 km bsl; Figure 2A). The last seismic burst (days 25–23) in phase 2 is characterized by multiple higher coherent LP events (Figures 2A–C). The corresponding median depths are located between 1 km asl and 4 km bsl, but a substantial proportion of seismicity distributes between 4 and 12 km bsl.
3) During phase 3 (days 23–7), the seismic detection rate drops. Simultaneously, the RSAM of stations (e.g., B01, B10) closest to the volcanic center shows a near continuous threefold increase from days 18 to 12. The corresponding spectrogram of station B01 reveals near constant high energy release between 1 and 8 Hz mainly contributed by tremors (Figure 2D, Supplementary Figures S4A,B). Between days 11–9, the RSAM shows a sudden spike, dominated by energy release between low and very high frequencies (1–20 Hz). Immediately after the burst, we recognize a short period of 1 day (day 8) where the RSAM decreases back to the level at the end of phase 2.
4) During the start of phase 4 (day 7), the RSAM re-increases and is mainly contributed by low energy release between 1 and 8 Hz as in phase 3. The final unrest then settles in with an exponential increase in VT activity (6–0 days) with median depths at ca. 1 km asl being slightly shallower than during phase 2. Seismicity in phase 4 is dominated by VT events, with few remaining LPs. VTs have lower dominant frequencies (2.8 Hz) in the first days, and higher frequencies (3.5 Hz) later on (Figures 2A,B).
5) After the eruption in phase 5, seismicity decreases abruptly back to phase 1 rate, and the RSAM at stations B01 and B10 drops, but remains as high as in the beginning of phase 3. Again, the RSAM increase is mostly contributed by continuous low energy release between frequencies of 1–8 Hz, and the example waveform indicates tremor activity (Supplementary Figures S4A,C). A few LPs are detected about 1 week after the eruption and seismic records are again dominated by low and very high frequencies.
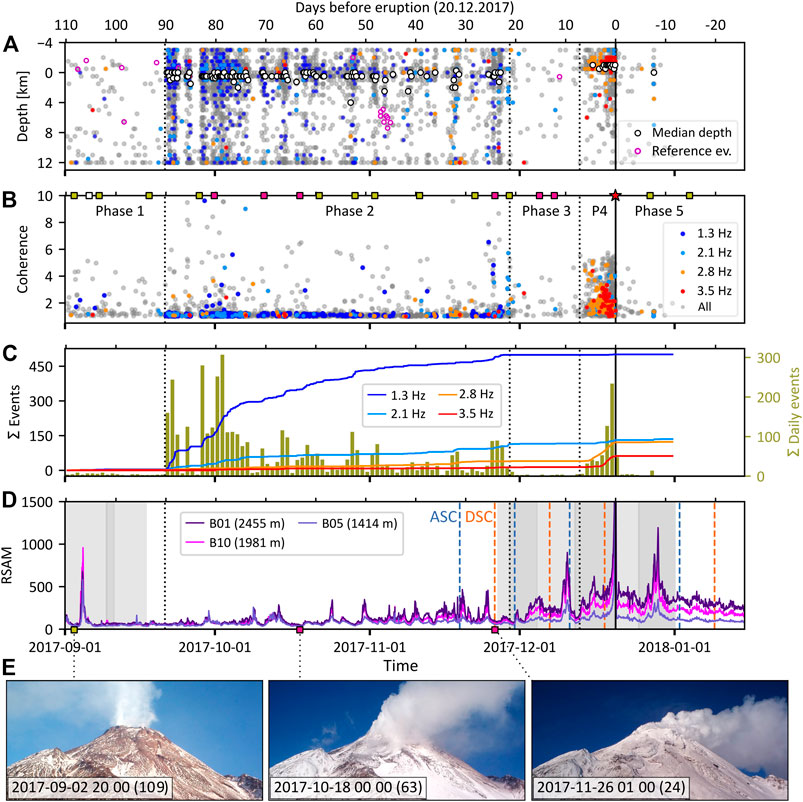
FIGURE 2. Seismic and time-lapse imagery results. (A) Focal depth distribution of seismic events detected by the Lassie algorithm (Heimann et al., 2017) before, during, and after the December 20, 2017 eruption (black vertical line). Magenta circles indicate the focal depths of the reference events before 15 December (cf. Figure 1C). White circles correspond to the 6-hourly median depths of seismic clusters (>12 events). (B) Distribution of the corresponding coherence of detected events. White, yellow, and pink squares depict weak, intermediate, and intense degassing of Bezymianny, respectively (cf. Supplementary Figure S5). The red star indicates the day of the eruption. Volcanic phases are indicated by vertical dotted lines (P4 = phase 4). (C) Cumulative curves for the event type families indicated in (A,B) and daily count of events (dark yellow bars). (D) Evolution of the absolute real-time seismic amplitude (RSAM) of the vertical component of selected stations. Blue and orange vertical dashed lines refer to the acquisition time of the ascending (ASC) and descending (DSC) tracks, respectively. Light and dark gray shaded areas show episodes when either one or two stations (B07, B09) were temporarily out of order. (E) Selected time-lapse camera images depicting the degassing activity at Bezymianny. The numbers in brackets refer to the recorded day before the eruption. The camera was located close to seismic station B04 (cf. Figure 1B).
The camera network at Bezymianny is valuable to identify degassing, rockfalls, and eruption activity. In the following we describe the camera observations showing some possible associations with seismic trend changes described above. Categorizing the following different phases, the visual records are summarized as follows:
1) During phase 1 (110–90 days), optical images show weak and intermittent, white to translucent degassing (Figure 2E).
2) During Phase 2 (days 90–23), optical images reveal consecutive significant white degassing lasting until at least day 63 (Supplementary Figure S4), when the degassing activity of Bezymianny weakens. Degassing intensity then briefly intensifies again during the last seismic burst (days 25–23) of phase 2 (Figure 2E).
3) Phase 3 is characterized by significant and continuous degassing activity of Bezymianny (Supplementary Figures S5, S6).
4) For most of phase 4, time-lapse imagery is either covered by snow or clouds. The first useful images are acquired on the eruption day, which show strong white degassing and later a particle-laden eruption cloud (Supplementary Figure S6).
5) During phase 5, optical images show that Bezymianny’s summit is still but weakly degassing (Supplementary Figure S5).
As the camera records reveal, Bezymianny is covered with snow during most times of the investigated period (Figure 2E), which would usually lead to phase decorrelation in differential interferometry. But optical images also show that the upper southern and western flanks of Bezymianny are only partially snow-covered, exposing abundant parts of the solid ground (Supplementary Figure S6). Thus, high resolution interferometry of spotlight X-Band TerraSAR-X and TanDEM-X satellites allows for analyzing ground displacements at the volcano. Temporal baselines of all InSAR maps are 11 and 22 days, respectively, while the perpendicular baselines lie between 6 and 290 m (Supplementary Table S1). Data pairs processed directly after the June 16, 2017 eruption in both the ascending (ASC; 20170721–20170812) and descending (DSC; 20170819–20170910) mode show no large-scale deformation, but a rather complex fringe pattern located to the east of the summit and inside the amphitheater on the western flanks of the central cone (Figures 3A,B, Supplementary Figure S7). The location of the latter fringe patterns agrees with the location of fresh deposits of the 2016–2017 eruption phase. In terms of time, both interferograms lie outside of the observed temporal evolution of seismicity, yet the resulting phase information is crucial for interpreting the subsequently acquired interferograms. The next processed ASC interferogram (20171119–20171130) is not showing any relevant deformation; only fringes that roughly follow the topography of Bezymianny as well as of the neighboring Kamen volcano (Figure 3C) likely depicting atmospheric phase delay. The near-simultaneous DSC interferogram (20171126–20171207) shows less atmospheric disturbance (Figure 3D), but the near-summit phase changes differs only slightly from that of the first DSC observation (Figure 3B). We note that the spatial extent of these fringes is enclosed by the amphitheater, with virtual absence of fringes outside. Smaller fringes on the outer flanks, located spots in the east, southeast and to the west, are likely a result of local snow or ice-related ground motion effects. The ASC interferogram acquired just before the eruption (20171130–20171211, Figure 2D, Figure 3E) reveals significant deformation on the central cone and, moreover, also at the outer flanks of Bezymianny. The pre-eruptive DSC interferogram (20171207–20171218) is also showing deformation of the outer flanks, but is characterized by complete decorrelation inside the amphitheater (Figure 3F). The co-eruptive ASC (20171211–20180102) and descending (20171218–20180109) interferograms are dominated by decorrelation in the near-field as well as to the east and northeast of Bezymianny (Figures 3G,H, Supplementary Figures S8A,C). The spatial extent of surface displacements on the southern and northern flank is similarly distributed as the co-eruptive deformation, but fringes reveal inverted polarity.
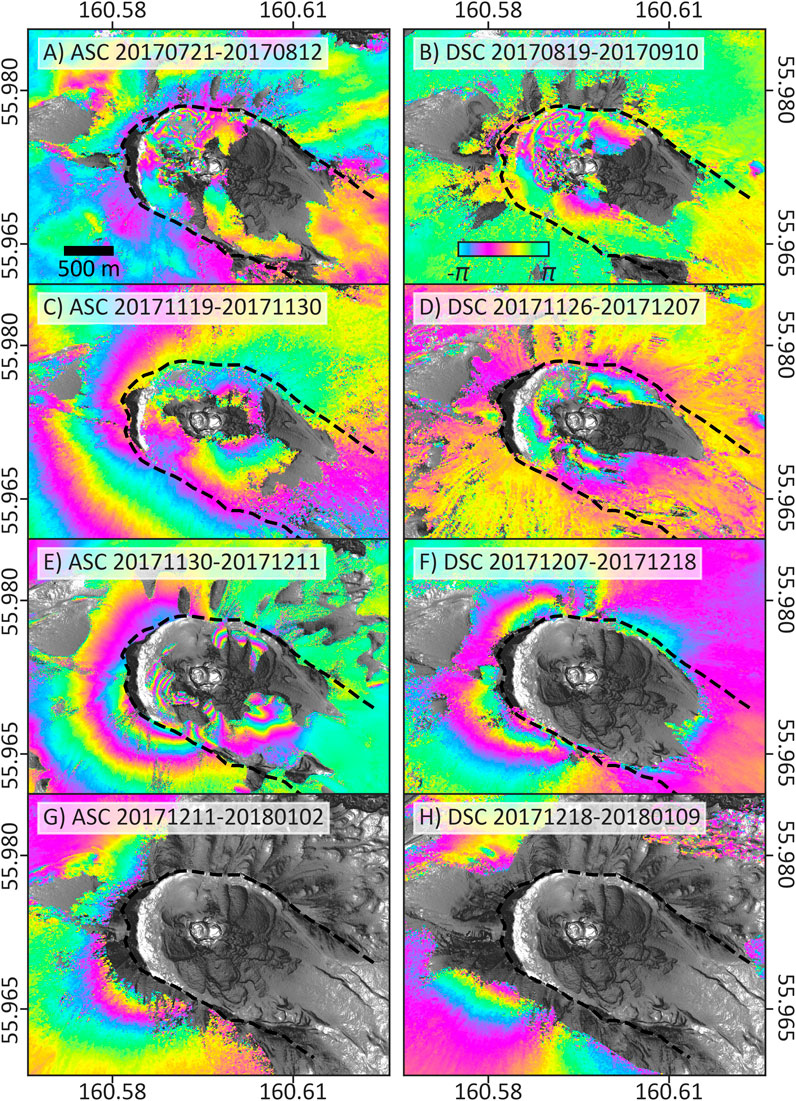
FIGURE 3. Selected wrapped interferograms depicting the temporal evolution of ground deformation shortly after the June 16, 2017 eruption (A,B), shortly before the December 20, 2017 eruption (C–F), and during the eruption (co-eruptive; G,H). In the background of each interferogram is the multidirectional hillshade of Bezymianny’s elevation acquired after the eruption. The black dashed line shows the collapse scar of Bezymianny’s sector collapse in 1956.
In order to allow interpretation and modeling of the InSAR data, we perform an atmospheric weather correction (Generic Atmospheric Correction Service (GACOS); Yu et al., 2018), a phase unwrapping (Statistical-Cost, Network-Flow Algorithm for Phase Unwrapping (SNAPHU); Chen and Zebker, 2001) and a source inversion (point Compound Dislocation Model (pCDM); Nikkhoo et al., 2017). We only used the two pre-eruptive interferograms 20171130–20171211 (ASC) and 20171207–20171218 (DSC), as these revealed the clearest line-of-sight deformation signal (Figures 3E,F). For the others, either the coherence is too low, or deformation fringes could be mistaken for lava flow compaction, snow- and/or ice-related motion, as well as atmospheric delay. GACOS correction of the unwrapped interferograms yielded comparatively low coefficients of determination (R2: 0.3 and 0.45), but the standard deviation for the ASC and DSC scenes decreased by 7 and 31%, respectively (Supplementary Figure S9). The low correction performance might be attributed to the time difference between the linearly interpolated ECMWF weather model and the timing of the SAR acquisitions. The time lag for both tracks is relatively small (ca. 1 h), which indicates that the GACOS weather model cannot compensate for the prevalent rapid atmospheric turbulence in the Klyuchevskoy Group of Volcanoes. Since the atmospheric delay at the neighboring Kamen volcano could be significantly reduced after the GACOS correction, we find that the resulting corrected unwrapped interferograms are more reliable for the ensuing source inversion modeling. Overall, the GACOS correction reduced the maximum LOS displacement towards the satellite from ∼10.4 to ∼7.9 cm and from ∼3.8 to ∼3.1 cm for the ASC and DSC track, respectively.
The decomposition of both data sets shows that most of the signal is contained in the Eastern component (Supplementary Figure S10). For geodetic modeling of the individual pre-eruptive ascending and descending deformation sets, we used the point Compound Dislocation Model (pCDM; Nikkhoo et al., 2017). The centroid for both optimal solutions lies ca. 1.2 km below Bezymianny’s summit and the corresponding volume change increased from 1.4 ± 0.2 × 10⁻⁴ km3 to 2.9 ± 3 × 10⁻⁴ km3 in time (Figure 4B; Table 2). The residual between the investigated data and the model shows that the ASC solution is closer to the corresponding data than the DSC solution (Figures 4C,D,G,H). The Markov Chain convergence for each pCDM parameter (Supplementary Figure S11) indicates that the examined parameter space is sufficiently explored. To compare the source inversion derived volumes with the volume of the actual eruptive products, we calculate the volume for the area in Figures 5A–C (red-dashed rectangle), and notice that the corresponding volume change of 4.5 × 10⁻³ km3 exceeds the modeled optimal source inversion volumes by one order of magnitude.
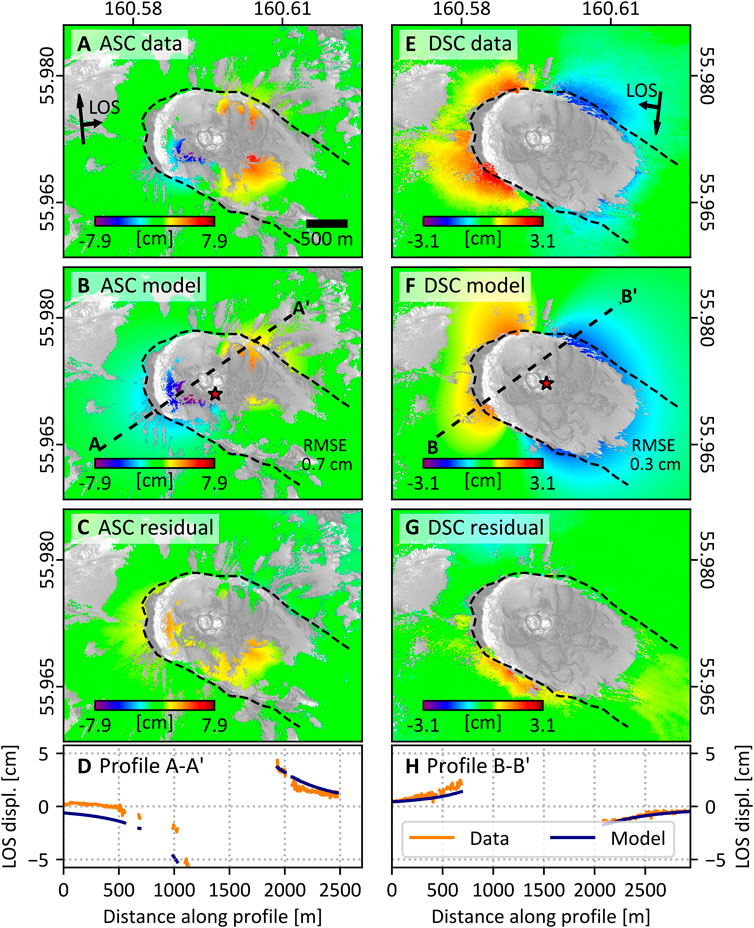
FIGURE 4. (A,E) Unwrapped TSX/TDX line-of-sight (LOS) displacements for the ascending (ASC) and descending (DSC) tracks just before the December 20, 2017 eruption. Interferograms are corrected for atmospheric delay using the GACOS weather model (cf. Supplementary Figure S9). The motion towards and away from the LOS is negative and positive, respectively. (B,F) Modeled displacements using the point Compound Dislocation Model (pCDM). Local origin used in the inversion: 160.5955°N, 55.9725°E. Star denotes the optimal lateral location. (C,G) Relative residuals. (D,H) Profiles A-A′ and B-B’ (indicated in B,F) showing the differences between the unwrapped data and the predicted models.
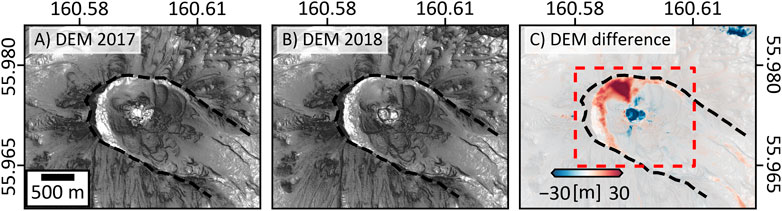
FIGURE 5. Bidirectional hillshades of Bezymianny’s topography before (A) and after (B) the December 20, 2017 eruption. (C) highlights the difference between (A) and (B). The red dashed square indicates the region for the topography derived volume of eruptive products. Please note positive changes along the south-eastern valleys, which likely resulted from the deposition of co-eruptive pyroclastic density currents. The upper right negative change is the result from a digital elevation model error in (A).
Volcano plumbing systems are the source regions of a number of eruption precursors, including inflation sources, tremor and other seismic activities. In an attempt to better understand the preparatory phase of the December 20, 2017 eruption of the Bezymianny volcano, we here investigate temporary seismic network data, time-lapse camera images, and high resolution InSAR data as well as source modeling. We describe the observed changes in a chronological order, which suggests that microseismicity is occurring long before a shallow deformation source is detected. Before further comparing these observations to independent observations, we describe the challenges and limitations of our work.
The Lassie catalog contains 4,950 events enabling us to determine the seismic evolution between September and December 2017. Most of these events are located in the vicinity of Bezymianny [Supplementary Figure S1A (left panel)], whereby Lassie locations and depth uncertainties of the automatically detected events highly depend on the quality of the seismic recordings through the whole network, and thus on the earthquake magnitudes, depths and the overall level of seismic noise and volcanic tremor, which varies over time. This may explain that only 377 (∼72%) out of the 523 events manually detected by Koulakov et al. (2021) are included in the Lassie catalog. We estimated location uncertainties following a jackknife approach, repeating the detection procedure iteratively, after removing one station each time, and then discussing the distribution of the location ensembles for each event. We processed selected subsets of the continuous data only, focusing on three time intervals, when different, significant seismic bursts are observed: 28 September–3 October 2017, 17–19 November 2020 and 13–20 December 2020 (1 week prior to the eruption). Lowest uncertainties (in average ∼1.4 and ∼1.3 km for epicentral and depth uncertainties, respectively) are found for the week preceding the eruption; locations in this period are indeed very similar to those estimated by Koulakov et al. (2021), which are based on an accurate manual picking. Average uncertainties are larger in November (∼2.8 and ∼2.1 km epicentral and depth uncertainties) and September-October (∼3.2 and ∼1.9 km): this is consistent with the substantially lower coherence of the earthquake signals in these times, which indicate either deeper and/or weaker earthquake sources. In all considered time periods, the average depth uncertainty does not exceed ∼2.1 km, which supports the inference of deeper seismic activity in the months and weeks preceding mid December 2017.
In fact, the focal depths of events in the first period of increased seismic activity (beginning of November 2017) lie between 4 and 8 km below sea level, which is in agreement with the few reference locations, although Lassie depth estimates for a few events are deviating significantly. The highest rates of seismicity are detected both at times when all stations were working properly (e.g., end of September 2017; Figure 2D) and when the network was not fully operational (e.g., VT precursor seismicity), indicating that temporal changes of the network geometry do not substantially affect the identification of increased seismic activity. The selected coherence threshold aims to substantially increase the number of detection while limiting the catalog contamination by false detections. Given that coherence values are similar over most of the period, we assume that false detections similarly affect all phases. In general, VT events have higher coherence than LPs, which is due to the characteristics of their waveforms. Consequently, VT locations are also more accurate than LP ones.
Thanks to the availability of a very high-resolution digital elevation model (Shevchenko et al., 2020), we were able to generate high-quality X-band interferograms even for spatial baselines of up to 290 m. The importance of a high quality (and high resolution) DEM for X-band data was already highlighted elsewhere (e.g., Richter et al., 2013). Due to the rapid changes at the volcano (erosion, vegetation, snowfall, and eruption coverage), a robust time-series analysis necessitating tens of SAR images could not be realized. Nevertheless, the quality of the differential interferograms presented in this work is unusually high for this volcano. Rapid snow cover changes amidst continuously low temperatures are likely due to prevailing strong winds blowing the snow away. In contrast to the pre-eruptive ascending interferogram, the corresponding descending interferogram is characterized by low coherence within Bezymianny’s amphitheater, which is likely due to meter-scale surface changes at the summit observed during the seismic-precursory episode (Koulakov et al., 2021). The similar spatial extent as well as the magnitude (ca. 3 cm) of the line-of-sight displacement on the outer flanks in both pre-eruptive interferograms (Figure 4) supports the dominance of the lateral component (Supplementary Figure S10). An important constraint of our modeling is the simplification of an elastic deformation in a homogeneous half space medium. Heterogeneities in the host rock and surface geometry are known to influence the source models (Manconi et al., 2007) and also the propagation of magmatic fluids (Maccaferri et al., 2011). At Bezymianny, changes in the material stiffness may be produced by thermal and compositional changes along the conduit, but also by significant structural changes such as the interface between the 1956-collapse-scar and the subsequently emplaced and continuously growing lava dome (Gorshkov, 1959; Girina, 2013; Shevchenko et al., 2020).
We note that a change in brightness and illumination may strongly affect the employed time-lapse imagery. For instance, changes in atmospheric pressure and temperature affect the condensation of water droplets appearing in white clouds (e.g., Bredemeyer and Hansteen, 2014), and changing Sun position (or direct insulation) changes the visual appearance of Bezymianny in the imagery. To avoid barometric pressure-related biases, we selected images taken during the day at approximately the same time with similar solar illumination.
The InSAR study presented in this work concentrated on the deformation caused by a pressurized reservoir at depth. In addition, we find other sites of vertical and horizontal displacements. Observed surface deformation within Bezymianny’s amphitheater between July and September 2017 spatially coincides with emplaced eruptive products during the first half of 2017 (Figures 3A,B, Supplementary Figure S7; Mania et al., 2019). While in general, larger amplitudes of deformation concur with those sites recently overrun by new lavas and pyroclastic density currents (PDC), the details of the deformation pattern are rather complex. Previous studies investigating post-emplacement deformation occurrence at lava flows and PDC deposits suggest various degrees of thermal compaction, clast repacking, as well as time-dependent deformation of the flow substrate (Briole et al., 1997; Stevens et al., 2001). Own observations at Bezymianny suggest that these deposits were underlain by snow fields, adding further complexity in the deformation signal. Also, we identify sites of surface deformation located north of Bezymianny as well as east of the extinct Kamen volcano that follow the shape of morphological features characterized by round-crested, steep frontal slopes and clastic-blocky surficial layers. Permafrost, which is widespread in the mountainous Klyuchevskoy Group of Volcanoes (Abramov et al., 2008), may cause such structures (e.g., Jones et al., 2018). Thus, we speculate these landforms to be ice-bearing intact rock glaciers. Other smaller deformation sites depicted on the eastern and southern flanks may similarly be associated with underlying snow and ice fields. A deformation field on the western outer flank of Bezymianny is of uncertain origin, again possibly of a landslide or slump-like behavior.
From the sudden increase of shallow, predominant long-period (LP), seismicity between phases 1 and 2 (Figures 2A–C), we infer the destabilization of the upper plumbing system at least 90 days ahead of Bezymianny’s December 20, 2017 eruption. LPs have been associated with the migration of gas-rich fluids, causing long-period oscillations in the host rock (Chouet and Matoza, 2013). We find it plausible that at Bezymianny, LPs may have been related to vesiculation and crystallization of a remnant batch of magma stalled at shallow levels after the June 16, 2017 eruption leading to pronounced, white, and thus water-rich degassing (Figure 2E). Such a second boiling effect has been postulated for volcanoes elsewhere (Stock et al., 2016). After day 75, the detection rate of seismic events decreased gradually with a concentration of events at ca. 1 km below sea level (bsl), and ca. 10–12 days later, the degassing activity waned as well (Figure 2A, Supplementary Figure S4). This may indicate progressively decreasing but continued vesiculation and crystallization of the shallow reservoir. Between days 53–32, the median depths sporadically decrease to ca. 3–6 km bsl agreeing with greater depths (5–8 km bsl) of the first manually picked VT cluster (days 47–45). VTs are commonly associated with shear-failure of the host rock (Chouet and Matoza, 2013), thus the first cluster could reflect activation and reorganization of viscous magma within the deeper reservoir during the destabilization phase. The depths of the VT cluster are approximately equal to the horizontal distance from the volcanic center of Bezymianny (Figure 2A, Supplementary Figure S1A), which is a common observation for first precursor seismicity at many other volcanoes (White and McCausland, 2016). The last seismic burst during phase 2 (25–20 days) was characterized by significantly higher coherent LPs stretching from deeper (4–12 km bsl) to shallow (0–4 km bsl) depths. This was accompanied by resumed enhanced degassing intensity (Figure 2E) indicating further advancement of the hydrothermal network between the shallow and deeper-seated reservoirs of Bezymianny.
Based on the existing picture of the shallow magma plumbing system (Koulakov et al., 2021) and based on our finding of the evolution of seismicity and a deformation source, we develop a conceptual model that may explain the preparation phase of the Bezymianny volcano. The detection rate of seismic events decreased markedly during phase 3. At the same time, the real-time seismic amplitude (RSAM) of stations (B01, B10) closest to the volcanic center increased threefold associated with enhanced tremor activity (Figure 2D, Supplementary Figures S4A,B). This seismic noise may explain the lack of automatically, but also manually, detected seismicity during phase 3. Therefore, it is very likely that the undetected, natural rate of seismicity was further increasing during this time. Eruptions of many dome-building volcanoes are characterized by peculiar RSAM anomalies, such as at Redoubt (Power et al., 1994), at Mount St. Helens in 2004 (Hotovec-Ellis et al., 2015), or at Soufrière Hills (Voight et al., 1999). The constant higher level of the RSAM during phase 3 at Bezymianny was accompanied by simultaneous surface deformation depicted in the pre-eruptive ascending interferogram (Figure 3E), indicating that both the RSAM and the surface deformation showed first signs of activity before the ultimate precursor VT seismicity during phase 4 settled in. Deformation was characterized by predominantly lateral inflation of Bezymianny’s outer flanks (Supplementary Figure S10), which complies with previously GPS-derived pre-eruptive northward motion of Bezymianny’s northern flank (Grapenthin et al., 2013). Inversion modeling of the pre-eruptive displacement fields revealed a very shallow pressurization source located at ca. 1.2 km below the summit (Figure 6). Therefore, we conclude that the precursor tremor activity was propped by shallow and pressurized gas-rich magmatic fluids.
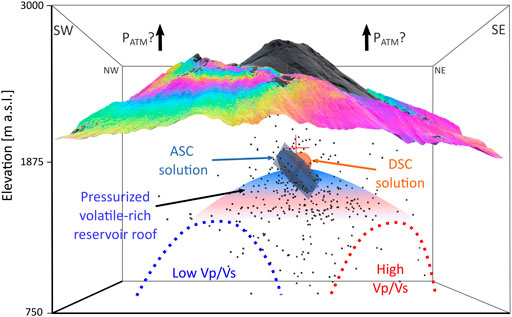
FIGURE 6. 3D view of Bezymianny’s topography, the located VT events (gray spheres; time range: 11–31 December 2017), and the two different Vp/Vs anomalies (blue and red dotted lines) determined by Koulakov et al., 2021. The orange sphere depicts the predicted point source depth (pCDM) for the modeled descending (DSC) data. The blue ellipsoid as well as the three planes are a scale-free CDM representation of the modeled pCDM solution for the ascending (ASC) data. The size of the three planes corresponds to the volume change in each direction of the pCDM. The black cross indicates the corresponding reference depth. The arrows hypothesize the influence of decreasing atmospheric pressure (PATM) of 1–3 kPa that potentially modulated the permeable flow of magmatic gases within the shallowest reservoir triggering the inflation-like deformation.
Recent tomography investigations on the precursor VT seismicity have revealed the concurrence of two major zones of pressure wave (Vp) and shear wave (Vs) anomalies located at a depth of ca. 2 km below surface (Koulakov et al., 2021). According to the authors, the corresponding low and high Vp/Vs zones may reflect a vertical separation between a gas-rich and a viscous magma reservoir, respectively. These zones are indicated in Figure 6. While our study cannot resolve the deeper structure of Bezymianny’s magma plumbing system, we realize that the inverted pressurization source was located at the uppermost edge of the seismically active cap of the deeper source region (Figure 6). This indicates that seismicity and deformation at Bezymianny depict different magmatic processes during the preparation stage of the ensuing eruption. Similar discrepancies between seismicity and geodetic results were observed, for instance, at Copahue volcano (Lundgren et al., 2017) and Long Valley Caldera (Montgomery-Brown et al., 2015). At these volcanoes, the geodetically inferred deformation sources were located beneath (Copahue volcano) or at the lower edge (Long Valley Caldera) of the seismically active zones. Moreover, conversion of the ascending point Compound Dislocation Model (pCDM) solution into its scale-free CDM representation (Figure 6) resembles the intrusion of a dyke-like feature into the upper seismically active roof of the deeper source, and may therefore represent the lower part of the uppermost conduit system. Modeling of a very shallow magma reservoir is conceivable, as was shown for a 2–3 km deep sill intrusion at Alcedo volcano, Galápagos (Galetto et al., 2019), a dyke intrusion that got arrested at a depth of ca. 1 km below the Harrat Lunayyir lava fields, Saudi Arabia (Pallister et al., 2010), magma stalling at ca. 1 km below Wolf volcano, Galápagos (Xu et al., 2016), or very shallow (ca. 200-m-deep) reservoir pressurization at Colima volcano, Mexico (Salzer et al., 2014). Source modeling experiments showed that shallow surface deformation may be dominated by the upper part of a volcanic source only, and volumetric changes at the bottom and sides of the magmatic reservoir cannot be resolved with InSAR displacement maps (Yun et al., 2006). This may be also the case for Bezymianny.
The magnitudes of the modeled pressurization volumes of 1.4 and 2.9 × 10⁻⁴ km3 determined in this study (Table 2) agree well with the previously modeled, GPS-based volume change of 1–4 2.9 × 10⁻⁴ km3 (Grapenthin et al., 2013). These volumes deviate by more than one order of magnitude from the topographically derived volume change of 4.5 × 10⁻³ km3, which does not even consider PDCs deposited in the distal parts of Bezymianny as well as ash ejected into the atmosphere during the eruption (Figure 5). The bulk volume includes void spaces within the tephra and between individual chunks of the tephra. Assuming a density of 2,600 kg/m3 of the solid andesite crust (Shcherbakov et al., 2011) and a density of 1,000 kg/m3 for the deposited bulk volume within the amphitheater, the corresponding dense rock equivalent (DRE) bulk volume amounts to 1.7 × 10⁻³ km3. Yet, the estimated DRE bulk volume remains still significantly higher than the volume of the geodetically inferred shallow pressurization source. Therefore, we suggest that the latter depicts a small “quantum” (Scandone et al., 2007) of hot and gas-rich magma that accumulated within the cap of the shallow reservoir leading to gradual thermal expansion and pressurization (Bonafede, 1991; Stock et al., 2016) eventually tapping the bulk of the deeper magmatic reservoir leading to the deposition of the proximal bulk volume deposits. Petrologic analyses have shown that eruptive products of Bezymianny contain significant amounts of cristobalite and tridymite (Ivanova et al., 2018; Koulakov et al., 2021). Precipitation of these metastable silicate polymorphs may have closed the pores and fractures of the uppermost conduit (plug) driving the pressurization of the “quantum” magma (e.g., Horwell et al., 2013). Since the sulfur content of Bezymianny’s fumarolic gases was usually very high (Zelenski et al., 2015), hydrothermal alteration may also have decreased the permeability along the conduit as was concluded from eruptive products of Merapi volcano, Indonesia (Heap et al., 2019). Both processes are not mutually exclusive for Bezymianny.
Eventually, overpressurization of the small magmatic batch may have tapped the shallow reservoir during phase 4. The ensuing upward migration of the bulk volume caused rock-fracturing processes along the uppermost conduit triggering the precursory VT seismicity, ultimately leading to the eruption of Bezymianny on December 20, 2017 (Koulakov et al., 2021; Figure 1C, phase 4 in Figure 2). Similar processes were proposed for explosive eruptions at Mount St. Helens, Mt. Augustine, and other volcanoes (Roman and Cashman, 2018). Co-eruptive interferograms revealed surface changes with similar spatial distribution as the co-eruptive displacements but exhibiting opposite fringe patterns (Figures 3E–H), thus indicating deflation of the hitherto pressurized reservoir roof as the volatile-rich magma “quantum” escaped during the eruption. This would agree with conclusions from recoverable deformation after many explosive eruptions at Soufrière Hills volcano (Voight et al., 1999). However, the RSAM level after Bezymianny’s eruption remained at the pre-eruptive elevated level for more than 20 days, the spectrogram of station B01 showed continued tremor activity, and time-lapse camera images showed continued but weak degassing (Figures 2D,E, Supplementary Figures S4A,C). This may reflect steady re-injection of new magmatic fluids into the shallow reservoir impeding the closure of the corresponding fracture network.
The Klyuchevskoy Group of Volcanoes (KGV) is known to be a site affected by very small stress transfers leading to a communication or simultaneous activity change of the neighboring volcanoes (Shapiro et al., 2017; Coppola et al., 2021). There is growing evidence that also hydro-meteorological factors [Caricchi et al. (2021) and references therein] can modulate the shallowest part of a magmatic plumbing system, if it is already prone to erupt. During winter, the Siberian high transports extremely cold and dry air masses into Kamchatka competing with the Aleutian low-pressure system marked by recurrent cyclones (Mock et al., 1998; Rodionov et al., 2005). To identify potential factors influencing the volcanic system of Bezymianny, we compare our seismic records with hydro-meteorological (atmospheric pressure, temperature, wind speed) data measured twice daily at altitudes between 2 and 2.5 km over the town of Klyuchi (Figure 1A, Supplementary Figure S12) provided by the University of Wyoming2 as well as with precipitation data derived from NASA’s and JAXA’s Tropical Rainfall Measurement Mission and Global Precipitation Measurement (TRMM/GPM) mission characterized by a resolution of 10 × 10 km (Huffman et al., 2019). We are aware that wind measurements at these altitudes do not consider local friction of the Earth’s surface, and that a distance of ca. 40 km between Klyuchi and the KGV may not take into account for local variations of wind speed.
At Bezymianny, the apparent sudden drop of seismicity during phase 3 was accompanied by a threefold increase of the real-time seismic amplitude (RSAM) as well as a 3 days lasting RSAM spike (Figure 2). This spike was accompanied by very strong wind-speeds of up to 28 m/s, the highest daily precipitation rates of 60–70 mm/day observed between September and December 2017, as well as very low temperatures of ca. −18°C, and low atmospheric pressure of ca. 73 kPa (Supplementary Figures S12A,B). Since the RSAM spike was dominated by seismic amplitude changes in the 1–20 Hz frequency range (Supplementary Figure S4A), which is a typical sign for seismic noise generated by strong winds (Mucciarelli et al., 2005; Groos and Ritter, 2009), we argue that this noise anomaly was rather related to an intense snowstorm. This is further supported by similar coeval RSAM spikes and strong wind speeds during phases 1 and 5 (Supplementary Figures S12A,D).
More peculiar, however, is the surface deformation and coeval increase of the RSAM during phase 3, which is mostly contributed by seismic amplitude changes between 1 and 10 Hz, and the evolution of the atmospheric pressure changes (PATM; Figure 3E, Supplementary Figures S4A,B, Supplementary Figure S12). Between the beginning of October and the beginning of December, we notice that the PATM decreased continuously from daily averaged 76–79 kPa to 75 kPa (Supplementary Figure S12C), although the temperatures decreased significantly from −1°C to −18°C, which was likely related to the Siberian high pressure system. Then, during the first half of phase 3, the daily averaged PATM was continuously low at ca. 73 kPa, which occurred simultaneously to the threefold increase of the RSAM (Supplementary Figures S12C,D). By comparing the 12 hourly changes of the PATM and the hourly median of the RSAM (Supplementary Figure S4A), we further notice a compelling anti-correlation: as the RSAM increases, the PATM decreases, and vice versa. The corresponding PATM changes ranged between 1 and 3 kPa. For Stromboli volcano, Italy, (Neuberg, 2000), indicated a positive correlation between atmospheric pressure changes of 1 kPa and volcanic activity, which the author explained with loading effects as the volcano was already about to erupt. Enhanced seismicity at Bezymianny, as well as intense degassing during phase 2, indicated that the magmatic plumbing system of Bezymianny was staging for an eruption. Therefore, it could be conceivable that the observed days-lasting low PATM during phase 3 caused sufficient unloading of the edifice unclogging the pre-existing fracture network of Bezymianny’s shallowest ephemeral reservoir. This may have facilitated the permeable flow of magmatic gases modifying seismicity and inducing inflation-like deformation, eventually stimulating the system for the upcoming eruption. At least the modeled source depth of 1.2 km (i.e., altitude of 1.8 km) would agree with the altitudes (2–2.5 km) at which PATM changes were detected. Nevertheless, the meaning of a potential anti-correlation between atmospheric pressure changes and volcanic activity at Bezymianny remains highly speculative.
Our study integrated the results of seismic data, optically derived degassing, InSAR ground deformation-based source inversion modeling, as well as topographically derived bulk volume of eruption deposits to elucidate the staging and co-eruptive evolution of the December 20, 2017 eruption at Bezymianny volcano. Automatically detected low-frequency events and contemporaneous intensified degassing indicate that the formation of the initial magmatic pathway between the shallow and deeper reservoirs was initiated at least 3 months before the eruption. A sudden but constant increase of the RSAM observed only at stations closest to the volcanic center was mostly contributed by tremor activity indicating the migration of gas-rich magmatic fluids into the shallowest reservoir 19 days before the eruption. This has likely led to contemporaneous inflation-like, predominantly lateral deformation of the outer volcanic edifice. The geodetically inferred deformation source lies at a depth of ca. 1.2 km within the presumably upper brittle roof of the previously suggested shallow magmatic reservoir. In fact, differences between the focal depths of earthquakes and the deformation source might highlight different magmatic processes. Significant discrepancies between the modeled volumes (1.4–2.9 × 10⁻⁴ m3) and the estimated DRE volume (1.7 × 10⁻³ km3) suggest that the shallowest reservoir eventually tapped the bulk of a deeper reservoir leading to the ultimate precursor VT activity induced by the fracturing of the uppermost conduit. Inverted co-eruptive surface displacements and the associated subsidence further highlight the gas-rich component of the released volcanic products, whereby the post-eruptive continuously elevated RSAM suggests that the magmatic system was recharging for the next eruption.
The seismic data are available upon request from IK. TerraSAR-X data are available through the German Aerospace Centrer (DLR). The camera data are available from RM and TRW. The dataset for precipitation investigated in the discussion section of this study is available at https://www.nasa.gov/mission_pages/GPM/main/index.html. The database for the temperature, wind speed, and atmospheric pressure is available at http://weather.uwyo.edu/upperair/sounding.html, station 32389.
RM, SC, and TW contributed to the conception and design of the study. IK provided the seismic data from the investigated network. RM performed the InSAR and inversion modeling analysis. SC and RM performed the seismic analysis. RM created the figures and wrote the first draft of the manuscript. SC, TW, IK, and SS checked and revised it. All the authors contributed to the manuscript revision, read and approved the submitted version.
This is a contribution to VOLCAPSE, a research project funded by the European Research Council under the European Union’s H2020 Program/ERC consolidator grant ERC-CoG Q7 646858. We thank the DLR for support; the acquisition of the spot-mode TerraSAR-X data was realized through proposal GEO1505. This study was also supported by the Russian Science Foundation Grant #20-17-00075 and Russian Foundation for Basic Research Grant #19-05-00101.
The authors declare that the research was conducted in the absence of any commercial or financial relationships that could be construed as a potential conflict of interest.
All claims expressed in this article are solely those of the authors and do not necessarily represent those of their affiliated organizations, or those of the publisher, the editors and the reviewers. Any product that may be evaluated in this article, or claim that may be made by its manufacturer, is not guaranteed or endorsed by the publisher.
We thank Christoff Andermann for his support on acquiring the precipitation data. We are also very grateful for the support from Marina and Alexander Belousov as well as Ilyas Abkadyrov during the fieldwork.
The Supplementary Material for this article can be found online at: https://www.frontiersin.org/articles/10.3389/feart.2021.765668/full#supplementary-material
1https://git.pyrocko.org/pyrocko/lassie.git.
2http://weather.uwyo.edu/upperair/sounding.html, station 32389.
Abramov, A., Gruber, S., and Gilichinsky, D. (2008). Mountain Permafrost on Active Volcanoes: Field Data and Statistical Mapping, Klyuchevskaya Volcano Group, Kamchatka, Russia. Permafrost Periglac. Process. 19, 261–277. doi:10.1002/ppp.622
Adinolfi, G. M., Cesca, S., Picozzi, M., Heimann, S., and Zollo, A. (2019). Detection of Weak Seismic Sequences Based on Arrival Time Coherence and Empiric Network Detectability: An Application at a Near Fault Observatory. Geophys. J. Int. 218, 2054–2065. doi:10.1093/gji/ggz248
Bagnardi, M., and Hooper, A. (2018). Inversion of Surface Deformation Data for Rapid Estimates of Source Parameters and Uncertainties: A Bayesian Approach. Geochem. Geophys. Geosyst. 19, 2194–2211. doi:10.1029/2018GC007585
Belousov, A. (1996). Deposits of the 30 March 1956 Directed Blast at Bezymianny Volcano, Kamchatka, Russia. Bull. Volcanology 57, 649–662. doi:10.1007/s004450050118
Belousov, A., Voight, B., Belousova, M., and Petukhin, A. (2002). Pyroclastic Surges and Flows from the 8-10 May 1997 Explosive Eruption of Bezymianny Volcano, Kamchatka, Russia. Bull. Volcanology 64, 455–471. doi:10.1007/s00445-002-0222-5
Biggs, J., and Pritchard, M. E. (2017). Global Volcano Monitoring: What Does it Mean when Volcanoes Deform. Elements 13, 17–22. doi:10.2113/gselements.13.1.17
Biggs, J., and Wright, T. J. (2020). How Satellite InSAR Has Grown from Opportunistic Science to Routine Monitoring over the Last Decade. Nat. Commun. 11, 10–13. doi:10.1038/s41467-020-17587-6
Bogoyavlenskaya, G. E., Braitseva, O. A., Melekestsev, I. V., Kiriyanov, V. Y., and Dan Miller, C. (1985). Catastrophic Eruptions of the Directed-Blast Type at Mount St. Helens, Bezymianny and Shiveluch Volcanoes. J. Geodynamics 3, 189–218. doi:10.1016/0264-3707(85)90035-3
Bonafede, M. (1991). Hot Fluid Migration: an Efficient Source of Ground Deformation: Application to the 1982-1985 Crisis at Campi Flegrei-Italy. J. Volcanology Geothermal Res. 48, 187–198. doi:10.1016/0377-0273(91)90042-X
Bredemeyer, S., and Hansteen, T. H. (2014). Synchronous Degassing Patterns of the Neighbouring Volcanoes Llaima and Villarrica in South-central Chile: the Influence of Tidal Forces. Int. J. Earth Sci. (Geol Rundsch) 103, 1999–2012. doi:10.1007/s00531-014-1029-2
Briole, P., Massonnet, D., and Delacourt, C. (1997). Post-eruptive Deformation Associated with the 1986-87 and 1989 Lava Flows of Etna Detected by Radar Interferometry. Geophys. Res. Lett. 24, 37–40. doi:10.1029/96gl03705
Burchardt, S., and Galland, O. (2016). “Studying Volcanic Plumbing Systems – Multidisciplinary Approaches to a Multifaceted Problem,” in Updates in Volcanology - From Volcano Modelling to Volcano Geology. Editor K. Nemeth (London, UK: Intech), 33. Available at:. doi:10.5772/63959
Caricchi, L., Annen, C., Blundy, J., Simpson, G., and Pinel, V. (2014). Frequency and Magnitude of Volcanic Eruptions Controlled by Magma Injection and Buoyancy. Nat. Geosci 7, 126–130. doi:10.1038/ngeo2041
Caricchi, L., Sheldrake, T. E., and Blundy, J. (2018). Modulation of Magmatic Processes by CO2 flushing. Earth Planet. Sci. Lett. 491, 160–171. doi:10.1016/j.epsl.2018.03.042
Caricchi, L., Townsend, M., Rivalta, E., and Namiki, A. (2021). The Build-Up and Triggers of Volcanic Eruptions. Nat. Rev. Earth Environ. 2, 458–476. doi:10.1038/s43017-021-00174-8
Cashman, K. V., Sparks, R. S. J., and Blundy, J. D. (2017). Vertically Extensive and Unstable Magmatic Systems: A Unified View of Igneous Processes. Science 355, 1–9. doi:10.1126/science.aag3055
Chen, C. W., and Zebker, H. A. (2001). Two-dimensional Phase Unwrapping with Use of Statistical Models for Cost Functions in Nonlinear Optimization. J. Opt. Soc. Am. A. 18, 338–350. doi:10.1364/josaa.18.000338
Chouet, B. A., and Matoza, R. S. (2013). A Multi-Decadal View of Seismic Methods for Detecting Precursors of Magma Movement and Eruption. J. Volcanology Geothermal Res. 252, 108–175. doi:10.1016/j.jvolgeores.2012.11.013
Coppola, D., Laiolo, M., Cigolini, C., Massimetti, F., Delle Donne, D., Ripepe, M., et al. (2020). Thermal Remote Sensing for Global Volcano Monitoring: Experiences from the MIROVA System. Front. Earth Sci. 7, 1–21. doi:10.3389/feart.2019.00362
Coppola, D., Laiolo, M., Massimetti, F., Hainzl, S., Shevchenko, A. V., Mania, R., et al. (2021). Thermal Remote Sensing Reveals Communication between Volcanoes of the Klyuchevskoy Volcanic Group. Sci. Rep. 11, 1–16. doi:10.1038/s41598-021-92542-z
Droznin, D. V., and Droznina, S. Y. (2011). Interactive DIMAS Program for Processing Seismic Signals. Seism. Instr. 47, 215–224. doi:10.3103/s0747923911030054
Endo, E. T., and Murray, T. (1991). Real-time Seismic Amplitude Measurement (RSAM): a Volcano Monitoring and Prediction Tool. Bull. Volcanol. 53, 533–545. doi:10.1007/bf00298154
Fedotov, S. a., Zharinov, N. a., and Gontovaya, L. I. (2010). The Magmatic System of the Klyuchevskaya Group of Volcanoes Inferred from Data on its Eruptions, Earthquakes, Deformation, and Deep Structure. J. Volcanolog. Seismol. 4, 1–33. doi:10.1134/S074204631001001X
Galetto, F., Bagnardi, M., Acocella, V., and Hooper, A. (2019). Noneruptive Unrest at the Caldera of Alcedo Volcano (Galápagos Islands) Revealed by InSAR Data and Geodetic Modeling. J. Geophys. Res. Solid Earth 124, 3365–3381. doi:10.1029/2018JB017103
Girina, O. A. (2013). Chronology of Bezymianny Volcano Activity, 1956-2010. J. Volcanology Geothermal Res. 263, 22–41. doi:10.1016/j.jvolgeores.2013.05.002
Girina, O. A., Loupian, E. A., Loupian, E. A., Melnikov, D. V., Manevich, A. G., Sorokin, A. А., et al. (2018). Bezymianny Volcano Eruption on December 20, 2017. Sovr. Probl. DZZ Kosm. 15, 88–99. doi:10.21046/2070-7401-2018-15-3-88-99
Girona, T., Costa, F., and Schubert, G. (2015). Degassing during Quiescence as a Trigger of Magma Ascent and Volcanic Eruptions. Sci. Rep. 5, 1–7. doi:10.1038/srep18212
Goldstein, R. M., and Werner, C. L. (1998). Radar Interferogram Filtering for Geophysical Applications. Geophys. Res. Lett. 25, 4035–4038. doi:10.1029/1998GL900033
Gorshkov, G. S. (1959). Gigantic Eruption of the Volcano Bezymianny. Bull. Volcanol. 20, 77–109. doi:10.1007/BF02596572
Grapenthin, R., Freymueller, J. T., and Serovetnikov, S. S. (2013). Surface Deformation of Bezymianny Volcano, Kamchatka, Recorded by GPS: The Eruptions from 2005 to 2010 and Long-Term, Long-Wavelength Subsidence. J. Volcanology Geothermal Res. 263, 58–74. doi:10.1016/j.jvolgeores.2012.11.012
Groos, J. C., and Ritter, J. R. R. (2009). Time Domain Classification and Quantification of Seismic Noise in an Urban Environment. Geophys. J. Int. 179, 1213–1231. doi:10.1111/j.1365-246X.2009.04343.x
Heap, M. J., Troll, V. R., Kushnir, A. R. L., Gilg, H. A., Collinson, A. S. D., Deegan, F. M., et al. (2019). Hydrothermal Alteration of Andesitic Lava Domes Can lead to Explosive Volcanic Behaviour. Nat. Commun. 10, 1–10. doi:10.1038/s41467-019-13102-8
Heimann, S., Kriegerowski, M., Isken, M., Cesca, S., Daout, S., Grigoli, F., et al. (2017). Pyrocko - an Open-Source Seismology Toolbox and Library. Gfzdata Serv. Potsdam. doi:10.5880/GFZ.2.1.2017.001
Horwell, C. J., Williamson, B. J., Llewellin, E. W., Damby, D. E., and Le Blond, J. S. (2013). The Nature and Formation of Cristobalite at the Soufrière Hills Volcano, Montserrat: Implications for the Petrology and Stability of Silicic Lava Domes. Bull. Volcanol. 75, 1–19. doi:10.1007/s00445-013-0696-3
Hotovec‐Ellis, A. J., Vidale, J. E., Gomberg, J., Thelen, W., and Moran, S. C. (2015). Changes in Seismic Velocity during the First 14 Months of the 2004-2008 Eruption of Mount St. Helens, Washington. J. Geophys. Res. Solid Earth 120, 6226–6240. doi:10.1002/2015JB012101
Huffman, G., Bolvin, D., Braithwaite, D., Hsu, K., Joyce, R., and Xie, P. (2019). GPM IMERG Final Precipitation L3 Day 0.1 Degree X 0.1 Degree V06. Greenbelt, Goddard Earth Sci. Data Inf. Serv. Cent. (GES Disc). doi:10.5067/GPM/IMERGDF/DAY/06
Ivanov, A. I., Koulakov, I. Y., West, M., Jakovlev, A. V., Gordeev, E. I., Senyukov, S., et al. (2016). Magma Source beneath the Bezymianny Volcano and its Interconnection with Klyuchevskoy Inferred from Local Earthquake Seismic Tomography. J. Volcanology Geothermal Res. 323, 62–71. doi:10.1016/j.jvolgeores.2016.04.010
Ivanova, D. A., Shcherbakov, V. D., Yu, P. P., Nekrylov, N. A., Davydova, V. O., Turova, M. A., et al. (2018). Cristobalite in Extrusive Rocks of Bezymianny Volcano. New data Miner 52, 51–58.
Jaupart, C., and Allègre, C. J. (1991). Gas Content, Eruption Rate and Instabilities of Eruption Regime in Silicic Volcanoes. Earth Planet. Sci. Lett. 102, 413–429. doi:10.1016/0012-821X(91)90032-D
Jones, D. B., Harrison, S., Anderson, K., and Betts, R. A. (2018). Mountain Rock Glaciers Contain Globally Significant Water Stores. Sci. Rep. 8, 1–10. doi:10.1038/s41598-018-21244-w
Koulakov, I., Abkadyrov, I., Al Arifi, N., Deev, E., Droznina, S., Gordeev, E. I., et al. (2017). Three Different Types of Plumbing System beneath the Neighboring Active Volcanoes of Tolbachik, Bezymianny, and Klyuchevskoy in Kamchatka. J. Geophys. Res. Solid Earth 122, 3852–3874. doi:10.1002/2017JB014082
Koulakov, I., Plechov, P., Mania, R., Walter, T. R., Smirnov, S. Z., Abkadyrov, I., et al. (20212017). Anatomy of the Bezymianny Volcano Merely before an Explosive Eruption on 20.12.2017. Sci. Rep. 11, 1–12. doi:10.1038/s41598-021-81498-9
Lipman, P. W., Moore, J. G., and Swanson, D. A. (1981). “Bulging of the North Flank before the May 18 Eruption - Geodetic Data,” in The 1980 Eruptions of Mount St. Helens. Editors P. W. Lipman, and D. R. Mullineaux (Washington: United States Geological Survey), 143–155.
Lisowski, M. (2007). “Analytical Volcano Deformation Source Models,” in Volcano Deformation (Berlin, Heidelberg: Springer Praxis BooksSpringer), 279–304. doi:10.1007/978-3-540-49302-0_8
López, T., Ushakov, S., Izbekov, P., Tassi, F., Cahill, C., Neill, O., et al. (2013). Constraints on Magma Processes, Subsurface Conditions, and Total Volatile Flux at Bezymianny Volcano in 2007-2010 from Direct and Remote Volcanic Gas Measurements. J. Volcanology Geothermal Res. 263, 92–107. doi:10.1016/j.jvolgeores.2012.10.015
López-Comino, J. A., Cesca, S., Heimann, S., Grigoli, F., Milkereit, C., Dahm, T., et al. (2017). Characterization of Hydraulic Fractures Growth during the Äspö Hard Rock Laboratory Experiment (Sweden). Rock Mech. Rock Eng. 50, 2985–3001. doi:10.1007/s00603-017-1285-0
Lundgren, P., Nikkhoo, M., Samsonov, S. V., Milillo, P., Gil-Cruz, F., and Lazo, J. (2017). Source Model for the Copahue Volcano Magma Plumbing System Constrained by InSAR Surface Deformation Observations. J. Geophys. Res. Solid Earth 122, 5729–5747. doi:10.1002/2017JB014368
Maccaferri, F., Bonafede, M., and Rivalta, E. (2011). A Quantitative Study of the Mechanisms Governing dike Propagation, dike Arrest and Sill Formation. J. Volcanology Geothermal Res. 208, 39–50. doi:10.1016/j.jvolgeores.2011.09.001
Magee, C., Stevenson, C. T. E., Ebmeier, S. K., Keir, D., Hammond, J. O. S., Gottsmann, J. H., et al. (2018). Magma Plumbing Systems: A Geophysical Perspective. J. Petrol. 59, 1217–1251. doi:10.1093/petrology/egy064
Manconi, A., Walter, T. R., and Amelung, F. (2007). Effects of Mechanical Layering on Volcano Deformation. Geophys. J. Int. 170, 952–958. doi:10.1111/j.1365-246x.2007.03449.x
Mania, R., Walter, T. R., Belousova, M., Belousov, A., and Senyukov, S. L. (2019). Deformations and Morphology Changes Associated with the 2016-2017 Eruption Sequence at Bezymianny Volcano, Kamchatka. Remote Sensing. 11, 1278. doi:10.3390/rs11111278
Massonnet, D., and Feigl, K. L. (1998). Radar Interferometry and its Application to Changes in the Earth's Surface. Rev. Geophys. 36, 441–500. doi:10.1029/97RG03139
Mock, C. J., Bartlein, P. J., and Anderson, P. M. (1998). Atmospheric Circulation Patterns and Spatial Climatic Variations in Beringia. Int. J. Climatol. 18, 1085–1104. doi:10.1002/(sici)1097-0088(199808)18:10<1085:aid-joc305>3.0.co;2-k
Mogi, K. (1958). Relations between the Eruptions of Various Volcanoes and the Deformations of the Ground Surfaces Around Them. Bull. Earthq. Res. Inst. 36, 99–134.
Montgomery-Brown, E. K., Wicks, C. W., Cervelli, P. F., Langbein, J. O., Svarc, J. L., Shelly, D. R., et al. (2015). Renewed Inflation of Long Valley Caldera, California (2011 to 2014). Geophys. Res. Lett. 42, 5250–5257. doi:10.1002/2015GL064338
Mucciarelli, M., Gallipoli, M. R., Di Giacomo, D., Di Nota, F., and Nino, E. (2005). The Influence of Wind on Measurements of Seismic Noise. Geophys. J. Int. 161, 303–308. doi:10.1111/j.1365-246X.2004.02561.x
Neuberg, J. (2000). Characteristics and Causes of Shallow Seismicity in Andesite Volcanoes. Phil. Trans. R. Soc. Lond. Ser. A: Math. Phys. Eng. Sci. 358, 1533–1546. doi:10.1098/rsta.2000.0602
Nikkhoo, M., Walter, T. R., Lundgren, P. R., and Prats-Iraola, P. (2017). Compound Dislocation Models (CDMs) for Volcano Deformation Analyses. Geophys. J. Int. 208, 877–894. doi:10.1093/gji/ggw427
Ozerov, A. Y., Ariskin, A. A., Kyle, P., Bogoyavlenskaya, G. E., and Karpenko, S. F. (1997). Petrological – Geochemical Model for Genetic Relationships between Basaltic and Andesitic Magmatism of Klyuchevskoi and Bezymyannyi Volcanoes, Kamchatka. Petrology 5, 550–569.
Pallister, J. S., McCausland, W. A., Jónsson, S., Lu, Z., Zahran, H. M., Hadidy, S. E., et al. (2010). Broad Accommodation of Rift-Related Extension Recorded by Dyke Intrusion in Saudi Arabia. Nat. Geosci 3, 705–712. doi:10.1038/ngeo966
Parks, M. M., Biggs, J., England, P., Mather, T. A., Nomikou, P., Palamartchouk, K., et al. (2012). Evolution of Santorini Volcano Dominated by Episodic and Rapid Fluxes of Melt from Depth. Nat. Geosci 5, 749–754. doi:10.1038/ngeo1562
Power, J. A., Lahr, J. C., Page, R. A., Chouet, B. A., Stephens, C. D., Harlow, D. H., et al. (1994). Seismic Evolution of the 1989-1990 Eruption Sequence of Redoubt Volcano, Alaska. J. Volcanology Geothermal Res. 62, 69–94. doi:10.1016/0377-0273(94)90029-9
Richter, N., Poland, M. P., and Lundgren, P. R. (2013). TerraSAR-X Interferometry Reveals Small-Scale Deformation Associated with the summit Eruption of Kīlauea Volcano, Hawai'i. Geophys. Res. Lett. 40, 1279–1283. doi:10.1002/grl.50286
Rodionov, S. N., Overland, J. E., and Bond, N. A. (2005). The Aleutian Low and Winter Climatic Conditions in the Bering Sea. Part I: Classification*. J. Clim. 18, 160–177. doi:10.1175/JCLI3253.1
Roman, D. C., and Cashman, K. V. (2018). Top-Down Precursory Volcanic Seismicity: Implications for 'Stealth' Magma Ascent and Long-Term Eruption Forecasting. Front. Earth Sci. 6, 1–18. doi:10.3389/feart.2018.00124
Salzer, J. T., Nikkhoo, M., Walter, T. R., Sudhaus, H., Reyes-Dã¡vila, G., Bretón, M., et al. (2014). Satellite radar data reveal short-term pre-explosive displacements and a complex conduit system at Volcán de Colima, Mexico. Front. Earth Sci. 2, 1–11. doi:10.3389/feart.2014.00012
Scandone, R., Cashman, K. V., and Malone, S. D. (2007). Magma Supply, Magma Ascent and the Style of Volcanic Eruptions. Earth Planet. Sci. Lett. 253, 513–529. doi:10.1016/j.epsl.2006.11.016
Scarpa, R., and Gasparini, P. (1996). A Review of Volcano Geophysics and Volcano-Monitoring Methods. Monit. Mitig. Volcano Hazards 3, 3–22. doi:10.1007/978-3-642-80087-0_1
Senyukov, S. L. (2013). Monitoring and Prediction of Volcanic Activity in Kamchatka from Seismological Data: 2000-2010. J. Volcanolog. Seismol. 7, 86–97. doi:10.1134/S0742046313010077
Shapiro, N. M., Droznin, D. V., Droznina, S. Y., Senyukov, S. L., Gusev, A. A., and Gordeev, E. I. (2017). Deep and Shallow Long-Period Volcanic Seismicity Linked by Fluid-Pressure Transfer. Nat. Geosci 10, 442–445. doi:10.1038/ngeo2952
Shcherbakov, V. D., Plechov, P. Y., Izbekov, P. E., and Shipman, J. S. (2011). Plagioclase Zoning as an Indicator of Magma Processes at Bezymianny Volcano, Kamchatka. Contrib. Mineral. Petrol. 162, 83–99. doi:10.1007/s00410-010-0584-1
Shevchenko, A. V., Dvigalo, V. N., Walter, T. R., Mania, R., Maccaferri, F., Svirid, I. Y., et al. (2020). The Rebirth and Evolution of Bezymianny Volcano, Kamchatka after the 1956 Sector Collapse. Commun. Earth Environ. 1. 15. doi:10.1038/s43247-020-00014-5
Sparks, R. S. J. (2003). Forecasting Volcanic Eruptions. Earth Planet. Sci. Lett. 210, 1–15. doi:10.1016/S0012-821X(03)00124-9
Stevens, N. F., Wadge, G., Williams, C. A., Morley, J. G., Muller, J.-P., Murray, J. B., et al. (2001). Surface Movements of Emplaced Lava Flows Measured by Synthetic Aperture Radar Interferometry. J. Geophys. Res. 106, 11293–11313. doi:10.1029/2000jb900425
Stock, M. J., Humphreys, M. C. S., Smith, V. C., Isaia, R., and Pyle, D. M. (2016). Late-stage Volatile Saturation as a Potential Trigger for Explosive Volcanic Eruptions. Nat. Geosci 9, 249–254. doi:10.1038/ngeo2639
Tait, S., Jaupart, C., and Vergniolle, S. (1989). Pressure, Gas Content and Eruption Periodicity of a Shallow, Crystallising Magma Chamber. Earth Planet. Sci. Lett. 92, 107–123. doi:10.1016/0012-821X(89)90025-3
Thelen, W., West, M., and Senyukov, S. (2010). Seismic Characterization of the Fall 2007 Eruptive Sequence at Bezymianny Volcano, Russia. J. Volcanology Geothermal Res. 194, 201–213. doi:10.1016/j.jvolgeores.2010.05.010
Tilling, R. I. (2008). The Critical Role of Volcano Monitoring in Risk Reduction. Adv. Geosci. 14, 3–11. doi:10.5194/adgeo-14-3-2008
Turner, S. J., Izbekov, P., and Langmuir, C. (2013). The Magma Plumbing System of Bezymianny Volcano: Insights from a 54year Time Series of Trace Element Whole-Rock Geochemistry and Amphibole Compositions. J. Volcanology Geothermal Res. 263, 108–121. doi:10.1016/j.jvolgeores.2012.12.014
Valade, S., Ley, A., Massimetti, F., D’Hondt, O., Laiolo, M., Coppola, D., et al. (2019). Towards Global Volcano Monitoring Using Multisensor sentinel Missions and Artificial Intelligence: The MOUNTS Monitoring System. Remote Sensing 11, 1528–1531. doi:10.3390/rs11131528
Voight, B., Glicken, H., Janda, R. J., and Douglass, P. M. (1981). “Catastrophic Rockslide Avalanche of May 18,” in The 1980 Eruptions of Mount St. Helens. Editors P. W. Lipman, and D. R. Mullineaux (Washington: United States Geological Survey), 347–377.
Voight, B., Sparks, R. S. J., Miller, A. D., Stewart, R. C., Hoblitt, R. P., Clarke, A., et al. (1999). Magma Flow Instability and Cyclic Activity at Soufriere Hills Volcano, Montserrat, British West Indies. Science 283, 1138–1142. doi:10.1126/science.283.5405.1138
Werner, C., Wegmüller, U., Strozzi, T., and Wiesmann, A. (2000). GAMMA SAR and Interferometric Processing Software. Eur. Sp. Agency, (Special Publ. ESA SP 461, 211–219.
White, R., and McCausland, W. (2016). Volcano-tectonic Earthquakes: A New Tool for Estimating Intrusive Volumes and Forecasting Eruptions. J. Volcanology Geothermal Res. 309, 139–155. doi:10.1016/j.jvolgeores.2015.10.020
Wright, T. J., Parsons, B. E., and Lu, Z. (2004). Toward Mapping Surface Deformation in Three Dimensions Using InSAR. Geophys. Res. Lett. 31, 1–5. doi:10.1029/2003GL018827
Xu, W., Jónsson, S., Ruch, J., and Aoki, Y. (2016). The 2015 Wolf Volcano (Galápagos) Eruption Studied Using Sentinel-1 and ALOS-2 Data. Geophys. Res. Lett. 43, 9573–9580. doi:10.1002/2016GL069820
Yu, C., Li, Z., Penna, N. T., and Crippa, P. (2018). Generic Atmospheric Correction Model for Interferometric Synthetic Aperture Radar Observations. J. Geophys. Res. Solid Earth 123, 9202–9222. doi:10.1029/2017JB015305
Yu, C., Penna, N. T., and Li, Z. (2017). Generation of Real‐time Mode High‐resolution Water Vapor fields from GPS Observations. J. Geophys. Res. Atmos. 122, 2008–2025. doi:10.1002/2016JD025753
Yun, S., Segall, P., and Zebker, H. (2006). Constraints on Magma Chamber Geometry at Sierra Negra Volcano, Galápagos Islands, Based on InSAR Observations. J. Volcanology Geothermal Res. 150, 232–243. doi:10.1016/j.jvolgeores.2005.07.009
Zelenski, M., Taran, Y., and Galle, B. (2015). High Emission Rate of Sulfuric Acid from Bezymianny Volcano, Kamchatka. Geophys. Res. Lett. 42, 7005–7013. doi:10.1002/2015GL065340
Keywords: Bezymianny, volcano deformation, seismic precursors, InSAR, magma plumbing system, atmosphere
Citation: Mania R, Cesca S, Walter TR, Koulakov I and Senyukov SL (2021) Inflating Shallow Plumbing System of Bezymianny Volcano, Kamchatka, Studied by InSAR and Seismicity Data Prior to the 20 December 2017 Eruption. Front. Earth Sci. 9:765668. doi: 10.3389/feart.2021.765668
Received: 27 August 2021; Accepted: 29 November 2021;
Published: 16 December 2021.
Edited by:
Yosuke Aoki, The University of Tokyo, JapanReviewed by:
Andres Tassara, University of Concepcion, ChileCopyright © 2021 Mania, Cesca, Walter, Koulakov and Senyukov. This is an open-access article distributed under the terms of the Creative Commons Attribution License (CC BY). The use, distribution or reproduction in other forums is permitted, provided the original author(s) and the copyright owner(s) are credited and that the original publication in this journal is cited, in accordance with accepted academic practice. No use, distribution or reproduction is permitted which does not comply with these terms.
*Correspondence: René Mania, cmVuZS5tYW5pYUBnZnotcG90c2RhbS5kZQ==
Disclaimer: All claims expressed in this article are solely those of the authors and do not necessarily represent those of their affiliated organizations, or those of the publisher, the editors and the reviewers. Any product that may be evaluated in this article or claim that may be made by its manufacturer is not guaranteed or endorsed by the publisher.
Research integrity at Frontiers
Learn more about the work of our research integrity team to safeguard the quality of each article we publish.