 Mei Yao
 Yunqi Ma2
- 1School of Atmospheric Sciences, Chengdu University of Information Technology, Chengdu, China
- 2State Key Laboratory of Severe Weather/Chinese Academy of Meteorological Sciences, Beijing, China
- 3School of Earth Science, University of Melbourne, Melbourne, VIC, Australia
- 4Research and Development Division, Bureau of Meteorology, Melbourne, VIC, Australia
We designed two groups of experiments to test the forecast performance of the Dynamical-Statistical-Analog Ensemble Forecast (DSAEF_LTP) model for precipitation caused by landfalling northward-moving typhoons. The first group DSAEF_LTP-1 had the generalized initial value containing three factors (tropical cyclone track, landfall season and tropical cyclone intensity) while the second group DSAEF_LTP-2 added multiple choices of similarity regions. We selected 33 typhoons that brought about maximum daily precipitation ≥100 mm to the area north of the Yangtze River from 2004–2019. We used 22 tropical cyclones from 2004–2015 as training samples to identify the best scheme, which was then used to conduct independent sample forecasting experiments for 11 tropical cyclones from 2016–2019. The results were compared with those of four numerical models (ECMWF, GFS, GRAPES and SMS-WARMS). The simulation ability of the DSAEF_LTP model was significantly improved after adding the similarity regions. The TSsum (TS250 + TS100) for accumulated precipitation ≥250 and ≥100 mm increased from 0.1239 (0 + 0.1239) to 0.1883 (0.0526 + 0.1357). The forecast performance of the DSAEF_LTP for TS100 was 0.1355 for DSAEF_LTP-1 and 0.099 for DSAEF_LTP-2 . Both exceeded the scores for two of the operational Numerical Models, GRAPES (0.0798) and SMS-WARMS (0.0943). The DSAEF_LTP model can capture the distribution patterns of the observed precipitation in most cases. The forecasting performance was good over the southern coast of China but was limited in the north. The development of vortex identification technology for residual vortices and the introduction of new environmental factors into the generalized initial value are required to improve the DSAEF_LTP model.
1 Introduction
Typhoons (or tropical cyclones) frequently produce severe catastrophic weather (Cai et al., 1994; Liang et al., 1995; Zhou et al., 2004). Typhoon rainstorms often bring about disasters (Cheng et al., 2005, 2007; Chen et al., 2010), and many records of extreme rainstorms are related to typhoon activity (Chen and Ding, 1979)—For example, Typhoon Nina caused daily precipitation of 1,062 mm in Zhumadian, Henan Province in 1975 and destroyed 102 km of the Beijing–Guangzhou railway. Traffic was interrupted for 18 days and at least 26,000 people died. Precipitation from Typhoon Morakot in 2009 reached 3,059.8 mm, causing a major disaster in southern Taiwan and resulting in about 700 people being reported as missing or dead. In 2013, Typhoon Fitow brought extreme precipitation to the north-central coastal areas of Zhejiang Province, causing cities such as Yuyao to be flooded for more than a week; the direct economic loss exceeded 60 billion yuan. Strengthening the forecasts of tropical cyclone rainstorms is therefore of great practical significance in improving our ability to prevent tropical cyclone rainstorm disasters.
Research on precipitation forecasts of landfalling tropical cyclones (LTCs) has attracted much attention (Chen et al., 2006; Woo et al., 2014; Rogers, 2018). Numerical models for the prediction of LTC precipitation are being improved (Ma and Tan, 2009; Zhu et al., 2016; Chen et al., 2016) and dynamical–statistical models (Ren et al., 2020) have been shown to improve forecasting by numerical models. Dynamical–statistical forecasting methods can be divided into three categories: 1) models that forecast tropical cyclone precipitation from the perspective of the climate-mean by combining the tropical cyclone track predicted by the numerical model with the historical observed precipitation (Marks et al., 2002; Lee et al., 2006; Lonfat et al., 2007); 2) models that predict tropical cyclone precipitation from the tropical cyclone track and the distribution of rainfall intensity at the initial time (Kidder et al., 2005; Liu, 2009; Ebert et al., 2011); and 3) models that construct a dynamical–statistical similarity scheme based on the forecast element field of the numerical model to predict tropical cyclone precipitation (Li and Zhao, 2009; Zhong et al., 2009).
Ren et al. (2020) proposed the Dynamical-Statistical-Analog Ensemble Forecast (DSAEF_LTP) model for predicting the precipitation of landfalling typhoons based on an exploration of new ideas of ensemble forecasts with a perfect model. The generalized initial value (GIV) is the most important concept in this model and is composed of physical factors that have a clear influence on typhoon precipitation. In the early stage of model development, the GIV introduces only two physical factors: the tropical cyclone track and the landfall season. Ding et al. (2020) added a tropical cyclone intensity factor in an experiment to forecast the accumulated precipitation in South China, resulting in improved forecast performance. Jia et al. (2020) used this model to conduct a simulation experiment on Typhoon Lekima and improved the simulation ability of the model by including the tropical cyclone intensity and by improving the specification of the parameters for the similarity region (the area over which the forecast track is compared with historic tracks for the choice of analogs).
Research on the DSAEF_LTP model is aimed mainly at experiments with landfalling typhoons in southern China, and is restricted by small sample numbers. However, landfalling northward-moving typhoons have frequently occurred in China in recent years and it is unclear whether this model is suitable for forecasting precipitation from these systems. In this paper, we carry out an experiment with a large number of samples to investigate this issue.
Section 2 introduces the data and methods. Section 3 describes the design of the experiment and the steps used to obtain the “best scheme”. Section 4 compares the performance of the DSAEF_LTP model under the best scheme in predicting precipitation for landfalling northward-moving tropical cyclones and compares the results with those from four numerical models. Section 5 summarizes and discusses our results.
2 Data and Methodology
2.1 Data
We used daily precipitation data from 2027 rain gage stations in China from 1960 to 2019 provided by the National Meteorological Information Center (NMIC) of the China Meteorological Administration (CMA). The daily data period was from 12:00 UTC on the previous day to 12:00 UTC on the same day. The tropical cyclone track data were from the best-track dataset for 1960–2019 provided by the Shanghai Typhoon Research Institute. The dataset included the measured position and intensity of each tropical cyclone at intervals of 6 h (Ying et al., 2014). The analysis period was 2004–2019, chosen according to availability of forecast tracks of the target TCs based on the numerical weather prediction model in the NMIC of the CMA.
We used precipitation forecast data from four numerical models to test the precipitation prediction performance of the DSAEF_LTP model: the European Centre for Medium-Range Weather Forecasting (ECMWF), the China Meteorological Administration Global/Regional Assimilation and Prediction System (GRAPES), the Global Forecast System (GFS) of the U.S. National Center for Environmental Prediction and the Shanghai Meteorological Service WRF ADAS Real-Time Modeling System (SMS-WARMS). The horizontal resolution of the models were (0.125° × 0.125°), (0.25° × 0.25°), (0.25° × 0.25°) and (0.09° × 0.09°) respectively.
2.2 DSAEF_LTP Model
Ren et al. (2020) developed the DSAEF model and applied it to the prediction of precipitation caused by LTCs (Figure 1). The forecast procedure of the DSAEF_LTP model is divided into four steps: 1) obtain the tropical cyclone track predicted by numerical weather prediction models; 2) construct the GIV, including the internal variables of the tropical cyclone and environmental variables; 3) identify analogs for the GIV—in this study, this included identifying the similarity of the track using the tropical cyclone track similarity area index (TSAI) (Ren et al., 2018) and also identifying the similarity of the landfalling dates and intensity; and 4) construct the “ensemble LTP of the analogs” to forecast the accumulated rainfall field of the target tropical cyclone.
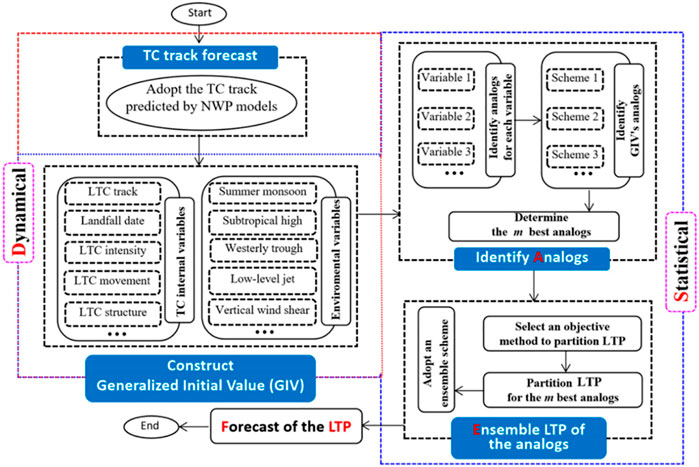
FIGURE 1. Flowchart of the DSAEF_LTP model.
2.3 Other Algorithms
1) Objective synoptic analysis technique
The objective synoptic analysis technique was used to separate and obtain the precipitation caused by the tropical cyclone (Ren et al., 2001; Ren et al., 2007; Wang et al., 2006). It was divided into four steps: 1) division of the precipitation field into independent natural rainbands; 2) identification of potential tropical cyclone rainbands; 3) discrimination of the precipitation of each station; and 4) combination of the complete tropical cyclone rainband.
2) Objective tropical cyclone track similarity area index
The objective tropical cyclone TSAI refers to the geometric area enclosed by any two typhoon tracks. This was used to determine the similarity of two tropical cyclone tracks (Ren et al., 2018). The smaller the TSAI index value, the higher the degree of similarity between the two tropical cyclone tracks.
3) Threat score
We used the threat score, a commonly used test index for the evaluation of weather forecast accuracy , to evaluate the prediction performance of the DSAEF_LTP model. The calculation formula is:
where “hits” is the number of stations at which the prediction is the same as the reality, “misses” is the number of stations where precipitation is not predicted but does occur, and “false alarms” is the number of stations at which precipitation is predicted but does not occur. The value range of threat score is 0–1. The larger the value, the higher the accuracy.
4) Threat score of rain gage stations
The precipitation sequence at each rain gage station as forecast by the DSAEF_LTP model was evaluated against the observed tropical cyclone precipitation to obtain the threat score for each station (STS or Station Threat Score). The distribution of the STS reflects the variations in forecasting performance of the DSAEF_LTP model across different regions.
3 Experimental Design of the DSAEF_LTP Model
3.1 Experimental Samples
We carried out a precipitation prediction experiment with the DSAEF_LTP model using data for northward-moving typhoons that caused maximum daily precipitation ≥100 mm at stations in northern China (Jiangsu, Shandong, Hebei, Tianjin, Beijing, Liaoning, Anhui and Henan provinces north of the Yangtze River) (Figure 2). Table 1 lists the 33 northward-moving typhoon samples selected from 2004 to 2019, from which we used 22 tropical cyclones from 2004 to 2015 as training samples and 11 tropical cyclones from 2016 to 2019 as independent samples.

FIGURE 2. Distribution of 534 rain gage stations in northern China (Jiangsu, Shandong, Hebei, Tianjin, Beijing, Liaoning, Anhui and Henan provinces).
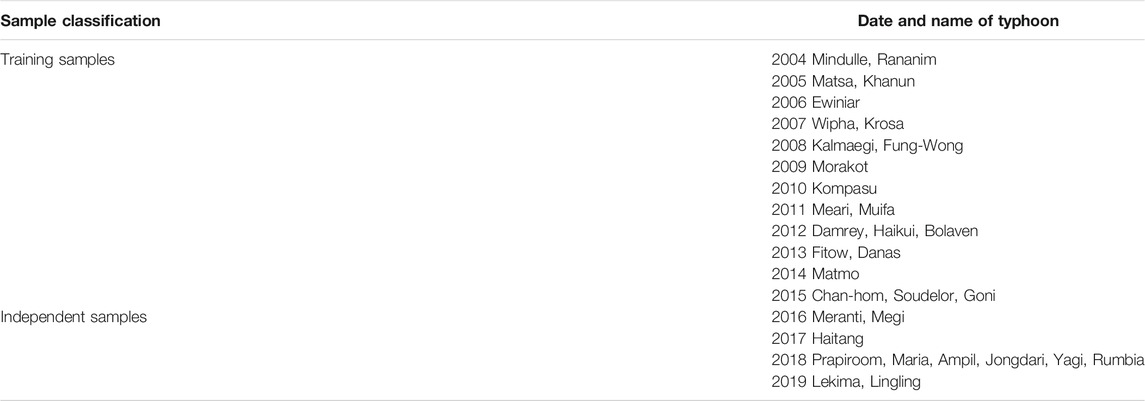
TABLE 1. Names of tropical cyclones used for training and as independent samples.
3.2 Experimental Design
Table 2 lists the eight characteristic parameters used in the DSAEF_LTP model and their corresponding physical meanings. The parameters specifying the similarity regions had 15 values in the early stage of model development; we added a further five similarity regions, which were the 16th–20th values of the similarity region in Table 2, bases on the results of Jia et al. (2020). The number of values of each parameter is listed in the last column of the table, and the total number of combinations used for the ensemble forecast is given at the bottom of the table. Each combination constituted a forecasting scheme. From comparison of the threat score for each scheme, we determined the “best scheme” for forecasting the accumulated precipitation of LTCs.
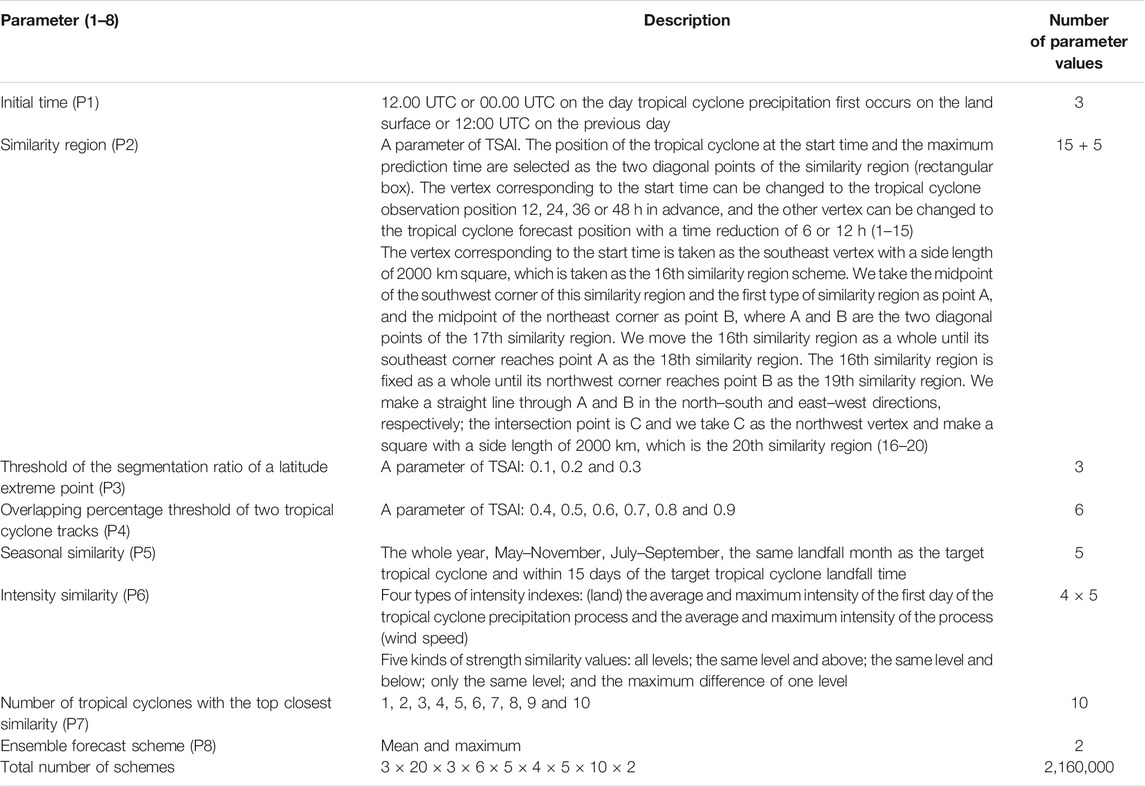
TABLE 2. Parameter table for the DSAEF_LTP model.
We designed two groups of experiments. The first group introduced three factors (the tropical cyclone track, the landfall season and the intensity) (Ding et al., 2020) and the first 15 types of similarity region were selected and recorded as DSAEF_LTP-1. There were 1,620,000 schemes in this group of experiments under ideal conditions. The new similarity regions were added in the second group of experiments—that is, the similarity regions had a total of 20 values, recorded as DSAEF_LTP-2, and there were 2,160,000 prediction schemes in the ideal state. Because the values corresponding to the similarity regions and the number of similar tropical cyclones were not always available, the ensemble size for actual prediction scheme was often smaller than for the ideal scheme.
We focused on the threshold of accumulated precipitation at 100 and 250 mm. The threat score of accumulated precipitation ≥100 mm was defined as TS100 and the threat score of accumulated precipitation ≥250 mm was TS250. The sum of the two was TSsum (TSsum = TS250 + TS100) and the best scheme was the scheme with the largest TSsum. The 22 training samples were used in simulation experiments to screen out the best schemes and then these best schemes were used to carry out the forecast experiments on the 11 independent samples. The results of the forecast were compared with those of the four numerical models (ECMWF, GFS, GRAPES and SMS-WARMS).
4 Results
4.1 Simulation Experiment of Training Samples
The DSAEF_LTP model was used to forecast accumulated precipitation ≥100 and ≥250 mm for the 22 training sample tropical cyclones for the two configurations DSAEF_LTP-1 and DSAEF_LTP-2. Figure 3 shows the distribution of the threat score for the two groups of experiments, where the abscissa (TS250) is the threat score of accumulated precipitation ≥250 mm and the ordinate (TS100) is the threat score of accumulated precipitation ≥100 mm. Each point represents a forecast scheme and the red point is the maximum TSsum, which is defined as the best scheme.
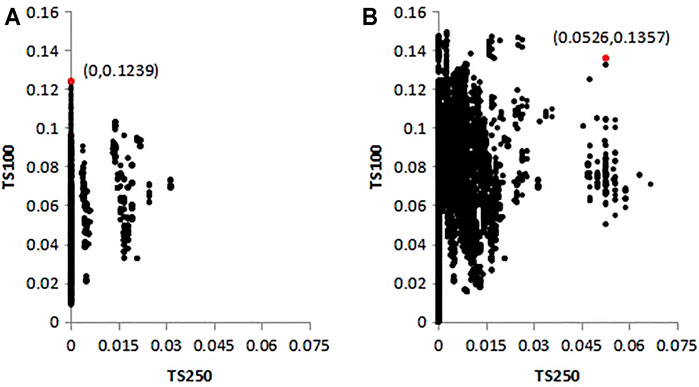
FIGURE 3. Scatter plots of the threat scores for (A) DSAEF_LTP-1 and (B) DSAEF_LTP-2.
Table 3 gives the parameter values of the best schemes for the two groups of experiments. According to Figure 3, TSsum (TS250 + TS100) of the best scheme of DSAEF_LTP-1 was 0.1239 (0 + 0.1239) and TSsum (TS250 + TS100) of the best scheme of DSAEF_LTP-2 was 0.1883 (0.0526 + 0.1357). The overall simulation ability was improved after adding new similarity regions for both accumulated precipitation ≥250 and ≥100 mm.
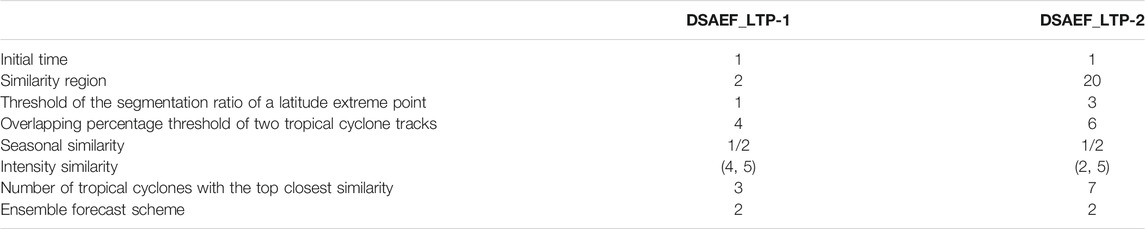
TABLE 3. Parameter values of the best schemes.
4.2 Independent Sample Forecast Experiment
4.2.1 Comparison Between Methods
To test the forecasting performance of the DSAEF_LTP model, accumulated landfall precipitation was predicted with the best schemes of the two groups of simulation experiments for 11 independent tropical cyclone samples from 2016 to 2019. The prediction results were compared with those of the four numerical models (ECMWF, GFS, GRAPES and SMS-WARMS). Figure 4 shows that the forecasting performance of the DSAEF_LTP model was acceptable for accumulated precipitation ≥100 mm, ranking in the middle position compared with the four dynamic models. The TSsum of DSAEF_LTP-1 was 0.1355, which was better than scores for the GRAPES (0.1131) and SMS-WARMS (0.0943) models.
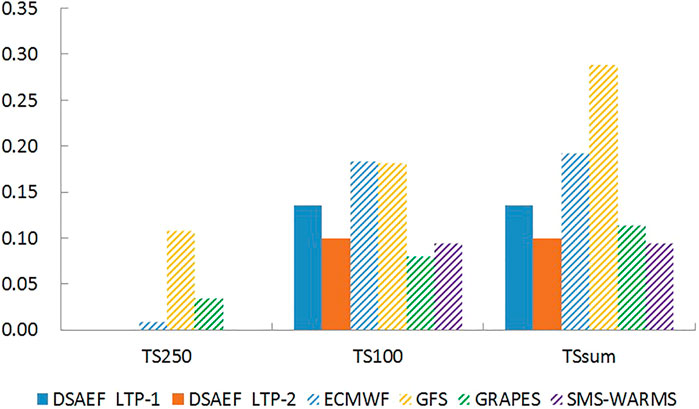
FIGURE 4. Comparison of the average threat score of different models for independent sample precipitation forecasts.
Figure 5 shows the threat score for each independent sample forecast by the DSAEF_LTP model and the four numerical models. Figure 5A shows that the DSAEF_LTP model has no forecasting performance for northward-moving typhoons for the accumulated precipitation threshold ≥250 mm: the TS250 being 0 for both model DSAEF_LTP configurations. Among the 11 independent samples only four tropical cyclones (TC1619, TC 1817, TC1821 and TC 1912) had an accumulated precipitation ≥250 mm. The northward-moving typhoons brought less accumulated precipitation ≥250 mm to the north of the Yangtze River, with only one and two stations with accumulated precipitation ≥250 mm (TC1619 and TC 1817, respectively). It was therefore difficult to accurately forecast precipitation ≥250 mm.
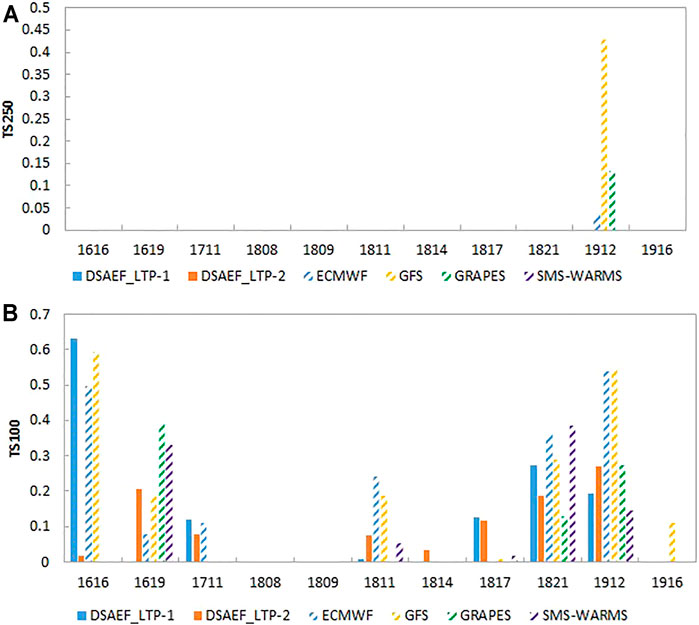
FIGURE 5. Comparison of the threat score of different models for the precipitation forecasts of individual tropical cyclones (A) ≥250 and (B) ≥100 mm.
Figure 5B shows the threat scores for precipitation ≥100 mm. For TC1808 and TC1809, there were only three and two stations, respectively, with accumulated precipitation ≥100 mm and none of the models successfully predicted this precipitation threshold. The DSAEF_LTP model was better than the four numerical models in predicting landfalling typhoon precipitation for TC1616, TC1711, TC1814 and TC 1817. Only the DSAEF_LTP model predicted ≥100 mm precipitation for TC 1814. For the predictions of TC1619, TC 1811, TC1821 and TC 1912, the models with the highest threat score were GRAPES, ECMWF, SMS-WARMS and GFS, respectively; the threshold for TC1916 was predicted by the GFS model only. The number of TCs for which the DSAEF_LTP model threat score ranked highest exceeded that of the four dynamic models. For the two sets of experiments, DSAEF_LTP-1 was better than DSAEF_LTP-2 in predicting TC1616, TC1711, TC1817 and TC 1821. The forecast performance was improved in the predictions of TC1619, TC 1811, TC1814 and TC1912 after adding the new similarity regions.
4.2.2 Analysis of Typical Examples
To better compare the prediction performance of the DSAEF_LTP model with the four numerical models, we selected two typhoons for in-depth analysis: TC1616 with the largest difference in threat score between DSAEF_LTP-1 and DSAEF_LTP-2; and TC 1912 for which the forecast performance of the numerical model was better than the DSAEF_LTP model. The maximum accumulated precipitation of TC1616 was in the range 100–250 mm and the threat score of DSAEF_LTP-1 (TSsum = 0.6308) was better than that of the four numerical models and of DSAEF_LTP-2 (TSsum = 0.0189). The threat score of the DSAEF_LTP-2 model for TC1912 was higher than that of the DSAEF_LTP-1 model, but the prediction performance was poor compared with the ECMWF, GFS and GRAPES models. Figure 6 (TC1616) and Figure 7 (TC 1912) show the field distribution of precipitation for these two tropical cyclones for observations and as predicted by the two DSAEF_LTP configurations and the four numerical models.
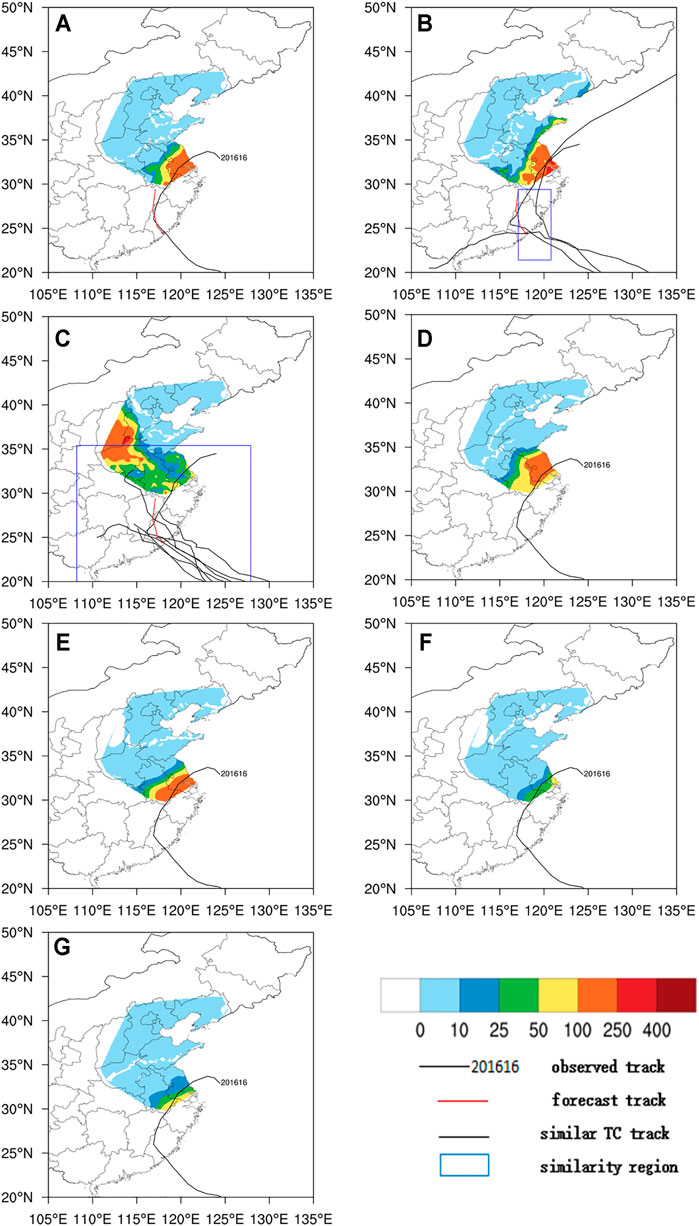
FIGURE 6. Distribution of the accumulated precipitation field for TC1616 (Typhoon Meranti). (A) Observed track and the (B) DSAEF_LTP-1, (C) DSAEF_LTP-2, (D) ECMWF, (E) GFS, (F) GRAPES and (G) SMS-WARMS models.
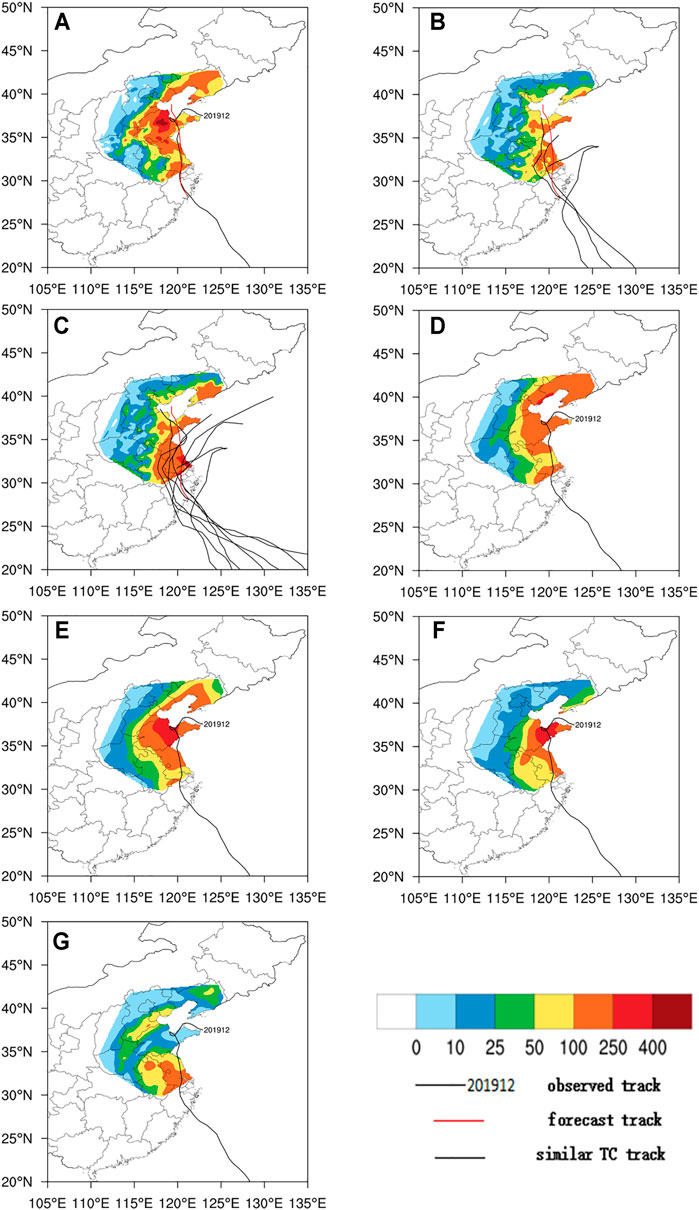
FIGURE 7. Distribution of the accumulated precipitation field of TC 1912 (Typhoon Lekima). (A) Observed track and the (B) DSAEF_LTP-1, (C) DSAEF_LTP-2, (D) ECMWF, (E) GFS, (F) GRAPES and (G) SMS-WARMS models.
Compared with the observations (Figure 6A), the DSAEF_LTP-1, ECWMF and GFS models (Figures 6B,D,E) all capture precipitation ≥100 mm well for TC1616. The DSAEF_LTP-1 model performs best in all models, and the distribution of the precipitation fields was more similar to the observations than other models. The DSAEF_LTP-2 model (Figure 6C) does not show the heavy precipitation center, and the GRAPES (Figure 6F) and SMS-WARMS (Figure 6G) models have no forecasting performance for the higher precipitation thresholds.
Figure 6A shows that the northernmost end of the forecast track corresponding to the best scheme of the DSAEF_LTP model reaches only the northern part of Jiangxi and does not enter the northern region. Due to the increased number of similarity regions for the DSAEF_LTP-2 model, the selected historically similar tropical cyclones of DSAEF_LTP-2 also increase. The tropical cyclones with high similarity are mainly concentrated in the southeastern coastal area and do not penetrate into the northern region. These tropical cyclones are therefore not sufficiently representative to forecast the precipitation of northward-moving typhoons, leading to a poor precipitation forecast performance. This is the reason the average threat score of the DSAEF_LTP-2 model was lower than that of the DSAEF_LTP-1 model in the forecast experiment. Extending the track of typhoons to select more representative historically similar tropical cyclones will help to improve the forecasting performance of the DSAEF_LTP model if we use vortex identification technology for the residual vortices.
For TC 1912, the DSAEF_LTP and SMS-WARMS model (Figures 7B,C,G) did not capture the precipitation field ≥250 mm. The patterns of the DSAEF_LTP model were relatively consistent with the observations in the precipitation field ≥100 mm (Figure 7A), but there were many forecast misses and the forecast range for heavy rainfall was relatively small. However, the occurrence of forecast misses of the DSAEF_LTP-2 model was improved compared with the DSAEF_LTP-1 model. Overall, the GFS model (Figure 7E) performed best and the SMS-WARMS model (Figure 7G) had the poorest performance.
Figure 8 shows the track and precipitation field distribution of the historical similar tropical cyclones corresponding to the best scheme for TC 1912. Figures 8A–C show the best similar tropical cyclones corresponding to the DSAEF_LTP-1 model and Figures 8A–G show the seven best similar tropical cyclones corresponding to the DSAEF_LTP-2 model. TC1912 Lekima was a rare northward-moving strong tropical cyclone. After entering Laizhou Bay, Shandong, it rotated and moved less. It was affected by the continuous transport of water vapor by the tropical cyclone circulation and cold air flowing southward under the guidance of an inverted trough, which brought a large amount of heavy precipitation to the northern region. However, Figure 8 shows that the aerial range of heavy precipitation brought to the northern region by the best similar tropical cyclones was generally not large. Few historical strong tropical cyclones with ≥250 mm precipitation moved northward to Shandong and none of the optimum similar tropical cyclones produced heavy precipitation ≥250 mm in Shandong. This is the reason the DSAEF_LTP model does not report a heavy precipitation center with accumulated precipitation ≥250 mm in Shandong and the accumulated precipitation forecast for the northern region was generally poor.
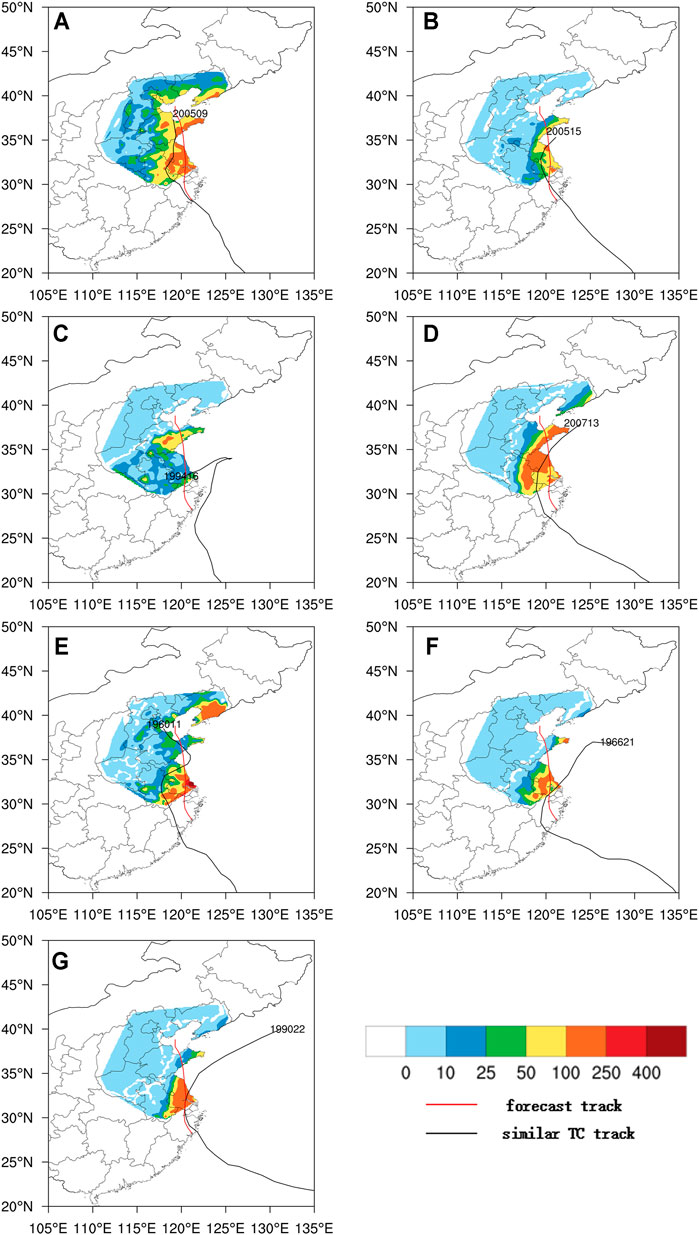
FIGURE 8. Track and precipitation field distribution of the best tropical cyclones similar to TC 1912 (Typhoon Lekima).
4.2.3 Forecast Score of STS
Figure 9 shows that the largest value of the STS was mainly in the southern coastal area in the forecast of accumulated precipitation in the DSAEF_LTP model for both ≥100 or ≥250 mm precipitation, whereas the STS in the northern area was generally not high. This indicates that the forecast performance of the DSAEF_LTP model was better for typhoon precipitation in the southern region. We need to further analyze the possible causes of extreme precipitation caused by northward-moving typhoons and improve the DSAEF_LTP model to make it suitable for the forecast of precipitation caused by these typhoons.
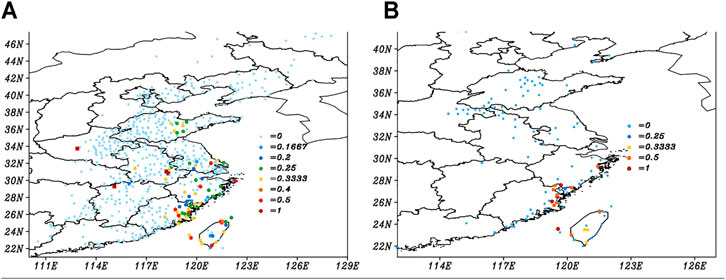
FIGURE 9. STS distribution of the forecast for independent samples with DSAEF_LTP-1 (A) ≥100 and (B) ≥250 mm.
This analysis shows that the DSAEF_LTP model can generally predict the morphological distribution of the precipitation field. The DSAEF_LTP-2 model, which has an increased number of similarity regions compared with the DSAEF_LTP-1 model, improved the issue of forecast misses. The poor landfall rainfall prediction for some tropical cyclones by the DSAEF_LTP model may be because the prediction track of the target tropical cyclone and the official track of the best historical similar tropical cyclones do not penetrate the northern region. Also the historical tropical cyclone may have different background conditions (such as the westerly trough, vertical wind shear or water vapor transport) from the target tropical cyclone, leading to a lack of representativeness of the best similar tropical cyclones. We could extend the tropical cyclone track and introduce these background conditions into the DSAEF_LTP model as similarity variables to further improve the prediction performance of the model.
5 Summary and Discussion
We carried out two groups of simulation experiments with (DSAEF_LTP-2) and without (DSAEF_LTP-1) new similarity regions based on the DSAEF_LTP model with GIV including tropical cyclone track, landfall season and tropical cyclone intensity. We selected the northern region of the Yangtze River (including Jiangsu, Shandong, Hebei, Tianjin, Beijing, Liaoning, Anhui and Henan provinces) for the experiments. We selected 22 typhoons from 2004–2015 as training samples to identify the best schemes for the two groups of experiments. The best schemes were then used to predict the precipitation of 11 typhoons from 2016–2019. The forecast results were compared with those of four numerical models (ECMWF, GFS, GRAPES and SMS-WARMS). Our main results can be summarized as follows.
1) The simulation ability of the DSAEF_LTP model for northward-moving typhoons improves after adding new similarity regions; the simulation of TS250 and TS100 increased from 0 to 0.1239 to 0.0526 and 0.1357, respectively.
2) In the forecast experiment, the threat scores of the DSAEF_LTP-1 and DSAEF_LTP-2 models for accumulated precipitation ≥250 mm were both 0 and for accumulated precipitation ≥100 mm were 0.1355 and 0.099, respectively. The forecasting performance of the DSAEF_LTP model for TS100 was better than that of the GRAPES and SMS-WARMS models.
3) The analysis of typical typhoons (TC1616 and TC 1912) and comparison with the four numerical models showed the DSAEF_LTP model can predict the distribution of precipitation fields similar to the observations. However, because the forecast track and the tracks of similar historical tropical cyclones do not penetrate north and there were few historical northward-moving strong typhoons, the selected best historical tropical cyclones were not sufficiently representative and it was difficult to capture the heavy precipitation center. This restricted the prediction performance of the DSAEF_LTP model.
For the DSAEF_LTP model, it was the first time it has been applied to a large-sample experiment of northward-moving typhoons. It has shown that the prediction performance of the DSAEF_LTP model was comparable to that of the dynamic models. For the number of TCs with the highest threat score generated by the models, the DSAEF_LTP model exceeded that of dynamical models. The prediction performance of the DSAEF_LTP model has been affirmed and is expected to be further improved.
Jia et al. (2020) used the DSAEF_LTP model to conduct a simulation experiment for TC1912 Lekima and showed that the simulation ability of the DSAEF_LTP model ranked second in the prediction models, whereas the threat score for Lekima ranked fourth in our study. However, the best scheme in our study was selected through a large sample simulation experiment and is different from that of Jia et al. (2020). In addition, Jia et al. (2020) considered the whole of China, whereas we considered only northern China. This explains why the prediction performance for TC1912 Lekima was different in the two studies.
The best scheme in the simulation experiment performed well in the DSAEF_LTP model and, with the improvement in the similarity regions, the simulation ability of the model also increased significantly. However, it did not show any advantages over the dynamic model of the simulation stage in the independent sample forecast experiment. After adding similarity regions, its prediction performance was lower than before the improvement. This may be because the prediction performance of the DSAEF_LTP model depends on the independent samples and the scheme selected.
Considering that the forecast performance of DSAEF_LTP model was good over the southern coast, but limited over northern China, further research is required to improve the model’s forecast performance in the north. It is important to develop vortex identification technology for residual vortices to extend the tropical cyclone track data because a residual vortex from not recorded in the tropical cyclone dataset can generally produce heavy rainfall in the north. The GIV of the DSAEF_LTP model currently includes only three factors, and no environmental factors. Considering that environmental factors (e.g., mid-latitude systems and subtropical highs) are important for the precipitation of northward-moving typhoons in the north, we need to introduce environmental factors into the GIV. These modifications should produce a better prediction performance of the DSAEF_LTP model.
Data Availability Statement
The original contributions presented in the study are included in the article/Supplementary Material, further inquiries can be directed to the corresponding author.
Author Contributions
FR designed research. MY conceptualized the analysis and wrote the manuscript. All authors were involved in helpful discussions and contributions to the manuscript.
Funding
This work was supported by the National Key R&D Program of China (Grant No. 2019YFC1510205), the Hainan Provincial Key R&D Program of China (Grant No. SQ2019KJHZ0028), the National Natural Science Foundation of China (Grant No. 41675042) and the Climate Change Cooperation and Innovation Center of Jiangsu Province.
Conflict of Interest
The authors declare that the research was conducted in the absence of any commercial or financial relationships that could be construed as a potential conflict of interest.
Publisher’s Note
All claims expressed in this article are solely those of the authors and do not necessarily represent those of their affiliated organizations, or those of the publisher, the editors and the reviewers. Any product that may be evaluated in this article, or claim that may be made by its manufacturer, is not guaranteed or endorsed by the publisher.
References
Cai, Z. Y., Xu, L. Y., and Xu, Y. T. (1994). A Study on the Tropical Cyclone Disasters in China. Atmos. Sci. 18, 826–836. (in Chinese).
Chen, B., Guo, Y., Dai, K., and Qian, Q. (2016). Research for the Ensemble Member Optimization Correction Technique on Typhoon Rainstorm Forecast and its Application Experiment. Meteorol. Mon 42 (12), 1465–1475. (in Chinese).
Chen, L. S., and Ding, Y. H. (1979). Introduction to Typhoons in the Western North Pacific. Beijing: Science Press. (in Chinese).
Chen, L. S., Li, Y., and Cheng, Z. (2010). An Overview of Research and Forecasting on Rainfall Associated with Landfalling Tropical Cyclones. Adv. Atmos. Sci. [J], 27. doi:10.1007/s00376-010-8171-y
Chen, S. S., Knaff, J. A., and Marks, F. D. (2006). Effects of Vertical Wind Shear and Storm Motion on Tropical Cyclone Rainfall Asymmetries Deduced from TRMM. Monthly Weather Rev. [J] 134, 3190–3208. doi:10.1175/mwr3245.1
Cheng, Z. Q., Chen, L. S., Liu, Y., and Peng, T. Y. (2007). The Spatial and Temporal Characteristics of Tropical Cyclone-Induced Rainfall in China during 1960—2003. J. Appl. Meteorol. Sci. 18 (4), 427–434. (in Chinese).
Cheng, Z. Q., Chen, L. S., Xu, X. D., and Peng, T. Y. (2005). Research Progress on Typhoon Heavy Rainfall in China for Last Ten Years. Meteorol. Monthly 31 (12), 3–9. doi:10.3969/j.issn.1000-0526.2005.12.001
Ding, C. C., Ren, F. M., Liu, Y., McBride, J. L., and Feng, T. (2020). Improvement in the Forecasting of Heavy Rainfall over South China in the DSAEF_LTP Model by Introducing the Intensity of the Tropical Cyclone[J]. Weather Forecast. 35 (5), 1967–1980.
Ebert, E. E., Turk, M., Kusselson, S. J., Yang, J., Seybold, M., Keehn, P. R., et al. (2011). Ensemble Tropical Rainfall Potential (eTRaP) Forecasts. Weather Forecast. 26, 213–224. doi:10.1175/2010waf2222443.1
Jia, L., Jia, Z., Ren, F., Ding, C., Wang, M., and Feng, T. (2020). Introducing TC Intensity into the DSAEF_LTP Model and Simulating Precipitation of Super‐typhoon Lekima(2019) [J]. Quarterly Journal of the Royal Meteorological Society, 1–15. doi:10.1002/qj.3882
Kidder, S. Q., Knaff, J. A., Kusselson, S. J., Turk, M., Ferraro, R. R., and Kuligowski, R. J. (2005). The Tropical Rainfall Potential (TRaP) Technique. Part I: Description and Examples. Wea Forecast. 20 (4), 456–464. doi:10.1175/waf860.1
Lee, C. S., Huang, L. R., Shen, H. S., and Wang, S. T. (2006). A Climatology Model for Forecasting Typhoon Rainfall in Taiwan. Nat. Hazards 37 (1), 87–105. doi:10.1007/s11069-005-4658-8
Li, B., and Zhao, S. X. (2009). Development of Forecasting Model of Typhoon Type Rainstorm by Using SMAT. Meteorol. Monthly 35 (6), 3–12. (in Chinese).
Liang, B. Q., Liang, J. P., and Wen, Z. P. (1995). Study of Typhoon Disasters and its Affects in china. J. Nat. Disasters 4 (1), 84–91. (in Chinese).
Liu, C.-C. (2009). The Influence of Terrain on the Tropical Rainfall Potential Technique in Taiwan. Weather Forecast. 24, 785–799. doi:10.1175/2008waf2222135.1
Lonfat, M., Rogers, R., Marchok, T., and Marks, F. D. (2007). A Parametric Model for Predicting hurricane Rainfall. Monthly Weather Rev. 135, 3086–3097. doi:10.1175/mwr3433.1
Ma, L.-M., and Tan, Z.-M. (2009). Improving the Behavior of the Cumulus Parameterization for Tropical Cyclone Prediction: Convection Trigger. Atmos. Res. 92 (2), 190–211. doi:10.1016/j.atmosres.2008.09.022
Marks, F. D., Kappler, G., and DeMaria, M. (2002). Development of a Tropical Cyclone Rainfall Climatology and Persistence (RCLIPER) Model. San Diego: Preprints, 25th Conference on Hurricanes and Tropical Meteorology, 327–328.
Ren, F. M., Gleason, B., and Easterling, D. R. (2001). A Technique for Partitioning Tropical Cyclone Precipitation. J. Trop. Meteorology 17 (3), 308–313. (in Chinese).
Ren, F., Ding, C., Zhang, D.-L., Chen, D., Ren, H.-l., and Qiu, W. (2020). A Dynamical-Statistical-Analog Ensemble Forecast Model: Theory and an Application to Heavy Rainfall Forecasts of Landfalling Tropical Cyclones. Monthly Weather Rev. 148 (4), 1503–1517. doi:10.1175/mwr-d-19-0174.1
Ren, F., Qiu, W., Ding, C., Jiang, X., Wu, L., Xu, Y., et al. (2018). An Objective Track Similarity Index and its Preliminary Application to Predicting Precipitation of Landfalling Tropical Cyclones. Weather Forecast. 33, 1725–1742. doi:10.1175/waf-d-18-0007.1
Ren, F., Wang, Y., Wang, X., and Li, W. (2007). Estimating Tropical Cyclone Precipitation from Station Observations. Adv. Atmos. Sci. 24 (4), 700–711. doi:10.1007/s00376-007-0700-y
Rogers, R. (2018). Summary of Fourth International Workshop on Tropical Cyclone Landfall Processes (IWTCLP-4). Honolulu, Hawaii, December: WMO/IWTC-9, 3–7.
Wang, Y. M., Ren, F. M., Wang, X. L., Li, W. J., and Shao, Z. M. (2006). The Study on the Objective Technique for Partitioning Tropical Cyclone Precipitation in China. Meteorol. Monthly 32 (3), 6–10. (in Chinese).
Woo, W. C., Hogsett, W., Mohapatra, M., Nagata, K., Otto, P., Qi, L., et al. (2014). “Challenges and Advances Related to TC Rainfall Forecast,” in The Third International Workshop on Tropical Cyclone Landfall Processes (IWTCLP-III), Jeju, November 8-10.
Ying, M., Zhang, W., Yu, H., Lu, X., Feng, J., Fan, Y., et al. (2014). An Overview of the China Meteorological Administration Tropical Cyclone Database. J. Atmos. Oceanic Techn. 31, 287–301. doi:10.1175/jtech-d-12-00119.1
Zhong, Y., Yu, H., Teng, W., and Chen, P. (2009). A Dynamic Simulated Scheme for Tropical Cyclone Quantitative Precipitation Forecast. J. Appl. Meteorol. Sci. 20 (01), 17–27. (in Chinese).
Zhou, J. H., Shi, D. P., Fan, Y. D., and Xu, W. (2004). Risk Analysis of Tropical Cyclones in the Northwestern Pacific. J. Nat. Disasters 13 (3), 146–151. (in Chinese).
Zhu, L., Wan, Q., Shen, X., Meng, Z., Zhang, F., Weng, Y., et al. (2016). Prediction and Predictability of High-Impact Western Pacific Landfalling Tropical Cyclone Vicente (2012) through Convection-Permitting Ensemble Assimilation of Doppler Radar Velocity. Mon. Wea. Rev. 144, 21–43. doi:10.1175/mwr-d-14-00403.1
Keywords: landfalling northward-moving typhoons, accumulated precipitation, forecasts, DSAEF_LTP model, improve
Citation: Yao M, Ma Y, Jia L, Ren F, Li G, Ding C, Wang M and McBride JL (2021) DSAEF_LTP Model Experiment to Forecast the Accumulated Precipitation of Landfalling Northward-Moving Typhoons in China. Front. Earth Sci. 9:765532. doi: 10.3389/feart.2021.765532
Received: 27 August 2021; Accepted: 22 November 2021;
Published: 17 December 2021.
Edited by:
Hui Yu, China Meteorological Administration, ChinaReviewed by:
Jia Liang, Nanjing University of Information Science and Technology, ChinaChao Wang, Nanjing University of Information Science and Technology, China
Copyright © 2021 Yao, Ma, Jia, Ren, Li, Ding, Wang and McBride. This is an open-access article distributed under the terms of the Creative Commons Attribution License (CC BY). The use, distribution or reproduction in other forums is permitted, provided the original author(s) and the copyright owner(s) are credited and that the original publication in this journal is cited, in accordance with accepted academic practice. No use, distribution or reproduction is permitted which does not comply with these terms.
*Correspondence: Fumin Ren, Zm1yZW5AMTYzLmNvbQ==