- 1School of Minerals and Energy Resources Engineering, University of New South Wales, Sydney, NSW, Australia
- 2International Joint Research Laboratory of Henan Province for Underground Space Development and Disaster Prevention, Henan Polytechnic University, Jiaozuo, China
- 3School of Civil Engineering, Sun Yat-sen University, Zhuhai, China
In this paper, the potential of 3D acoustic emission (AE) tomography technique in demonstrating fracture development and delineating stress conditions was examined. Brazilian tests and uniaxial compression tests were monitored by 3D AE tomography. AE counts, AE source locations and 3D tomographic images of locally varying velocity distributions were analyzed along with stress and strain measurements. Experimental results revealed two distinct failure processes between Brazilian tests and uniaxial compression tests indicated by differences in AE counts, source locations and the temporal variation of velocity. Furthermore, the development of micro-cracks showed by the results correlated well with theoretical analysis and experimental observations. Additionally, stress patterns, failure modes and final failure planes were indicated by AE locations and velocity tomography. Three-dimensional velocity tomographic images indicated the anisotropy of samples caused by stresses as well. These results confirm the usefulness of AE tomography as a method to monitor stress induced failure and the potential of AE tomography for delineating stress conditions and predicting rock failure.
Introduction
Understanding fracture development such as crack closure, crack initiation, crack growth and crack coalescence in stressed rock allows us to have a better understanding of rock behavior. This information will eventually benefit geotechnical engineering projects. For example, the crack initiation observed in laboratory uniaxial tests provides a lower bound limit for in-situ spalling strength in hard brittle rocks around underground excavations (e.g., Diederichs, 2007; Andersson et al., 2009; Martin and Christiansson, 2009; Rojat et al., 2008) and it may also be used as a lower bound estimate for the long-term strength threshold of crystalline rocks (Damjanac and Fairhurst, 2010).
Experimentally, fracture development can in principle be detected by measuring axial and lateral strains of samples using strain gauges (e.g., Bieniawski, 1967; Martin and Chandler, 1994), using advanced optical methods such as Digital Image Correlation to capture the real-time displacement and strain fields on the surface of the rock-like specimens (i.e., Zhou et al., 2019), measuring ultrasonic velocity of samples (e.g., Jansen et al., 1993; Chaki et al., 2008) and so on. However, it can be problematic to identify crack initiation pressure from the volumetric or lateral strain method, if the specimen contains intense pre-existing cracks (Andersson et al., 2009; Nicksiar and Martin, 2012). Also, the imaging of cracks by optical methods is only limited to the surface of specimen while cracks may be through-going or on the surface (Miller, 2008). Alternatively, analyzing acoustic emission (AE) signals has shown some success in detecting failure process characterized by brittle fracturing (e.g., Eberhardt et al., 1999a; Eberhardt et al., 1999b; Lei et al., 2004; He et al., 2010; Zhang J-Z. and Zhou X-P., 2020). Acoustic emission can be used to detect and locate cracks as they occur, even within the specimen and thus have drawn increasing attention (e.g., Moradian et al., 2016; Zhang et al., 2016). Due to the advantage of detecting the interior of materials, AE techniques have been frequently used together with other techniques (e.g., Zhang et al., 2019; Zhou et al., 2019; Zhang J.-Z. and Zhou X.-P., 2020; Lu et al., 2021).
Using AE in conjunction with ultrasonic velocity measurement can be a very good tool to investigate failure process of materials under stress. Since ultrasonic probing of samples provides velocity of elastic waves and they are related to closure and opening of narrow cracks (e.g., Gueguen and Palciauskas, 1994; Paterson and Wong, 2005). However, AE monitoring cannot be undertaken continuously and simultaneously with velocity measuring as AE monitoring usually is paused when sensors are used to transmit and receive signals for velocity probing, otherwise two systems are required which would be at very high cost. One possible solution for this problem is using AE tomography. It is based on the velocity tomography, i.e., velocity reconstruction by sections with AE events as sources (Schubert, 2004; Schubert, 2006) and has been used as a non-destructive tool for damage evaluation in concrete and metals (Cheng et al., 2013; Cheng et al., 2015). As source location of AE events and travel time are not known, localization algorithm and velocity tomography algorithm were iteratively combined. This procedure is in principle known from geophysics where earthquakes are first localized and then used for tomographic imaging of the earth’s interior. However, there have been rare studies of this technique on samples in laboratory scale to the author’s knowledge. One distinguishing feature of the AE tomography technique is the locally varying 3D velocity model, compared with traditional location methods such as Geiger’s method (Dong et al., 2015). This feature not only proves valuable in obtaining reliable source locations but also makes the continuous monitoring process achievable (Koulakov et al., 2006). It also has economic benefit as no extra sensors are required for velocity measuring and the travel times are computed relatively based on reference sensors. The authors have developed an acoustic emission tomography technique, the application of which in concrete leads to successful identification of structural discontinuities (Cheng et al., 2013). The method enables quantifications of the effects of inclusions, crack size and inclination on AE hypocenters by using locally varying 3-D velocity models in locating sources and tomographic reconstruction (Cheng et al., 2015).
In summary, the accuracy of AE source locations could be improved by AE tomography as 3D velocity model are updated during loading, which is significant for predicting catastrophic rupture in brittle rocks. In addition, velocity tomographic images could be produced during loading without interrupting loading process and the tomographic images may also be used as precursor of rock failure (Mitra and Westman, 2009).
This paper focuses on crack development and failure process of cylindrical samples made from rock-like material subjected to uniaxial tensile loading (Brazilian tests) and uniaxial compressive loading using AE tomography technique. By analyzing stress-strain curves, AE parameters including AE counts and source locations as well as 3D velocity tomography, cracking stages are identified, the evolution of crack density are also demonstrated.
Materials and Methods
Experimental Procedure
The specimens were prepared with a cement-based grout for easy casting and eliminating initial heterogeneity of rock material. Specimens prepared using such materials has been widely used to observe the crack behaviour (i.e., Cao et al., 2015; Li et al., 2019) through which the usefulness of such material to model real rock has been demonstrated. The components and proportions of the grout materials are Portland cement, the as-supplied proportions are 30–60%, low quartz fly ash, <9% and additives, >60% respectively. The water to grout ratio was 0.25. A single block was prepared and specimens were cored after 28 days curing time. Three discs prepared for the Brazilian test had a mean diameter of 96.3 mm and thickness of 47 mm. The three specimens used in the uniaxial compression tests had a mean diameter and length of 67.8, 148 mm, respectively. The ends of samples for the uniaxial compression test were ground flat to reduce end effects.
Eight sensors were glued onto each test specimen. Signals are acquired from sensors with preamplifiers to condition the signals prior to being captured by the data acquisition system. The sensors (model Micro 80 and Nano 30) and preamplifiers (model 2/4/6) used in the study were supplied by Physical Acoustics Corporation (PAC). The data acquisition system is based on a National Instruments (NI) high-speed acquisition system acquisition (DAQ) device NI PXIe-6366, which has a maximum acquisition rate of two million samples per second per channel with 16-bit resolution. Signals were amplified at a set gain of 40 dB. In the Brazilian test, four sensors were glued on the front face and another four sensors were on the rear face. The distribution of sensors represented as black dots on the front face is illustrated in Figure 1A. As the events to be located are not completely surrounded, this distribution may not be an optimum design to locate events (Duca et al., 2015). However, this distribution confines ray paths in a smaller volume, i.e. the density of ray paths is larger than sensors completely surrounding the specimen, which improves the accuracy of velocity reconstruction. In the uniaxial compression test, sensors were arranged around the outer surface as indicated in Figure 1B.
Before loading commenced, velocity surveys were performed using pencil-lead break tests as sources on one surface and signals were received by sensors on the opposite surface. The test specimens were then loaded to failure using an MTS model 815 loading system under constant displacement control of 0.003 mm/s. The chosen constant loading rate falls into quasi-static loading condition (Zhang et al., 1999) and ensure enough time for AE recording. The specimen was monitored continuously during the test by an AE data acquisition system (see also Cheng et al., 2013). Signals were sampled at the rate of 2 MHz per channel. When AE signals that were amplified by 40 dB in more than six sensors exceed the threshold that is set to be 100 mV to minimize the recording of noise, it is recognized as an AE count. The events used for tomography are even less as we only selected those with high signal-noise ratios to increase accuracy of velocity redistribution. After the test, the first arrival time was determined using NI Diadem software package that has the capability to visualize and analyze large volumes of data. Signals were also zoomed in and checked manually to ensure the accuracy of first arrivals. The first arrival times were then inputted into a MATLAB code for AE tomography together with the sensor coordinates and an initial uniform velocity model where velocities were set a value of 4 km/s which is the average initial velocity rounded up to the nearest integer. The code undertook a series of iterations until the distance residuals became stable, which was generally within 30 iterations. By multiplying the P-wave velocity model and the associated time residual between each measured travel time and the calculated travel times for that given location, we calculated the distance residual, one of the sources for location errors, to be less than 3 mm in the Brazilian test and less than 10 mm in the uniaxial compression test. This distance residual as shown by Cheng (2014) is much smaller than that calculated by traditional method in which P-wave velocity model is not included. When combined with other sources for location errors, such as arrival time errors and velocity variance in the laboratory test, the source location errors amount to up to 15 mm according to pencil lead break tests. The velocity error tolerance was 22 m/s in both tests with ART tomographic reconstruction convergence value set at 0.0005 and velocity at 4 km/s. Only sources located inside the sensor configuration region were used to perform velocity tomography as the source locations inside the sensor array are considered to be more accurate than those outside (Hardy, 2003) and large source location errors can cause large velocity errors (Schubert, 2004).
Algorithm of AE Tomography Technique
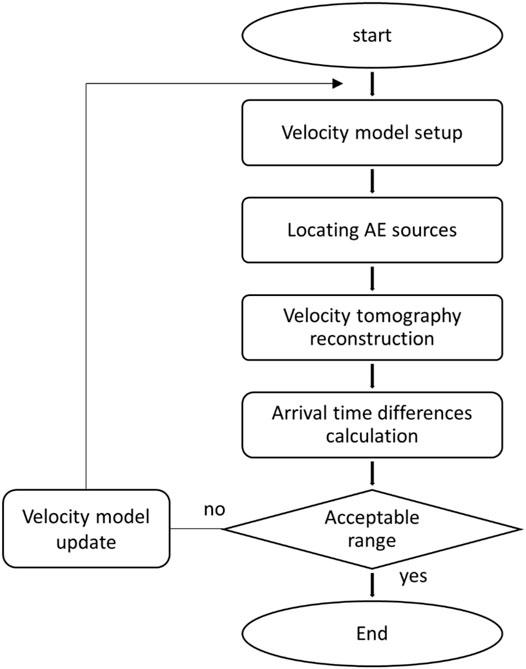
The basic concept of AE tomography technique is that AE events are used as point sources for tomographic reconstruction. In contrast to traditional tomography, both source locations and travel times are unknown. AE source location algorithm and tomography image reconstruction algorithm are iteratively combined. A computer algorithm was developed to process large amount of elastic wave data for the purpose of AE source location and tomography reconstruction with the standard procedures shown in Figure 1. More details of the algorithm can be found in the literature (Schubert, 2006; Cheng et al., 2015).
Crack Density Inverted From Velocity
The velocities of elastic waves are affected significantly by the volume, distribution and shape of cracks in the rock (Walsh, 1965a; O’Connell and Budiansky, 1974; Paterson and Wong, 2005). It is known that P wave velocity may decrease substantially in the presence of thin cracks (e.g., Hadley, 1976). In a stressed rock volume, tensile cracks open preferentially parallel to the maximum compressive stress direction (Tapponnier and Brace, 1976; Reches and Lockner, 1994). The velocity propagating in the direction perpendicular to the planes of preferred crack orientation is more significantly reduced than that parallel to the crack planes (Nur, 1971; Bonner, 1974; Lockner et al., 1977; Schubnel et al., 2003). Elastic constants and crack damage can be estimated from elastic wave velocities (Soga et al., 1978; Ayling et al., 1995; Mavko et al., 1998; Schubnel et al., 2003).
We use the model of Soga et al. (1978) to invert crack densities from the velocity data. The classic model by Soga et al. (1978) relates the velocity changes to the evolution of stress-induced micro-cracking and dilatancy. It is so efficient that only limited numbers of input (velocity) are required but useful insight into the micromechanics could still be provided. For example, Stanchits et al. (2006) showed that crack densities in triaxial compression tests on Etna basalt and Aue granite predicted by the approach of Soga et al. (1978) are very similar to the self-consistent model by O'Connell and Budiansky (1974) which also require measurement of the effective bulk modulus and Poisson ratio. Flat spheroidal cracks are assumed oriented perpendicular to three orthogonal directions (Andersson et al., 2009).). Oblique cracks may also exist but the effects on velocity can be considered vectorially divided between those of the three mutually perpendicular crack types. For an isotropic material, the crack density is related to P-wave velocities by the equation:
P0 is the P-wave velocity of the crack-free rock and the coefficients a1=1.452 and a2=0.192 are given by Soga et al. (1978). Following Stanchits et al. (2006) the unknown P0 is taken as 1.05 times the maximum registered P-wave velocity leading to P0=4.115 km/s.
Experimental Results
Brazilian Test
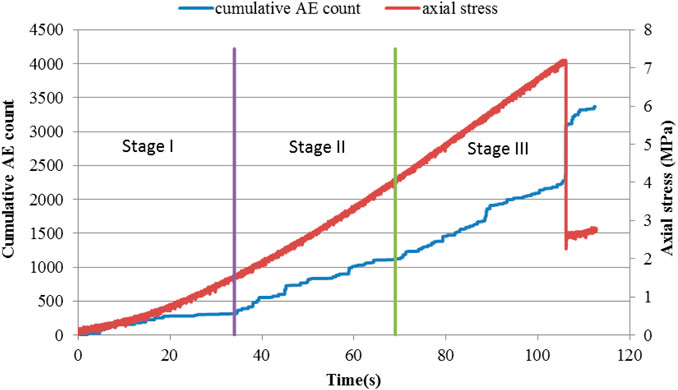
With increased load, specimens separated into two halves with the splitting surfaces sub-parallel to the loading axis as shown in Figure 2. The average strength of the test specimen was determined as 2.2 MPa and the axial stress-time curve for one disc is shown in Figure 3. Results presented are always for this disc unless otherwise stated.
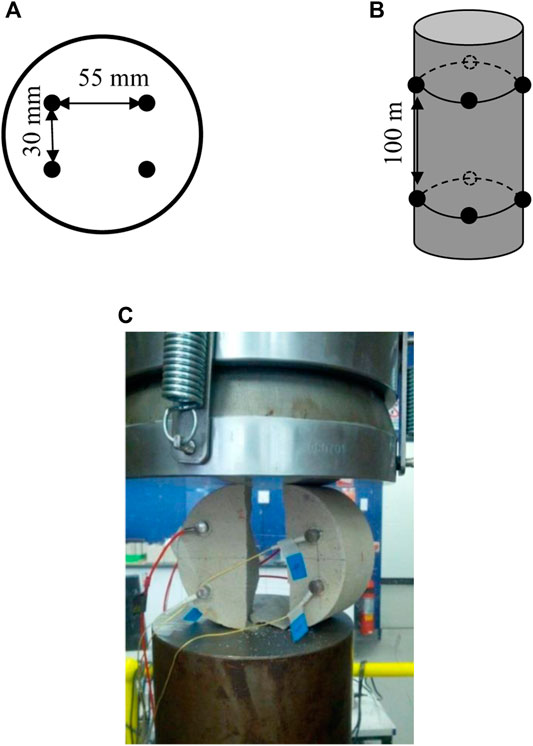
FIGURE 2. Distribution of sensors (black dots) for (A) Brazilian test and (B) uniaxial compression test. In (A) the arrangement of the sensors on the rear face is the same as the one in the front face. (C) Arrangement of a test specimen after the Brazilian test.
The entire failure process can be divided into three stages based on the stress-strain and AE count curves. The relationship between the three stages and axial stress-time is also displayed in Figure 3. AEs recorded after peak load reached were excluded in the curve. The average time interval of the three stages was around 35.3 s. In total, 36, 41 and 39 events with high signal-noise ratios were selected for Stage I, II and III, respectively, to locate AE source locations and perform velocity redistributions. Tomography was performed with specimens discretized into 90 cells with a single cell size of 11 × 8 × 10 mm3. The stress intervals and number of events and rays (i.e. number of sources multiplied by number of receivers) corresponding to the three stages are displayed in Table 1.
Initially there is a slow rise in the number of AEs until it reaches a threshold and the count remains almost constant for 20 s as shown in Figure 3. This corresponds to what is referred to as Stage I behavior. It is thought that during this period pre-existing micro-cracks are prone to be closed under compressive stresses. Stage II is marked by a steady but constant increase of count. In Stage III there is an increasing count of signals with a rapid rise just at the onset of failure. The count rate then reduces after specimen failure. AE count increases almost linear with axis strain before failure. The gradual increase indicates that the failure was formed by progressive clustering of micro-cracks (Falls 1993). To facilitate understanding of each stage, we name each stage following the work of Martin and Chandler (1994), based on the above observations.
Stage I Crack Closure
At the end of Stage I where the applied stress is around 20% of the peak stress, the AE source locations can be mapped in the specimen as red circles as shown in Figure 4 which in consistent with the trace of fracture is Figure 5. They occur predominately in a plane parallel to axis of loading as indicated by the arrows in Figure 4B. As the numerical modelling and theoretical analysis of the Brazilian test indicated (Yanagidani et al., 1978; Chen et al., 2004; Li and Wong 2013), this location coincides with the location of maximum stress concentration. The result is consistent with Griffith’s crack theory and indicates the validity of the peak stress as the tensile strength.
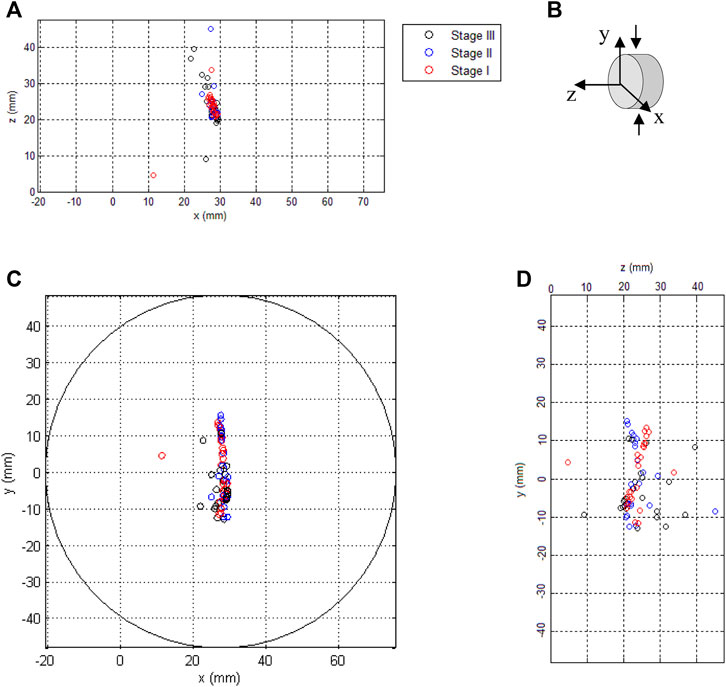
FIGURE 4. Cumulative AE source locations of the Brazilian test. (A) top view of sample, (B) sample orientation indicating direction of applied load, (C) front view of sample, and (D) side view.
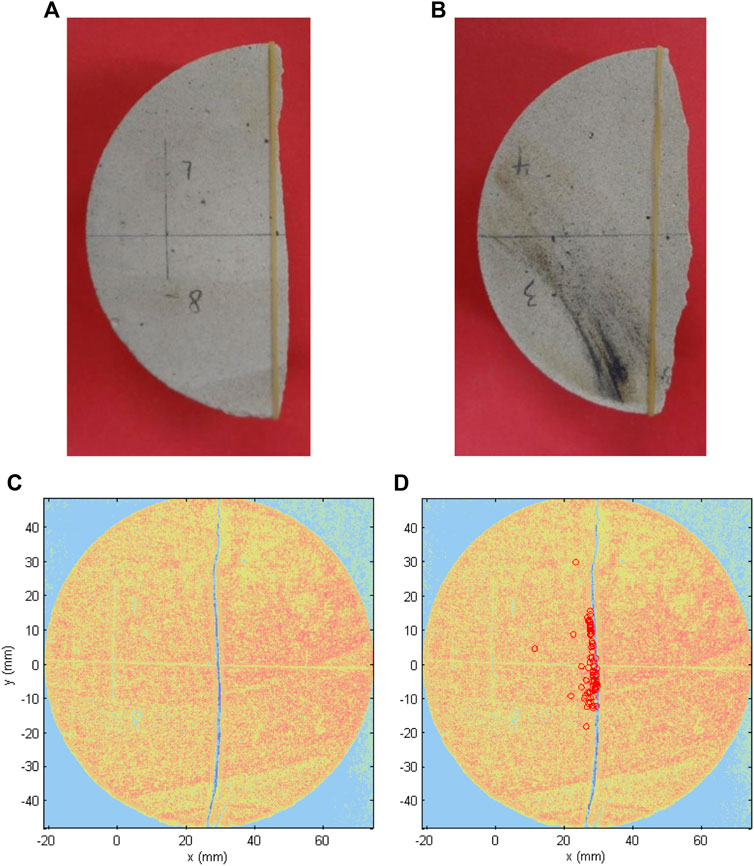
FIGURE 5. (A) Top view of the left half disc, (B) bottom view of the left half disc, (C) grey scale intensity photo of the specimen after failure (C) and (D) grey scale intensity photo of the failed specimen photo superimposed with AE source locations (red circles) . In (C) and (D) the blue color represents air and yellow-red color suggests the sample itself.
Before loading, a velocity survey was conducted on the specimen. The survey showed a difference in velocity at different directions (ranging from 0.14 km/s to 0.20 km/s with a mean velocity of 3.79 km/s). The located source concentrates mainly in the area between the two loading points, thus the ray paths along this area would also be much denser than other parts in the specimen. This means the results obtained near this area would be the most accurate. As a result, to reduce the risk of errors caused by sparse ray paths, only results near the plane between the loading points were presented.
Figure 6A–C shows the velocity tomographic images at x = 22 and 33 mm with equal distance to the center of the disc at Stage I of the Brazilian test. The transparent cylinder indicates the boundary of the specimen. From the tomograms of the two planes, it can be seen that velocity distributions are different between the surface and middle sections of the disc as the velocities are obviously higher at the surface than the middle sections. This observation agrees with the numerical modelling results obtained by several researchers (e.g., Yu et al., 2006; Zhu and Tang 2006).
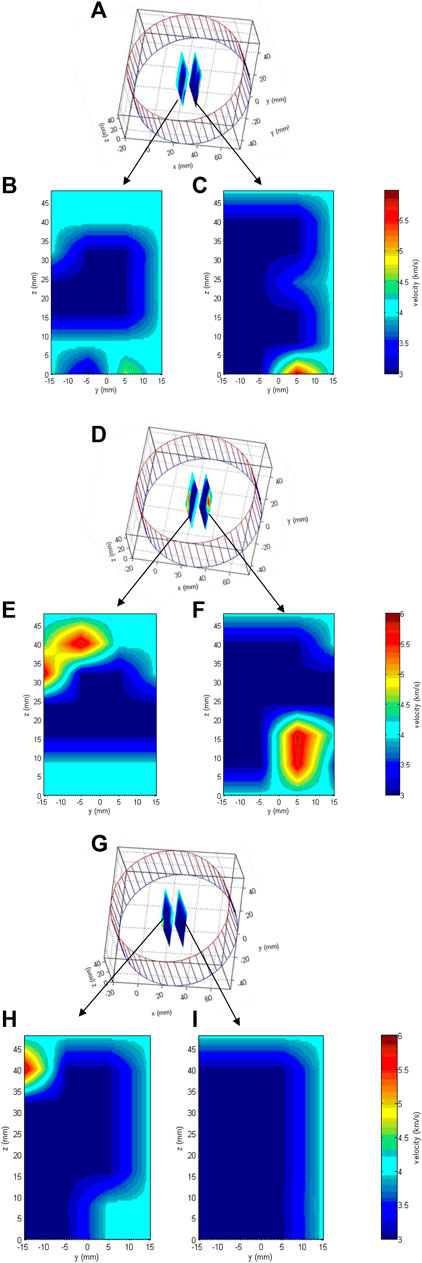
FIGURE 6. 3D illustration of velocity tomograms (A, D, G), and 2D velocity tomograms along the loading direction with the same distance to the centre at Stage I (B, C), Stage II (E, F) and Stage III (G, I) of the Brazilian test.
Stage II Crack Initiation and Crack Growth
During Stage II, AE source locations are shown as blue circles as seen in Figure 4. Micro-cracks can still be observed in the plane experiencing the maximum tensile stress, where stress increased to 56% of strength. Furthermore, cracks seem to start extending along the thickness of the disc as several AE events were seen in the area along the thickness.
The high velocity regions extend from the surfaces to the middle-sections (Figure 6D–E). The extension directions are in two different manners: at x = 22 mm, hot colors implying high velocities are observed to extend from the top while at x = 33 mm, hot colors are extending from the bottom. The velocity patterns give a good indication of the curvature of micro-cracks development.
At Stage II, the cracks parallel to the loading direction are prone to be opened while cracks perpendicular to the loading direction are prone to be closed. In this case most received AE waves propagate perpendicular or at an oblique angle to the loading direction. The low velocity regions indicate that opened cracks exist along the loading direction which would block the wave path and reduce the wave velocity (more information of defects angle effect on wave propagation can be found in Cheng et al., 2015).
Stage III Crack Coalescence and Failure
During Stage III, macro-cracks formed and grew eventually into the final failure plane and AE events were observed to scatter along the plane undergoing maximum tensile stress (Figure 4). AE events in the top view also expand to some width instead of concentrating near the diameter between the two loading points. The locations of the front view in Figure 4C also indicate that the final plane might not be vertical but has a small angle to the top plane. To validate the speculation, photos of the final failure sample were compared with source locations in the Brazilian test as displayed in Figure 5.
At the final stage, the velocity tomograms return to lighter blues (implying low velocity) with a corner of red (implying high velocity) at the top left of the tomogram at x = 22 mm as illustrated in Figure 6G–I. At this stage the brittle failure occurred. Low velocity regions indicate the final failure plane. As the tomographic images were obtained during a period of time, they may represent the progressive failure process in a period time instead of a single moment. Therefore, the red corner may occur at the start of the final stage and represent the decrease of high velocity areas because of the extension of cracks.
Top view and bottom view of the left half disc are provided in Figure 5A, B with an elastic band as reference to show the curvature and inclination of the failure plane. The inclination of the failure plane is consistent with the scattering of source locations as shown in Figure 4A. It can be seen that the final failure did not occur along a smooth, flat surface plane as the theoretical analysis predicts (e.g., Li and Wong, 2013), which is related to the anisotropy and heterogeneity of the disc (Tavallali and Vervoort 2010). A grey scale intensity photo of the specimen after failure is shown in Figure 5C. The blue color represents air and yellow-red color suggests the sample itself.
With all the source locations superimposed on the photo of the specimen as shown in Figure 5D, source locations fit well with the final failure plane pattern. However, compared with the intensive AE activities near the center of the disc, AE events near the platen contact areas are rare. One possible explanation is that there is indeed little micro-cracking near the loading points and the cracks initiating outwards from the center fast and abruptly to the two loading ends to coalesce into the final failure plane. Yet other possible reason cannot be excluded, such as that there are micro-cracks near the loading ends, but they were so small that the signals were attenuated and could not be recognized.
Summary
The plots of AE source locations show that there are micro-crack activities at each stage of the Brazilian disc test. The initiation of cracks occurred at the center of the disc. Micro-cracks then developed to the top and the bottom of the disc. The final failure formed suddenly when the micro-fractures coalesced into the two loading ends. The peak stress was validated as being the tensile strength for the micro-fracture activities implied by AE events and the theoretical analysis (e.g., Li and Wong, 2013).
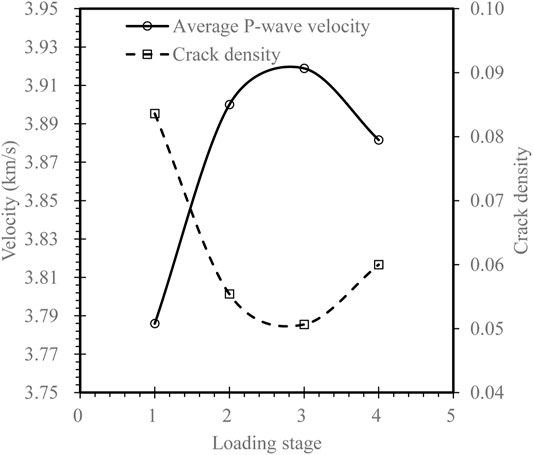
The average velocity from initial state to the final stage is associated with cracking stages (Figure 7). It can be seen that the velocity increases, and the crack density decreases at Stage I which is related to crack closure. Velocity still rises at Stage II but with a smaller increase compared to Stage I. At this stage the crack opening begins to dominate. At Stage III, the velocity decreases and crack density increase as dilatant cracks increase and grow into a macro-fracture.
Uniaxial Compression Test
The failure modes of the uniaxial compression test specimen were a mix of splitting and shearing. In Figure 8A cracks were observed to split the specimen parallel to the loading direction and in Figure 8B, shearing of the specimen could also be seen along an oblique plane and near the loading end. Notably, shearing occurred near the peak stress and the small piece shown in Figure 8B was not completely detached. It was separated after the test for the purpose of showing details of failure planes. An end cone caused by platen restraint is also visible.
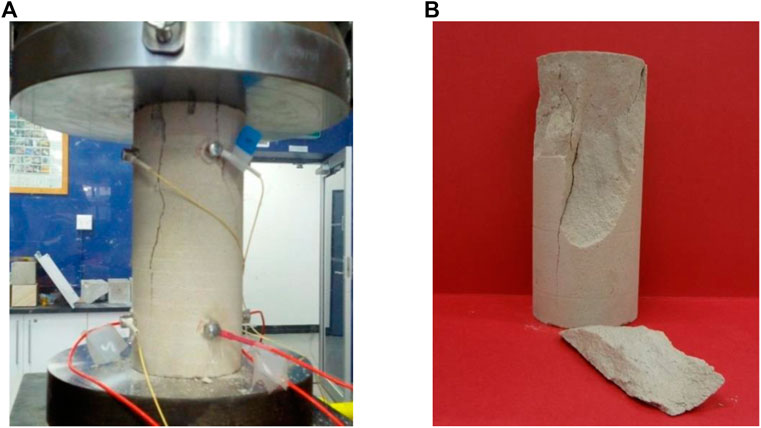
FIGURE 8. (A) Longitudinal cracks parallel to the direction of applied load. (B) Specimen after test.
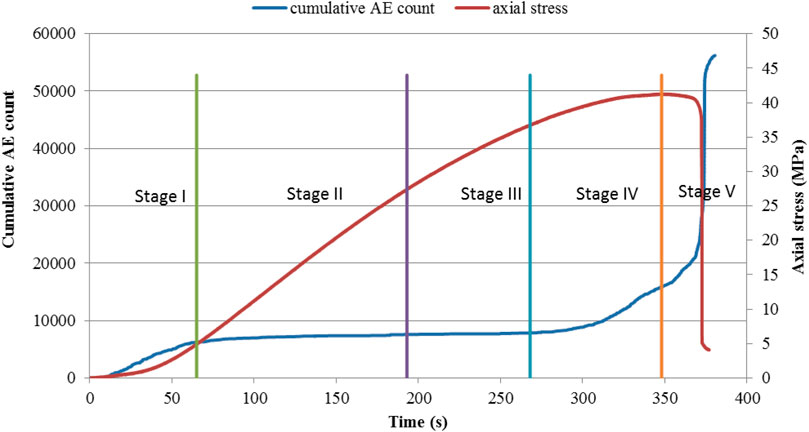
The uniaxial compression strength of the sample was measured as 41.3 MPa and the stress-time curve is shown in Figure 9. The time to failure was approximately 377 s. The stress-time curve is quite typical, with four regions. The first region is with positive curvature illustrated as Stage I. The second region is a nearly linear curve and includes Stage II and III. The third region is with negative curvature shown as Stage IV and the final curve is the post peak region represented as Stage V. The acquired signals were divided into five stages for processing and analyzing AE and tomographic images.
The average time interval of the five stages was around 75.7 s, excluding the post-failure zone. A total of 31, 39, 32, 59, and 28 events with high signal-noise ratios were selected for Stage I, II, III, IV, and V, respectively, to locate AE sources and perform velocity redistributions. Tomography was performed with specimens discretized into 810 cells with a single cell size of 9 × 9 × 10 mm3. The time and stress intervals and number of processed events and rays corresponding to the five stages are displayed in Table 2.

TABLE 2. Time, stress intervals, number of events and rays at five stages of uniaxial compression test.
For the uniaxial compression test, initially AE count increases steadily until around 70 s and then remained unchanged as load increased within the elastic range for around 240 s. As load further increases, AE count begins to increase very rapidly while the force-time curve becomes highly non-linear. The count stays low until just before failure and increases when stress rises to about 90% of the peak stress (Figure 9).
Stage I Crack Closure
At Stage I, with applied stress less than 12.1% of the peak stress, AE source locations are observed and mainly exist in the plane of x = 0 mm parallel to the loading direction. During this time, the specimen was mainly compressed, and pre-existing micro-cracks were being closed. Intensive AE source locations at the plane x = 0 mm indicate that the load distributes unevenly and concentrates in the x = 0 mm plane.
Before loading, a velocity survey was conducted on the specimen. The average velocity is determined to be 3.69 km/s and the average velocity through the plane z = 50 mm is 3.72 km/s. The anisotropy percentage is less than 11%, which is computed by dividing the average velocity by the difference between the fastest velocity and the slowest velocity. Two high velocity areas are observed both in the top and bottom of the velocity tomographic image at x = 0 mm and y = 0 mm for Stage I of the uniaxial compression test in Figure 11A. The distribution of high velocity areas agrees well with the theoretical stress analysis of Hawkes and Mellor (1970).
Stage II Stable Crack Growth
As the applied load increased to 66.7% of the peak stress, AE events are observed scattering all over the specimen as shown in Figure 10. Axial stress increases linearly during this stage. There is a concentration of AE events in the center which agrees with the critically stressed regions resulting from theoretical stress analysis (Balla 1961; Hawkes and Mellor 1970; Peng and Johnson 1972).
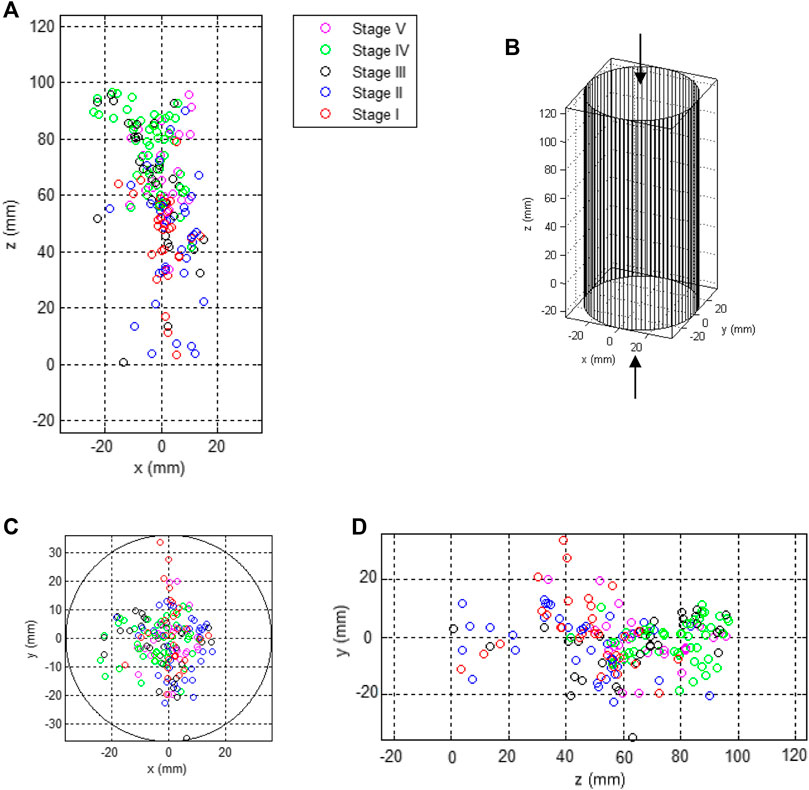
FIGURE 10. Cumulative AE source locations of the uniaxial compression test: (A) project front view of sample, (B) sample orientation indicating direction of applied load, (C) top view of sample, and (D) side view.
When the load is increased to 66.7% of the peak load, there is an obvious high velocity area at the bottom of the velocity tomographic image at x = 0 mm and y = 0 mm shown in Figure 11B. The high velocity area at the top disappeared, which may be due to that crack propagation in that area have been stable at this stage.
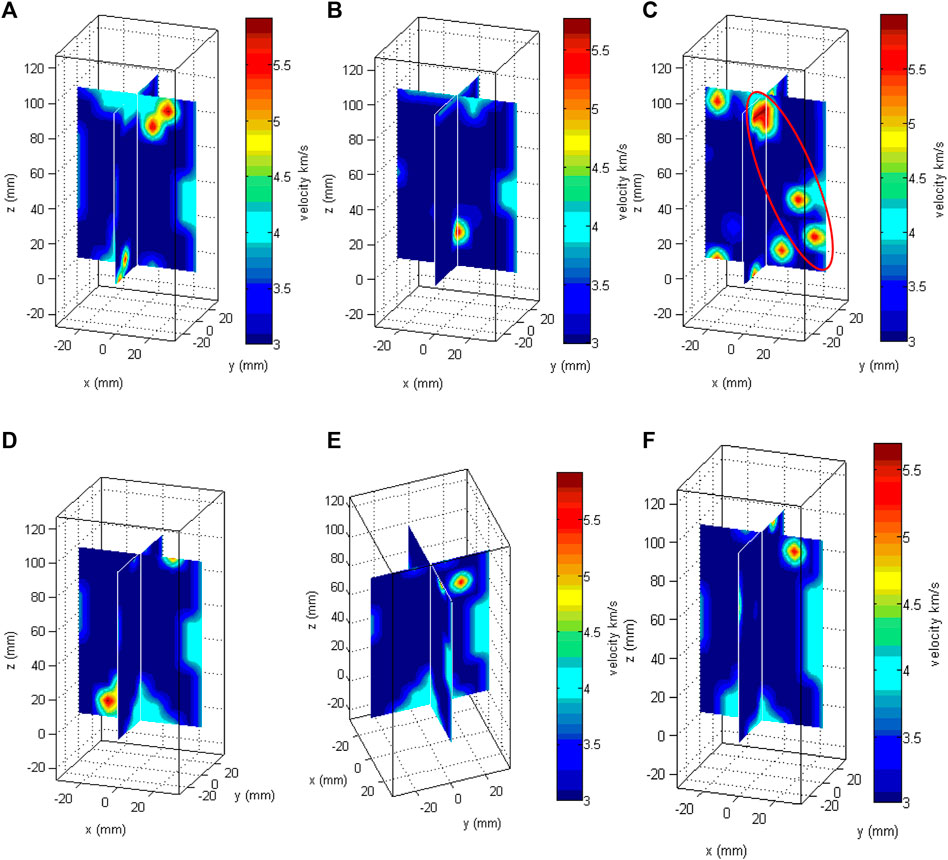
FIGURE 11. Velocity tomograms at (A) Stage I, (B) Stage II, (C) Stage III, (D) and (E) Stage IV (at two different view angles) and (f) Stage V of uniaxial compression test. The red circle in (C) indicates the distribution pattern of AE source locations.
Stage III Crack Clustering
At Stage III axial stress increased to 89.2% of the peak stress and it increase is still relatively linear with time and strain. As shown in Figure 10, AE events cluster into a plane with an oblique angle to the plane of x = 0 mm. This plane is consistent with the final single shear failure plane. It also coincides with the predicted shear failure pattern by theoretical stress analysis.
Tomograms at x = 0 mm and y = 0 mm as displayed in Figure 11C show that high velocity regions at this stage scatter in a pattern (circled by red line) similar to the AE source location distribution pattern at Stage III. Other high velocity regions, except the red circled area, are also observed at both the top and bottom of the specimen. Spalling around the circumference of the two ends was also observed during the test. They may be related to the high stress concentrations, as indicated by hot colors near the surface of the specimen.
Stage IV Crack Coalescence
At Stage IV axial stress increased to 99.9% of the peak stress. AE events are mainly distributed in the upper part of the specimen. Events located above z = 80 mm seem to occur in a region of triangle shape and they are considered strongly related to the formation of the end cone as shown in Figure 8B. As illustrated by the AE count curve in Figure 9, the AE rate begins to grow rapidly at this stage where the previously randomly distributed micro-cracks are clustering during this period.
High velocity regions are observed at both top and bottom of the tomograms as shown at two different angles in Figure 11D, E. However, as most sources are located in the upper part, the high velocity region at the bottom is probably caused by a low ray coverage. Velocities in the red circled area at Stage III (Figure 11C) decreases at Stage IV indicating that macro-fracture is forming which agrees with the AE rate time curve shown in Figure 9.
Stage V Failure
In the final stage axial stress fell to 94.5% of the peak stress after reaching the peak. The AE rate curve indicates that AE activities still exist and are quite intensive at this stage. Source locations are found mainly in the center and upper part of the specimen (see Figure 10). The final failure plane was formed and the specimen failed abruptly.
At Stage V, there are still high velocity areas at the top of the velocity tomographic images shown in Figure 11F. The surface near the high velocity area is found intact after testing, though there may be micro-cracks inside.
Because the plane z = 50 mm contains the most concentrated AE sources, shown by tomograms of the five stages, velocity tomograms of it would also be the most accurate. Thus, average velocities of this plane were studied. The average velocity from initial state (Stage 0) to the final stage is related to the stress states at different stages as described in Figure 12. It can be seen that the velocity increases slightly at Stage I and II where high velocities were distributed mostly at the top or bottom. At Stage III and IV velocity rises much quicker than previous stages. The center of the specimen was under high stress at these two stages. Velocity reduces sharply at Stage V where a macro-failure plane has formed.
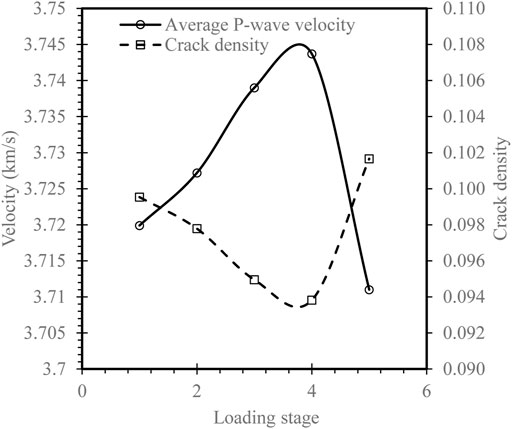
FIGURE 12. Changes of the average velocity and the inverted crack density through Plane z = 50 mm in the uniaxial compression test.
With all the source locations superimposed in the photo of the specimen (see Figure 13C), it can be seen that micro-cracks mainly occurred near the cone end and the central part of the specimen, which are the critically stressed areas as indicated in the theoretical analysis (i.e., Hawkes and Mellor, 1970). AE source locations provide a reasonable indication of the damaged zone. The failure plane in the black circled area shown in Figure 13C is the same plane circled in Figure 13B. It was mechanically removed after testing, and shows nearly none micro-crack activities.
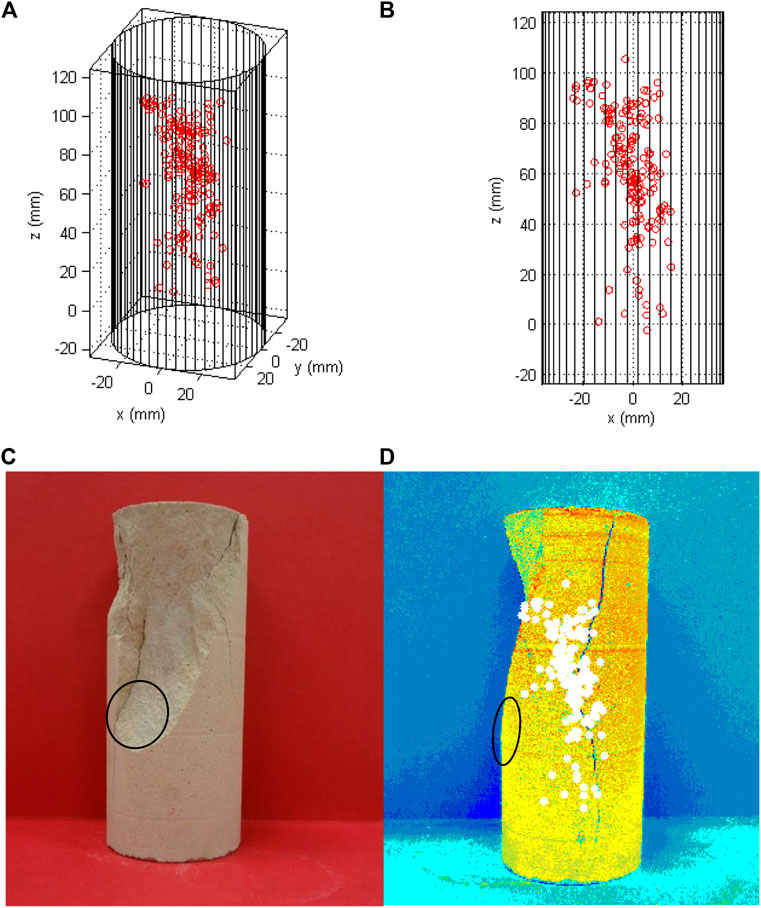
FIGURE 13. (A) and (B) 3D source locations (red circles) at two different views, (C) photo of the failed specimen, (D) failed specimen photo superimposed by AE source locations (white dots). The parts in the black circles are the same position of the sample.
Discussion and Implications
Failure Processes
We discuss in the following the failure process during the two tests. Despite only one test per each testing scenarios was presented, the statistical reliability of experimental results might be indicated by the uncertainty associated with the test measurements and calculation of AE parameters. Because specimens used in this study are made of rock-like materials which are known for producing relatively homogenous specimens (Cao et al., 2015; Li et al., 2019). As a result, assuming homogeneity of specimens on the spatial scale indicates that measurement uncertainty exceeds the standard deviations of the performed tests.
The located AE hypocenters and velocity diagrams show distinct features for uniaxial compression tests and Brazilian tests. The AE hypocenters in Figure 10 and velocity diagrams in Figure 13 for uniaxial compression tests showing several separated zones where the p-wave velocity increased significantly during loading indicates that the damage is quite diffused and that crack initiates at several locations until they coalescent to form a macroscopic fracture. Similar observations on such a diffused damage zone preceding the occurrence of brittle fracturing have also been reported in rock failure under compressive stresses (i.e., Yang et al., 2021). Different to uniaxial compression tests, the Brazilian tests exhibit a localized damage zone, as revealed in Figure 4 and Figure 6, indicating the location for tensile fracturing, which is consistent with previous analytical studies (i.e., Russell and Muir Wood, 2009) that the failure is controlled by the tensile strength and crack initiates at the largest tensile stress beneath the loading point. These observations lend support to our hypothesis that the AE sources are predominately mixed types of compressional and shear type events in uniaxial compression tests and are predominantly tensile type in Brazilian tests. Also, the observations that the velocity reduced only after failure in the uniaxial compression test, while in the Brazilian test velocity had already begun to reduce before failure occurred might also be explained by the different types of micro-cracks.
Fracture Process Zone
The observed progressive clustering of micro-cracks especially in Brazilian tests support the notion of fracture process zone (FPZ) (Labuz et al., 1987). There are investigations suggesting that the size of FPZ might be estimated with the aid of AE locations (i.e., Zhang and Wu, 1999; Zhou and Zhang, 2021). The more diffused damage zone for uniaxial compression test arising from the compressive stresses than that of Brazilian test indicates the estimation of FPZ size might be more appropriate for Brazilian test. We estimated the width of the localized damage band in Brazilian tests using results in Figure 4c at the magnitude of a few millimetres. When this width of the localized damage band is taken as the FPZ size, it is comparable with estimations reported in the literature for sandstone and granite (i.e., Chen and Labuz, 2006; Zhang et al., 2012).
Implications
AE technique has potential applications for forecasting catastrophic rupture in brittle rocks (i.e., Meng et al., 2016; Zhang J-Z. and Zhou X-P., 2020). An improved accuracy of locating AE hypocenter is thus desirable. We demonstrate that the P-wave velocity varies during either uniaxial compression test or Brazilian test because of noticeable changes in micro-crack densities during tests. Therefore, in comparison to an isotropic velocity model, a varying 3D-velocity model as used here is expected to improve the accuracy and reliability of the velocity tomographic images showing the progressive cracking without interrupting the loading process.
In the velocity tomography study, high velocity areas are observed to agree with the highly stressed regions, which is as indicated in theoretical analysis (e.g., Li and Wong, 2013). High velocity areas were also found to occur before the final failure of the specimen which may be used as a precursor of specimen failure.
Conclusion
The above conclusions in this study suggest the usefulness of AE tomography technique as a method for monitoring fracture development induced by loading. The potential of delineating stress conditions and predicting rock failure are also indicated.
1. Analysis of the AE count data showed a difference in the failure process between the Brazilian and uniaxial compression tests. The former failed by progressive clustering of micro-cracks while the latter failed following a sudden coalescence of randomly-spaced cracks.
2. The expected failure processes by AE count data were confirmed by source location analysis of AE events. In the Brazilian test, AE source locations were concentrated along a plane parallel to the loading direction. AE activities were found to initially cluster in the center and grew outwards toward the top and bottom of the specimen in the later stages of the test. This is in agreement with the theoretical analysis. In the uniaxial compression test, randomly located AE events were found in the center, along an oblique angled plane and the top of the specimen. These micro-cracks coalesce into the final failure plane near the peak stress.
3. Three-dimensional velocity tomographic images indicated the existence of stress-induced anisotropy of samples. Pre-existing micro-cracks were prone to be closed in the early stages of loading with velocity increasing. However, they may be open or continue closing (shearing) depending on whether the stress field is predominately tensile or compressive during which the velocity would also decrease or increase. The largest decrease of velocity was found to occur in the regions where AE source locations were concentrated.
4. The temporal variation of velocity also indicated different failure modes between the Brazilian and uniaxial compression test. In both tests, velocity increased in the early stages. However, in the uniaxial compression test, the velocity reduced only after failure, while in the Brazilian test velocity had already begun to reduce before failure occurred. The velocity decrease in the Brazilian test resulted probably from predominate tensile cracks opening in tensile stress field which was less dominate in the uniaxial compression test.
Data Availability Statement
The original contributions presented in the study are included in the article/Supplementary Material, further inquiries can be directed to the corresponding author.
Author Contributions
YC: Experiments; Analysis; original draft of manuscript; PH: Conceptuallization; Writing-editing; RM: Conceptuallization; Writing-editing; SW: Experiments; Analysis; HY: Analysis; Writing-editing.
Funding
This work was supported by the National Natural Science Foundation of China (51774112), and the Fundamental Research Funds for the Universities of Henan Province (NSFRF200202), China.
Conflict of Interest
The authors declare that the research was conducted in the absence of any commercial or financial relationships that could be construed as a potential conflict of interest.
Publisher’s Note
All claims expressed in this article are solely those of the authors and do not necessarily represent those of their affiliated organizations, or those of the publisher, the editors and the reviewers. Any product that may be evaluated in this article, or claim that may be made by its manufacturer, is not guaranteed or endorsed by the publisher.
Acknowledgments
The authors also acknowledge the funding for the equipment provided by UNSW School of Mining Engineering. Assistance in sample preparation and selection of data acquisition equipment was provided by K Gamage.
References
Andersson, J. C., Martin, C. D., and Stille, H. (2009). The Äspö Pillar Stability Experiment: Part II-Rock Mass Response to Coupled Excavation-Induced and thermal-induced Stresses. Int. J. Rock Mech. Mining Sci. 46, 879–895. doi:10.1016/j.ijrmms.2009.03.002
Balla, A. (1961). Stress Conditions in Triaxial Compression. T. Am. Soc. Civ. Eng. 126, 1074–1101. doi:10.1061/taceat.0008031
Bieniawski, Z. T. (1967). Mechanism of Brittle Fracture of Rock. Int. J. Rock Mech. Mining Sci. Geomechanics Abstr. 4, 395–406. doi:10.1016/0148-9062(67)90030-7
Bobet, A., and Einstein, H. H. (1998). Fracture Coalescence in Rock-type Materials under Uniaxial and Biaxial Compression. Int. J. Rock Mech. Mining Sci. 35, 863–888. doi:10.1016/s0148-9062(98)00005-9
Cao, P., Liu, T., Pu, C., and Lin, H. (2015). Crack Propagation and Coalescence of Brittle Rock-like Specimens with Pre-existing Cracks in Compression. Eng. Geology. 187, 113–121. doi:10.1016/j.enggeo.2014.12.010
Chaki, S., Takarli, M., and Agbodjan, W. P. (2008). Influence of thermal Damage on Physical Properties of a Granite Rock: Porosity, Permeability and Ultrasonic Wave Evolutions. Construction Building Mater. 22, 1456–1461. doi:10.1016/j.conbuildmat.2007.04.002
Charalampidou, E.-M., Hall, S. A., Stanchits, S., Lewis, H., and Viggiani, G. (2011). Characterization of Shear and Compaction Bands in a Porous sandstone Deformed under Triaxial Compression. Tectonophysics 503, 8–17. doi:10.1016/j.tecto.2010.09.032
Chen, L. H., and Labuz, J. F. (2006). Indentation of Rock by Wedge-Shaped Tools. Int. J. Rock Mech. Mining Sci. 43, 1023–1033. doi:10.1016/j.ijrmms.2006.03.005
Chen, S., Yue, Z. Q., and Tham, L. G. (2004). Digital Image-Based Numerical Modeling Method for Prediction of Inhomogeneous Rock Failure. Int. J. Rock Mech. Mining Sci. 41, 939–957. doi:10.1016/j.ijrmms.2004.03.002
Cheng, Y., Hagan, P. C., Mitra, R., and Wang, S. (2015). Defects Visualization Using Acoustic Emission Tomography Technique. ACI Mater. J. 112. doi:10.14359/51687769
Cheng, Y., Hagan, P., and Mitra, R. (2013). Application of Acoustic Emission Tomography Technique in Concrete. Appl. Mech. Mater. 405-408, 1115–1120. doi:10.4028/www.scientific.net/amm.405-408.1115
Damjanac, B., and Fairhurst, C. (2010). Evidence for a Long-Term Strength Threshold in Crystalline Rock. Rock Mech. Rock Eng. 43, 513–531. doi:10.1007/s00603-010-0090-9
Diederichs, M. S. (2007). The 2003 Canadian Geotechnical Colloquium: Mechanistic Interpretation and Practical Application of Damage and Spalling Prediction Criteria for Deep Tunnelling. Can. Geotech. J. 44, 1082–1116. doi:10.1139/t07-033
Dong, L.-j., Li, X.-b., Zhou, Z.-l., Chen, G.-h., and Ma, J. (2015). Three-dimensional Analytical Solution of Acoustic Emission Source Location for Cuboid Monitoring Network without Pre-measured Wave Velocity. Trans. Nonferrous Met. Soc. China 25, 293–302. doi:10.1016/s1003-6326(15)63604-4
Duca, S., Occhiena, C., and Sambuelli, L. (2015). A Procedure to Determine the Optimal Sensor Positions for Locating AE Sources in Rock Samples. Rock Mech. Rock Eng. 48, 481–493. doi:10.1007/s00603-014-0582-0
Eberhardt, E., Stead, D., and Stimpson, B. (1999a). Quantifying Progressive Pre-peak Brittle Fracture Damage in Rock during Uniaxial Compression. Int. J. Rock Mech. Mining Sci. 36, 361–380. doi:10.1016/s0148-9062(99)00019-4
Eberhardt, E., Stimpson, B., and Stead, D. (1999b). Effects of Grain Size on the Initiation and Propagation Thresholds of Stress-Induced Brittle Fractures. Rock Mech. Rock Eng. 32, 81–99. doi:10.1007/s006030050026
F, S. (2006). “Tomography Techniques for Acoustic Emission Monitoring,” in 9th European Conference on NDT, Berlin Germany.
Ge, M. (2003). Analysis of Source Location Algorithms Part II: Iterative Methods. J. Acoust. Emission 21, 29–51.
Gueguen, Y., and Palciauskas, V. (1994). Introduction to the Physics of Rocks. Princeton, N.J.: Princeton University Press.
Hardy, H. R. (2003). Acoustic Emission, Microseismic Activity: Principles, Techniques, and Geotechnical Applications Vol 1. Leiden, Netherlands: Taylor & Francis Lisse.
Hawkes, I., and Mellor, M. (1970). Uniaxial Testing in Rock Mechanics Laboratories. Eng. Geology. 4, 179–285. doi:10.1016/0013-7952(70)90034-7
He, M. C., Miao, J. L., and Feng, J. L. (2010). Rock Burst Process of limestone and its Acoustic Emission Characteristics under True-Triaxial Unloading Conditions. Int. J. Rock Mech. Mining Sci. 47, 286–298. doi:10.1016/j.ijrmms.2009.09.003
Jansen, D. P., Carlson, S. R., Young, R. P., and Hutchins, D. A. (1993). Ultrasonic imaging and acoustic emission monitoring of thermally induced microcracks in Lac du Bonnet granite. J. Geophys. Res. 98, 22231–22243. doi:10.1029/93jb01816
Koulakov, I., Sobolev, S. V., and Asch, G. (2006). P- andS-Velocity Images of the Lithosphere-Asthenosphere System in the Central Andes from Local-Source Tomographic Inversion. GeoJI 167, 106–126. doi:10.1111/j.1365-246x.2006.02949.x
Labuz, J. F., Shah, S. P., and Dowding, C. H. (1987). The Fracture Process Zone in Granite: Evidence and Effect. Int. J. Rock Mech. Mining Sci. Geomechanics Abstr. 24, 235–246. doi:10.1016/0148-9062(87)90178-1
Lei, X., Masuda, K., Nishizawa, O., Jouniaux, L., Liu, L., Ma, W., et al. (2004). Detailed Analysis of Acoustic Emission Activity during Catastrophic Fracture of Faults in Rock. J. Struct. Geology. 26, 247–258. doi:10.1016/s0191-8141(03)00095-6
Li, D., and Wong, L. N. Y. (2013). The Brazilian Disc Test for Rock Mechanics Applications: Review and New Insights. Rock Mech. Rock Eng. 46, 269–287. doi:10.1007/s00603-012-0257-7
Li, Y., Cai, W., Li, X., Zhu, W., Zhang, Q., and Wang, S. (2019). Experimental and DEM Analysis on Secondary Crack Types of Rock-like Material Containing Multiple Flaws under Uniaxial Compression. Appl. Sci. 9, 1749. doi:10.3390/app9091749
Lockner, D. (1993). The Role of Acoustic Emission in the Study of Rock Fracture. Int. J. Rock Mech. Mining Sci. Geomechanics Abstr. 30, 883–899. doi:10.1016/0148-9062(93)90041-b
Lu, G., Crandall, D., and Bunger, A. P. (2021). Observations of Breakage for Transversely Isotropic Shale Using Acoustic Emission and X-ray Computed Tomography: Effect of Bedding Orientation, Pre-existing Weaknesses, and Pore Water. Int. J. Rock Mech. Mining Sci. 139, 104650. doi:10.1016/j.ijrmms.2021.104650
Martin, C. D., and Chandler, N. A. (1994). The progressive fracture of Lac du Bonnet granite. Int. J. Rock Mech. Mining Sci. Geomechanics Abstr. 31, 643–659. doi:10.1016/0148-9062(94)90005-1
Martin, C. D., and Christiansson, R. (2009). Estimating the Potential for Spalling Around a Deep Nuclear Waste Repository in Crystalline Rock. Int. J. Rock Mech. Mining Sci. 46, 219–228. doi:10.1016/j.ijrmms.2008.03.001
Meng, F., Zhou, H., Wang, Z., Zhang, L., Kong, L., Li, S., et al. (2016). Experimental Study on the Prediction of Rockburst Hazards Induced by Dynamic Structural Plane Shearing in Deeply Buried Hard Rock Tunnels. Int. J. Rock Mech. Mining Sci. 86, 210–223. doi:10.1016/j.ijrmms.2016.04.013
Miller, J. T. (2008). Crack Coalescence in Granite. Cambridge, Massachusetts: Massachusetts Institute of Technology.
Mitra, R., and Westman, E. (2009). Investigation of the Stress Imaging in Rock Samples Using Numerical Modeling and Laboratory Tomography. Int. J. Geotechnical Eng. 3, 517–525. doi:10.3328/ijge.2009.03.04.517-525
Moradian, Z., Einstein, H. H., and Ballivy, G. (2016). Detection of Cracking Levels in Brittle Rocks by Parametric Analysis of the Acoustic Emission Signals. Rock Mech. Rock Eng. 49, 785–800. doi:10.1007/s00603-015-0775-1
Nicksiar, M., and Martin, C. D. (2012). Evaluation of Methods for Determining Crack Initiation in Compression Tests on Low-Porosity Rocks. Rock Mech. Rock Eng. 45, 607–617. doi:10.1007/s00603-012-0221-6
O'Connell, R. J., and Budiansky, B. (1974). Seismic Velocities in Dry and Saturated Cracked Solids. J. Geophys. Res. 79, 5412–5426. doi:10.1029/jb079i035p05412
Paterson, M. S., and Wong, T-f. (2005). Experimental Rock Deformation - the Brittle Field. Berlin, Germany: Springer-Verlag Berlin Heidelberg.
Peng, S., and Johnson, A. M. (1972). Crack Growth and Faulting in Cylindrical Specimens of chelmsford Granite. Int. J. Rock Mech. Mining Sci. Geomechanics Abstr. 9, 37–86. doi:10.1016/0148-9062(72)90050-2
Rojat, F., Labiouse, V., Kaiser, P. K., and Descoeudres, F. (2008). Brittle Rock Failure in the Steg Lateral Adit of the Lötschberg Base Tunnel. Rock Mech. Rock Eng. 42, 341–359. doi:10.1007/s00603-008-0015-z
Russell, A. R., and Muir Wood, D. (2009). Point Load Tests and Strength Measurements for Brittle Spheres. Int. J. Rock Mech. Mining Sci. 46, 272–280. doi:10.1016/j.ijrmms.2008.04.004
Schubert, F. (2006). “Tomography Techniques for Acoustic Emission Monitoring,” in Paper presented at the 9th European Conference on NDT, Berlin, Germany, September 25-29.
Stanchits, S., Vinciguerra, S., and Dresen, G. (2006). Ultrasonic Velocities, Acoustic Emission Characteristics and Crack Damage of basalt and Granite. Pure Appl. Geophys. 163, 975–994. doi:10.1007/s00024-006-0059-5
Tavallali, A., and Vervoort, A. (2010). Effect of Layer Orientation on the Failure of Layered sandstone under Brazilian Test Conditions. Int. J. Rock Mech. Mining Sci. 47, 313–322. doi:10.1016/j.ijrmms.2010.01.001
Wang, S., Hagan, P., and Cheng, Y. (2013). Experimental Research on the Instability Characteristics of Double-Layer Rock Plates Based on MTS-AE System. Appl. Math. Inf. Sci. 7, 339–345. doi:10.12785/amis/071l44
Wang, S., Hagan, P., Hu, B., Gamage, K., Yan, C., and Xu, D. (2014). Rock-Arch Instability Characteristics of the Sandstone Plate under Different Loading Conditions. Adv. Mater. Sci. Eng. 2014, 1–9. doi:10.1155/2014/950870
Westman, E. C. (2004). Use of Tomography for Inference of Stress Redistribution in Rock. IEEE Trans. Ind. Applicat. 40, 1413–1417. doi:10.1109/tia.2004.834133
Wong, L. N. Y., and Einstein, H. H. (2009). Crack Coalescence in Molded Gypsum and Carrara Marble: Part 1. Macroscopic Observations and Interpretation. Rock Mech. Rock Eng. 42, 475–511. doi:10.1007/s00603-008-0002-4
Yanagidani, T., Sano, O., Terada, M., and Ito, I. (1978). The Observation of Cracks Propagating in Diametrically-Compressed Rock Discs. Int. J. Rock Mech. Mining Sci. Geomechanics Abstr. 15, 225–235. doi:10.1016/0148-9062(78)90955-5
Yang, H., Renner, J., Brackmann, L., and Röttger, A. (2021). Normal Indentation of Rock Specimens with a blunt Tool: Role of Specimen Size and Indenter Geometry. Rock Mech. Rock Eng.
Yu, Y., Yin, J., and Zhong, Z. (2006). Shape Effects in the Brazilian Tensile Strength Test and a 3D FEM Correction. Int. J. Rock Mech. Mining Sci. 43, 623–627. doi:10.1016/j.ijrmms.2005.09.005
Zhang, D., and Wu, K. (1999). Fracture Process Zone of Notched three-point-bending concrete Beams. Cement Concrete Res. 29, 1887–1892. doi:10.1016/s0008-8846(99)00186-6
Zhang, H., Huang, G., Song, H., and Kang, Y. (2012). Experimental Investigation of Deformation and Failure Mechanisms in Rock under Indentation by Digital Image Correlation. Eng. Fracture Mech. 96, 667–675. doi:10.1016/j.engfracmech.2012.09.012
Zhang, J-Z., and Zhou, X-P. (2020b). Forecasting Catastrophic Rupture in Brittle Rocks Using Precursory AE Time Series. J. Geophys. Res. Solid Earth 125, e2019JB019276. doi:10.1029/2019jb019276
Zhang, J.-Z., and Zhou, X.-P. (2020a). AE Event Rate Characteristics of Flawed Granite: from Damage Stress to Ultimate Failure. GeoJI 222, 795–814. doi:10.1093/gji/ggaa207
Zhang, J., Peng, W., Liu, F., Zhang, H., and Li, Z. (2015). Monitoring Rock Failure Processes Using the Hilbert-Huang Transform of Acoustic Emission Signals. Rock Mech. Rock Eng. 49, 427–442. doi:10.1007/s00603-015-0755-5
Zhang, J., Peng, W., Liu, F., Zhang, H., and Li, Z. (2016). Monitoring Rock Failure Processes Using the Hilbert-Huang Transform of Acoustic Emission Signals. Rock Mech. Rock Eng. 49, 427–442. doi:10.1007/s00603-015-0755-5
Zhang, J. Z., Zhou, X. P., Zhou, L. S., and Berto, F. (2019). Progressive Failure of Brittle Rocks with Non‐isometric Flaws: Insights from Acousto‐optic‐mechanical (AOM) Data. Fatigue Fract Eng. Mater. Struct. 42, 1787–1802. doi:10.1111/ffe.13019
Zhang, Z. X., Kou, S. Q., Yu, J., Yu, Y., Jiang, L. G., and Lindqvist, P.-A. (1999). Effects of Loading Rate on Rock Fracture. Int. J. Rock Mech. Mining Sci. 36, 597–611. doi:10.1016/s0148-9062(99)00031-5
Zhou, X.-P., and Zhang, J.-Z. (2021). Damage Progression and Acoustic Emission in Brittle Failure of Granite and sandstone. Int. J. Rock Mech. Mining Sci. 143, 104789. doi:10.1016/j.ijrmms.2021.104789
Zhou, X.-P., Zhang, J.-Z., Qian, Q.-H., and Niu, Y. (2019). Experimental Investigation of Progressive Cracking Processes in Granite under Uniaxial Loading Using Digital Imaging and AE Techniques. J. Struct. Geology. 126, 129–145. doi:10.1016/j.jsg.2019.06.003
Keywords: stress imaging, Brazilian test, uniaxial compression test, tomograph, acoustic emission (AE)
Citation: Cheng Y, Hagan P, Mitra R, Wang S and Yang H-W (2021) Experimental Investigation of Progressive Failure Processes Using 3D Acoustic Emission Tomography. Front. Earth Sci. 9:765030. doi: 10.3389/feart.2021.765030
Received: 26 August 2021; Accepted: 03 November 2021;
Published: 29 November 2021.
Edited by:
Yinlin Ji, GFZ Helmholtz Centre Potsdam, GermanyReviewed by:
Xiaoping Zhou, Chongqing University, ChinaTianyang Guo, Hong Kong Polytechnic University, Hong Kong, SAR China
Copyright © 2021 Cheng, Hagan, Mitra, Wang and Yang. This is an open-access article distributed under the terms of the Creative Commons Attribution License (CC BY). The use, distribution or reproduction in other forums is permitted, provided the original author(s) and the copyright owner(s) are credited and that the original publication in this journal is cited, in accordance with accepted academic practice. No use, distribution or reproduction is permitted which does not comply with these terms.
*Correspondence: Hong-Wei Yang, eWFuZ2h3OUBtYWlsLnN5c3UuZWR1LmNu
†Present address: Yan Cheng, Institute for Geology, Mineralogy, and Geophysics, Ruhr-University Bochum, Germany; Rudrajit Mitra, Institute for Advanced Mining Techonologies, RWTH Aachen University, Germany
 Yan Cheng1†
 Rudrajit Mitra
 Hong-Wei Yang