- School of Resources and Geoscience, China University of Mining and Technology, Xuzhou, China
The accurate characterization of coal pore structure is significant for coalbed methane (CBM) development. The splicing of practical pore ranges of multiple test methods can reflect pore structure characteristics. The pore\fracture compressibility is the main parameter affecting the porosity and permeability of coal reservoirs. The difference in compressibility of different coal rank reservoirs and pore\fracture structures with changing stress have not been systematically found. The pore structure characteristics of different rank coal samples were characterized using the optimal pore ranges of high-pressure mercury intrusion (HPMI), low-temperature liquid nitrogen adsorption (LT-N2A), low-pressure carbon dioxide adsorption (LP-CDA), and nuclear magnetic resonance (NMR) based on six groups of different rank coal samples. The compressibility of coal matrix and pore\fracture were studied using HPMI data and NMR T2 spectrum under effective stress. The results show that the more accurate full pore characterization results can be obtained by selecting the optimal pore range measured by HPMI, LT-N2A, and LP-CDA and comparing it with the NMR pore results. The matrix compressibility of different rank coal samples shows that low-rank coal > high-rank coal > medium-rank coal. When the effective stress is less than 6 MPa, the microfractures are compressed rapidly, and the compressibility decreases slowly when the effective stress is more than 6 MPa. Thus, the compressibility of the adsorption pore is weak. Nevertheless, the adsorption pore has the most significant compression space because of the largest proportion in different pore structures. The variation trend of matrix compressibility and pore\fracture compressibility is consistent with the increase of coal rank. The compressibility decreases with the rise of reservoir heterogeneity and mechanical strength. The development of pore volume promotes compressibility. The research results have guiding significance for the exploration and development of CBM in different coal rank reservoirs.
Introduction
Coal is a complex porous medium. As a coalbed methane (CBM) accumulation site and migration channel, pore\fracture is very important to the adsorption, desorption, diffusion, and seepage of CBM (Ross et al., 2009; Moore et al., 2012; Hao et al., 2013; Yang et al., 2017; Wang et al., 2020; Li et al., 2021). The pore structure of coal determines the development technology of CBM and also affects production. Therefore, accurate characterization of the pore structure of coal reservoirs is of great significance for CBM development. There are many methods to characterize the pore structure of coal quantitatively. However, there are some limitations because various test methods have different advantageous pore ranges (Clarkson et al., 2013; Zhou et al., 2017). The high-pressure mercury intrusion (HPMI) test is widely used in pore structure analysis, but it has limitations in characterizing the full pore size. When the mercury intrusion pressure is higher than 10 MPa (the pore size is approximately 100 nm), the compressibility significantly impacts the test data (Friesen et al., 1988; Li et al., 2015). Therefore, it is necessary to correct the compressibility of HPMI data to improve the reliability and applicability of HPMI data. Furthermore, the study of coal matrix compressibility also has the practical engineering value for evaluating the deformation capacity of coal reservoirs. Therefore, it is necessary to analyze the principle and correct the test results of pore characterization methods for different coal rank reservoirs.
Pore\fracture compressibility is the main parameter affecting the porosity and permeability of coal reservoirs. It is applied to the study of the permeability prediction model and involves optimizing CBM drainage and production and selecting stimulation measures (Yuan et al., 2018; Li et al., 2019; Zhang et al., 2019; Wang et al., 2020). During the production of CBM, the effective stress increases gradually, and the pore\fracture is continuously compressed, resulting in the continuous reduction of seepage space, which affects the permeability (Tao et al., 2010; Wang et al., 2021). Therefore, the study on the compressibility of pore\fracture with stress plays a guiding role in efficient CBM development (Tan et al., 2018). At present, HPMI and nuclear magnetic resonance (NMR) are mainly used to study the compressibility of coal (Li et al., 2013; Shao et al., 2018; Chen et al., 2019; Evweton et al., 2021). Moreover, NMR has the characteristics of fast, non-destructive, and can apply in-situ stress, which can approximately simulate the changes of pore\fracture under effective stress. Li et al. (2013) proposed a method to characterize the pore stress sensitivity of coal by NMR. It is concluded that seepage pores control the stress sensitivity of low-rank coals. In contrast, adsorption pores maintain the middle and high-rank coals by describing the pore system of different rank coals under different confining pressures. Meanwhile, Hou et al. (2019) concluded that the compressibility of movable fluid pores is more excellent than that of irreducible fluid pores. The total compressibility is affected by both types of pores. Li et al. (2019) proposed an improved permeability model considering coal matrix deformation and key pore compressibility. In addition, the compressibility of the pore\fracture system is greatly affected by heterogeneity, and the permeability characterized by NMR has an apparent negative correlation with fractal dimension. The occurrence law of minerals (mineral content, mineral morphology, and mineral arrangement) has an evident impact on compressibility, and the coal reservoir with high mineral content has less compressibility (Chen et al., 2019; Cheng et al., 2020). Previous studies mainly focused on the single coal rank, and there was a lack of comparative research of different coal ranks. There are differences in material composition, pore\fracture development degree, and mechanical characteristics of varying coal rank reservoirs, which will affect the compressibility of coal reservoirs. In addition, the pore\fracture of coal reservoirs shows other characteristics under different effective stress. Previous studies used HPMI and NMR experiments to characterize the compressibility of pore\fracture and rarely analyzed the influencing factors of compressibility.
Firstly, we selected six different rank coal samples in Shanxi Province to characterize the full pore by HPMI, low-temperature liquid nitrogen adsorption (LT-N2A), and low-pressure carbon dioxide adsorption (LP-CDA). Secondly, the compressibility of coal matrix and different types of pore\fracture are analyzed by HPMI and NMR. Finally, the influencing factors of compressibility were analyzed combined with the mechanical test of microhardness.
Experiments and Methods
Samples
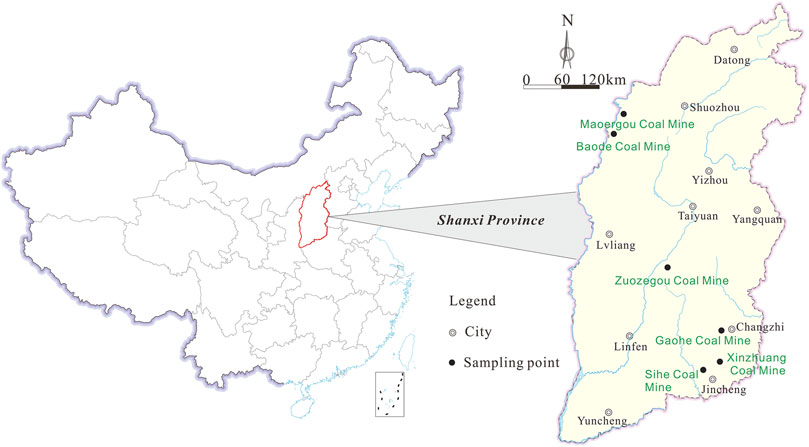
Shanxi Province is the enrichment area of coal and CBM in China, and there are different rank coals. The compressibility of different rank coal samples was studied by collecting six different rank coal samples (Ro,max between 0.54 and 3.18%) in Shanxi Province. The samples were from the fresh working faces of Maoergou coal mine (MEG), Baode coal mine (BD), Zuozegou coal mine (ZZG), Xinzhuang coal mine (XZ), Gaohe coal mine (GH), and Sihe coal mine (SH) (Figure 1). The samples are sealed by plastic wrap to the laboratory for relevant experiments after being collected. The maximum reflectance (Ro,max) of vitrinite under oil immersion, coal rock composition, and industrial analysis are measured according to ISO (International Organization for Standardization) 17246-2005 and ISO 7404-5-2009. The macerals contain vitrinite and a small amount of inertinite primarily (Table 1).
Experimental Process
There are cylindrical samples of 25 × 50 mm used for the NMR experiment, 3 mm broken sample around the cylinder is used for the HPMI experiment, and 40–60 mesh powder samples are prepared for LT-N2A and LP-CDA experiment.
The real-time response characteristics of NMR are used to study the compressibility of coal and rock under different stress. NMR will be produced when the hydrogen nucleus is exposed to an oscillating magnetic field (Menzel et al., 2000). The relationship between relaxation distribution and relaxation time can detect the number of hydrogen atoms in water. The number of hydrogen atoms presenting in water can be seen by transverse relaxation (T2) time (Yao et al., 2014; Kang et al., 2019). According to the principle of NMR measurement, the transverse relaxation (T2) of water in the magnetic field gradient is affected by three different relaxation mechanisms: free relaxation (T2B), surface relaxation (T2S), and diffusion relaxation (T2D), which can be expressed as follows:
When the magnetic uniformity is as low as 30 ppm, the relaxation caused by diffusion is negligible. This means that the value of 1 / T2D is small enough (Yao et al., 2014). So we can get:
where ρ is the surface relaxation rate, m/s; S is reservoir pore surface area, m2; V is reservoir pore volume, m3. Thus, T2 values greater than 100 ms represent free water, 2.5–100 ms represent capillary water, and less than 2.5 ms represent adsorbed water (Yao et al., 2010). Generally, the adsorbed water is mainly stored in the adsorption pore with less than 100 nm. In comparison, the capillary water is stored in the seepage pore with a pore size of 100–10000nm, while the free water is stored in the fracture with a pore size greater than 10000 nm and the gap between the sample and the core holder.
MacroMR12-150H-I large aperture nuclear magnetic analysis and imaging system produced by Suzhou Newmag company were used in the experiment. Before the investigation, the sample was dried at 60°C for 300 min to remove the residual moisture, and then the sample was placed in the core holder to measure the NMR signal to remove the noise caused by the dried sample. Then, each sample was saturated with water under 20 MPa pressure in a vacuum for 48 h. Next, a saturated sample was placed in the core holder to measure the NMR signal under the confining pressure of 0 MPa. Record the T2 spectrum signal when the signal is stable and use it as the initial base of the saturated core sample. Next, we applied a confining pressure of 3 Mpa and kept it for 2 h until the signal did not change, then applied to confine pressures of 6, 9, 12, and 15 MPa, and recorded the signal value of each pressure point.
The HPMI experiment was conducted on the autopore IV 9500 mercury intrusion instrument in the Guizhou coalfield geology bureau laboratory. After drying the sample with 10 g and for 3 mm crushed for 24 h at 60°C, the water in the samples was removed, and then the experimental test was carried out. The mercury intrusion pressure is 60,000 psi, and the pore size distribution above 5 nm can be measured based on the Washburn equation.
The LT-N2A experimental instrument is Tristar II 3020 specific surface and porosity analyzer. After drying and degassing 2 g sample with 40–60 mesh, the N2 adsorption capacity at different relative pressures (0.001–0.998) was measured at 77 K. The N2 adsorption branch data were interpreted based on the multipoint Brunauer Emmett Teller (BET) and Barrett Joyner Halenda (BJH) models, and the specific surface area, pore volume, and pore size distribution parameters were obtained.
An autosorb IQ-MP automatic micropore analyzer carried out an LP-CDA experiment. After drying and degassing 2 g sample with 40–60 mesh, LP-CDA with relative pressure between 0.0001 and 0.03 were obtained at 273 K. The LP-CDA data were interpreted by nonlocal density function theory (DFT), and the pore size distribution was obtained.
The microhardness is measured by using the Chinese coal standard MT-246-1991. First, the prepared standard sample of coal brick is fixed on the carrier. After flattening and compaction, a thin layer of white paraffin is evenly coated on the experimental surface. Next, the 40 measuring points evenly distributed on the smooth sheet of coal brick are pressurized and depressurized under the test force of 0.98 N. The microhardness of each measuring point was calculated based on the average of the two diagonal lengths of the measured indentation. Arithmetic means the value of the practical point measurement results is the microhardness value of the sample.
Data Processing
The pore division adopts the decimal division standard of (Hodot, 1966), which is widely used in the aperture classification of coal reservoirs. This aperture division method can describe the aperture splicing results in the later paper and can be compared with NMR (Yao et al., 2014).
The compressibility coefficients of coal matrix and different types of pore\fracture are calculated by using HPMI and NMR data according to the definition of compressibility coefficient and previous research methods (Li et al., 2013; Shao et al., 2018).
Matrix Compressibility
Ignoring the compressibility of mercury, the compressibility coefficient of the coal matrix is defined as:
where Cm is the compression coefficient of coal matrix, m2/N; Vm is the volume of coal matrix measured by helium, cm3/g; dVm/dP is the volume change of coal matrix under the condition of unit pressure drop, cm3/(g·MPa). Thus, during mercury intrusion, the relation between mercury intrusion volume (ΔVobs), pore volume (ΔVP), and compressed volume of coal matrix (ΔVP) can be described as:
The coal matrix’s compression effect is becoming more evident with the increase of mercury intrusion pressure during the HPMI experiment, especially when the pressure is more significant than 10 MPa. Furthermore, a linear relationship exists between the cumulative mercury intrusion volume and the mercury intrusion pressure, resulting in ΔVobs/ΔP tends to a constant α. Therefore, ΔVm/ΔP can be expressed as:
where
Compressibility of pore\fracture
The HPMI experiment reflects the compression characteristics of the coal matrix under different mercury intrusion pressures. NMR can characterize the compression characteristics of different pore\fracture under different confining pressures. The ratio of T2 spectral area under different confining pressures and initial T2 spectral area (0 MPa) is used to reflect the variation law of pore\fracture to quantitatively characterize the relationship between different pore compression characteristics and confining pressure:
where Aij is the area ratio of T2 spectrum, i = 1, 2 and 3 represent adsorption pore, seepage pore, and microfracture; j = 1, 2, 3, 4, 5, and 6 represent confining pressures of 0, 3, 6, 9, 12 and 15 MPa respectively; S0 refers to the T2 spectral area when the confining pressure is 0 MPa, and Si refers to the T2 spectral area of T2 spectrum when the confining pressure increases to 3, 6, 9, 12 and 15 MPa respectively. The smaller Aij indicates that the larger the compression space of pore\fracture.
The change of T2 spectral area can be used to quantitatively characterize the compressibility of each pore range under stress (Li et al., 2013). The calculation formula of the compressibility coefficient can be described as follows:
where Cpc is the average pore compression coefficient, MPa−1; Vp is the pore volume when the effective stress is P, cm3/g; Vp0 is the pore volume when the effective stress is 0, cm3/g; Si/S0 is the dimensionless T2 spectral area ratio, and Pc0 is the stress under initial conditions.
Results and Discussion
The compressibility of the coal reservoir is an important parameter that affects the diffusion and seepage capacity change in CBM production. This work analyzes the pore structure characteristics and full pore characterization results of different rank coals. HPMI and low field NMR are used to study the compressibility of different coal steps and different pores and fractures. The factors affecting the compressibility of the coal reservoir are discussed.
Characteristics of Pore in Different Coal Rank Reservoirs
Characterization of Pore Structure by the Single Test Method
HPMI data show that the mercury intrusion volume of MEG samples with the lowest coal rank is significantly greater than that of the other five samples with higher coal rank (Figure 2A), showing that the pores of low-rank coal (Ro,max<0.65%) are more developed and the pore volume is more significant. The mercury removal efficiency of MEG samples is lower, and the lag ring is larger (Figure 2A), indicating that the low-rank coal samples develop more parallel open pores and have good connectivity. Micropore and transition pore are more developed, and the content of mesopores and macropores is minimal from the pore distribution. Especially for high-rank coal (Ro,max>2.0%), such as XZ, GH, and SH samples, macropores are very underdeveloped. All kinds of pores of low-rank coal samples, such as MEG, are relatively developed and have uniform pore distribution (Figure 2B). It reveals that the mercury removal efficiency of low-rank coal is lower, while that of medium (0.65%<Ro,max<2.0%) and high-rank coal is higher.
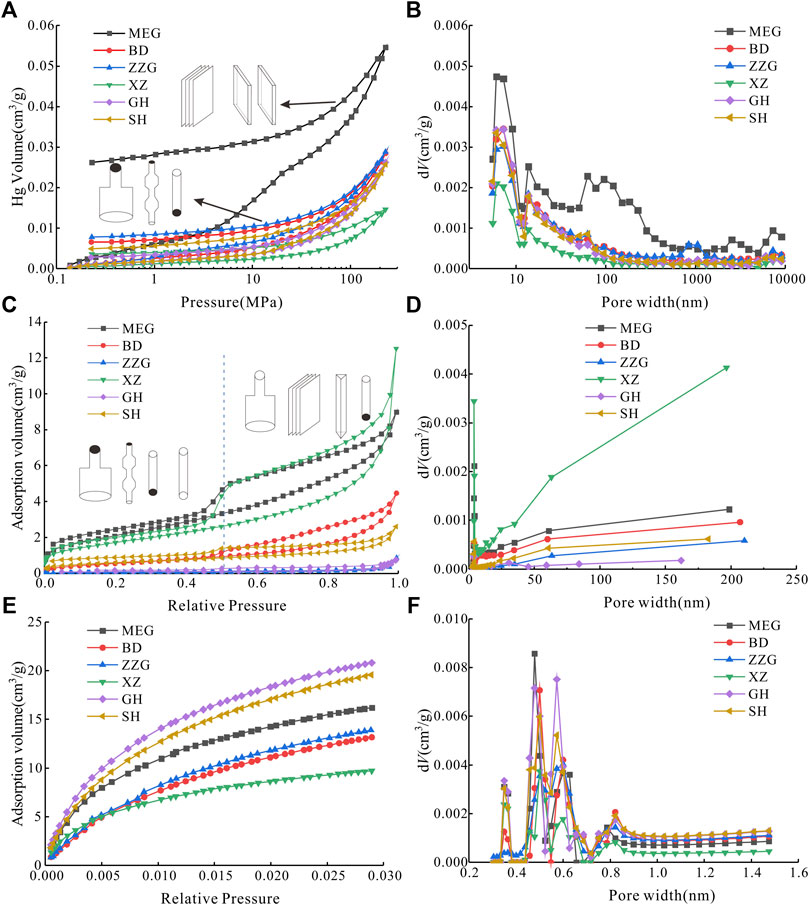
FIGURE 2. Pore size distribution characteristics of different test methods (A). Characteristics of mercury Intrusion-Extrusion curve; (B). Pore distribution characteristics of HPMI; (C). Adsorption-desorption curve characteristics of LT-N2A; (D). Pore distribution characteristics of LT-N2A; (E). Isothermal adsorption curve characteristics of LP-CDA; (F). Pore distribution characteristics of LP-CDA).
According to the LT-N2A adsorption-desorption curve characteristics, the six coal samples are divided into two types. Type Ⅰ: MEG, ZZG, and XZ samples. When the relative pressure is low (P/P0 < 0.5), the adsorption-desorption curves coincide with no adsorption loop (Figure 2C). In the small pore range (<4.5 nm), the semi-open pore is the central part. There is a noticeable lag ring with the ink bottle-shaped pores and cylindrical pores when high relative pressure (P/P0 > 0.5). Type Ⅱ: BD, GH, and SH samples. The adsorption-desorption curves are parallel but do not overlap when the relative pressure is low. There are mainly semi-open pores closed at one end and cylindrical pores open at both ends. Adsorption loop appears with higher relative pressure. But the pore of Type Ⅱ is more relaxed than Type Ⅰ. The LT-N2A experiment can characterize the information of part micropores and transition pores. Among them, the pores of 3–5 nm are more developed (Figure 2D).
The carbon dioxide adsorption capacity of different rank coal samples increases with the increase of relative pressure. The adsorption rate in the low-pressure range (P/P0 < 0.01) is high, and that in the medium high-pressure range (P/P0 > 0.01) is decreasing. Therefore, the maximum adsorption capacity of different rank coals is high-rank coal > low-rank coal > medium rank coal (Figure 2E). The pore size distribution of different samples is similar. However, the pore volume is more developed with less than 0.8 nm (Figure 2F).
Coal Matrix Compressibility
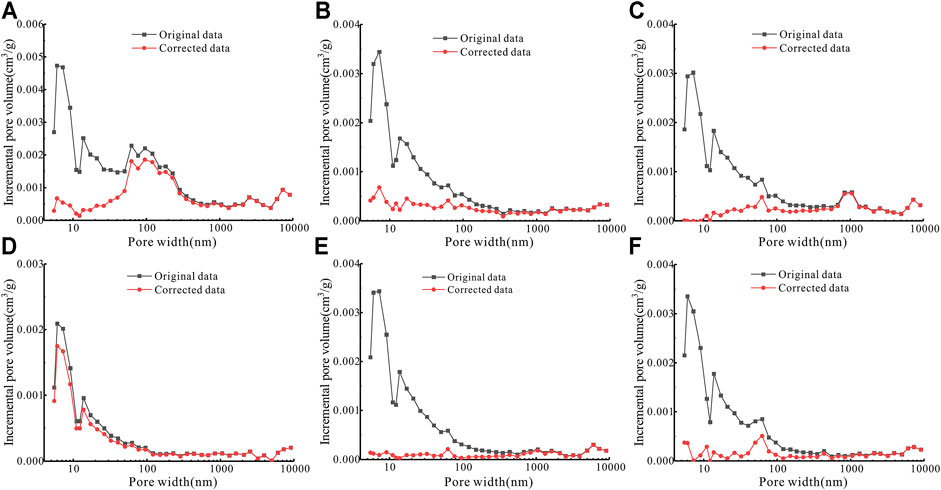
HPMI can not reflect the actual pore structure characteristics of coal due to the compression effect of coal matrix in the high-pressure range (>10 MPa) when characterizing the pore structure. Therefore, it will result in significant errors in pore structure analysis (Friesen et al., 1988; Li et al., 1999; Cai et al., 2013; Guo et al., 2014). Therefore, it is necessary to correct HPMI data. The compression effect of the coal matrix has little effect on macropores (1,000–10,000 nm) and mesoporous (100–1,000 nm); the pore distribution curve before correction almost coincides with that after correction (Figure 3). On the other hand, the matrix compression effect has a significant impact on the transition pores (10–100 nm) and micropores (<10 nm). There is an apparent separation between the pore distribution curve before correction and the pore distribution curve after correction. Therefore, the compression effect of the coal matrix should be considered when the HPMI experiment is used to characterize pore size distribution, especially pore size is less than 100 nm.
Full Pore Characterization
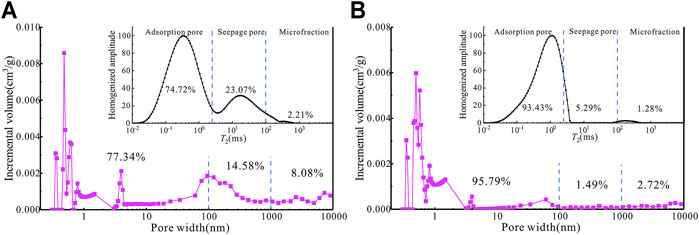
According to the different pore characterization range and accuracy with the three test methods, each method’s optimal pore range is adopted to characterize different coal samples’ pore characteristics comprehensively. The pore structure characteristics of micropores are characterized by LP-CDA data (<2 nm) and part LT-N2A data (2–10 nm); the pore structure characteristics of transition pores are characterized by part LT-N2A data (10–100 nm) and corrected HPMI data describe the pore structure characteristics of mesopores and macropores. Adsorption pores (micropores and transition pores) are the most developed for the six samples. However, there are significant differences between low-rank coal and medium-high rank coal. The proportion of adsorption pores of low-rank coal is 77.29%, and that of medium-high rank coal is 90.38–96.07%, with an average of 93.03%. The seepage space is more developed because the compaction degree of low-rank coal is low, and the coal structure is loose.
Furthermore, with the increase of coalification degree, cyclo condensation and thermal cracking lead to the shedding of oxygen-containing functional groups and hydrogen-rich side chains, more orderly arrangement of aromatic rings, and the formation of a series of intermolecular pores, which makes the adsorption space of medium and high-rank coals more developed (Liu et al., 2016). Therefore, the pore size distribution characterized by HPMI-LTN2A-LPCDA agrees with the corresponding pore size distribution of NMR, especially in the distribution frequency of adsorption pore range (Figure 4). However, there are still differences in comparing the two methods due to different test methods’ size effect and principle. Furthermore, different pore size distributions will affect the compressibility of the coal reservoir, further analyzed below.
Compressibility of Matrix and pore\fracture
HPMI method and NMR test with stress are the main methods to study the compressibility of the coal. In this work, the coal matrix compressibility coefficient (Cm) is calculated using the HPMI data, and the compressibility coefficient (Cp) of different types of pore\fracture is calculated according to the T2 spectrum under different confining pressures. The applicability of the test results is compared and analyzed.
Compressibility of Coal Matrix Based on High-Pressure Mercury Intrusion
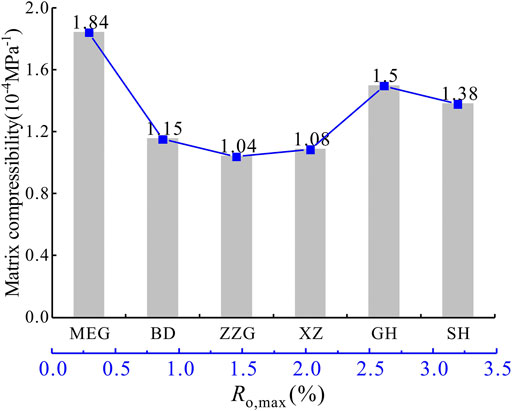
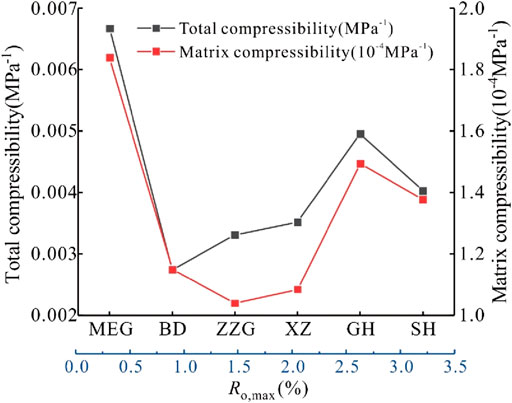
The matrix compressibility (Cm) of coal samples of different coal rank ranges from (1.04–1.84) × 10−4 MPa−1 (Figure 5), and low-rank coal > high-rank coal > medium rank coal. Compared with medium-high rank coal, low-rank coal has a loose structure, low compactness, and a significant matrix compression effect. Nelson et al. (1980) attributed the relationship of coal matrix compressibility and coal rank to the change of micropore volume. Cai et al. (2018) considered a negative correlation between coal matrix compressibility and coal rank. Shao et al. (2018) considered that the compressibility of the coal matrix changed in stages with the increasing coal rank. The compressibility coefficient of the coal matrix shows first decreased, increased, and then decreased with the increase of coal rank. The turning point was Ro,max = 1.3%, and Ro,max = 2.5%, mainly affected by the second and third coalification jump. The calculation results were consistent with the previous research results, which illustrated the feasibility of the calculation method and results.
Compressibility of pore\fracture Based on Nuclear Magnetic Resonance
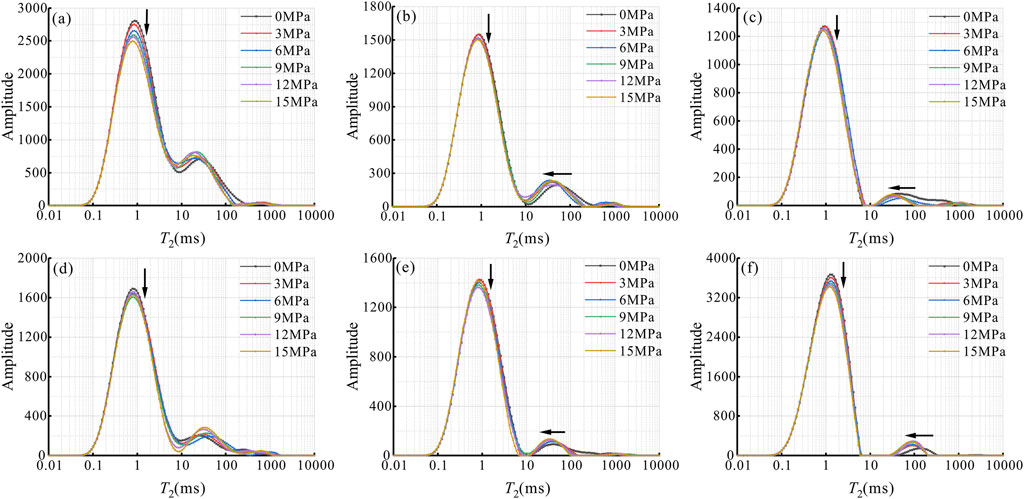
NMR carried out the experiments of pore\fracture distribution under different confining pressures. The results show that the T2 spectrum amplitude of adsorption pores decreases slightly with confining pressure. At the same time, the T2 spectrum amplitude of seepage pores also gradually moves to the left (Figure 6), indicating that the T2 amplitude of different types of pores has different manifestations. The surface areas of T2 amplitudes of different pores are calculated by integration. The results show that the T2 amplitudes of total pores, adsorption pores, and microfractures gradually decrease with confining pressure.
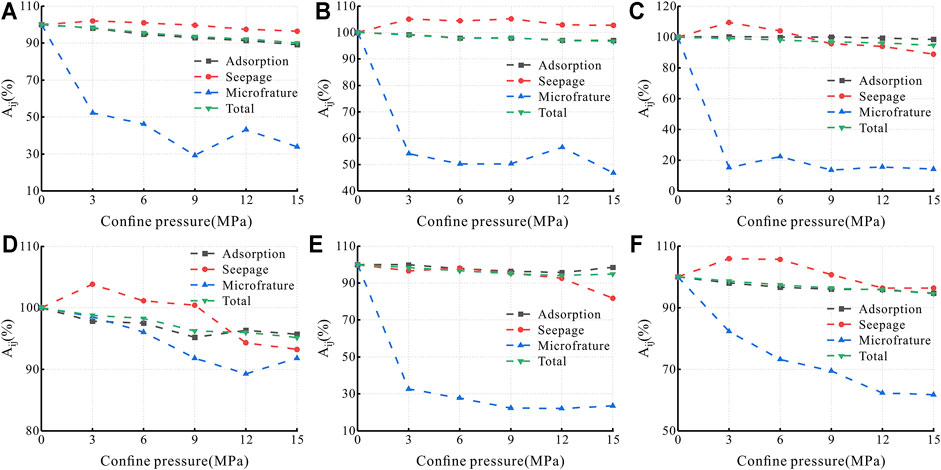
In contrast, the seepage pores slightly increase, and the overall T2 peak spectrum also shifts to the left (Figure 6). Because the pores are compressed with the increase of stress, resulting in the decrease of signal amplitude. The compression of pore\fracture also reduces the T2 relaxation time, resulting in the left shift of peak spectrum (Yao et al., 2010). The change of matrix causes the changing trend of adsorption pore under stress. Matrix compression leads to fluid extrusion in the adsorption pore with increased confining pressure, which reduces the T2 spectrum amplitude of the adsorption pore. The amplitude of microfracture T2 changes obviously under stress (Figure 7). 3 MPa is the turning point, T2 amplitude decreases to 15.29–98.54%, with an average of 44.14%, when the confining pressure is 0–3 MPa. When the confining pressure is 3–15 MPa, T2 amplitude decreases by 1.02–20.56%, with an average of 10.52%. The T2 amplitude of the seepage pores in the low-pressure range increases slightly (Figure 7). Because the stress sensitivity of microfractures is the largest, microfractures are compressed during the increase of confining pressure, and part microfractures are compressed to form seepage pores. Moreover, the fluid of the adsorption pore will move to the seepage pore during compression, which increases the T2 amplitude of the seepage pore. The variation trend of T2 spectrum amplitude of total pore is consistent with that of adsorption pore under stress. Adsorption pore is the primary pore type in the pore\fracture. Therefore, the compressed volume of the pore\fracture under stress mainly comes from the adsorption pore.
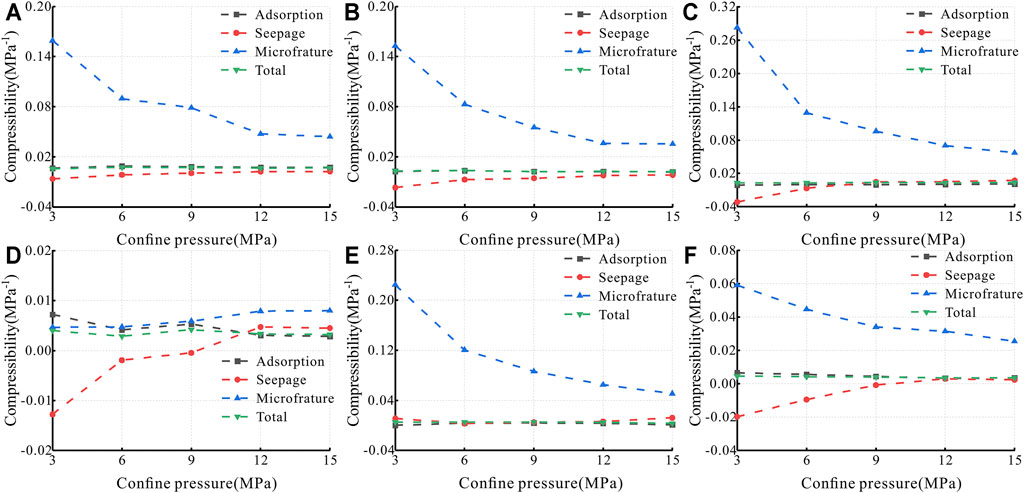
The compressibility of different pore types of different rank coals varies greatly (Figure 8). The compressibility of microfractures significantly changes with the increase of confining pressure (Figure 8). The compressibility of microfractures can be divided into two stages based on the variation trend of the compressibility coefficient. The compressibility coefficient of microfractures decreases sharply in confining pressure of 0–6 MPa, and the compressibility of microfractures decreases slowly in confining pressure of 6–15 MPa (Figure 8). It indicates that microfractures’ compression effect is evident in the low-pressure range and weak in the high-pressure field. The compressibility coefficient of the seepage pore increases with the increase of confining pressure. The compressibility of microfracture decreases significantly with the rise in pressure, the compression space of microfracture decreases, which changes part microfractures into seepage pores. The compressibility is of the adsorption pore almost unchanged because the compressibility of the adsorption pore is determined by the mechanical properties of the coal matrix resulting in a weak stress response.
Influencing Factors of Compressibility
Analyzing the influencing factors of coal reservoir compressibility is the key to take targeted response control measures. Therefore, the following will study the compressibility coefficient of coal reservoir from three aspects: pore structure, heterogeneity, and mechanical properties.
Pore Structure
The influence of pore size distribution characteristics on coal compressibility is controversial. For example, Li et al. (2013) found an apparent positive correlation between coal compressibility and micropores. In addition, Cai et al. (2018) showed that micropores have little effect on compressibility; macropores are the chief pore range affecting compressibility. In this work, different coal rank samples are mainly adsorption pores, and the content of adsorption pores of medium and high-rank coal is more than 90%. The reason has been explained in Chapter 3.1. There is a prominently positive correlation between the total pore volume and compressibility in coal samples of different coal ranks (Figure 9B), indicating that the larger the pore volume, the easier the coal is compressed. Pore volumes of different samples are mainly adsorption pores, so the effect of adsorption pore volume on compressibility is significant (Figure 9A). The pore volume and porosity are almost consistent in development. Therefore, the impact of porosity on coal compressibility is similar to pore volume (Figure 9C). The compressibility of coal shows an increasing trend with the increase of porosity and pore volume. There is a synergy between them, which has an important impact on the compressibility of coal.

FIGURE 9. Relationship between adsorption pore volume, total pore volume, porosity, and compressibility.
Pore Heterogeneity
The distribution of pore heterogeneity is usually characterized by fractal dimensions (Mandelbrot et al., 1983; Li et al., 2019). NMR fractal theory can characterize pore morphology and structural heterogeneity in different pore size ranges (Harmer et al., 2001). The complexity of pore\fracture is reflected by studying the fractal dimension under different stresses. The larger the fractal dimension, the more complex the pore\fracture structure, and the more substantial the heterogeneity (Zheng et al., 2018; Chen et al., 2019). Based on previous studies, VP can be expressed as:
Logarithmic transformation of the above formula can be characterized as:
where VP is the cumulative porosity percentage, %; T2max is the maximum transverse relaxation time; Dw is the NMR fractal value in dripping water, dimensionless.
The pore\fracture based on NMR characterization is divided into adsorption space (T2 < 2.5 ms) and seepage space (T2 > 2.5 ms) according to the pore division methods of Li et al. (2013) and Cheng et al. (2020). To explain the variation of heterogeneity of pore\fracture under different confining pressures, the fractal dimensions of adsorption space and seepage space of different coal rank samples based on NMR test results are calculated by Eq. 10 (Figure 10). With the increase of effective stress, the heterogeneity of adsorption space tends to be complex. The increasing trend of fractal dimension of adsorption space (DA) of SH sample is more evident than that of other samples, and DA increases rapidly from 1.17 to 1.24 (Figure 10A). The reason is that the adsorption pore volume of the SH sample is more developed than that of other samples (Figure 2). Therefore, the stress compression response is more significant. However, the effect of stress on the heterogeneity of seepage space is weak. During 0–3 MPa, the fractal dimension of seepage space (DS) increases obviously. When the confining pressure is higher than 3 MPa, the DS is almost unchanged (Figure 10B). The above results show that the confining pressure dramatically influences adsorption space heterogeneity, and the seepage space’s heterogeneity is mainly reflected in the low-pressure range (0–3 MPa).
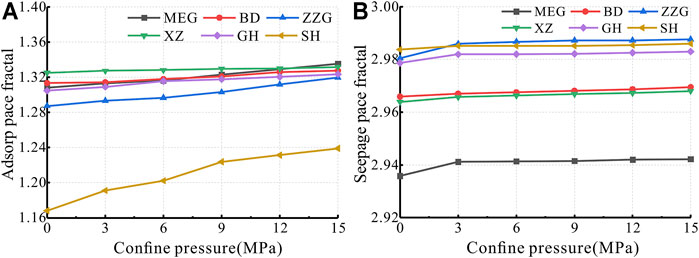
FIGURE 10. Fractal dimension of samples under different confining pressures (A). Fractal dimension of adsorption pore; (B). Seepage pore fractal dimension).
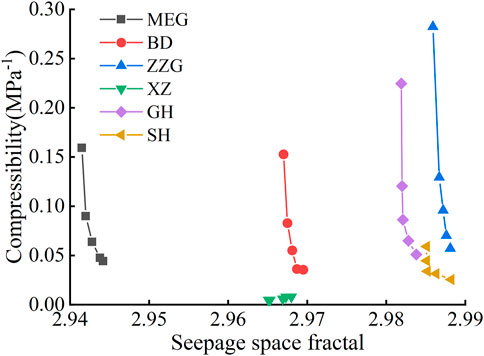
There is the same change trend between the DS and the corresponding compressibility of each sample (Figure 11), indicating that the changing trend of DS can express the change law of compressibility of pore\fracture. The larger the DS of the same sample, the stronger the heterogeneity, and the more difficult it is for the pore\fracture to be compressed. Because the fractal dimension affects the mechanical strength and self-similarity of coal. Wang et al. (2013) studied that the compressive strength of coal decreases exponentially with the increase of fractal dimension. The larger the fractal dimension indicates that the coal structure has low self-similarity, the more substantial the ability to resist stress deformation (Pateicia et al., 2003). To clearly show the influence of the fractal dimension of seepage space on compressibility, the first-order derivation of the compressibility coefficient of sample seepage space is carried out. The variation trend of compressibility of seepage space with fractal dimension is divided into two stages (Figure 12). The first stage is the rapid decline stage; the compressibility of seepage space decreases significantly with the increase of fractal dimension. The second stage is the sound stage, the influence of fractal dimension on pore\fracture compressibility becomes smaller and stable when the fractal dimension increases to a specific value. Because the stress sensitivity of microfractures in the initial stress range is more potent than that of seepage pores, which will lead to the transformation of part microfractures into seepage pores, and the compressibility of seepage space decreases sharply. In the later stage of stress application, the pore size of the seepage space becomes smaller. Li et al. (2019) studied that pore compressibility is affected by pore size. In the same space, pore stress sensitivity with large pore size is strong. Therefore, the fractal dimension affects the compressibility of seepage space, showing the second stage change trend.
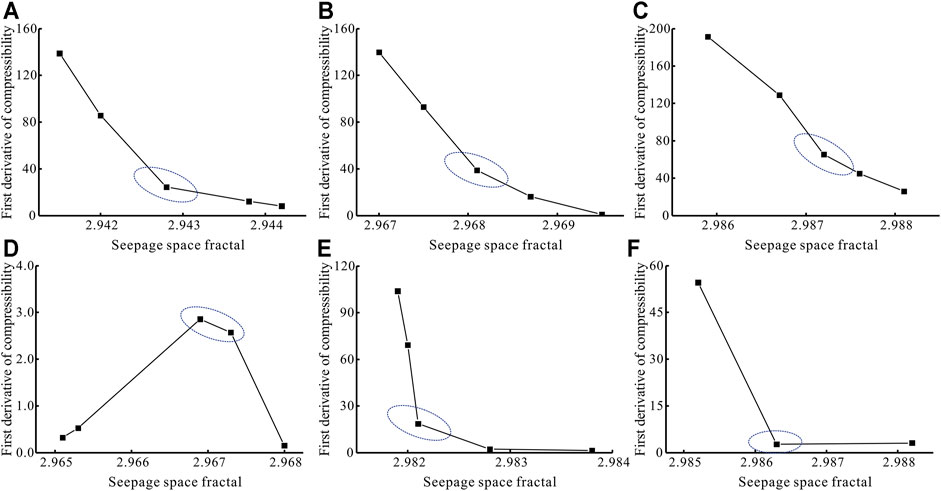
FIGURE 12. Relationship between the first derivative of seepage pore compressibility coefficient and fractal dimension.
Mechanical Strength
The effective stress increases of the reservoir with the production of gas and water from the coal reservoir in CBM exploitation, resulting in the deformation of the pore\fracture of the coal reservoir. The higher the mechanical strength of coal, the stronger the ability to resist stress deformation, reducing the compressibility of coal matrix and pore\fracures. Microhardness can analyze the hardness and other critical mechanical characteristics of materials. In recent years, the micromechanical properties of coal have been widely used to explain coal reservoirs’ mechanical properties (Shao et al., 2018; Godyń et al., 2019).
Coal matrix compression and pore\fracture compression are expressed as the relative changes of the coal reservoir matrix and pore\fracture under stress. Thus, they can reflect the mechanical characteristics of coal reservoirs. There is an apparent negative correlation between matrix compressibility, pore\fracture compressibility, and microhardness (Figure 13). The higher the mechanical strength of coal, the stronger the ability to resist stress deformation, and the less prone to compression deformation. Therefore, the greater the microhardness, the smaller the compressibility of matrix and pore\fracture. On the other hand, there is an apparent positive correlation between matrix compressibility based on HPMI and pore\fracture compressibility based on NMR. The correlation coefficient is 92% (Figure 13), which illustrates the adaptability of matrix compressibility and pore\fracture compressibility in characterization results. The compressibility of pore\fracture characterized by NMR is higher than that indicated by HPMI. Because different test methods describe the stress sensitivity of different properties, and the scale effect is also the reason for the difference between the two values.
The matrix compressibility and pore\fracture compressibility of coal have the exact change trend with the increase of metamorphic degree (Figure 14). Before the second coalification jump, aromatization led to the shedding of many oxygen-containing functional groups in the coal, reducing microporosity and pore volume. The decrease in volatile substances would also lead to the consolidation of the coal, enhance the compactness of the coal, and improve the strength and resistance to stress deformation of the coal (Stach et al., 1982). Therefore, the compressibility of coal matrix and pore\fracture decreased due to the decreasing pore volume and the increasing strength. During the second coalification, the side chain of organic matter is shortened. As a result, the quantity is reduced, the cyclo condensation cooperation and thermal cracking are gradually strengthened, the hydrogen-rich side chain is significantly reduced and accompanied by a large amount of methane escape, a large number of nanopores are generated in the coal, increasing the stress response of the coal reservoir (Figure 9). The increase of pore volume will also reduce the mechanical strength of the coal, resulting in the enhancement of compressibility.
Conclusion
1) The more accurate full pore characterization results can be obtained by selecting the optimal pore range measured by HPMI (>100 nm), LT-N2A (2–100 nm), and LP-CDA (<2 nm), and the characterization results are highly consistent with the NMR.
2) The coal pore/fracture volume decreases with the increase of stress. The adsorption pore has the most significant compression due to volume advantage. The microfracture compression is the most effective, and the compression coefficient first decreases rapidly (0–6 MPa) and then decreases slowly (6–15 MPa) with stress increase.
3) The compressibility coefficient negatively correlates with pore heterogeneity and mechanical strength and positively correlates with pore volume. The variation trend of coal matrix compressibility and pore\fractures compressibility with coal rank is consistent, greatly affected by the jump of coalification.
Data Availability Statement
The original contributions presented in the study are included in the article/Supplementary Material, further inquiries can be directed to the corresponding author.
Author Contributions
JL: Conceptualization, Methodology, Formal analysis, Resources, Writing-original draft, Writing-review and editing XF: Methodology, Investigation, Supervision JK: Conceptualization, Methodology, Supervision, Funding acquisition MC: Methodology ZW: Editing and revision All authors reviewed the article.
Funding
This work was supported by the National Natural Science Foundation of China (42072190, 41772158), the Basic Scientific Research Business Fee of the China University of Mining and Technology (2020CXNL11), and the Key Foundation of Shanxi Province (201901D111005(ZD)).
Conflict of Interest
The authors declare that the research was conducted in the absence of any commercial or financial relationships that could be construed as a potential conflict of interest.
Publisher’s Note
All claims expressed in this article are solely those of the authors and do not necessarily represent those of their affiliated organizations, or those of the publisher, the editors, and the reviewers. Any product that may be evaluated in this article, or claim that may be made by its manufacturer, is not guaranteed or endorsed by the publisher.
References
Cai, Y., Li, Q., Liu, D., Zhou, Y., and Lv, D. (2018). Insights into Matrix Compressibility of Coals by Mercury Intrusion Porosimetry and N2 Adsorption. Int. J. Coal Geology. 200, 199–212. doi:10.1016/j.coal.2018.11.007
Cai, Y., Liu, D., Pan, Z., Yao, Y., Li, J., and Qiu, Y. (2013). Pore Structure and its Impact on CH4 Adsorption Capacity and Flow Capability of Bituminous and Subbituminous Coals from Northeast China. Fuel 103 (JAN.), 258–268. doi:10.1016/j.fuel.2012.06.055
Chen, S., Tang, D., Tao, S., Ji, X., and Xu, H. (2019). Fractal Analysis of the Dynamic Variation in Pore-Fracture Systems under the Action of Stress Using a Low-Field NMR Relaxation Method: An Experimental Study of Coals from Western Guizhou in China. J. Pet. Sci. Eng. 173, 617–629. doi:10.1016/j.petrol.2018.10.046
Cheng, M., Fu, X., and Kang, J. (2020). Compressibility of Different Pore and Fracture Structures and its Relationship with Heterogeneity and Minerals in Low-Rank Coal Reservoirs: An Experimental Study Based on Nuclear Magnetic Resonance and Micro-CT. Energy Fuels 34 (9), 10894–10903. doi:10.1021/acs.energyfuels.0c02119
Clarkson, C. R., Solano, N., Bustin, R. M., Bustin, A. M. M., Chalmers, G. R. L., He, L., et al. (2013). Pore Structure Characterization of North American Shale Gas Reservoirs Using USANS/SANS, Gas Adsorption, and Mercury Intrusion. Fuel 103, 606–616. doi:10.1016/j.fuel.2012.06.119
Friesen, W., and Mikula, R. (1988). Mercury Porosimetry of coalsPore Volume Distribution and Compressibility. Fuel 67 (11), 1516–1520. doi:10.1016/0016-2361(88)90069-5
Godyń, K., Kožušníková, A., and Sciubba, E. (2019). Microhardness of Coal from Near-Fault Zones in Coal Seams Threatened with Gas-Geodynamic Phenomena, Upper Silesian Coal Basin, Poland. Energies 12 (9), 1756–1770. doi:10.3390/en12091756
Guo, X., Yao, Y., and Liu, D. (2014). Characteristics of Coal Matrix Compressibility: An Investigation by Mercury Intrusion Porosimetry. Energy Fuels 28 (6), 3673–3678. doi:10.1021/ef5004123
Hao, F., Zou, H., and Lu, Y. (2013). Mechanisms of Shale Gas Storage: Implications for Shale Gas Exploration in China. Bulletin 97 (8), 1325–1346. doi:10.1306/02141312091
Harmer, J., Callcott, T., Maeder, M., and Smith, B. E. (2001). A Novel Approach for Coal Characterization by NMR Spectroscopy: Global Analysis of Proton T1 and T2 Relaxations. Fuel 80 (3), 417–425. doi:10.1016/S0016-2361(00)00103-4
Hou, X., Zhu, Y., Wang, Y., and Liu, Y. (2019). Experimental Study of the Interplay between Pore System and Permeability Using Pore Compressibility for High Rank Coal Reservoirs. Fuel 254 (OCT.15), 115712. doi:10.1016/j.fuel.2019.115712
Kang, J., Fu, X., Li, X., and Liang, S. (2019). Nitrogen Injection to Enhance Methane and Water Production: An Experimental Study Using the LF-NMR Relaxation Method. Int. J. Coal Geology. 211, 103228. doi:10.1016/j.coal.2019.103228
Li, S., Tang, D., Pan, Z., Xu, H., and Huang, W. (2013). Characterization of the Stress Sensitivity of Pores for Different Rank Coals by Nuclear Magnetic Resonance. Fuel 111, 746–754. doi:10.1016/j.fuel.2013.05.003
Li, W., Liu, H., and Song, X. (2015). Multifractal Analysis of Hg Pore Size Distributions of Tectonically Deformed Coals. Int. J. Coal Geology. 144-145, 138–152. doi:10.1016/j.coal.2015.04.011
Li, X., Fu, X., Ranjith, P. G., and Xu, J. (2019). Stress Sensitivity of Medium- and High Volatile Bituminous Coal: An Experimental Study Based on Nuclear Magnetic Resonance and Permeability-Porosity Tests. J. Pet. Sci. Eng. 172, 889–910. doi:10.1016/j.petrol.2018.08.081
Li, Y.-H., Lu, G. Q., and Rudolph, V. (1999). Compressibility and Fractal Dimension of Fine Coal Particles in Relation to Pore Structure Characterisation Using Mercury Porosimetry. Part. Part. Syst. Charact. 16 (1), 25–31. doi:10.1002/(sici)1521-4117(199905)16:1<25:aid-ppsc25>3.0.co;2-t
Li, Y., Wang, Z., Pan, Z., Niu, X., Yu, Y., and Meng, S. (2019). Pore Structure and its Fractal Dimensions of Transitional Shale: A Cross-Section from East Margin of the Ordos Basin, China. Fuel 241, 417–431. doi:10.1016/j.fuel.2018.12.066
Li, Y., Wang, Z., Tang, S., and Elsworth, D. (2022). Re-evaluating Adsorbed and Free Methane Content in Coal and its Ad- and Desorption Processes Analysis. Chem. Eng. J. 428, 131946. doi:10.1016/j.cej.2021.131946
Liu, S., Sang, S., Wang, G., Ma, J., Wang, X., Wang, W., et al. (2017). FIB-SEM and X-ray CT Characterization of Interconnected Pores in High-Rank Coal Formed from Regional Metamorphism. J. Pet. Sci. Eng. 148, 21–31. doi:10.1016/j.petrol.2016.10.006
Lucas-Oliveira, E., Araújo-Ferreira., A. G., and Bonagamba, T. J. (2021). Surface Relaxivity Probed by Short-Diffusion Time NMR and Digital Rock NMR Simulation. J. Pet. Sci. Eng. 207 (4), 109078. doi:10.1016/J.PETROL.2021.109078
Mandelbrot, B. B. (1983). The Fractal Geometry of Nature / Revised and Enlarged Edition. New York: W.h.freeman & Co.p.
Menzel, M. I., Han, S.-I., Stapf, S., and Blümich, B. (2000). NMR Characterization of the Pore Structure and Anisotropic Self-Diffusion in Salt Water Ice. J. Magn. Reson. 143 (2), 376–381. doi:10.1006/jmre.1999.1999
Moore, T. A. (2012). Coalbed Methane: A Review. Int. J. Coal Geology. 101 (1), 36–81. doi:10.1016/j.coal.2012.05.011
Nelson, J. R., Mahajan, O. P., and Walker, P. L. (1980). Measurement of Swelling of Coals in Organic Liquids: a New Approach. Fuel 59 (12), 831–837. doi:10.1016/0016-2361(80)90031-9
Ross, D. J. K., and Marc Bustin, R. (2009). The Importance of Shale Composition and Pore Structure upon Gas Storage Potential of Shale Gas Reservoirs. Mar. Pet. Geology. 26 (6), 916–927. doi:10.1016/j.marpetgeo.2008.06.004
Shao, P., Wang, X., Song, Y., and Li, Y. (2018). Study on the Characteristics of Matrix Compressibility and its Influence Factors for Different Rank Coals∗. J. Nat. Gas Sci. Eng. 56, 93–106. doi:10.1016/j.jngse.2018.05.035
Stach, E., Mackowsky, M. T., Teichmüller, M., and Taylor, G. H. (1982). Textbook of Coal Petrology. Berlin: Gebruder Borntraeger.
Tan, Y., Pan, Z., Liu, J., Feng, X.-T., and Connell, L. D. (2018). Laboratory Study of Proppant on Shale Fracture Permeability and Compressibility. Fuel 222, 83–97. doi:10.1016/j.fuel.2018.02.141
Tang, P., Chew, N. Y. K., Chan, H.-K., and Raper, J. A. (2003). Limitation of Determination of Surface Fractal Dimension Using N2 Adsorption Isotherms and Modified Frenkel−Halsey−Hill Theory. Langmuir 19 (5), 2632–2638. doi:10.1021/la0263716
Tao, S., Wang, Y., Tang, D., Xu, H., Lv, Y., He, W., et al. (2012). Dynamic Variation Effects of Coal Permeability during the Coalbed Methane Development Process in the Qinshui Basin, China. Int. J. Coal Geology. 93 (1), 16–22. doi:10.1016/j.coal.2012.01.006
Wang, J. Z., Tang, H., Zhu, J. L., Ao, Q. B., Zhi, H., and Ma, J. (2013). Relationship between Compressive Strength and Fractal Dimension of Pore Structure. Rare Metal Mat. Eng. 42 (12), 2433–2436. doi:10.1016/S1875-5372(14)60033-3
Wang, K., Pan, J., Wang, E., Hou, Q., Yang, Y., and Wang, X. (2020). Potential Impact of CO2 Injection into Coal Matrix in Molecular Terms. Chem. Eng. J. 401, 126071. doi:10.1016/j.cej.2020.126071
Wang, X., Pan, J., Wang, K., Ge, T., Wei, J., and Wu, W. (2020). Characterizing the Shape, Size, and Distribution Heterogeneity of Pore-Fractures in High Rank Coal Based on X-ray CT Image Analysis and Mercury Intrusion Porosimetry. Fuel 282 (11), 118754. doi:10.1016/j.fuel.2020.118754
Wang, Z., Fu, X., Deng, Z., and Pan, J. (2021). Investigation of Adsorption-Desorption, Induced Strains and Permeability Evolution during N2-ECBM Recovery. Nat. Resour. Res. 30 (1), 3717–3734. doi:10.1007/s11053-021-09884-8
Yang, C., Zhang, J., Wang, X., Tang, X., Chen, Y., Jiang, L., et al. (2017). Nanoscale Pore Structure and Fractal Characteristics of a marine-continental Transitional Shale: A Case Study from the Lower Permian Shanxi Shale in the southeastern Ordos Basin, China. Mar. Pet. Geology. 88, 54–68. doi:10.1016/j.marpetgeo.2017.07.021
Yao, Y., Liu, D., Che, Y., Tang, D., Tang, S., and Huang, W. (2010). Petrophysical Characterization of Coals by Low-Field Nuclear Magnetic Resonance (NMR). Fuel 89, 1371–1380. doi:10.1016/j.fuel.2009.11.005
Yao, Y., Liu, D., and Xie, S. (2014). Quantitative Characterization of Methane Adsorption on Coal Using a Low-Field NMR Relaxation Method. Int. J. Coal Geology. 131, 32–40. doi:10.1016/j.coal.2014.06.001
Yuan, J., Jiang, R., and Zhang, W. (2018). The Workflow to Analyze Hydraulic Fracture Effect on Hydraulic Fractured Horizontal Well Production in Composite Formation System[J]. Adv. Geo-Energy Res. 2 (3), 319–342. doi:10.26804/ager.2018.03.09
Zhang, J., Wei, C., Ju, W., Yan, G., Lu, G., Hou, X., et al. (2019). Stress Sensitivity Characterization and Heterogeneous Variation of the Pore-Fracture System in Middle-High Rank Coals Reservoir Based on NMR Experiments. Fuel 238, 331–344. doi:10.1016/j.fuel.2018.10.127
Zheng, S., Yao, Y., Liu, D., Cai, Y., and Liu, Y. (2018). Characterizations of Full-Scale Pore Size Distribution, Porosity and Permeability of Coals: A Novel Methodology by Nuclear Magnetic Resonance and Fractal Analysis Theory. Int. J. Coal Geology. 196, 148–158. doi:10.1016/j.coal.2018.07.008S
Keywords: pore\fracture structure, full pore characterization, matrix compressibility, pore\fracture compressibility, different coal ranks
Citation: Lu J, Fu X, Kang J, Cheng M and Wang Z (2021) Characterization of Full Pore and Stress Compression Response of Reservoirs With Different Coal Ranks. Front. Earth Sci. 9:764853. doi: 10.3389/feart.2021.764853
Received: 26 August 2021; Accepted: 04 October 2021;
Published: 25 November 2021.
Edited by:
Jienan Pan, Henan Polytechnic University, ChinaReviewed by:
Yong Li, China University of Mining and Technology, ChinaHaichao Wang, Xinjiang University, China
Copyright © 2021 Lu, Fu, Kang, Cheng and Wang. This is an open-access article distributed under the terms of the Creative Commons Attribution License (CC BY). The use, distribution or reproduction in other forums is permitted, provided the original author(s) and the copyright owner(s) are credited and that the original publication in this journal is cited, in accordance with accepted academic practice. No use, distribution or reproduction is permitted which does not comply with these terms.
*Correspondence: Xuehai Fu, ZnV4dWVoYWlAMTYzLmNvbQ==
 Jielin Lu
 Xuehai Fu