 Xing Li
 Xiao Li1,2
 Hedi Ma
 Wenjian Hua
 Shanlei Sun
 Chujie Gao
- 1Plateau Atmosphere and Environment Key Laboratory of Sichuan Province, College of Atmospheric Science, Chengdu University of Information Technology, Chengdu, China
- 2Key Laboratory of Meteorological Disaster (KLME), Ministry of Education, Collaborative Innovation Center on Forecast and Evaluation of Meteorological Disasters (CIC-FEMD), Nanjing University of Information Science and Technology, Nanjing, China
- 3Hubei Key Laboratory for Heavy Rain Monitoring and Warning Research, Institute of Heavy Rain, China Meteorological Administration, Wuhan, China
- 4China Meteorological Press, China Meteorological Administration, Beijing, China
- 5Key Laboratory of Marine Hazards Forecasting, Ministry of Natural Resources, College of Oceanography, Hohai University, Nanjing, China
Changes in temperature variability can have more serious social and ecological impacts than changes in the mean state of temperature, especially when they are concurrent with global warming. The present study examines the summertime temperatures’ trends over China from the quantile perspective. Through fully investigating the quantile trends (QTs) of the maximum (Tmax) and minimum temperature (Tmin) using the homogenized observation data and quantile regression analysis, we identify evident region-specific quantile features of summertime temperature trends. In most of northern China, the QTs in Tmax and Tmin for all percentiles generally show strong uniform warmings, which are dominated by a warm shift in mean state temperatures. In contrast, the QTs of Tmax in the Yangtze River Basin show distinguishable inter-quantile features, i.e., an increasing tendency of QTs from cooling trends in the lower percentile to warming trends in the higher percentile. Further investigations show that such robust growing QTs of Tmax across quantiles are dominated by the temperature variance. Our results highlight that more attention should be paid to the region-specific dominance of temperature variability in trends and the related causes.
Introduction
Global warming during the past 50 years is unequivocal, according to the continuous assessments of the Intergovernmental Panel on Climate Change (IPCC) reports (e.g., IPCC, 2012, 2013, 2018, 2021). Such warming is not spread uniformly across the globe; instead, distinctive region-specific features with various magnitudes or even opposite signs are detected.
In particular, previous studies have demonstrated that China has also experienced robust warming trends during the past decades from the national mean perspective (e.g., Ding et al., 2007). However, strong regional and seasonal differences of such warming trends have also been reported (e.g., Qian and Qin, 2006; Xu et al., 2017; Li et al., 2019; Li and Zha, 2019). For example, Li et al. (2019) found that from the long-term (>50a) scale, summertime temperature during the past half-century exhibited a larger warming trend over the north of China, whereas very slight warming or even cooling trends were detected in the south of China. Similarly, this pattern of warming trends is also recognized by several previous studies (Qian and Qin, 2006; Xu et al., 2013; Xu et al., 2017), despite some slight gaps in magnitudes due to different data, methods, and analysis periods. Regarding daily maximum temperature (Tmax) trends, Li et al. (2015) found that the trends of summer Tmax during 1961–2012 over China also showed robust warming in the north and slight warming or cooling in the south, which resembles the above-mentioned warming pattern of mean temperature.
Concurrent with such warming patterns, the trends of high-temperature extreme events (e.g., heatwaves), however, are evidently distinct from that of temperatures, particularly in regions of southern China (e.g., Yangtze River Basin). As revealed by Chen and Zhai (2017), the summertime compound hot events were growing 15–20% (i.e., 2–4 days) per decade, especially in the north China and south China. Hu et al. (2017) investigated the trends of summertime heat days over China and identified a significant increasing trend of heat days in southern China, particularly in the south of the Yangtze River and the southeast coast of China. Meanwhile, evident decreasing trends of heat days were also detected in Henan and Shandong province in their study. Similarly, Qian et al. (2019) also showed that the summertime warm days (TX90P) have significantly increased in western China and East China, whereas slight decreasing trends were coherently detected in some regions of central-eastern China. From the above evidence, it is worth noting that the increasing (decreasing) pattern of heat extremes seems inconsistent with the warming (cooling) pattern of Tmax, especially for South China. This further suggests that the trends of Tmax in different percentiles are probably distinct because most studies used percentile-based indices (e.g., TX90P) to define extreme events. What is the feature and the main cause of the above-mentioned inconsistency (i.e., different trends across percentiles) over China remains unknown.
According to the IPCC SREX report (IPCC, 2012), the variability of extreme temperatures is not only influenced by the mean state shift in temperature, but also related to the changing shape of the temperature distribution (e.g., changes in temperature variance). Furthermore, McKinnon et al. (2016) investigated the relative roles of four statistical moments of temperature distribution (i.e., mean, variance, skewness, and kurtosis) on the summertime temperature trends. Their results showed that the warming trends in summer temperatures over the majority of the Northern Hemisphere were due to shifts in the temperature mean state, but in some specific regions (e.g., mid-to high-latitude Eurasia), changes in temperature variance also make a non-negligible contribution to the trends. As global warming and the concurrent growth of extreme events become more severe, there are growing numbers of studies that highlight the impact of temperature variability on extreme events more widely than the mean state shifts (e.g., Schär et al., 2004; Screen, 2014; Wang et al., 2020; Yang et al., 2021). However, for China, the assessment of relative contribution of temperature mean state shifts and changes in temperature variability to the temperature trends in the context of global warming is still lacking.
In recent years, China has suffered multiple dangerous and deadly heatwaves (e.g., 2013 super summertime heat wave event in southern China; Xia et al., 2016), which caused catastrophic social and economic consequences. Multi-model-based future projections suggest that if global warming persists, deadly heat waves like the 2013 event will become increasingly frequent (e.g., Sun et al., 2014; Sun et al., 2018). Therefore, based on the above gaps, two important scientific questions are raised, namely, what are the quantile features of the summer temperature trends in China? And what is the relative contribution of changes in the mean state and variability of temperatures to the trends? The rest of the article is presented in the following order: Section 2 describes the data and methods used in the study, Section 3 shows the main results of the study, and Section 4 contains the necessary discussions and summaries of the current findings.
Data and Methods
Data
The homogenized China daily maximum and minimum surface air temperature (Tmax and Tmin hereafter) from 2,419 meteorological stations are used to investigate the variations of Tmax and Tmin during 1961–2017. In addition, precipitation data from the same homogenized dataset are also used in this paper to investigate the covariability between temperature and precipitation. Those datasets are derived from the China Meteorological Administration (http://data.cma.cn/en). Comparing with the original station records, the potential inhomogeneities (i.e., influences from non-climatic factors) of the data are significantly reduced in those datasets, and the quality of the observed data are further improved. Details of the production of these datasets are referred to Cao et al. (2016) and Yang and Li (2014). To further minimize the inhomogeneities from missing data and stations’ irregular geographic distribution, two additional criteria are applied:
1) For meteorological variables, the stations that have any missing data of summer days (i.e., June-July-August) during 1961–2017 are excluded;
2) Following Chai et al. (2018) and Li et al. (2019), we introduced a re-grid algorithm to redistribute the station data onto a 0.5° × 0.5° longitude-latitude grids; details can be found in Li et al. (2019).
Finally, the processed meteorological variables are continuous (i.e., no missing data) in time and equal-weighted in space (i.e., 0.5° × 0.5° grid boxes). The illustration of the original stations’ distributions and the re-gridded equal-weighted grid boxes can be found in Supplementary Figure S1.
Quantile Regression
To investigate the role of the changing shape of temperature distributions on its trends across different percentiles, we introduce the quantile regression (QR) method to estimate the quantile trends (QTs). The QR method can be seen as an extension of the method of ordinary least squares (OLS); it can discover more comprehensive relationships between variables in any quantiles (e.g., median). This method has been widely used for assessing the variability of extreme events in recent decades (e.g., McKinnon et al., 2016; Mueller et al., 2016; Yin et al., 2018). A full description of QR method can be found in Koenker and Bassett (1978) and Cade and Noon (2003). The QR source code can be implemented using the python statsmodels (Seabold and Perktold, 2010) package. Detailed information of statsmodels package and QR source code can be found in http://www.statsmodels.org/stable/_modules/statsmodels/regression/quantile_regression.html#QuantReg.
In this study, we first remove the seasonal cycle of Tmax and Tmin in each summer between 1961 and 2017 according to the daily climatology of the whole period (i.e., 1961–2017) to obtain the daily Tmax and Tmin anomalies at summer months (i.e., June-July-August). The QR method is then applied to a 57-year (i.e., 1961–2017) time series of summer daily Tmax (Tmin) anomalies for each grid box (i.e., total series length for QR is 57 years × 92 days), and linear trends in Tmax (Tmin) are calculated in 5% steps from the 5th percentile to the 95th percentile. It should be noted that the interpretation of QR results (i.e., QTs) is very similar to the OLS regression, with the difference that instead of predicting the mean of the dependent variable, quantile regression looks at the quantile of the dependent variable. Here, we illustrate with a specific example: suppose we do QR on a Tmax series and obtain its 90th percentile QT of 0.2°C/10a. This means that if the trend is translated into a change of extremes, then hot days will plausibly increase in this example. Similarly, the 10th percentile QT of Tmax (Tmin) implies a change in cold days (nights). In contrast to OLS regression, which can only predict the mean of the dependent variable, QR can be applied to any quantile points, so by investigating the QT at multiple percentiles, we can establish a better understanding of the variation in the conditional distribution of the temperature series. Specifically, for QTs at the two tails of the temperature distribution, it is closely related to changes in extreme events.
Furthermore, in order to quantify the contribution of changes in temperature mean state and shape of temperature distribution (STD) to the temperature QTs, we can assume that at a certain percentile, the trend in temperature is only influenced by changes in the temperature mean state and STD. Thus, we can measure the change in temperature QTs due to STD as the difference between the temperature QTs and the mean temperature trend (i.e.,
Results
Quantile Features of Summertime Tmax and Tmin Trends over China
Previous studies have suggested that changes in STD (e.g., changes in variance, skewness, and kurtosis) can also exert important impacts on temperature extremes (IPCC, 2012; McKinnon et al., 2016; Li et al., 2017). Note that the term “changes in temperature variability” in the following text refers specifically to changes in STD (i.e., variance, kurtosis, and skewness) other than the mean state shift. To investigate whether there are evident differences of Tmax (Tmin) trends among percentiles, Figure 1 shows the selected QTs of summertime Tmax and Tmin at three different percentiles (i.e., 10th, 50th, and 90th percentiles) during 1961–2017 over China. As seen from Figures 1A1–A3, the Tmax QTs clearly show distinguishable features from low to high percentiles, while the Tmin QTs are less variable across different quantiles.
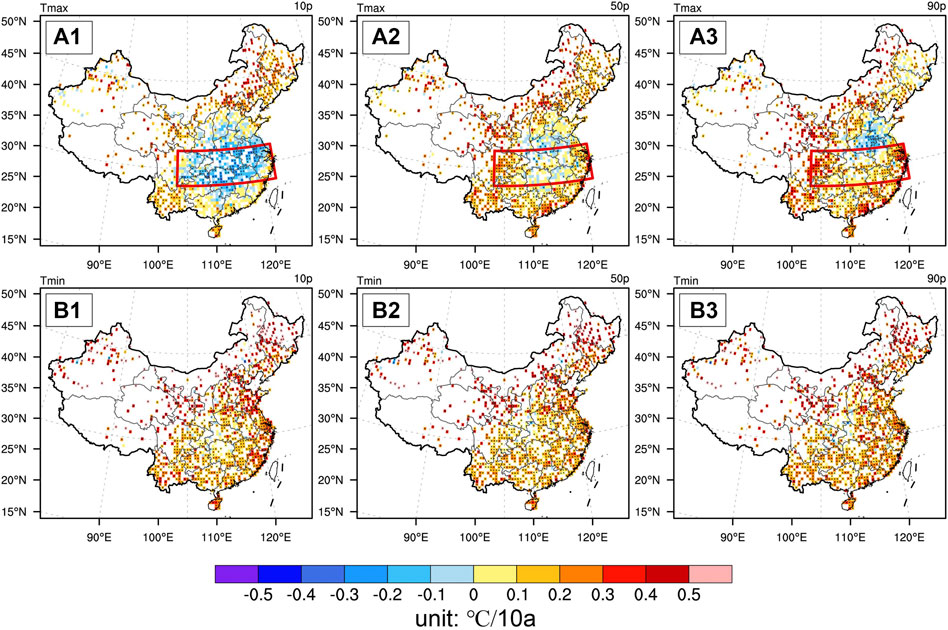
FIGURE 1. The quantile trends of 1961–2017 summertime Tmax [row (A)] and Tmin [row (B)] at 10th (column 1), 50th (column 2), and 90th (column 3) percentiles, unit: °C/10a. Stippling regions denote trends that are statistically significant at 95% confidence level. The red boxes in the panel (A) represent the Yangtze River Basin (YRB; 27–33°N, 103–122°E).
Specifically, the QTs of Tmax at the 10th percentile exhibits consistent significant warming trends (more than 0.2°C/10a) over most regions in the north of China (i.e., to the north of 40°N), especially for North China (Figure 1A1). In contrast, broad cooling trends are detected in the Yangtze River Basin (YRB) and Huaihe River Basin with significant (p < 0.05) cooling trends of −0.3 to −0.4°C/10a. Compared to the low percentile (10th percentile), the trend of the median (i.e., 50th percentile) of Tmax generally shows a similar warming pattern to the mean Tmax trend over China (e.g., mentioned in Li et al., 2015 and Supplementary Figure S2A). In particular, significant warming trends with a magnitude of 0.2–0.4°C/10a are shown in the north of China (i.e., to the north of 40°N) and coastal areas of South and East China, whereas there is no clear trend in the Central China (slightly warming or cooling with a magnitude less than ±0.1°C/10a; Figure 1A2). For the Tmax at high percentile (i.e., 90th percentile), the pattern of significant warming trends is very similar to that of the median of Tmax, i.e., significant warming trends are detected in the north of China (i.e., to the north of 40°N) and the coastal regions of southeastern China (Figure 1A2 vs. Figure 1A3). Notably, there are two distinguishable characteristics of Tmax trends at 90th percentile in contrast to that of the median. First, for YRB, the robustness and warming magnitude of Tmax trends at the high 90th percentile is stronger (i.e., more grids show significant warming trends) and higher (i.e., 0.2°C/10a higher) than that at the median. Second, significant cooling trends of Tmax at the high percentile with the magnitude of −0.2 to −0.4°C/10a are also detected in the Huang-Huai-Hai plain, where no clear trends are shown at the median (Figure 1A2 vs. Figure 1A3). In conclusion, the QTs of Tmax show a largely consistent and significant warming in the north of China, but in the YRB region, this exhibits an asymmetrical feature across quantiles, i.e., an increasing tendency from cooling at the low percentile (i.e., 10th) to warming at the high percentile (i.e., 90th).
To further interpret the current results, we can roughly link the trend of Tmax at the 90th (50th) percentile to the trend of hot extremes (mean Tmax). Therefore, the current results of Tmax trends at the 50th and 90th percentile generally agree with previous studies regarding the observed trends of mean Tmax and hot extremes during the past 50 years (e.g., Deng et al., 2019; Li et al., 2019; Qian et al., 2019). Moreover, it should be noted that the evident opposite Tmax QTs between the high and low percentiles at the YRB region may be caused by changes in non-mean factors of temperature (e.g., variance and kurtosis), according to McKinnon et al. (2016). This further implies that the changing shape of Tmax distributions (i.e., changes in variance, skewness, and kurtosis) may dominate the trend of hot/cold extremes in the YRB region.
Unlike the Tmax, the QTs of Tmin are more consistent among different percentiles (Figures 1B1–B3), with all QTs showing almost the same trends as the mean Tmin (Supplementary Figure S2B). Taking the trend of the median of Tmin as an example, broad and consistent warming trends are detected nationally, while the warming magnitude in the north of China (0.3–0.5°C/10a to the north of 35°N) is higher than that in the south of China (0.1–0.4°C/10a to the south of 35°N). In addition, the trends of Tmin at 10th and 90th percentiles generally resemble that of the median (Figures 1B1–B3). Comparing the above QT results of Tmin and Tmax, two distinguishable features can be concluded: 1) The QTs of Tmax show an asymmetric feature across percentiles (i.e., an increasing tendency of Tmax trends from low to high percentiles), whereas there are symmetric responses of Tmin trends in all percentiles (Figure 1B), and 2) the warming trends magnitudes of Tmin in all percentiles are higher than that of Tmax, which agrees with the previous findings regarding the more rapid warming of Tmin than Tmax in recent decades (e.g., Davy et al., 2017). Moreover, this asymmetric trends between Tmax and Tmin, irrespective of the quantile, also implies that the diurnal temperature range (DTR) has shown a clear decreasing trend over the past decades, which has been well recognized in recent studies (Xia, 2013; Xue et al., 2019). In addition, physical reasons for the declining DTR are probably related to the sunshine duration, cloud cover, and large-scale vertical motion anomalies (e.g., Liu et al., 2018).
Stability of Quantile Trends of Tmax and Tmin over the YRB Region
In the previous part, we found that there were distinct responses of QTs between Tmax and Tmin, particularly for the YRB region. However, it is obvious that a trend of temperature can be potentially affected by the start and end year (i.e., the position and length of trend window), which in turn introduce uncertainties and reduce the confidence of the current conclusions. Therefore, in this part, we will fully discuss the stability (i.e., uncertainty) of the observed features of the QTs of Tmax and Tmin over the YRB region.
First, we take one particular point (i.e., 120°E, 31°N) in the YRB region as an example to conduct a running window QR analysis (5th to 95th in step of 5%) that covers the window length (WL) from 49 to 57 years and the start year (SY) from 1961 to 1969. Through the running window analysis, the QTs of Tmax and Tmin for 45 different periods will be calculated. It is worth noting that we focus on long-term trends in temperatures in the following analysis, and therefore, only WLs of about 50a or more are shown here. Figures 2A,B exhibit the selecting results (i.e., 10th, 50th, and 90th percentiles) of running window QR analysis for Tmax and Tmin, respectively. A first inspection shows that the QTs of Tmax and Tmin from low to high percentiles within different periods on the whole exhibit similar features to the spatial results of Section 3.1. In detail, consistent cooling trends are detected at the low percentile (i.e., 10th percentile) of Tmax in most of the selected periods (44 periods out of 45; Figure 2A1). For the robustness, significant cooling trends of Tmax in the low percentile with −0.2 to −0.4°C/10a are shown in relatively long periods (i.e., 53–57 years), whereas weak and insignificant cooling trends are shown in relatively short periods (49–51 years). The trends of the median of Tmax generally show consistent and significant moderate (0.1–0.3°C/10a) warming in all periods (except for the trends start at 1961; Figure 2A2). Similarly, consistent but stronger warming trends (0.3–0.5°C/10a) are detected in the Tmax at the high percentile (i.e., 90th) for all periods (Figure 2A3). All the Tmax trends at 90th percentile within different periods are statistically significant (i.e., p < 0.01). For Tmin, running window QT results show uniformly strong and significant warming at every percentile (Figures 2B1–B3), which indicates that the uniform warmings of Tmin at all quantiles for this specific point have a high degree of confidence. In addition to the above results, it appears that the significance of the 10th percentile cooling QTs of Tmax are not consistent across WLs. In particular for the results after the SY of 1965, significance of Tmax QTs across windows are very weak. For interpreting this finding, we extend the WL (SY) of running window QT analysis to 20–57a (1961–1998) in order to provide a panoramic view (Supplementary Figure S3). Interestingly, in addition to the characteristics we show for the long-term QTs, it is also clear that Tmax QTs in all percentiles exhibit significant interdecadal variations, i.e., the cooling trends of the 60–80s and the significant warming trends of the 80s and onwards (Supplementary Figures S3A1–A3). These interdecadal variations reflect the effect of internal climatic variability (e.g., Atlantic Multidecadal Oscillation) or other external forcing factors. Thus, this complex multi-scale interdecadal variations superimposed on the long-term QTs we identified will plausibly lead to different degrees of significance for different WLs.
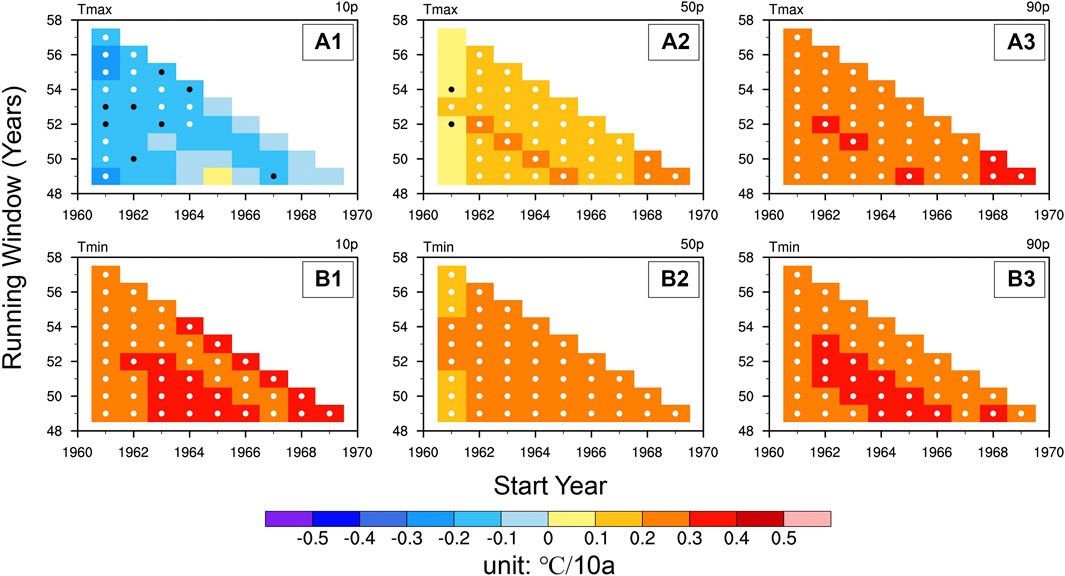
FIGURE 2. Running window quantile trends in the 10th (column 1), 50th (column 2), and 90th (column 3) percentiles of Tmax [row (A)] and Tmin [row (B)] at the point (120°E, 31°N) within the YRB region, unit: °C/10a. The x-axis represents the start year of the analysis period, while the y-axis represents the length of the analysis period. White and black dots represent trends that are statistically significant at 99% and 95% confidence levels, respectively.
Furthermore, we calculate the statistics of running window QTs for all the grid points at the YRB region to see whether the quantile features of Tmax and Tmin are still pronounced for the whole region. The results of the statistics (i.e., the first and third quartiles, the median, and the kernel density estimation) are shown as a violin plot (Figure 3). In general, the QT characteristics of Tmin and Tmax mentioned above remain valid in the statistical information (Figure 3) for the YRB region, i.e., the tendency for the Tmax QTs to increase from low to high percentile and the consistent warming of the Tmin QTs at each percentile. Specifically, the uniform features of Tmin are very stable for the YRB region, with the shape of the QTs distribution (outlines of the violin plot, Figure 3) being almost identical for all percentiles. Tmin QTs exhibit a warming of 0.2°C/10a at the median for all selected percentiles, and the majority (over 80%) of the data in the region show warming trends. For Tmax QTs, the shape of the distribution is also consistently spread across the percentiles, but as the quartiles increase, the overall distribution of Tmax QTs shifts upwards (i.e., shifts towards warming). As a result, the 10th percentile of Tmax shows a clear cooling QT (i.e., ∼−0.1°C/10a at the median) and 75% of the data in the YRB region agree with the cooling, while the 90th percentile of Tmax is closer to Tmin QTs (Figure 3). In addition, we can also find that the rate of increase in the QTs of Tmax from the low to high percentiles raises rapidly from −0.1°C/10a at the median to about 0.1°C/10a at the median in the low to medium percentiles (i.e., 10th∼50th, Figure 3). However, in the 50th∼90th interval, Tmax QTs increase at less than half the rate of the 10th∼50th interval. Therefore, it can be inferred from the above results that the tendency of the Tmax intra-quantile QTs identified in the YRB region may be largely attributed to changes in the lower percentiles (e.g., 10th).
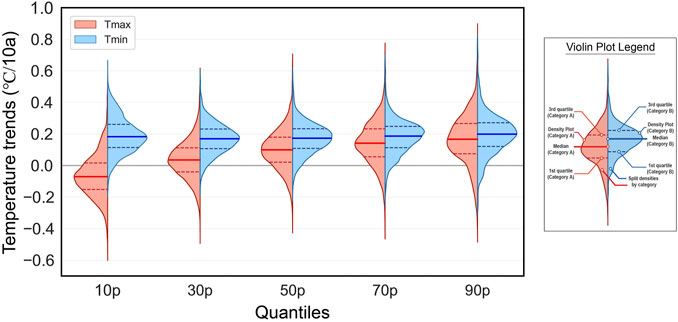
FIGURE 3. Violin plot (showing kernel density estimate of distribution) of running window quantile trends at 10th, 30th, 50th, 70th, and 90th percentiles for all the grid points at the YRB region, with the differences between Tmax (red) and Tmin (blue). Note that the quantile trend analysis for each point is exactly the same as Figure 2. The number of data in each violin is: 45 different running window trends × 318 (265) grid points of Tmax (Tmin) in the YRB region. The meanings of each element within the violin plot can be found in the attached legend box.
The Role of Non-mean Factors in the Tmax and Tmin Trends
From the above sections, we show that the features of QTs between Tmax and Tmin evidently differ from each other. Specifically, evident differences of Tmax QTs among percentiles are observed over the YRB region, whereas QTs of Tmin show consistent warming nationally. Why there are distinct (consistent) QTs of Tmax (Tmin) among percentiles? Previous studies have demonstrated that the changing STD plays an important role in changes of temperature extremes, causing asymmetric responses of temperature between low and high percentiles (McKinnon et al., 2016; Li et al., 2017; Tamarin-Brodsky et al., 2020). Hence in this part, we will discuss the relative contributions of changing mean state and STD on the QTs of Tmax and Tmin.
Figure 4 shows the spatial features of Tmax and Tmin trends in the 10th and 90th percentiles due to changing STD and their relative contributions. As we expected, the changing STD of Tmax caused a broad cooling (warming) trends in the 10th (90th) percentile over the most parts in the south of China (i.e., to the south of 35°N), especially for the YRB region with a cooling (warming) trend of up to ±0.3°C/10a (Figures 4A1,A2). Furthermore, relative contributions of changing STD on Tmax QTs at 10th and 90th percentiles in all grids are also calculated (Figures 4B1,B2). Results show that the absolute magnitudes of Tmax QTs due to changing STD contribute over 70% of the whole Tmax trends in both 10th and 90th percentiles over the majority of the YRB region (Figures 4B1,B2). In addition, further investigations regarding the detailed reasons of the changing STD are also conducted. According to McKinnon et al. (2016), we can roughly express the spatial patterns of temperatures’ QTs due to variance, skewness, and kurtosis by the first three modes of Empirical Orthogonal Function (EOF) analysis on the intra-quantile variations of temperatures QTs. The EOF results of intra-quantile modes of Tmax trends are shown in Figure 5. Looking at the principal components of the EOF, the first mode shows a clear non-linear trend characteristic and the large variation areas in the spatial distribution are also highly consistent with the variability-dominated YRB regions that we focus on (Figures 5A1,B1). This leading model can represent the effect of changes in temperature variance on the temperature QTs across percentiles based on the findings of McKinnon et al. (2016). Obviously, we can further conclude that the observed quantile features of Tmax trends in YRB due to changing STD are mainly caused by changes in variance of Tmax from the evidence (e.g., the percent variance of the first EOF mode reaches 80.2%) of EOF results. In addition, the variance contributions are smaller for the second and third EOF modes (i.e., only 10.1% and 3.4% for EOF2 and EOF3), which can also represent the effect of temperature skewness and kurtosis changes on Tmax intra-quantile QTs, respectively (Figures 5A2,B2,A3,B3).
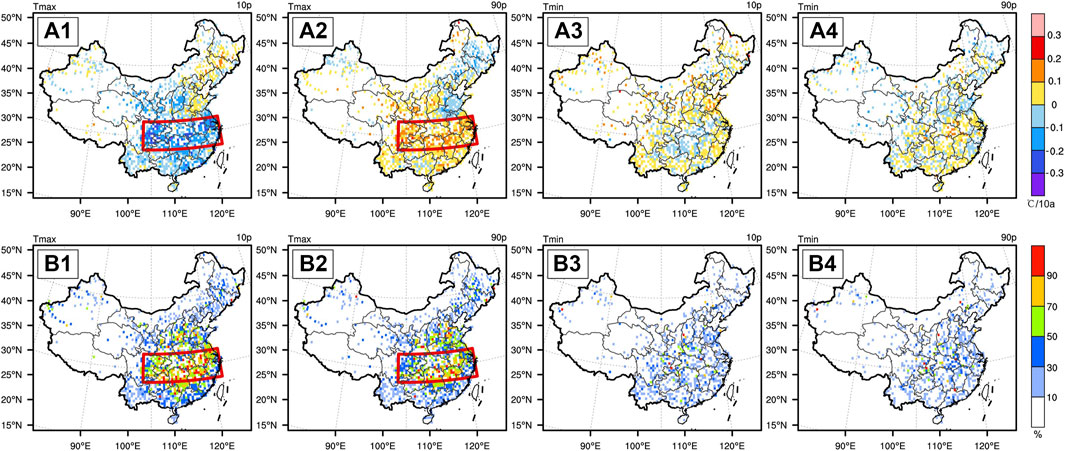
FIGURE 4. The quantile trends of Tmax (A1,A2) and Tmin (A3,A4) at 10th and 90th percentiles due to the changing shape of temperature distribution and their relative contributions [Tmax: (B1,B2); Tmin: (B3,B4)]. The meaning of red boxes is the same as Figure 1.
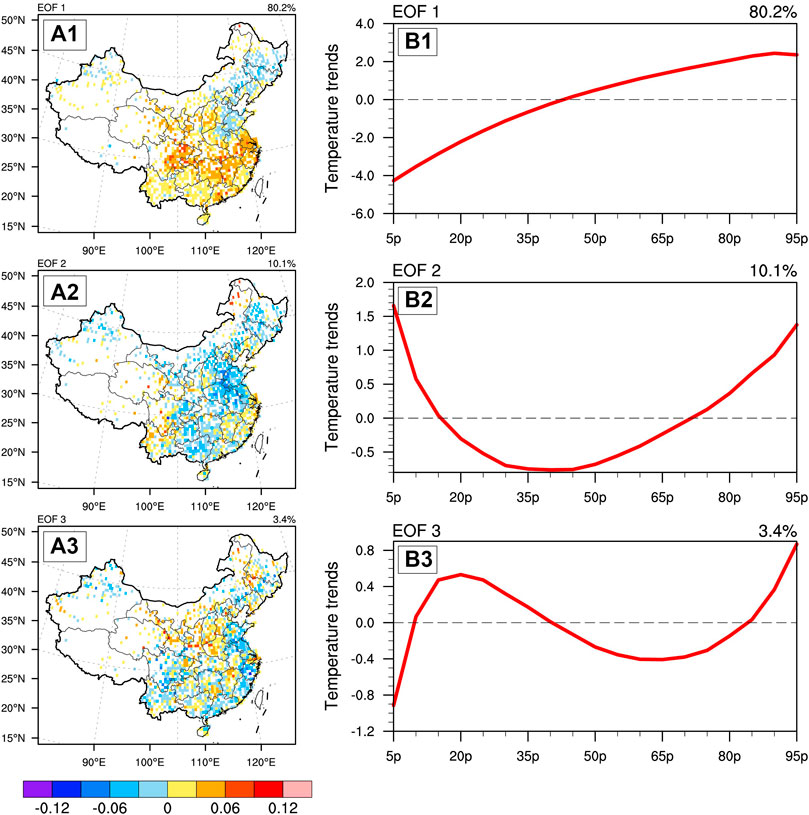
FIGURE 5. The first three empirical orthogonal function leading modes (A1–A3) of the intra-quantile variations of Tmax in China, and the corresponding principal component (B1–B3). Note that the percent variance of each mode can be found in the upper right of each plot.
Contrasting with Tmax trends, the magnitudes of Tmin trends and the contributions due to the changing STD are still weak (Figures 4A3,A4,B3,B4), which is consistent with the above-mentioned mean state warming-induced uniformly pattern of Tmin trends. In addition, our current results generally agree with McKinnon et al. (2016), which also shows some hotspots regarding the variance-induced Tmax trends over the north of 30°N.
To sum up, all the above results highlight the non-negligible role of changing STD (especially increasing variance) on Tmax trends during the past decades in the context of global warming, particularly for some variance-sensitive regions (e.g., YRB). These also imply that the summers in the YRB region have become more and more volatile during the past 57 years, i.e., accelerated warming in the high percentiles (i.e., 90th∼99th) of Tmax with rapid increases of extreme hot events (e.g., deadly heatwaves).
Discussion and Conclusion
In the above sections, the quantile features of Tmax and Tmin trends over China during the past half-century are investigated. The evident differences between Tmax and Tmin trends are observed over the YRB region, i.e., “variance-induced region-specific trends patterns of Tmax” versus “mean state shift-dominated uniform warmings of Tmin”. In particular, for Tmax, we emphasized the non-negligible role of temperature variance changes in modulating Tmax trends. However, in addition to the above conclusions, there are several additional caveats that should be highlighted and discussed.
First, we discuss whether such quantile features and patterns of Tmax trends are still pronounced in the sub-seasonal scale (i.e., monthly). As a matter of fact, the current results represent the observed robust region-specific variance-induced Tmax trends in the view of seasonal scale. Hence, we further repeated our QR analysis for each month in summer (i.e., June, July, and August) in order to investigate the QTs of temperatures for sub-seasonal scale. The results generally show that the observed differences between Tmax and Tmin as well as the different patterns of Tmax trends between low and high percentiles over the YRB region are still existent and significantly pronounced (Supplementary Figures S4–S6). Despite these similarities, stronger variance-induced distinctive Tmax trends between high and low percentiles are also observed in late summer than in early summer (i.e., August vs. June). In brief, the sub-seasonal features of Tmax trends show not only consistency with seasonal scale but also additional unique different features among each month.
Second, we note that variance-induced robust increasing trends of Tmax only occur in the YRB region, so why is this such a unique regional signature? In summer, the baroclinicity and circulation variability over mid-latitudes of East Asia are much weaker than those in winter half year. Therefore, the temperature variability is less impacted by mid-latitude dynamics, e.g., cold front or cold air intrusion. In contrast, temperature, and particularly Tmax, is more sensitive to radiative processes, involving cloud cover and rainfall. Several studies have highlighted the importance of covariability between mean temperature and precipitation (e.g., Trenberth and Shea, 2005; Miao et al., 2016; Guo et al., 2020). This relationship may also be valid for the coupling between temperature variability and precipitation variability at summertime. During summer, the synoptic-to-subseasonal scale precipitation variation is typically negatively correlated with temperature, especially Tmax, as cloud cover and precipitation apparently reduce incoming shortwave radiation and thus Tmax. Therefore, it comes naturally to speculate that if the precipitation at any location varies strongly, then the Tmax will also exhibit strong variations. We further examined whether the variance-induced Tmax trends in the YRB region are linked with the strength of intraseasonal variability of precipitation. As we expected, both intra-seasonal Tmax variability (Figure 6A) and precipitation variability (Figure 6B) in summer show a very similar pattern of robust increasing trends, and only in the YRB region. This also implies that the variability of summer precipitation in the YRB region is plausibly the physical essence of variance-induced increasing trends of Tmax. The factors that control the combined intra-seasonal variability of temperature-precipitation over the YRB region, however, require detailed exploration in subsequent studies. Nevertheless, although a quantitative and deterministic analysis for the physical mechanisms is beyond the scope of our current study, some evidence regarding the causes of changing temperature variability has been discussed in several recent studies (e.g., Hsu et al., 2017; Zhu et al., 2020). For instance, Hsu et al. (2017) demonstrated that the boreal summer intraseasonal oscillation could modulate the occurrence of the heatwaves for the monsoon regions. In particular for the YRB region, the 10–30 days boreal summer intraseasonal oscillation is closely linked to the increases in heatwave occurrence. For modeling evidence, a growing number of studies have focused on the dynamic causes (i.e., thermal advections, circulation changes, and land-atmosphere interactions) of the increasing temperature variability over Europe in the context of global warming (e.g., Andrade et al., 2012; Douville et al., 2016; Holmes et al., 2016). These results provide constructive clues and insights for the physical causes of the covariability of Tmax-precipitation over the YRB region.
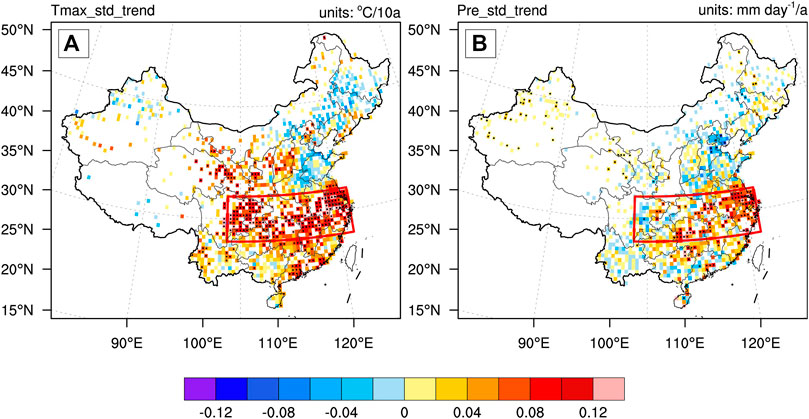
FIGURE 6. The trends of the standard deviations of Tmax (A), units: °C/10a; and precipitation (B), units: mm day−1/a at summer days (June-July-August) during 1961–2017. The meanings of stippling regions and the red boxes are the same as Figure 1.
In addition, it is worth noting that the “trends” of Tmax and Tmin in our study only represent the observed trends during the past 57 years. Whether these quantile features of “trends” are long-term trends or just an increasing phase of some multi-decadal scale variations is unknown due to the limitation of observation record. From another perspective, it is more concerned that the “trends” is a signal (from anthnographic forcings) or a noise (internal variability of the climate system). In future studies, we can use the model results (e.g., CMIP5/6 simulations) to investigate such quantile features of Tmax trends or the changing variability as well as the possible mechanisms, particularly for the YRB region. Some modeling evidence has been highlighted regarding the variations of temperature variability in several studies (Gregory and Mitchell, 1995; Rowell, 2005; Fischer and Schär, 2008; Holmes et al., 2016; Chan et al., 2020). For example, Chan et al. (2020) revealed that there are strong couplings between warming and increasing variability in various CMIP5 models in the context of RCP8.5 projections, especially for mid-latitude regions (e.g., Europe, southeastern China). This also implies that higher warming of mean temperature probably accompanies by a higher increase in temperature variability in the high-emission scenario. The compound effects of increasing mean and variability of temperature could significantly increase the risk from potentially deadly heatwaves (Mora et al., 2017; Baldwin et al., 2019).
In summary, the unique quantile features of temperatures’ trends in summer over China are shown in the current study. The most important added value of our study is identifying a variance-dominated pattern of Tmax trends for the YRB region compared with the previous mean state shift-induced warming pattern. Such compounded increasing variability and the uniform global warming in the mean state could subsequently cause parts of the world exposed to increasing risks of the potential deadly heatwave (Chan et al., 2020). We highlighted that the anthropogenic contributions and the physical mechanisms of the increasing temperature variability should be paid more attention to in future works in order to better plan strategies of adaptation and mitigation solutions for the possible upcoming more intense extremes and disasters.
Data Availability Statement
The data analyzed in this study is subject to the following licenses/restrictions: We acknowledge China Meteorology Administration (CMA) for providing the homogenized daily maximum and minimum surface air temperature and precipitation data of China. Requests to access these datasets should be directed to China Meteorological Data Service Centre, http://data.cma.cn/en.
Author Contributions
XnL, HM, WH, and SS contributed to conception and design of the study. DW and CG organized the database. XnL and XaL performed the statistical analysis. XnL wrote the first draft of the manuscript. XnL, XaL, and HM wrote sections of the manuscript. All authors contributed to manuscript revision and read and approved the submitted version.
Funding
This study was jointly supported by the National Natural Science Foundation of China (grants 41905080 and 41905065), the Shanghai Sailing Program (grant number 19YF1443800), the Joint Open Project of Key Laboratory of Meteorological Disaster, Ministry of Education and Collaborative Innovation Center on Forecast and Evaluation of Meteorological Disasters, NUIST (KLME202002), and the funding of NSFC (41905054).
Conflict of Interest
The authors declare that the research was conducted in the absence of any commercial or financial relationships that could be construed as a potential conflict of interest.
Publisher’s Note
All claims expressed in this article are solely those of the authors and do not necessarily represent those of their affiliated organizations, or those of the publisher, the editors, and the reviewers. Any product that may be evaluated in this article, or claim that may be made by its manufacturer, is not guaranteed or endorsed by the publisher.
Acknowledgments
We acknowledge China Meteorology Administration (CMA) for providing the homogenized daily maximum and minimum surface air temperature and precipitation data of China (available at http://data.cma.cn/en), as well as the “statsmodels” and the “seaborn” groups for their useful python packages (can be downloaded from https://www.statsmodels.org/stable/index.html and http://seaborn.pydata.org/index.html).
Supplementary Material
The Supplementary Material for this article can be found online at: https://www.frontiersin.org/articles/10.3389/feart.2021.762563/full#supplementary-material
References
Andrade, C., Leite, S. M., and Santos, J. A. (2012). Temperature Extremes in Europe: Overview of Their Driving Atmospheric Patterns. Nat. Hazards Earth Syst. Sci. 12(5), 1671–1691. doi:10.5194/nhess-12-1671-2012
Baldwin, J. W., Dessy, J. B., Vecchi, G. A., and Oppenheimer, M. (2019). Temporally Compound Heat Wave Events and Global Warming: An Emerging hazard. Earth's Future. 7(4), 411–427. doi:10.1029/2018EF000989
Cade, B. S., and Noon, B. R. (2003). A Gentle Introduction to Quantile Regression for Ecologists. Front. Ecol. Environ. 1(8), 412–420. doi:10.1890/1540-9295(2003)001[0412:agitqr]2.0.co;2
Cao, L., Zhu, Y., Tang, G., Yuan, F., and Yan, Z. (2016). Climatic Warming in China According to a Homogenized Data Set from 2419 Stations. Int. J. Climatol. 36(13), 4384–4392. doi:10.1002/joc.4639
Chai, R., Sun, S., Chen, H., and Zhou, S. (2018). Changes in Reference Evapotranspiration over China during 1960-2012: Attributions and Relationships with Atmospheric Circulation. Hydrological Process. 32(19), 3032–3048. doi:10.1002/hyp.13252
Chan, D., Cobb, A., Zeppetello, L. R. V., Battisti, D. S., and Huybers, P. (2020). Summertime Temperature Variability Increases with Local Warming in Midlatitude Regions. Geophys. Res. Lett. 47(13), e2020GL087624. doi:10.1029/2020GL087624
Chen, Y., and Zhai, P. (2017). Revisiting Summertime Hot Extremes in China during 1961-2015: Overlooked Compound Extremes and Significant Changes. Geophys. Res. Lett. 44(10), 5096–5103. doi:10.1002/2016GL072281
Davy, R., Esau, I., Chernokulsky, A., Outten, S., and Zilitinkevich, S. (2017). Diurnal Asymmetry to the Observed Global Warming. Int. J. Climatol. 37(1), 79–93. doi:10.1002/joc.4688
Deng, K., Yang, S., Ting, M., Zhao, P., and Wang, Z. (2019). Dominant Modes of China Summer Heat Waves Driven by Global Sea Surface Temperature and Atmospheric Internal Variability. J. Clim. 32(12), 3761–3775. doi:10.1175/JCLI-D-18-0256.1
Ding, Y., Ren, G., Zhao, Z., Xu, Y., Luo, Y., Li, Q., et al. (2007). Detection, Causes and Projection of Climate Change over China: An Overview of Recent Progress. Adv. Atmos. Sci. 24(6), 954–971. doi:10.1007/s00376-007-0954-4
Douville, H., Colin, J., Krug, E., Cattiaux, J., and Thao, S. (2016). Midlatitude Daily Summer Temperatures Reshaped by Soil Moisture under Climate Change. Geophys. Res. Lett. 43(2), 812–818. doi:10.1002/2015GL066222
Fischer, E. M., and Schär, C. (2008). Future Changes in Daily Summer Temperature Variability: Driving Processes and Role for Temperature Extremes. Clim. Dyn. 33(7), 917, 935. doi:10.1007/s00382-008-0473-8
Gregory, J. M., and Mitchell, J. F. B. (1995). Simulation of Daily Variability of Surface Temperature and Precipitation over Europe in the Current and 2 × Co2 Climates Using the UKMO Climate Model. Q.J R. Met. Soc. 121(526), 1451–1476. doi:10.1002/qj.49712152611
Guo, J., Yan, Y., Chen, D., Lv, Y., Han, Y., Guo, X., et al. (2020). The Response of Warm-Season Precipitation Extremes in China to Global Warming: an Observational Perspective from Radiosonde Measurements. Clim. Dyn. 54(9), 3977–3989. doi:10.1007/s00382-020-05216-3
Holmes, C. R., Woollings, T., Hawkins, E., and de Vries, H. (2016). Robust Future Changes in Temperature Variability under Greenhouse Gas Forcing and the Relationship with thermal Advection. J. Clim. 29(6), 2221–2236. doi:10.1175/JCLI-D-14-00735.1
Hsu, P.-C., Lee, J.-Y., Ha, K.-J., and Tsou, C.-H. (2017). Influences of Boreal Summer Intraseasonal Oscillation on Heat Waves in Monsoon Asia. J. Clim. 30(18), 7191–7211. doi:10.1175/JCLI-D-16-0505.1
Hu, L., Huang, G., and Qu, X. (2017). Spatial and Temporal Features of Summer Extreme Temperature over China during 1960-2013. Theor. Appl. Climatol. 128(3), 821–833. doi:10.1007/s00704-016-1741-x
Koenker, R., and Bassett, G. (1978). Regression Quantiles. Econometrica. 46(1), 33–50. doi:10.2307/1913643
Li, J., Li, X., Li, X., Chen, L., and Jin, L. (2019). Observed Multi-Timescale Differences between Summertime Near-Surface Equivalent Temperature and Temperature for China and Their Linkage with Global Sea Surface Temperatures. Atmosphere. 10(8), 447. doi:10.3390/atmos10080447
Li, L., and Zha, Y. (2019). Satellite-based Regional Warming Hiatus in China and its Implication. Sci. Total Environ. 648, 1394–1402. doi:10.1016/j.scitotenv.2018.08.233
Li, Q., Yang, S., Xu, W., Wang, X. L., Jones, P., Parker, D., et al. (2015). China Experiencing the Recent Warming Hiatus. Geophys. Res. Lett. 42(3), 889–898. doi:10.1002/2014GL062773
Li, X., Chen, H., Liao, H., Hua, W., Sun, S., Ma, H., et al. (2017). Potential Effects of Land Cover Change on Temperature Extremes over Eurasia: Current versus Historical Experiments. Int. J. Climatol. 37(S1), 59–74. doi:10.1002/joc.4976
Liu, L., Guo, J., Chen, W., Wu, R., Wang, L., Gong, H., et al. (2018). Large-scale Pattern of the Diurnal Temperature Range Changes over East Asia and Australia in Boreal winter: a Perspective of Atmospheric Circulation. J. Clim. 31(7), 2715–2728. doi:10.1175/JCLI-D-17-0608.1
McKinnon, K. A., Rhines, A., Tingley, M. P., and Huybers, P. (2016). The Changing Shape of Northern Hemisphere Summer Temperature Distributions. J. Geophys. Res. Atmos. 121(15), 8849–8868. doi:10.1002/2016JD025292
Miao, C., Sun, Q., Borthwick, A. G. L., and Duan, Q. (2016). Linkage between Hourly Precipitation Events and Atmospheric Temperature Changes over China during the Warm Season. Sci. Rep. 6(1), 22543. doi:10.1038/srep22543
Mora, C., Dousset, B., Caldwell, I. R., Powell, F. E., Geronimo, R. C., Bielecki, C. R., et al. (2017). Global Risk of Deadly Heat. Nat. Clim Change. 7(7), 501–506. doi:10.1038/nclimate3322
Mueller, N. D., Butler, E. E., McKinnon, K. A., Rhines, A., Tingley, M., Holbrook, N. M., et al. (2016). Cooling of US Midwest Summer Temperature Extremes from Cropland Intensification. Nat. Clim Change. 6(3), 317–322. doi:10.1038/nclimate2825
IPCC. (2018). Summary for Policymakers. In: Global Warming of 1.5°C. An IPCC Special Report on the Impacts of Global Warming of 1.5°C above Pre-industrial Levels and Related Global Greenhouse Gas Emission Pathways, in The Context of Strengthening the Global Response to the Threat of Climate Change, Sustainable Development, and Efforts to Eradicate Poverty [Masson-Delmotte, V., P. Zhai, H.-O. Pörtner, D. Roberts, J. Skea, P. R. Shukla, A. Piraniet al. (eds.)]. World Meteorological Organization, Geneva, Switzerland, 32 pp. Retrieved from https://www.ipcc.ch/site/assets/uploads/sites/2/2019/05/SR15_SPM_version_stand_alone_LR.pdf
Qian, C., Zhang, X., and Li, Z. (2019). Linear Trends in Temperature Extremes in China, with an Emphasis on Non-gaussian and Serially Dependent Characteristics. Clim. Dyn. 53(1), 533–550. doi:10.1007/s00382-018-4600-x
Qian, W., and Qin, A. (2006). Spatial-temporal Characteristics of Temperature Variation in China. Meteorol. Atmos. Phys. 93(1), 1–16. doi:10.1007/s00703-005-0163-6
Rowell, D. P. (2005). A Scenario of European Climate Change for the Late Twenty-First century: Seasonal Means and Interannual Variability. Clim. Dyn. 25(7), 837–849. doi:10.1007/s00382-005-0068-6
Schär, C., Vidale, P. L., Lüthi, D., Frei, C., Häberli, C., Liniger, M. A., et al. (2004). The Role of Increasing Temperature Variability in European Summer Heatwaves. Nature. 427(6972), 332–336. doi:10.1038/nature02300
Screen, J. A. (2014). Arctic Amplification Decreases Temperature Variance in Northern Mid- to High-Latitudes. Nat. Clim Change. 4(7), 577–582. doi:10.1038/nclimate2268
Seabold, S., and Perktold, J. (2010). “Statsmodels: Econometric and Statistical Modeling with python”, in: Proceedings of the 9th Python in Science Conference, eds. S.v.d. (Austin, Texas: Walt & J. Millman), 92–96. doi:10.25080/Majora-92bf1922-011
IPCC. (2013). Climate Change 2013: The Physical Science Basis. Contribution Of Working Group I to the Fifth Assessment Report Of the Intergovernmental Panel On Climate Change [T. F. Stocker, D. Qin, G.-K. Plattner, M. Tignor, S. K. Allen, J. Boschunget al. (eds.)]. Cambridge University Press, Cambridge, United Kingdom and New York, NY, USA, 1535. doi:10.1017/CBO9781107415324
Sun, Y., Hu, T., and Zhang, X. (2018). Substantial Increase in Heat Wave Risks in China in a Future Warmer World. Earth's Future. 6(11), 1528–1538. doi:10.1029/2018EF000963
Sun, Y., Zhang, X., Zwiers, F. W., Song, L., Wan, H., Hu, T., et al. (2014). Rapid Increase in the Risk of Extreme Summer Heat in Eastern China. Nat. Clim Change. 4(12), 1082–1085. doi:10.1038/nclimate2410
Tamarin-Brodsky, T., Hodges, K., Hoskins, B. J., and Shepherd, T. G. (2020). Changes in Northern Hemisphere Temperature Variability Shaped by Regional Warming Patterns. Nat. Geosci. 13(6), 414–421. doi:10.1038/s41561-020-0576-3
Trenberth, K. E., and Shea, D. J. (2005). Relationships between Precipitation and Surface Temperature. Geophys. Res. Lett. 32(14), a, n. doi:10.1029/2005GL022760
IPCC. (2012). Managing the Risks of Extreme Events and Disasters to Advance Climate Change Adaptation. A Special Report Of Working Groups I and II of the Intergovernmental Panel On Climate Change [Field, C.B., V. Barros, T. F. Stocker, D. Qin, D. J. Dokken, K. L. Ebi, M. D. Mastrandreaet al. (eds.)]. Cambridge University Press, Cambridge, United Kingdom and New York, NY, USA, 582 pp. doi:10.1017/CBO9781139177245
IPCC. (2021). Summary for Policymakers. In: Climate Change 2021: The Physical Science Basis. Contribution Of Working Group I to the Sixth Assessment Report Of the Intergovernmental Panel On Climate Change [MassonDelmotte, V.P. Zhai, A. Pirani, S. L. Connors, C. Péan, S. Bergeret al. (eds.)]. Cambridge University Press. In Press. Retrieved from https://www.ipcc.ch/report/ar6/wg1/downloads/report/IPCC_AR6_WGI_SPM.pdf
Wang, J., Chen, Y., Tett, S. F. B., Yan, Z., Zhai, P., Feng, J., et al. (2020). Anthropogenically-driven Increases in the Risks of Summertime Compound Hot Extremes. Nat. Commun. 11(1), 528. doi:10.1038/s41467-019-14233-8
Xia, J., Tu, K., Yan, Z., and Qi, Y. (2016). The Super-heat Wave in Eastern China during July-August 2013: a Perspective of Climate Change. Int. J. Climatol. 36(3), 1291–1298. doi:10.1002/joc.4424
Xia, X. (2013). Variability and Trend of Diurnal Temperature Range in China and Their Relationship to Total Cloud Cover and sunshine Duration. Ann. Geophys. 31(5), 795–804. doi:10.5194/angeo-31-795-2013
Xu, W., Li, Q., Wang, X. L., Yang, S., Cao, L., and Feng, Y. (2013). Homogenization of Chinese Daily Surface Air Temperatures and Analysis of Trends in the Extreme Temperature Indices. J. Geophys. Res. Atmos. 118(17), 9708–9720. doi:10.1002/jgrd.50791
Xu, Z., Tang, Y., Connor, T., Li, D., Li, Y., and Liu, J. (2017). Climate Variability and Trends at a National Scale. Sci. Rep. 7(1), 3258. doi:10.1038/s41598-017-03297-5
Xue, W., Guo, J., Zhang, Y., Zhou, S., Wang, Y., Miao, Y., et al. (2019). Declining Diurnal Temperature Range in the North China Plain Related to Environmental Changes. Clim. Dyn. 52(9), 6109–6119. doi:10.1007/s00382-018-4505-8
Yang, S., and Li, Q. (2014). Improvement in Homogeneity Analysis Method and Update of China Precipitation Data. Adv. Clim. Change Res. (in Chinese). 10(4), 276–281. doi:10.3969/j.issn.1673-1719.2014.04.008
Yang, Y., Lin, Z., Luo, L., Zhang, Y., and Li, Z. (2021). Inhomogeneous Trends in the Onset Date of Extreme Hot Days in China over the Last Five Decades. Atmos. Oceanic Sci. Lett. 14(6), 100080. doi:10.1016/j.aosl.2021.100080
Yin, J., Gentine, P., Zhou, S., Sullivan, S. C., Wang, R., Zhang, Y., et al. (2018). Large Increase in Global Storm Runoff Extremes Driven by Climate and Anthropogenic Changes. Nat. Commun. 9(1), 4389. doi:10.1038/s41467-018-06765-2
Keywords: extreme temperature, quantile trends, variability, China, summertime
Citation: Li X, Li X, Ma H, Hua W, Sun S, Wang D and Gao C (2021) Observed Quantile Features of Summertime Temperature Trends over China: Non-Negligible Role of Temperature Variability. Front. Earth Sci. 9:762563. doi: 10.3389/feart.2021.762563
Received: 22 August 2021; Accepted: 28 October 2021;
Published: 07 December 2021.
Edited by:
Anning Huang, Nanjing University, ChinaReviewed by:
Guolin Feng, National Climate Center, ChinaZhaohui Lin, Institute of Atmospheric Physics (CAS), China
Jianping Guo, Chinese Academy of Meteorological Sciences, China
Copyright © 2021 Li, Li, Ma, Hua, Sun, Wang and Gao. This is an open-access article distributed under the terms of the Creative Commons Attribution License (CC BY). The use, distribution or reproduction in other forums is permitted, provided the original author(s) and the copyright owner(s) are credited and that the original publication in this journal is cited, in accordance with accepted academic practice. No use, distribution or reproduction is permitted which does not comply with these terms.
*Correspondence: Xing Li, bHhfY3VpdEAxNjMuY29t