
94% of researchers rate our articles as excellent or good
Learn more about the work of our research integrity team to safeguard the quality of each article we publish.
Find out more
ORIGINAL RESEARCH article
Front. Earth Sci., 12 November 2021
Sec. Geohazards and Georisks
Volume 9 - 2021 | https://doi.org/10.3389/feart.2021.760464
This article is part of the Research TopicNew Development of Underground Energy Storage Using Mine SpaceView all 28 articles
In response to the Paris climate agreement, the Chinese government has taken actions to improve the energy structure by reducing the share of coal-fired thermal power and increasing the use of clean energy. However, due to the extreme shortage of large-scale energy storage facilities, the utilization efficiency of wind and solar power remains low. This paper proposes to use abandoned coal mine goafs serving as large-scale pumped hydro storage (PHS) reservoir. In this paper, suitability of coal mine goafs as PHS underground reservoirs was analyzed with respects to the storage capacity, usable capacity, and ventilation between goaf and outside. The storage capacity is 1.97 × 10⁶ m3 for a typical mining area with an extent of 3 × 5 km2 and a coal seam thickness of 6 m. A typical goaf-PHS system with the energy type
China’s coal-heavy primary energy structure causes environmental pollution and massive carbon dioxide emission (Chen et al., 2019). In 2016, China produced 10.5 billion tons of carbon dioxide emission by fossil fuel burning, severely affecting the global climate change. In response to the Paris climate agreement, the Chinese government is taking actions to improve the energy structure, that is, to increase the share of clean energy while reducing the use of fossil fuel (Pan et al., 2018; Li and Chen, 2019). However, due to the extreme shortage of large-scale energy storage (LSES) facilities, the utilization efficiency of wind and solar power remains low (Bai et al., 2015). By the end of 2018, 22 operational PHS plants were distributed in the coastal region or in eastern China (Figure 1), with an installed capacity of 19.23 GW, entirely insufficient for the largest wind-solar power market in China (Davidson et al., 2016).
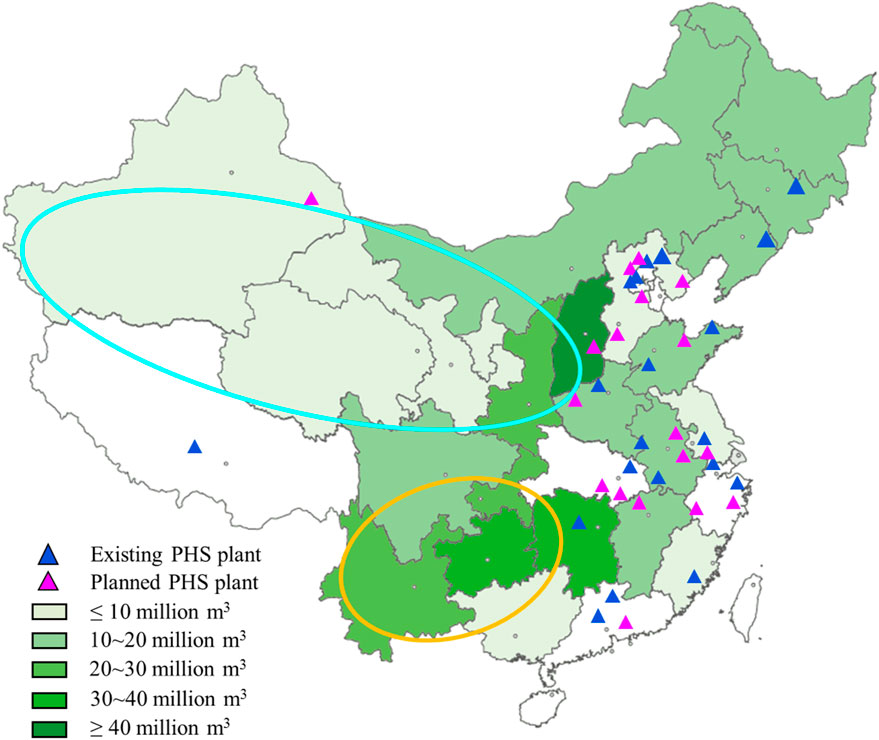
FIGURE 1. Distribution of pumped hydro energy storage plants and underground space of the shutdown coal mines in Mainland China.
Among the existing energy storage technologies, only compressed air energy storage (CAES) and pumped hydroelectric storage (PHS) are cost-effective at large temporal scales, from several hours to many days (Zhao et al., 2015; Rogeau et al., 2017; Collado et al., 2018; Pali and Vadhera, 2018; Tung et al., 2018). Large-scale CAES is known to require specific geological conditions to store high pressure air/gas (Parkes et al., 2018), while the PHS appears to be relatively more mature and reliable (Hunt et al., 2014; Kapila et al., 2017; Ruppert et al., 2017; Hunt et al., 2018). In the wind and solar energy rich northwestern and southwestern China, scarce PHS plants are available for LSES for the abundant energy (Figure 1), because of the difficulty in site selection and water shortage.
As of now, the number of abandoned mines, including coal mines, metal mines, and chemical mines (non-metallic mine), is estimated to exceed one million, worldwide. In China, the number of documented closed coal mines reaches 3,868 with more than a productive capacity of 350 million (Xie and Liu, 2018) and the other abandoned coal mines are roughly estimated at 12,000 (Zhongguang et al., 2019). During extraction of mineral resources from underground deposits, shafts and extensive galleries are excavated. These underground voids are usually left to be flooded, but often perpetual costs related to pumping to keep a safe water level or water treatment have to be maintained, becoming long-term liabilities. Some renewable/sustainable post-mining solutions including underground reservoirs (Andrés et al., 2017), hydro-pumped energy storage (PHES) (Menéndez et al., 2017; Pujades et al., 2017), compressed air energy storage (CAES) (Kim et al., 2012; Fan et al., 2018a), thermal energy storage (Al-Habaibeh et al., 2018), and underground hydrogen storage (Simon et al., 2015) were proposed and proved viable by some researchers. The first documented CAES test using an abandoned mine was conducted in Japan. In the United States, an abandoned limestone mine was planned to be converted into a CAES plant with a capacity of 2700 MW. In South Africa, the viability of deep level gold mines transferred into underground pumped hydroelectric energy storage in the Far West Rand gold field were by Winde (Winde et al., 2017). It is reported that the Prosper-Haniel coal mine, Germany, planned to be converted into a 200 MW PHS plant (Fan et al., 2016; Fan et al., 2017). Menéndez et al. (2018) proposed to develop underground PHS plants by using underground tunnel/roadway networks of more than 30 closed coal mines in the Asturian Central Coal Basin of Spain. However, the roadway space in a mine is limited and insufficient for LSES.
Considering the goafs’ considerable space capable for LSES and simultaneously reduce water evaporation, a concept of PHS system using underground coal mine goafs (goaf-PHS) was put forward (Fan et al., 2020). In arid regions of northwest China, water-preserved mining is the only option for coal mining. Wang et al. investigated the basic conditions and mechanisms of goaf water storage, providing an effective approach for large-scale goaf water reservoirs in the arid regions (Wang et al., 2018). Gu et al. proposed a technical approach of storage and utilization of mine water through underground reservoirs in coal mine. Currently, 32 coal mine underground reservoirs have been established in the Shendong Mining Area and can effectively alleviate the scarcity of local production and domestic water (Gu, 2015). Aforementioned researches demonstrate the enormous potential capacity of underground coal mine goafs served as water reservoirs for PHS plants. Nevertheless, the details on the goaf reservoirs, such as the storage capacity, the useful volume, environmental issues, and the performance of the goaf-PHS system, are still unclear.
This paper proposes a hybrid PHS system using underground coal mine goafs, as shown in Figure 2. The study performed a suitability analysis on goafs serving as PHS with respect to the three issues of most concern: storable volume, usable volume, and fluid exchange. Based on the estimation results of the goaf reservoir and meteorological data (solar radiation and wind speed) in northwestern China, the performance of the goaf-PHS system is evaluated. At last, the feasibility of goaf-PHS plants is discussed on the national strategic level.
The upper reservoir, which provides water storage capacity at a high level, uses underground goafs or a surface reservoir. The lower reservoir is located at the underground coal mine goafs with a greater depth to ensure a suitable water head (Figure 2). The other components of the hybrid PHS are similar with a conventional PHS plant, including wind turbines, photovoltaic generators, reversible hydraulic pumps/turbines, and penstocks. Wind turbines and photovoltaic generators are the energy receiving-conversing end of the system converting clean power into electricity. Reversible hydraulic pumps/turbines are the energy conversing-transferring devices. When electricity generation is greater than demand, the surplus electricity will drive pumps to elevate the water from the lower to the upper reservoir, storing the potential energy. When the electricity generated by wind and solar power cannot satisfy the demand, the stored water will be released to produce electricity and fill the demand gap. The two reservoirs are the energy storage facility, reserving the surplus energy in the form of water potential energy. The penstocks, surge tank, and a variety of connecting tunnels/rooms provide ancillary services for the system’s smooth operation. The system efficiency is mainly decided by the performance of receiving-conversing-transferring devices.
The energy receiving-conversing devices are mainly composed of wind turbines, photovoltaic generators, and transformer station. Wind turbines and photovoltaic generators convert the wind and solar power into electricity, respectively. Their power
where
where
The energy transferring devices include hydro-pump/turbine and penstock. The input power of a pump
where
The hydraulic turbine converts the potential energy of water in the upper reservoir into electricity, in which output power
The efficiency of a hydro-pump/turbine normally varies from 0.86 to 0.95, with water flow, head, etc. In this paper, for simplicity, it is considered constant and equal to 0.91.
Transmission over long distances results in loss of hydraulic energy, due to the friction between the fluid and pipe wall. The pressure loss
where
As coal is mined, the remained space in goafs was filled with rubbles from proof and floor surrounding rocks (Figure 3). Above the rubbles, the rock formations generate a large number of fractures and cracks due to the large displacement (Li et al., 2018). In the further rock, small displacement just induces deformation without fractures forming. The three overlaying rock zones of different fractures above the mined coal seam are known as “vertical three zones,” namely, the caving zone, the fissure zone, and the displacement zone (Jiang et al., 2016; Shu et al., 2019). After coal mining, massive fissures and pores, capable of storing water, form in the goaf. The caving zone and fissure zone contain massive pores and fissures, capable of storing water. The rock in the displacement zone only displays some micro-fractures, which has no storage capability, but has a considerable permeability due to the formation of micro-fractures (Liu et al., 2020).
The range of the caving zone and the fissure zone would vary with lithology of the overlying rock and thickness of the mined coal seam and can be estimated with numerical simulations (Dong et al., 2016), physical detection (Deng et al., 2018; Ren and Wang, 2020), or empirical models (Peng, 1984). To facilitate calculation, an empirical model was used. If the overlaying rocks are hard rocks, the height of the caving zone (
where
where
Due to the stress release in the process of mining, the rock volume would expand with the formation of new fractures and pores. After mining, the rubbles and fracture rocks will be re-compacted under the gravity of overlying strata. But there is no way to completely restore the volume. The expansion coefficient
The expansion coefficient
Mining activities also influence its underlying rocks, which will move toward the remained space after the coal is excavated, leading to new fractures. Compared with caving zone and fissure zone, the new space created within underlying rock is relatively small, thus not included in the storage space. But its permeability changes a lot, enhancing the water seepage. The influence depth
where
Water and air seepage in the goafs through rocks are assumed to be slow and follow the Darcy’s law. The water flow velocity
where
After coal excavation, overburden rocks collapse and fracture, making various sizes of fractured rock blocks to pile up within the goafs. The goaf reservoir can be considered as a type of porous medium. The storage capacity depends not only on the goaf volume, but especially on the interspace between blocks. During charging and discharging, water and air would exchange, and the permeability within the goaf determines whether the water or air can flow in and out smoothly or not. Using the expansion coefficient
Expansion coefficient
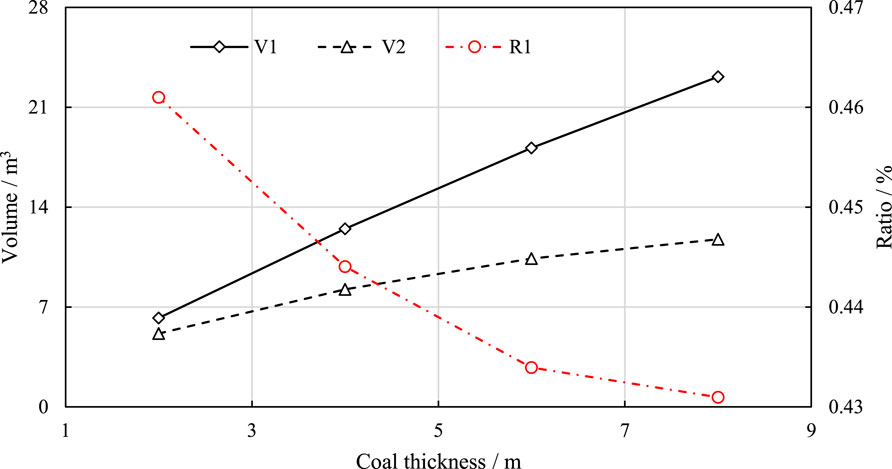
FIGURE 4. Goaf storage capacity with varying thickness of coal seam. V1 and V2 represent the total volume of goaf reservoir and admissible capacity when the water level is 17.8 m, respectively; R1 is the storage ratio, the ratio of total capacity to the volume of excavated coal.
Based on the production history of the shutdown coal mines issued by the State Administration of Coal Mine Safety and China Coal Industry Association, the storage space of the abandoned coal mine goafs could be calculated. It reaches a considerable value of 4.70 × 10⁸ m3. Figure 1 shows its distribution in the Mainland China. Taking a typical abandoned (shut down) coal mine, Yima Qianqiu coal mine in Henan province, with a dimension 3 × 5 km2 and a coal thickness of 6 m as an example, the goaf storage capacity with a water level of 17.8 m is calculated at 1.97 × 10⁶ m3.
To efficiently pump/inject water during charging/discharging, water‐collecting wells are made at the center of the goaf reservoir bottom. Water/air flow velocity within the reservoir is determined by pressure gradient and permeability. To ensure sufficient outputs of turbine and pumps, the maximum water flow should be guaranteed. The water saturation lines within the goafs were marked when the water flow in penstocks was constant at 6.25 m3/s. The maximum water level in the WCWs was set at 17.8 m in similar consideration of the maximum water head restriction [48, 49]. The minimum water level is 0. Figure 5A, B show the highest saturation line during water injection and the lowest saturation line during water releasing. As the permeability decreases, the saturation line tends to decline during injection and rise during releasing, implying a less water volume injected during filling and released during draining the reservoir, and hence a smaller usable capacity of the goaf reservoirs. Subtracting the corresponding saturation lines in Figures 5A, B, the usable coefficient relying on the permeability would be obtained for the goaf reservoirs, which are shown in Figure 6. It can be calculated that the permeability should be above 10−7 m2 to have a considerable usable capacity (
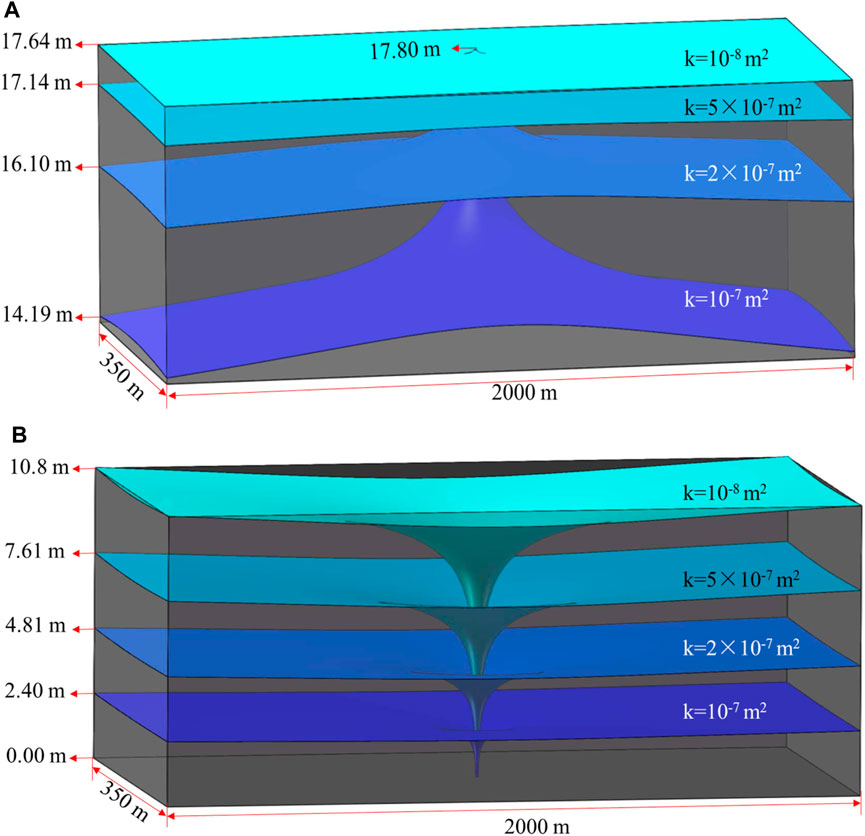
FIGURE 5. Water saturation lines in the goaf reservoirs with various permeabilities (unit: m2). (A) When the water level in the collection well reaches its maximum, 17.8 m; (B) When the water level in the collection well drops to 0 m; to efficiently pump/inject water during charging/discharging, water-collecting wells are made at the center of the goaf reservoir bottom. Water/air flow velocity within the reservoir is determined by pressure gradient and permeability. To ensure sufficient outputs of turbine and pumps, the maximum water flow should be guaranteed. The water saturation lines within the goafs were marked when the water flow in penstocks was constant at 6.25 m3/s. The maximum water level in the WCWs was set at 17.8 m in similar consideration of the maximum water head restriction (Bai et al., 2017; Pang et al., 2018). The minimum water level is 0. Figures 5A,B show the highest saturation line during water injection and the lowest saturation line during water releasing. As the permeability decreases, the saturation line tends to decline during injection and rise during releasing, implying a less water volume injected during filling and released during draining the reservoir and hence a smaller usable capacity of the goaf reservoirs.
Ventilation shafts are excavated to connect the atmosphere with goafs for air smooth exchange during water pumping and injecting (Figure 7). The location of the shaft is selected at the center of the goaf and its bottom is 2 m above the maximum water level in the reservoir. The shaft dimension closely effects pressure loss of passing air. The length is determined by the nature of goaf (depth of coal seam). Figure 8 shows the pressure loss (the pressure difference between Point P0 and P1) decreases dramatically by five orders of magnitude, as the diameter of the ventilation shaft increases from 0.5 to 5 m with the concrete shaft wall lining material. When the shaft diameter is 0.8 m, pressure loss decreases to a negligible value (∼1 KPa). As the permeability increases from 10−10 m2 to 10−7 m2, the pressure loss (between P1 and P2) of air passing through the goaf diminishes, as shown in Figure 8. It is suggested that goafs should have a permeability larger than 3 × 10⁻⁹ m2 to bring about an acceptable pressure loss during the air passing. This, however, is hardly feasible according to the estimation in Ref. (Alehossein and Poulsen, 2010; Poulsen et al., 2018) that the permeability within the goaf above 19.8 m varies between 10−10 and 10−13 m2. Dendritic horizontal ventilation tubes (Figure 2) are, therefore, advised for the safety and smoothness of water-air exchange.
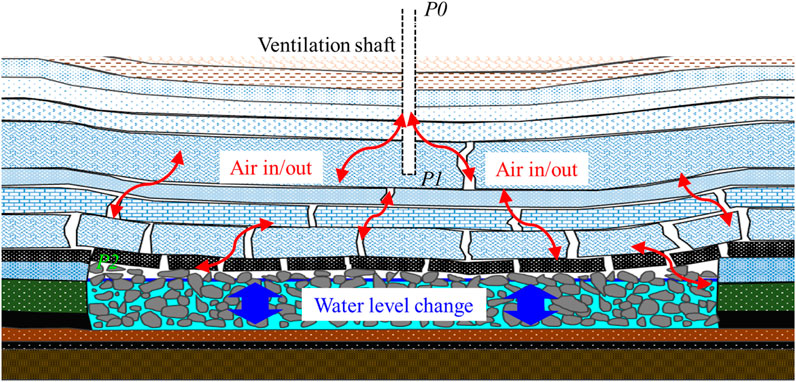
FIGURE 7. Diagram for water-air exchange of the goaf reservoir during water pumping/injecting. P0, P1, and P2 represent air pressure in the atmosphere, at the bottom of ventilation shaft, and at the far endpoint within the goaf, respectively.
Figure 1 shows the distribution of PHS plants in Mainland China. The PHS existing and planned plants both are located mainly in eastern China with a purpose of adjusting the power supply from western China. However, in northwestern and southwestern China (marked by ovals), with abundant solar and wind resource and storable goaf space, there are no PHS plants in most provinces, where are massive goafs of abandoned coal which were shut down in recent years. Goaf-PHS plants could be constructed in those regions to receive and enhance the use of solar and wind power, which could help China to reduce carbon emissions, thus benefitting the global climate. The following part will take a typical region in that area for the case study to evaluate the performance of the goaf-PHS system.
Except for system efficiency
where
Based on the above analysis, the pressure loss during water-air exchange in the goaf is negligible and the storage capacity of one goaf reservoir is temporarily set at 1.97 × 10⁶ m3 and the usable coefficient is 0.8. The altitude difference between the upper and lower reservoir is 100 m. The initial water level inside the upper and lower reservoirs is zero and 17.8 m, respectively.
The load profile, wind velocity, and solar radiation intensity for 1 year or 1 day in Inner Mongolia, a typical richest area in wind and solar energy resources in north China, were used in the following performance evaluations. Detailed data can be seen in Refs. (Xiaolin et al., 2009; Ruichun and Bin, 2014; Wang et al., 2015).
PHS plants usually have several time scales of operation modes, among which the yearly case and daily case are the most representative. The performance of the goaf-PHS system in both yearly and daily operation cases is shown in Figure 9. The model of the goaf-PHS system is detailed.
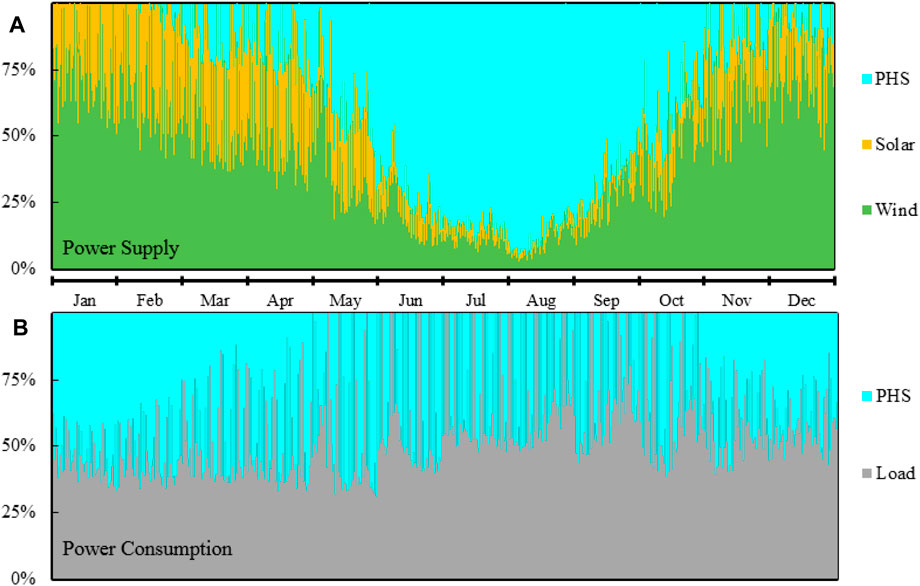
FIGURE 9. Share of component supply and consumption of the goaf-PHS system over 8,760 h. (A) Share of component energy supply; (B) share of component energy consumption.
Based on the wind and solar electric capacity generated in 2017 (wind, 2.70 × 10¹⁰ kW·h, and solar, 9.67 × 10⁹ kW·h, respectively), we could see that the type of energy emplaced in the goaf-PHS consists of 74% of wind generated electricity and 26% of solar electricity. Using the parameters of a typical abandoned coal mine as the standard, the evaluation results for a yearly operations case are shown in Figure 9. Regarding the share of component supply and consumption of the goaf-PHS system over 8,760 h in 1 year, the goaf-PHS is charged every day throughout the 1 year (Figure 9B), while the discharge stage is mainly from the middle of May to October (Figure 9A), indicating that the system stores the surplus energy every day, while releasing that from May to October, during the period of energy deficit. The average regulated load is 275 kW as the altitude difference between the two reservoirs is 100 m. The maximum output of the PHS system is delivered in August, when energy supplied by wind is the weakest (Figure 9A). The maximum input of the PHS system appears in January (Figure 9B).
The details of several selected days (January 1st–4th for winter, April 1st–4th for spring, August 1st–4th for summer, and October 1st–4th for autumn) are shown in Figure 10. It can be seen that the pump units work every day in the hours around noon to stores surplus electricity, even in August (Figure 10B), when the wind energy is seriously inadequate. In January, the pump units work full time, while the turbine units stay inoperative. The turbine units provide the maximum work output 19 h in 1 day, except for 11:00 to 15:00, in August (Figure 10A). In April and October, the turbines and pumps work with roughly the same period. It is therefore the water variation in the reservoirs that changes slowly in April and October, rapidly in January, and especially in August (Figure 11). The water volume in the upper reservoir increases from October to May, reaching a peak of 1.22 × 10⁶ m3 and then decreases, down to a trough value of −3.6 × 10⁵ m3 (Figure 12). The average system efficiency in 1 year is 82.8%. The calculated REPV is 2.82 kW·h/m3.
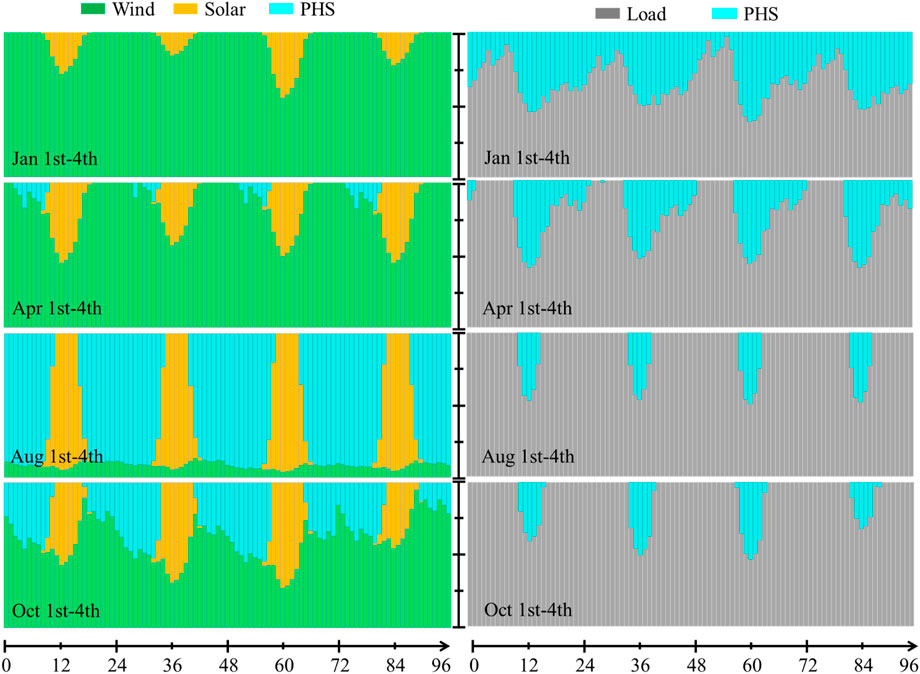
FIGURE 10. Share of component supply and consumption of the goaf-PHS system during the selected day (January 1st–4th for winter, April 1st–4th for spring, August 1st–4th for summer, and October 1st–4th for autumn). (A) Share of component energy supply; (B) share of component energy consumption.
Different power types would bring about a different system performance. As seen from Figure 13, with the wind contribution increasing (
For a typical abandoned coal mine, the system performance was evaluated on two selected days (one in winter, 15th January, shown in Figure 14A; the other one in summer, 15th July, shown in Figure 14B). The chosen energy type is
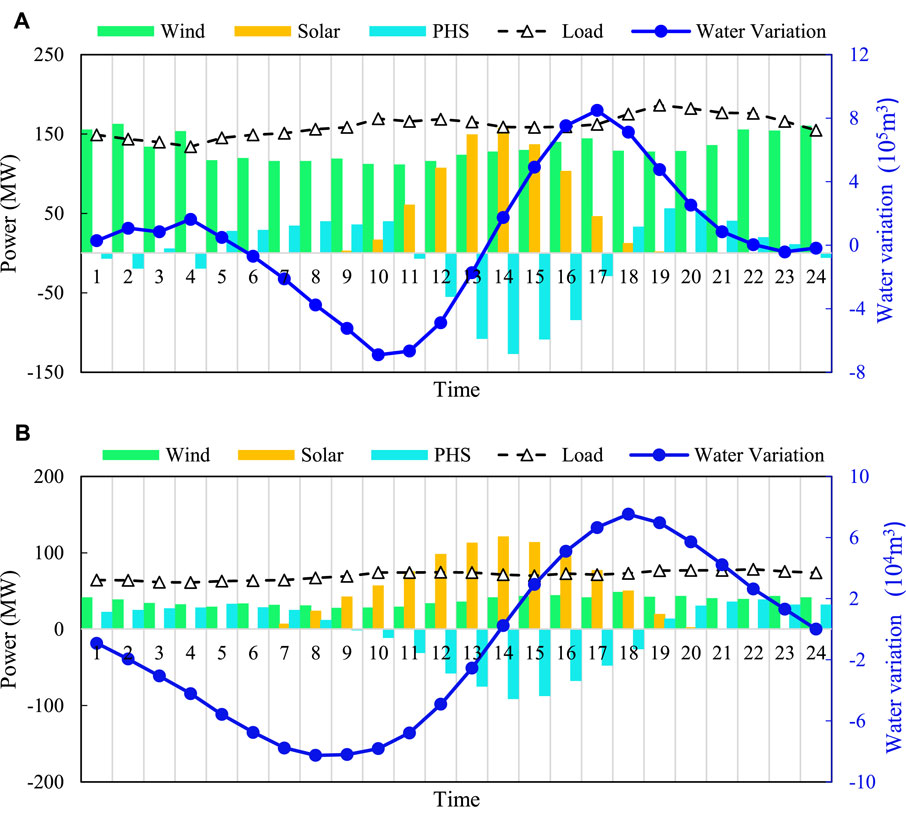
FIGURE 14. Output of goaf-PHS system components and water volume variation for the daily regulation case. (A) Average component output and water volume variation of the system using the data of the 15th of January (
Using the load profile and wind and solar parameters in summer, 15th July, the REPV with various energy types calculated is shown in Figure 13. When the wind contribution increases (
Goaf water quality, especially the pH value, is another major substantial concern on the construction of the goaf-PHS system. With a low pH value, acid goaf water can corrode equipment, release metal ions, even some heavy metals, damage the underground structures (like waterproof wall), and pollute the surrounding water bodies (González et al., 2018). As already known, most coal contains various amounts of (0.5–3%) sulfide that exists mainly (60–70%) as pyrite minerals. The elevated pH level can cause the precipitation or co-precipitation of metal ions such as aluminum (Al), cadmium (Cd), cobalt (Co), chromium (Cr), copper (Cu), iron (Fe), manganese (Mn), nickel (Ni), lead (Pb), and zinc (Zn) contained in the mine water and result in sediments in the seepage channels and reduce the permeability of rock mass, thus blocking the fluid exchange within the goaf (Pujades et al., 2019).
As already known, most coal contains various amounts of (0.5–3%) sulfide that exist mainly (60–70%) as pyrite minerals. After repeated pumping and injection, mine water is exposed to oxidation conditions and acidizes following the chemical reaction R1–R3:
With a hypothesis of geological medium (residual coal and gangue) containing 1% pyrite, Pujades et al. conducted numerical simulations and show that the pH value would decrease continuously to 3.1–3.3 in both surface reservoir and underground goaf reservoir (which is considered as a porous medium in the study) during 30 days of repeated pumpings and injections (Pujades et al., 2018). Under the condition of 10% carbonate such as calcite and 1% pyrite in the initial goaf environment, the research shows calcite would mitigate and precipitate around the surface reservoir (Pujades et al., 2016). Many underground mine reservoirs using coal goafs from Shennan coal mine district, northwest China, have been constructed. The quality analysis shows that the original well water is weakly alkaline (pH = 7.1–7.8) and there is any substantial difference from natural water, except some obvious increases in permanent hardness and sulfate radical (Wang et al., 2018). A long-term water monitoring shows that with the circulation of water resources, several harmful elements have shown a significant remobilization, in spite of ultra-low sulfur deposited in Jurassic coal of the Shennan coal mine district. Taking purification measures, the value of the mine water could be controlled above the utilization standard (pH = 6.9–7.1).
In consequence, hydrogeology and hydrochemistry investigations are also indispensable in the feasibility demonstration of goaf-PHS system. Necessary purification treatments are very important to the water safety. The coal gangue packed in goaf reservoirs, which contain clay mineral contents such as illite and kaolinite, could act as a useful adsorbent to reduce the contents of organic compounds and nitrogen in mine water (Liu et al., 2019). In one word, the environmental influence of goaf reservoirs should be a point of concern but also a solvable problem when developing the hybrid-PHS plants using abandoned coal mine goafs.
In this study, we proposed to use abandoned coal mine goafs serving as large-scale pumped hydro storage reservoirs. Firstly, the suitability of goafs as PHS underground reservoirs was analyzed with respect to the storage capacity, usable capacity, and ventilation between goafs and the outside. Then, the performance of the proposed goaf-PHS system was analyzed based on the meteorological information in a typical Chinese region.
1) For a typical mining area with an extent of 3 × 5 km2 and a coal seam thickness of 6 m, the storage capacity is 1.97 × 10⁶ m3. To ensure a significant usability coefficient (
2) With the energy type
3) Goaf water quality, especially the pH value, is another major substantial concern on the construction of the goaf-PHS system. Hydrogeology and hydrochemistry investigations are indispensable in the feasibility demonstration of goaf-PHS system. Necessary purification treatments are very important to the water safety.
The original contributions presented in the study are included in the article/supplementary material; further inquiries can be directed to the corresponding author.
DJ: methodology, investigation, data curation, writing-original draft, and software resources, supervision, and funding acquisition. SC: investigation, data curation, and software. WL: conceptualization, methodology, investigation, writing-review, and editing. YR: investigation, writing-review, and editing. PG: resources, validation, software, and data curation. ZL: resources, validation, software, and data curation.
This work was supported by the National Key R&D Program of China (No. 2017YFC0804202), National Natural Science Foundation of China (No. 51834003 and 51904039), National Science and Technology Major Project (2016ZX05045001-005), Postdoctoral Science Foundation Project funded by the State Key Laboratory of Coal Mine Disaster Dynamics and Control (2011DA105287-BH201901), and Research Foundation of Chongqing University of Science and Technology (No. CK181901004), which are all greatly appreciated.
Author SC was employed by the company Shaanxi Energy Investment Co., Ltd.
The remaining authors declare that the research was conducted in the absence of any commercial or financial relationships that could be construed as a potential conflict of interest.
All claims expressed in this article are solely those of the authors and do not necessarily represent those of their affiliated organizations, or those of the publisher, the editors, and the reviewers. Any product that may be evaluated in this article, or claim that may be made by its manufacturer, is not guaranteed or endorsed by the publisher.
Al-Habaibeh, A., Shakmak, B., and Fanshawe, S. (2018). Assessment of a Novel Technology for a Stratified Hot Water Energy Storage - the Water Snake. Appl. Energ. 222, 189–198. doi:10.1016/j.apenergy.2018.04.014
Alehossein, H., and Poulsen, B. A. (2010). Stress Analysis of Longwall Top Coal Caving. Int. J. Rock Mech. Mining Sci. 47, 30–41. doi:10.1016/j.ijrmms.2009.07.004
Andrés, C., Ordóñez, A., and Álvarez, R. (2017). Hydraulic and Thermal Modelling of an Underground Mining Reservoir. Mine Water Environ. 36, 24–33. doi:10.1007/s10230-015-0365-1
Bai, D., Ju, J., and Xu, J. (2017). Stability Analysis of Mine Underground Reservoir Artificial Dam in Lijiahao Mine. J. China Coal Soc. 42, 1839–1845.
Bai, H., Li, W., Ding, Q., Wang, Q., and Yang, D. (2015). Interaction Mechanism of the Interface between a Deep Buried Sand and a Paleo-Weathered Rock Mass Using a High normal Stress Direct Shear Apparatus. Int. J. Mining Sci. Tech. 25, 623–628. doi:10.1016/j.ijmst.2015.05.016
Boumaaraf, B., Touafek, K., Ait-cheikh, M. S., and Slimani, M. E. A. (2018). Comparison of Electrical and thermal Performance Evaluation of a Classical PV Generator and a Water Glazed Hybrid Photovoltaic–thermal Collector. Mathematics Comput. Simulation.
Chen, J., Shi, Q., Shen, L., Huang, Y., and Wu, Y. (2019). What Makes the Difference in Construction Carbon Emissions between China and USA. Sust. Cities Soc. 44, 604–613. doi:10.1016/j.scs.2018.10.017
Collado, L., Reynal, A., Fresno, F., Barawi, M., Escudero, C., Perez-Dieste, V., et al. (2018). Unravelling the Effect of Charge Dynamics at the Plasmonic Metal/semiconductor Interface for CO2 Photoreduction. Nat. Commun. 9, 4986. doi:10.1038/s41467-018-07397-2
Davidson, M. R., Zhang, D., Xiong, W., Zhang, X., Valerie, J., and Karplus, V. J. (2016). Modelling the Potential for Wind Energy Integration on China's Coal-Heavy Electricity Grid. Nat. Energ. 1, 16086. doi:10.1038/nenergy.2016.86
Deng, Y., Chen, C., Xia, K., Yang, K., Sun, C., and Zheng, X. (2018). Investigation on the Characteristics of Overlying Strata Caving in the Chengchao Iron Mine, China. Environ. Earth Sci. 77, 362. doi:10.1007/s12665-018-7553-9
Dong, Z.-Y., Wang, S.-M., and Hou, E.-K. (2016).Numerical Simulation on Height of Caving Zone and Fissure Zone in 304 mining Face of Huangling No.1 Mine. In Material Science and Environmental Engineering. World Scientific, 516–524. doi:10.1142/9789813143401_0058
Fan, J., Chen, J., Jiang, D., Chemenda, A., Chen, J., and Ambre, J. (2017). Discontinuous Cyclic Loading Tests of Salt with Acoustic Emission Monitoring. Int. J. Fatigue 94, 140–144. doi:10.1016/j.ijfatigue.2016.09.016
Fan, J., Chen, J., Jiang, D., Ren, S., and Wu, J. (2016). Fatigue Properties of Rock Salt Subjected to Interval Cyclic Pressure. Int. J. Fatigue 90, 109–115. doi:10.1016/j.ijfatigue.2016.04.021
Fan, J., Chen, J., Jiang, D., Wu, J., Shu, C., and Liu, W. (2019). A Stress Model Reflecting the Effect of the Friction Angle on Rockbursts in Coal Mines. Geomechanics Eng. 18, 21–27.
Fan, J., Jiang, D., Chen, J., Liu, W., Tiedeu Ngaha, W., and Chen, J. (2018). Fatigue Performance of Ordinary concrete under Discontinuous Cyclic Loading. Construction Building Mater. 166, 974–981. doi:10.1016/j.conbuildmat.2018.01.115
Fan, J., Jiang, D., Liu, W., Wu, F., Chen, J., and Daemen, J. (2019). Discontinuous Fatigue of Salt Rock with Low-Stress Intervals. Int. J. Rock Mech. Mining Sci. 115, 77–86. doi:10.1016/j.ijrmms.2019.01.013
Fan, J., Liu, W., Jiang, D., Chen, J., Ngaha Tiedeu, W., Chen, J., et al. (2018). Thermodynamic and Applicability Analysis of a Hybrid CAES System Using Abandoned Coal Mine in China. Energy 157, 31–44. doi:10.1016/j.energy.2018.05.107
Fan, J., Xie, H., Chen, J., Jiang, D., Li, C., Ngaha Tiedeu, W., et al. (2020). Preliminary Feasibility Analysis of a Hybrid Pumped-Hydro Energy Storage System Using Abandoned Coal Mine Goafs. Appl. Energ. 258, 114007. doi:10.1016/j.apenergy.2019.114007
González, R. M., Olías, M., Macías, F., Cánovas, C. R., and de Villarán, R. F. (2018). Hydrological Characterization and Prediction of Flood Levels of Acidic Pit Lakes in the Tharsis Mines, Iberian Pyrite Belt. J. Hydrol. 566, 807–817. doi:10.1016/j.jhydrol.2018.09.046
Gu, D. (2015). Theory Framework and Technological System of Coal Mine Underground Reservoir. J. China Coal Soc. 40, 239–246.
Han, B.-C., Cheng, W.-L., Li, Y.-Y., and Nian, Y.-L. (2017). Thermodynamic Analysis of Heat Driven Combined Cooling Heating and Power System (CCHP) with Energy Storage for Long Distance Transmission. Energ. Convers. Manag. 154, 102–117. doi:10.1016/j.enconman.2017.10.058
Hunt, J. D., Byers, E., Riahi, K., and Langan, S. (2018). Comparison between Seasonal Pumped-Storage and Conventional Reservoir Dams from the Water, Energy and Land Nexus Perspective. Energ. Convers. Manag. 166, 385–401. doi:10.1016/j.enconman.2018.04.044
Hunt, J. D., Freitas, M. A. V., and Pereira Junior, A. O. (2014). Enhanced-Pumped-Storage: Combining Pumped-Storage in a Yearly Storage Cycle with Dams in cascade in Brazil. Energy 78, 513–523. doi:10.1016/j.energy.2014.10.038
Jiang, D., Fan, J., Chen, J., Li, L., and Cui, Y. (2016). A Mechanism of Fatigue in Salt under Discontinuous Cycle Loading. Int. J. Rock Mech. Mining Sci. 86, 255–260. doi:10.1016/j.ijrmms.2016.05.004
Kapila, S., Oni, A. O., and Kumar, A. (2017). The Development of Techno-Economic Models for Large-Scale Energy Storage Systems. Energy 140, 656–672. doi:10.1016/j.energy.2017.08.117
Kim, H.-M., Rutqvist, J., Ryu, D.-W., Choi, B.-H., Sunwoo, C., and Song, W.-K. (2012). Exploring the Concept of Compressed Air Energy Storage (CAES) in Lined Rock Caverns at Shallow Depth: A Modeling Study of Air Tightness and Energy Balance. Appl. Energ. 92, 653–667. doi:10.1016/j.apenergy.2011.07.013
Konicek, P., Soucek, K., Stas, L., and Singh, R. (2013). Long-hole Destress Blasting for Rockburst Control during Deep Underground Coal Mining. Int. J. Rock Mech. Mining Sci. 61, 141–153. doi:10.1016/j.ijrmms.2013.02.001
Li, N., and Chen, W. (2019). Energy-water Nexus in China's Energy Bases: From the Paris Agreement to the Well below 2 Degrees Target. Energy 166, 277–286. doi:10.1016/j.energy.2018.10.039
Li, X., Li, Z., Wang, E., Liang, Y., Li, B., Chen, P., et al. (2018). Pattern Recognition of Mine Microseismic and Blasting Events Based on Wave Fractal Features. Fractals 26, 1850029. doi:10.1142/s0218348x18500299
Liu, S., Li, X., Wang, D., Wu, M., Yin, G., and Li, M. (2020). Mechanical and Acoustic Emission Characteristics of Coal at Temperature Impact. Natural Resources Research 29, 1755–1772. doi:10.1007/s11053-019-09562-w
Liu, W., Zhang, Z., Chen, J., Fan, J., Jiang, D., Jjk, D., et al. (2019). Physical Simulation of Construction and Control of Two Butted-Well Horizontal Cavern Energy Storage Using Large Molded Rock Salt Specimens. Energy 185, 682–694. doi:10.1016/j.energy.2019.07.014
Menéndez, J., Loredo, J., Fernandez, M., and Galdo, M. (2017). “Underground Pumped-Storage Hydro Power Plants with Mine Water in Abandoned Coal Mines,” in Proceedings of the IMWA 13th International Congress. Editors C. Wolkersdorfer, L. Sartz, M. Sillanpää, and A. Häkkinen (Lappeenranta, Finland), 6–13.
Menéndez, J., Loredo, J., Galdo, M., and Fernández-Oro, J. M. (2018). Energy Storage in Underground Coal Mines in NW Spain: Assessment of an Underground Lower Water Reservoir and Preliminary Energy Balance. Renewable Energy 134, 1381–1391. doi:10.1016/j.apenergy.2016.12.093
Meng, Z., Shi, X., and Li, G. (2016). Deformation, Failure and Permeability of Coal-Bearing Strata during Longwall Mining. Eng. Geology. 208, 69–80. doi:10.1016/j.enggeo.2016.04.029
Meng, Z., Shi, X., and Liu, S. (2016). Evaluation Model of CBM Resources in Abandoned Coal Mine and its Application. J. China Coal Soc. 41, 537–544.
Novara, D., and McNabola, A. (2018). A Model for the Extrapolation of the Characteristic Curves of Pumps as Turbines from a Datum Best Efficiency Point. Energ. Convers. Manag. 174, 1–7. doi:10.1016/j.enconman.2018.07.091
Pali, B. S., and Vadhera, S. (2018). A Novel Pumped Hydro-Energy Storage Scheme with Wind Energy for Power Generation at Constant Voltage in Rural Areas. Renew. Energ. 127, 802–810. doi:10.1016/j.renene.2018.05.028
Pan, X., Wang, H., Wang, L., and Chen, W. (2018). Decarbonization of China's Transportation Sector: In Light of National Mitigation toward the Paris Agreement Goals. Energy 155, 853–864. doi:10.1016/j.energy.2018.04.144
Pang, Y. L., and peng, Zhou, B. (2018). Underground Reservoir Construction Technical Feasibility Analysis in 8. 0m Large Mining Height Working Face. Coal Eng. 50, 6–15.
Parkes, D., Evans, D. J., Williamson, P., and Williams, J. D. O. (2018). Estimating Available Salt Volume for Potential CAES Development: A Case Study Using the Northwich Halite of the Cheshire Basin. J. Energ. Storage 18, 50–61. doi:10.1016/j.est.2018.04.019
Poulsen, B. A., Adhikary, D., and Guo, H. (2018). Simulating Mining-Induced Strata Permeability Changes. Eng. Geology. 237, 208–216. doi:10.1016/j.enggeo.2018.03.001
Pujades, E., Jurado, A., Orban, P., Ayora, C., Poulain, A., Goderniaux, P., et al. (2018). Hydrochemical Changes Induced by Underground Pumped Storage Hydropower and Their Associated Impacts. J. Hydrol. 563, 927–941. doi:10.1016/j.jhydrol.2018.06.041
Pujades, E., Jurado, A., Orban, P., and Dassargues, A. (2019). Parametric Assessment of Hydrochemical Changes Associated to Underground Pumped Hydropower Storage. Sci. Total Environ. 659, 599–611. doi:10.1016/j.scitotenv.2018.12.103
Pujades, E., Orban, P., Bodeux, S., Archambeau, P., Erpicum, S., and Dassargues, A. (2017). Underground Pumped Storage Hydropower Plants Using Open Pit Mines: How Do Groundwater Exchanges Influence the Efficiency. Appl. Energ. 190, 135–146. doi:10.1016/j.apenergy.2016.12.093
Pujades, E., Willems, T., Bodeux, S., Orban, P., and Dassargues, A. (2016). Underground Pumped Storage Hydroelectricity Using Abandoned Works (Deep Mines or Open Pits) and the Impact on Groundwater Flow. Hydrogeol J. 24, 1531–1546. doi:10.1007/s10040-016-1413-z
Ren, Z., and Wang, N. (2020). The Overburden Strata Caving Characteristics and Height Determination of Water Conducting Fracture Zone in Fully Mechanized Caving Mining of Extra Thick Coal Seam. Geotechnical and Geological Engineering. 38, 329–341. doi:10.1007/s10706-019-01019-4
Rogeau, A., Girard, R., and Kariniotakis, G. (2017). A Generic GIS-Based Method for Small Pumped Hydro Energy Storage (PHES) Potential Evaluation at Large Scale. Appl. Energ. 197, 241–253. doi:10.1016/j.apenergy.2017.03.103
Ruichun, W., and Bin, L. (2014). Characteristics and Load Peak Regulation Capacity Analysis of Inner Mongolia Power Grid. inner mongolia electric power 32, 5–10.
Ruppert, L., Schürhuber, R., List, B., Lechner, A., and Bauer, C. (2017). An Analysis of Different Pumped Storage Schemes from a Technological and Economic Perspective. Energy 141, 368–379. doi:10.1016/j.energy.2017.09.057
Shu, C., Wang, H., Li, X., Fan, J., and Ye, X. (2019). A Thermo–Hydro–Mechanical Model: Capturing the Effects of Initial Permeability and Gas Pressure on Outburst-Prone Indicators. Nat. Resour. Res.
Simon, J., Ferriz, A. M., and Correas, L. C. (2015). HyUnder - Hydrogen Underground Storage at Large Scale: Case Study Spain. Energ. Proced. 73, 136–144. doi:10.1016/j.egypro.2015.07.661
Tung, S. o., Fisher, S. L., Kotov, N. A., and Thompson, L. T. (2018). Nanoporous Aramid Nanofibre Separators for Nonaqueous Redox Flow Batteries. Nat. Commun. 9, 4193. doi:10.1038/s41467-018-05752-x
Wang, Q., Li, W., Li, T., Li, X., and Liu, S. (2018). Goaf Water Storage and Utilization in Arid Regions of Northwest China: A Case Study of Shennan Coal Mine District. J. Clean. Prod. 202, 33–44. doi:10.1016/j.jclepro.2018.08.123
Wang, Q., Zeng, B., and Deng, L. (2015). Characteristics of Spatial and Temporal Changes of Wind Speed during 1981-2013 in Inner Mongolia Autonomous Region. J. Inner Mongolia Normal Univ. (Natrual Sci. Edtion) 44, 674–679.
Winde, F., Kaiser, F., and Erasmus, E. (2017). Exploring the Use of Deep Level Gold Mines in South Africa for Underground Pumped Hydroelectric Energy Storage Schemes. Renew. Sust. Energ. Rev. 78, 668–682. doi:10.1016/j.rser.2017.04.116
Xiaolin, T., lan, W., and Chao, W. (2009). Complementary Analysis on Wind and Solar Energy Resources of Inner Mongolia. Inner Mongolia climate 3 (2), 32–33.
Xie, H., and Liu, J. (2018). Development and Utilization of Special Underground Space. Science press.
Yesilbudak, M. (2018). Implementation of Novel Hybrid Approaches for Power Curve Modeling of Wind Turbines. Energ. Convers. Manag. 171, 156–169. doi:10.1016/j.enconman.2018.05.092
Zhao, P., Wang, J., and Dai, Y. (2015). Thermodynamic Analysis of an Integrated Energy System Based on Compressed Air Energy Storage (CAES) System and Kalina Cycle. Energ. Convers. Manag. 98, 161–172. doi:10.1016/j.enconman.2015.03.094
Keywords: pumped hydro storage, clean energy, coal mines, feasibility analysis, case study
Citation: Jiang D, Chen S, Liu W, Ren Y, Guo P and Li Z (2021) Underground Hydro-Pumped Energy Storage Using Coal Mine Goafs: System Performance Analysis and a Case Study for China. Front. Earth Sci. 9:760464. doi: 10.3389/feart.2021.760464
Received: 18 August 2021; Accepted: 28 September 2021;
Published: 12 November 2021.
Edited by:
Junbao Wang, Xi’an University of Architecture and Technology, ChinaReviewed by:
Yunfeng Zhao, Yangtze University, ChinaCopyright © 2021 Jiang, Chen, Liu, Ren, Guo and Li. This is an open-access article distributed under the terms of the Creative Commons Attribution License (CC BY). The use, distribution or reproduction in other forums is permitted, provided the original author(s) and the copyright owner(s) are credited and that the original publication in this journal is cited, in accordance with accepted academic practice. No use, distribution or reproduction is permitted which does not comply with these terms.
*Correspondence: Wenhao Liu, 1483948388@qq.com
Disclaimer: All claims expressed in this article are solely those of the authors and do not necessarily represent those of their affiliated organizations, or those of the publisher, the editors and the reviewers. Any product that may be evaluated in this article or claim that may be made by its manufacturer is not guaranteed or endorsed by the publisher.
Research integrity at Frontiers

Learn more about the work of our research integrity team to safeguard the quality of each article we publish.