 Feng Liu
 Andong Wang4
95% of researchers rate our articles as excellent or good
Learn more about the work of our research integrity team to safeguard the quality of each article we publish.
Find out more
ORIGINAL RESEARCH article
Front. Earth Sci. , 03 November 2021
Sec. Economic Geology
Volume 9 - 2021 | https://doi.org/10.3389/feart.2021.758605
This article is part of the Research Topic Progress in Exploration, Development and Utilization of Geothermal Energy View all 28 articles
The Yanshan area is rich in geothermal resources. However, limited research has been done on the geothermal resources of intermountain basins in the area, which restrict the exploration and development of geothermal resources. In this study, the Yanheying Basin, a typical intermountain basin located in the eastern foothills of Yanshan Mountain, is selected to perform a comprehensive analysis regarding heat flow and lithospheric thermal structure, to have a better understanding of the geothermal background and resource utilization potential of the area. The methods of deep borehole temperature logging, and rock sampling and testing were applied. With geological and geophysical data collected in the surrounding basins, the thermophysical parameters of rock formations, terrestrial heat flow and temperature distribution on a crustal-scale around the basin were analyzed. Results show that the ratio of crust heat flow to that of the mantle in the Yanheying Basin is 0.68, which falls in the range of that of the North China Plain (0.6–0.8), showing an obvious result of lithospheric thinning. The results also show that both crust and mantle heat flows in the Yanheying Basin are far lower than those of the North China Plain. it indicates that the crust of the Yanheying Basin and the entire Yanshan area has experienced a low degree of damage. That provides a piece of good thermodynamic evidence for the spatial variation of North China Craton destruction. The depth of the Curie surface in the study area is estimated to be about 24 km, which is consistent with the results of aeromagnetic data analysis. It confirms the results of lithospheric thermal structure and deep temperature distribution in the Yanheying Basin. The Yanheying Basin has certain potential for geothermal resources utilization in the depth of 2–6 km, where probably exist several carbonate thermal reservoirs with medium-temperature geothermal water. The above results can provide new insights into the geothermal research and exploration of intermountain basins in the Yanshan area.
In the research of geothermal resources, it is of practical significance to study terrestrial heat flow and lithospheric thermal structure (Jiang et al., 2019). Terrestrial heat flow is a surficial manifestation of the Earth’s internal thermal dynamic process (Davies and Davies, 2010). It (q0) is a combination of crust heat flow (qc) and mantle heat flow (qm) (Birch et al., 1968). Briefly, the lithospheric thermal structure includes the distribution of heat flow and temperature at different depths of the lithosphere. It represents the deep thermal state of the region and forms the basis for researches of the formation mechanism of regional geothermal resources (Lachenbruch et al., 1970).
The Yanshan area is located in the northern part of the Beijing-Tianjin-Hebei region and has been a green ecological shelter in the north of Beijing City. The research and utilization of geothermal resources is of great theoretical and practical significance in this area. However, existing geothermal studies there have mainly focused on hot springs (Liu, 2006; Zhang, 2012; Shen, 2017). Limited studies have been conducted to address the deep thermal status of intermountain basins in the Yanshan area. Furthermore, there are only 21 terrestrial heat flow data (Jiang et al., 2016 and references therein; Sun et al., 2019; Liu et al., 2020) within the Yanshan area and all of them are located in the central and western parts (Figure 1). The eastern part of the Yanshan area is still a blank area of heat flow measurement. As a result, subsequent research om the lithospheric thermal structure, deep temperature distribution, and utilization of this area are also limited.
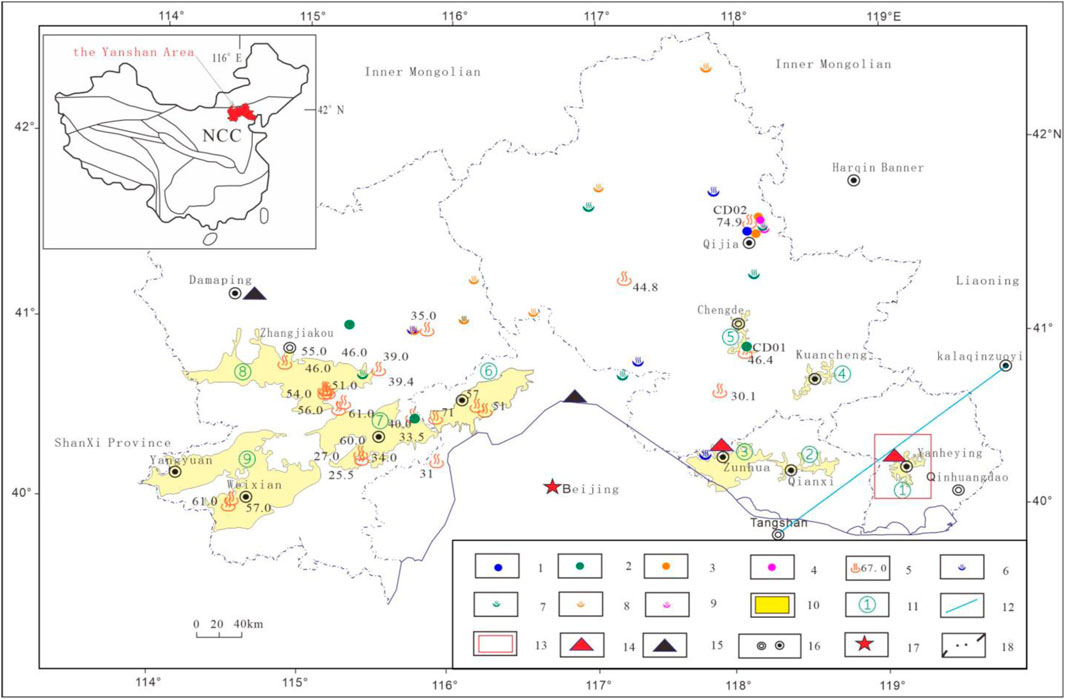
FIGURE 1. Terrestrial heat flow observations and surface geothermal manifestations in the Yanshan area.
Therefore, to fill the blank area of terrestrial heat flow measurement in the Yanshan area and to improve the research degree of geothermal resources in intermountain basins, the Yanheying Basin is selected as a typical area in this paper to analyze thermophysical parameters of shallow and deep strata, the terrestrial heat flow and temperature distribution of the crust around it. The reasons are as follows: First is the location advantage. The Yanheying Basin is located at the Eastern Foot of Yanshan Mountain, which is rich in geothermal resources but lacks basic geothermal research, especially in the intermountain basins. Secondly, the stratigraphic distribution in this basin is the same as that of Zhangjiakou Basin, Chengde Basin in the central and west, respectively, with the lithospheric structure close to the average of the Yanshan area (Jia et al., 2009; Liu et al., 2020). Thirdly, its geothermal condition is well represented. Hot springs are developed around the basin and carbonate geothermal reservoirs are developed inside the basin, which is consistent with the general characteristics of geothermal resources distribution of intermountain basins in the Yanshan area (Liu, 2006; Zhang, 2012; Shen, 2017).
Geologically, the Yanshan area is located in the northeastern part of the North China Craton (Figure 1), adjacent to the North China Plain to the south and the Taihang Mountains to the southwest. Since the Mesozoic era, the Yanshan structural belt has undergone multiple stages of tectonic activities, leading to the formation of intermountain basins (Liu et al., 2013), such as Yanheying Basin, Qianxi Basin, Zunhua Basin, Kuanchegn Basin, Chengde Basin, Yanqing Basin, Huailai Basin, Yangyuan-Yuxian Basin, Zhangjiakou Basin from east to west in the Yanshan area (Figure 1). Although these basins are sparsely located, they can still be correlated due to similar sedimentary facies (Liu et al., 2004). Firstly, these intermountain basins mainly comprise a series of sedimentary strata from the Archaean, through the Proterozoic to Cambrian (Cope et al., 2007; Liu et al., 2013). Among the strata, the sedimentary rocks of Gaoyuzhuang Formation of the Changcheng System, Wumishan Formation of the Jixian System, and the Changping Formation of the Cambrian have been identified as good geothermal reservoirs, where the geothermal resources are accumulated via rock thermal conduction (Wang et al., 2019). Secondly, affected by the tectonic uplift and subsidence in the Yanshan area, the strata between the Late Middle Cambrian and the Late Permian, as well as the Neogene and Paleogene are missing across the basins, replaced by a wide presence of well-developed and thick-layered Cretaceous sedimentary rocks and Jurassic volcanic rocks underlain by Yanshanian granites of various thicknesses. Additionlly, the shallow layers such as the Minghuazhen Formation and the Guantao Formation are not developed in these basins, showing a completely different character from that of the North China Plain (Liu et al., 2004; Zhang, 2018). The Yanheying Basin selected in this paper accords with the general stratigraphic characteristics of intermountain basins described above.
As shown in Figure 2, the Yanheying Basin, extending from Taiying in Funing County to Yanheying in Lulong County and spatially appearing as an irregular oval shape, is a Mesozoic continental volcanic-sedimentary basin to the east of the Yanshan Mountain, with an aerial size of 230 km2. The surface of the basin is covered by the Quaternary deposits, underlain by Cretaceous sedimentary rocks and Jurassic volcanic rocks. Below the volcanic rocks are the strata of the Cambrian, the Qingbaikou System, the Jixian System, and the Changcheng System of the Proterozoic (Zhang, 2018), respectively. At the bottom, the crystalline basement is composed of the Luanxian System and the Lulong rock suite of the Archean, forming the top layer of the region’s upper crust.
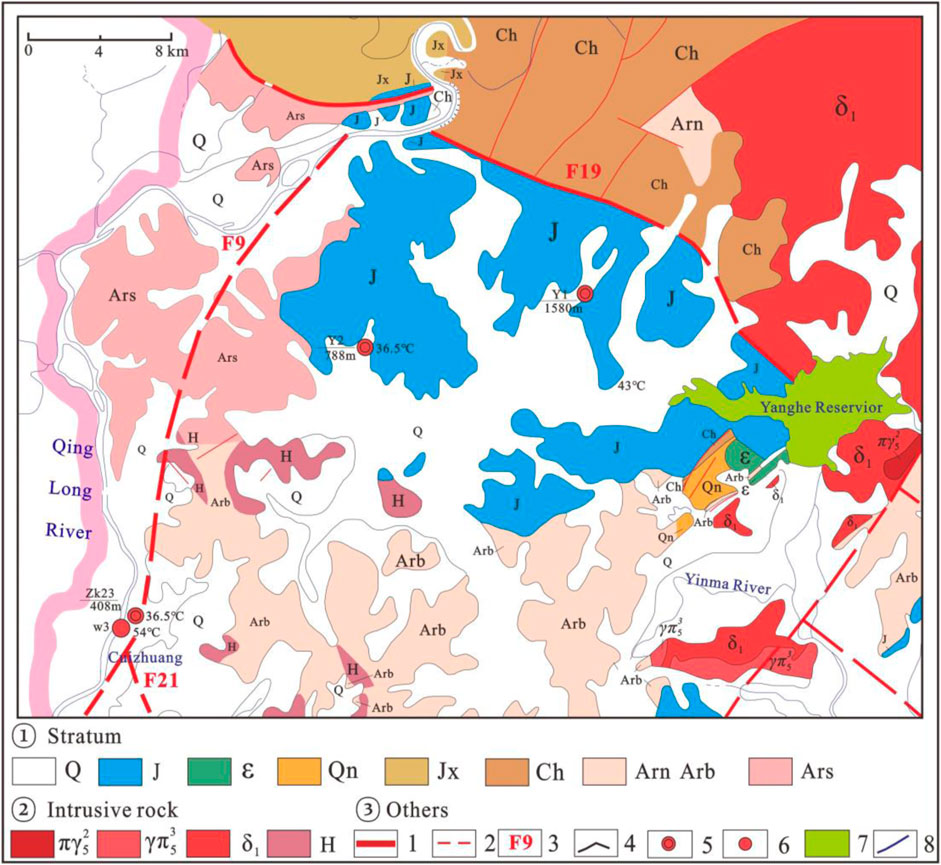
FIGURE 2. Simplified geothermal geology of the Yanheying Basin (the location of the study area is defined in Figure 1).
The Yanheying Basin is located southeast of the Yanshan area (Figure 1). Its north and northeast are bounded by the Lengkou fault (F19 in Figure2) and its western boundary is controlled by the Qinglonghe fault (F9 in Figure2), while in the south the basin is angularly unconfirmed with the metamorphic basement of the Neoarchean (Figure 2).
In terms of geothermal conditions, there is a hot spring issuing at the junction of Fault F9 and the Leidianzi tensile basement Fault F21 (Figure 2). It outcrops in the vicinity of the Cuizhuang area, the southwestern margin of the basin, with a surface temperature of 36.5°C. Similar hot springs with a surface temperature of 30–60°C are also exposed in the Zhangjiakou Basin, the Huailai Basin, the Zunhua Basin, the Qianxi Basin, and so on, showing relatively consistent characteristics in the Yanshan area (Liu, 2006; Zhang, 2012; Shen, 2017). The borehole Y1 and Y2 are located in the basin, with a bottom hole temperature of 43.0°C and 26.4°C, respectively (Figure 2).
Figure 3 shows the result of seismic exploration along the Harqin Zuoyi - Cangzhou cross-section that transects the northern side of the Yanheying Basin (Figure 1) (Shao et al., 1989). The P-wave velocity (Vp) in the section provides important information about the stratification of the crust for analyzing the lithospheric thermal structure.

FIGURE 3. Distribution of P-wave velocity in the geological transect from Cangzhou to Harqin Zuoyi (modified from Shao et al., 1989; the location of the section line is defined in Figure 1).
The terrestrial heat flow value can be attributed to the product of two parameters, i.e., geothermal gradient and rock thermal conductivity.
In this study, we used the well temperature probe ANTS-3S, with a working range of 0–150°C and an accuracy of 0.01°C, to measure the well temperature at depth. The measurement was performed in accordance with the national guideline titled Coal Geophysical Logging Specification (DZ/T0080-2010). During this process, the temperatures were repeatedly logged untill their difference at a well depth section was less than 0.5°C in 24 h, to ensure that the recorded well temperature was in a steady-state or a quasi-steady heat flow state (He et al., 2008). After that, the influence of groundwater on the temperature and lithological data was analyzed, the well sections with a relative straight-line feature of temperature against depth were selected to calculate the well thermal gradient ΔT/Δh.
The thermal conductivity automatic scanner TCS (Thermal Conductivity Scanning), with a working range of 0.2–25 W/m K and an accuracy of ±3%, was applied in this study, to perform the rock conductivity analysis. The thermal conductivity of the rock decrease with increasing temperature (Anand et al., 1973). In the current research, the thermal conductivity test was done at a temperature of 25°C. As the lab temperature was different from that of the well, the thermal conductivity of borehole cores was corrected according to the in situ temperature of the borehole (Liu et al., 2017), by employing the empirical formula developed by Sass et al. (1992), which has been proved to be suitable for calibrating the conductivity within a depth of several kilometers in the continental areas (He et al., 2008).
Where T is the in situ temperature of the core in borehole (°C), K (0) and K (25) are the thermal conductivity values of the rock at 0 and 25°C (W/m K), respectively.
Pressure, porosity, and water saturation are also key factors in thermal conductivity (Pribnow et al., 1996). The effect of pressure is insignificant within a buried depth of 1–2 km (Abdulagatova et al., 2009). The effects of porosity and water saturation depend on the degree of porosity. Some researchers suggest that only when the porosity is greater than 6% does its effect have practical significance for thermal conductivity (Yang et al., 1993). The effects on mudstone and metamorphic rocks in some areas are ignored because of their low porosity (He et al., 2008; Zhang et al., 2020). In general, for rocks with a porosity of more than 5%, water saturation correction for the thermal conductivity can be made using equations raised by Abdulagatova (2009) and Guo et al. (2017).
For the strata under the basin basement, the following formula is frequently used for correction (Cermak et al., 1982; Artemieva et al., 2001).
Where, c is the temperature coefficient determined by the experiment and K0 is the initial value of the thermal conductivity at the top of each structural layer, which is given by experimental or empirical parameters of different cases. Here, according to previous studies, the c values are 0.001, 0 for the middle crust and −0.00025 for the lower crust and mantle, respectively, while the K0 values are 2.3 and 2.5 W/m K for the middle and lower crusts, and the mantle, respectively (Cermak et al., 1982; Gong et al., 2011).
As discussed in the Geological Setting, the bottom of the Yanheying Basin in the study region is the Archaean crystalline basement and above the basement are sedimentary and intrusive rocks, while the space below that boundary is the upper crust and then downwards are the middle crust, lower crust and upper mantle, respectively. In general, the lithology and thickness of the sedimentary and intrusive rocks can be identified via core drilling and the bedrock exposed on the surface. The data of the structural layers below the crystalline basement can only be obtained through geophysical methods, of which the artificial seismic exploration can reflect the structure above the upper mantle briefly (Figure 3). According to a previous study of the interfaces determined by compressional wave (P wave) velocity (Vp), the structure of the lithosphere can be demarcated (Fullea et al., 2014).
There are two ways to obtain the lithospheric structure of the Yanheying Basin. The first one is to query from the Vp profile map like Figure 3. Data from that are more accurate but lack the validation of data from surrounding areas. For the area with no artificial seismic exploration done, the regional structure of the lithosphere can be obtained from the model Crust1.0 developed by Laske et al. (2013). This model facilitates the collection of global artificial seismic data and the establishment of a global lithospheric structure model with a resolution of 1° × 1°. In addition, the model can provide parameters such as the depth of the upper, middle, and lower crust interfaces in various regions of the world, the density of each structural layer and Vp. The resulting data is a better representation of the whole area but has a lower resolution.
In this study, the crustal structure was demarcated using the average data derived from the application of the above two methods. For the strata above the upper crust, the geothermal structure was demarcated through the interpretation of deep borehole core-logging data and typical geological profiles in the vicinity of the study area.
The crustal heat flow qc is referred to as cumulative heat resulting from the decay of radioactive elements in all layers of the Earth crust in the study region. Taking the thickness of each layer and associated radioactive heat production rate into account, the layer-stripping method is used to calculate the heat flow generated in all layers, which can be represented by the Eqs 4, 5.
Where Di is the thickness of the structural layer i, Ai is its heat production rate, qi is the heat flow generated in the layer and qc is the crust heat flow. Furthermore, the mantle heat flow value can be calculated as qm = q0–qc.
The radioactive heat production rate of the rock is determined by measuring the concentrations of radioactive elements such as uranium (as U), thorium (as Th) and potassium (as K) in the rocks. At present, Eq. 6 proposed by Rybach (1976) is widely used to calculate the rate.
In this formula, A (μW/m3) is the radioactive heat production rate, ρ is the rock density (g/cm3), CU, CTh, and CK are the concentrations of U (μg/g), Th (μg/g) and K (%), respectively. The contents of U and Th are analyzed by the ICP-MS method with an uncertainty of ±1–±10%, and the weight percentage of K can be determined by the XRF method with an analytical uncertainty of ±1∼±2%.
For deep rock formations in the crust, there have been so far two commonly used methods for calculating the heat production rate. One is the geophysical method proposed by Lachenbruch (1970) and Rybach (1984) who separately established the relationship between Vp and A. However, due to the lack of theoretical basis of the empirical method and limited satisfactory application effects in many cases, an increasing number of researchers have questioned the mothod (Kern and Siegesmund, 1989; Zhao, 1995). Another method is to identify the lithologies in the crustal layers based on existing geological information and to test the representative rocks of each layer via outcrop or borehole sampling. The advantage of this method is that it effectively gains the heat production data of deep crustal rock formations to the greatest extent. However, it is extremely difficult to obtain the rock samples from the deep portions of the crust, because deep rock sampling requires a lot of effort toward deep drilling or deep rock inclusion detection (Liu et al., 2001). In this study, we used the second approach to assessing the heat production rate. Through rock sampling and data collection in the study area and even over the entire Yanshan area, relevant data associated with deep rock formations were acquired (Tables 2, 4), which enabled us to analyze regional lithospheric thermal structure more accurately.
The temperature of the shallow strata can be accessed by well logging, while in the deep portion of the crust, it can only be explored by applying indirect methods. The linear relationship between temperature and depth in Y1 and Y2 (Figure 4) shows that the ground temperature rising in Yanheying Basin is mainly attributed to deep heat conduction. Thus, the temperature of deep strata can be calculated using the one-dimensional steady-state heat conduction formula as follows (Lachenbruch et al., 1970).
Where Tz is the temperature (°C) at the depth z (m), T0 and q are the temperature (°C) and heat flow (mW/m2) at the top of the layer, respectively, D is the thickness of the layer (km), k the thermal conductivity of rock (W/m K) in the layer calculated, and A heat production rate of the rock (μW/m3).
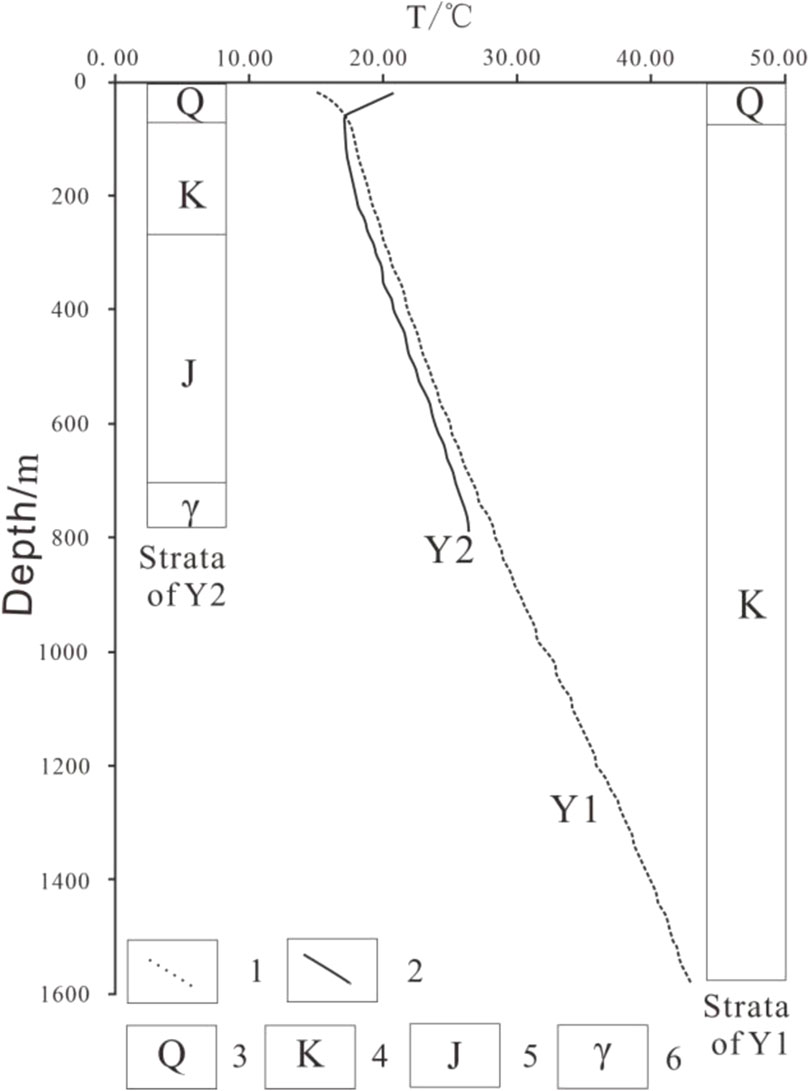
FIGURE 4. Borehole temperature logs and associated strata in the Yanheying Basin.
The temperature logs done in the boreholes Y1 and Y2 installed in the Yanheying Basin show a good trend of heat conduction and temperature increase at a depth below the Quaternary deposits (Figure 4), which is suitable for calculating the terrestrial heat flow of the study area.
The logging depth is 1,580 m with a maximum temperature of 43.0°C in the borehole Y1 and the geothermal gradient from 200 to 1,500 m deep is 17.9°C/km with a fit goodness of 0.997. The lithologies in this depth range are sandstone, mudstone and conglomerate of the Cretaceous. Their average rock thermal conductivity is 2.50 W/m K estimated from 15 samples. The logging depth of the borehole Y2 is 788 m with a maximum temperature of 26.4°C. The temperature gradient in 300–700 m below the surface is 15.1°C/km, and the fitting goodness with the temperature against depth is 0.999. The lithology in this depth range is dominated by Jurassic volcanic rock with an average rock thermal conductivity of 2.34 W/m K (5 samples). Giving that the average porosity of sandstone, mudstone, conglomerate, and volcanic rock samples mentioned above are 1.4, 2.8, 3.6, and 2.3% respectively, with an average value of 2.8%. The effect of water saturation is about 0.7% according to our estimates from the Abdulagatova (2009) and Guo et al. (2017) equations, which is far less than the test accuracy of ±3%. Thus, only temperature correction is made for the heat flow measurement. The calibrated thermal conductivity is shown in Table 1.
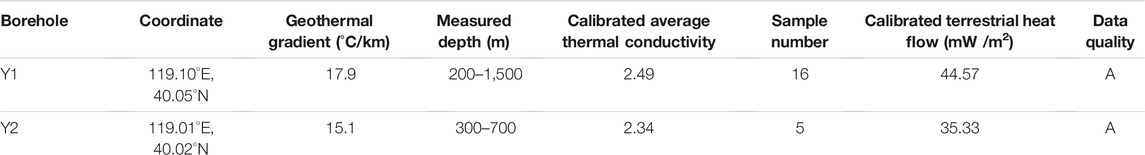
TABLE 1. Calculated result of terrestrial heat flow in the Yanheying Basin.
Based on the above data, the calibrated terrestrial heat flow of the Y1 is 44.57 mW/m2 and that of the Y2 is 35.33 mW/m2, with an average of 39.95 mW/m2. The quality of the two data fulfills the criteria for Category A (Jiang et al., 2016). It can be seen that the average terrestrial heat flow in Yanheying Basin is much lower than the average value of 62.5 mW/m2 in continental China (Jiang et al., 2019) and that of the North China Plain (63.6 mW/m2) (Gong et al., 2011) but is close to the value of the Zhangjiakou Basin (45 mW/m2) and Chengde Basin (40.4 mW/m2) (Jiang et al., 2016; Sun et al., 2019). As the more frequent and intense the tectonic motion, the greater the terrestrial heat flow value is (Liu et al., 2016; Zhang et al., 2016). The low value of geothermal background in the study area and Yanshan area proves that the crust within the Yanshan area is relatively stable. The Yanshan area experienced a low degree of damage in the North China Craton destruction (Zhang et al., 2016). It also suggests that hot springs in the Yanshan area are mainly controlled by fault systems. The effect of terrestrial heat flow is non-significant.
The strata exposed in Y1 and Y2 (Figure 4) show that the thicknesses of the Cretaceous and Jurassic strata in Yanheying Basin are about 1.2 and 0.5 km, respectively. As these two boreholes do not penetrate in the strata below the Jurassic, the thicknesses of the rock formations below the Jurassic were hence determined by analyzing the typical geological cross-section that transects the Luanxian area in the vicinity of the study area (Zhang et al., 2017). As a result, the Changcheng System is about 1.2 km and the Jixian System 1.4 km in thickness. The Qingbaikou and the Cambrian strata are respectively 0.2 and 0.8 km thick. Thus, the total thickness of the sedimentary layers in the basin is around 5.3 km, underlain by the basement consists of crystalline rock. Previous studies show that the top of the upper crust crystalline rock, i.e. G interface in this area is 6.5 km deep, while the Vp = 6.1 km/s velocity interface (Figure 3) as the top of the upper crust is 4.2 km deep in this area. The depth of this interface can hence be averaged from the two depth values, which is 5.35 km below the surface.
Figure 3 shows the interfaces of P wave velocity of 6.2, 6.4, and 8.05 km/s, standing for bottoms of the upper crust, middle crust and the Moho surface, respectively, with depths of 14.2, 22.4 and 30.7 km (Sun et al., 1991). Simultaneously, depths of the above interfaces are 10.5, 20.9, and 31.3 km, respectively, by referring to Crust1.0 (Laske et al., 2013). Taking their average values into account, the depths are respectively 12.3, 21.6, and 31.0 km (Table 4).
Lithologically, the upper crust is formed by granodiorite and gneiss, which are exposed around the Yanheying Basin border (Figure 2) and the northern part of Chengde City. The middle crust is largely composed of amphibolitic schists and granodioritic gneisses, which are similar in lithology to the Zunhua Group of the Archaean; they widely expose in Luanxian and Zunhua. The lower crust is formed by intermediate-acid and basic granulite, the deep-derived xenoliths of which are exposed in Shangmaping, Zhangjiakou (Figure 1). Rock sampling and data collection of A and K focused on these regions, mainly on the study area (Liu et al., 2001; Lei et al., 2018). Radioactive heat production rates of different layers and data sources are shown in Table 2.
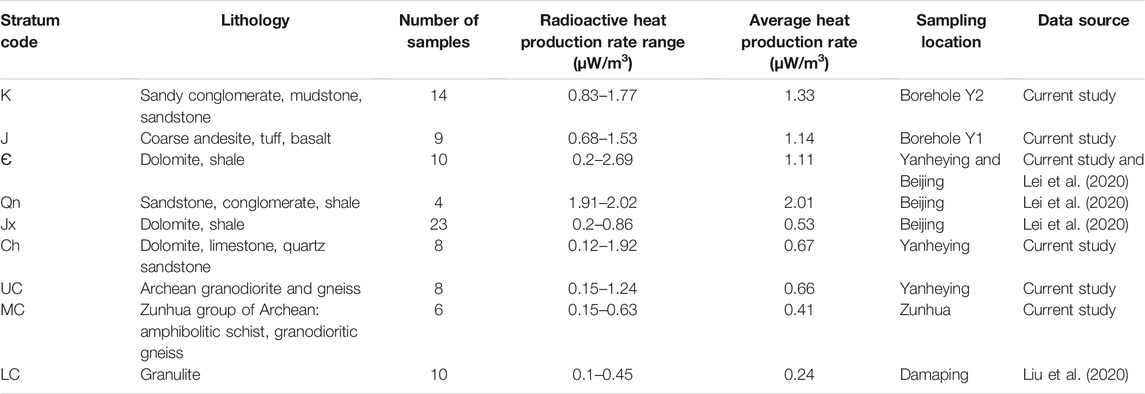
TABLE 2. Radioactive heat production rates in the Yanheying Basin and surrounding pre-Cenozoic strata.
The analytical results with data derived from rock sample testing and data collection collectively show that the heat production rate (A) in the Yanheying Basin gradually decreases from shallow to the deep portion of the crust, which is consistent with the general trend of lithospheric heat production (Xu et al., 2018). The average value of the layers’ heat production rate below the Qn formation is less than 1 μW/m3, which is similar to the results of previous studies conducted in North China (Zang et al., 2002; Wu et al., 2005).
Based on the above data and Eqs 4, 5, the lithospheric crust-mantle heat flow distribution in the study area is hence calculated with results listed in Table 3, from which the mantle heat flow qm is about 24.3 mW/m2 and the ratio of crustal heat flow to that of the mantle qc/qm is 0.65. Moreover, the results indicate a hot-mantle- cold-crust type of heat flow in the study area and in the Yanshan area (Liu et al., 2020), which conforms to results from the studies of the thermal structure in the North Craton done by Wang et al. (1996) and Qiu et al. (1998), indicating that terrestrial heat flow is mainly composed of mantle heat flow in these regions. That phenomenon provides good thermodynamic evidence for overall lithospheric thinning in the North China Craton destruction.
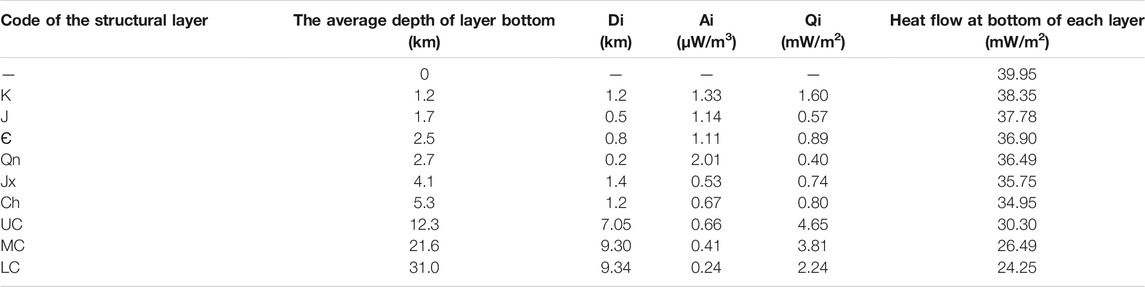
TABLE 3. Calculation result of lithospheric thermal structure in the Yanheying Basin.
Based on Table 3, a conceptual model is established for the crustal heat production rate and lithospheric thermal structure in the study area (Figure 5). The heat flow values of each layer can be directly identified from the figure. Among them, the mantle heat flow is 24.3 mW/m2, which is lower than the global average of 48.0 mW/m2 and the North China Plain average value of 30.0 mW/m2 (Chi and Yan, 1998). The low mantle heat flow and terrestrial heat flow of the study area indicate that compared with the North China Plain, the Yanshan area experienced a low degree of damage in the North China Craton destruction. It also provides good thermodynamic evidence for the spatial variation of that tectonic motion.
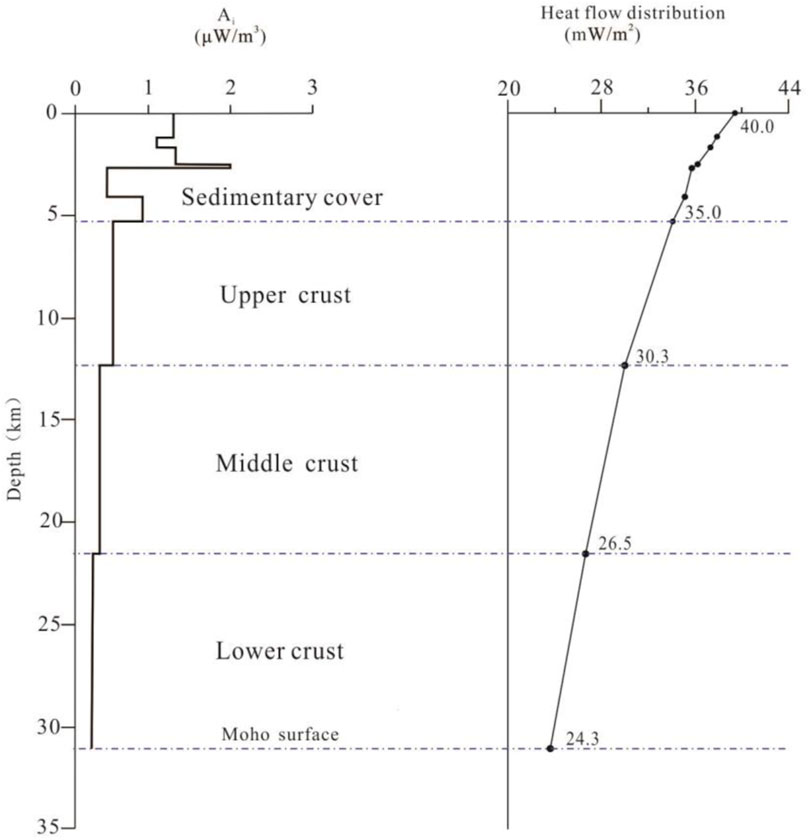
FIGURE 5. Conceptual model of lithospheric thermal structure in the Yanheying Basin.
Based on the lithospheric thermal structure in the Yanheying Basin, the deep temperature distribution of the area can be assessed. In this study, the starting point for the calculation was set at the constant temperature zone with a temperature of 15°C and a depth of 20 m (Zhang et al., 2013). The thermal conductivity of the layers above the middle crust is shown in Table 4, as the samples of these formations can be obtained via borehole sampling or surface sampling. Below the upper crust, the thermal conductivity cannot be directly measured. These thermal conductivity values are set and calibrated by Eq. 4.
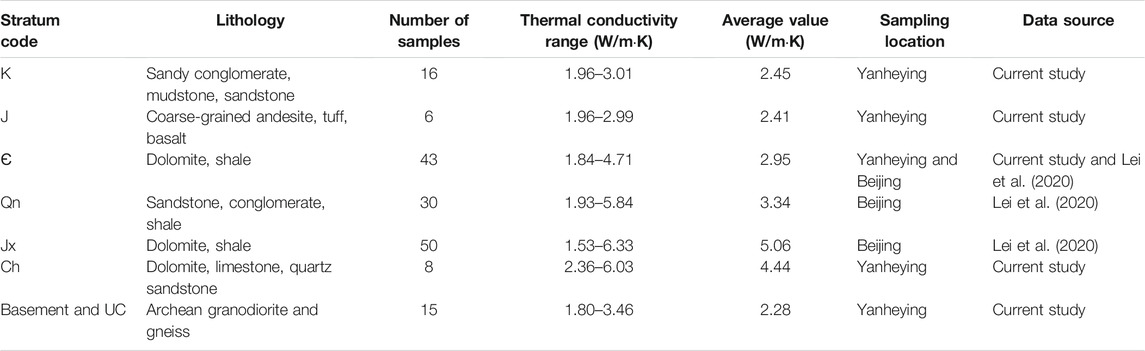
TABLE 4. Thermal conductivity of the Yanheying Basin and surrounding pre-Cenozoic strata.
As shown in Table 5, the rock formations above the Moho surface are divided into 9 layers for calculating the temperature distribution at depth. In the 0–31 km deep range, the temperature distribution and geothermal gradient of the Yanheying Basin were calculated through an iterative calculation by using Eq. 7. The results show that the temperature at the Moho surface is about 393°C, and the geothermal gradient gently decreases from 15.9°C/km to 9.8°C/km by depth generally. The geothermal gradient of the Jx and Ch formations is the lowest at 7.6°C/km, while their thermal conductivity is highest.
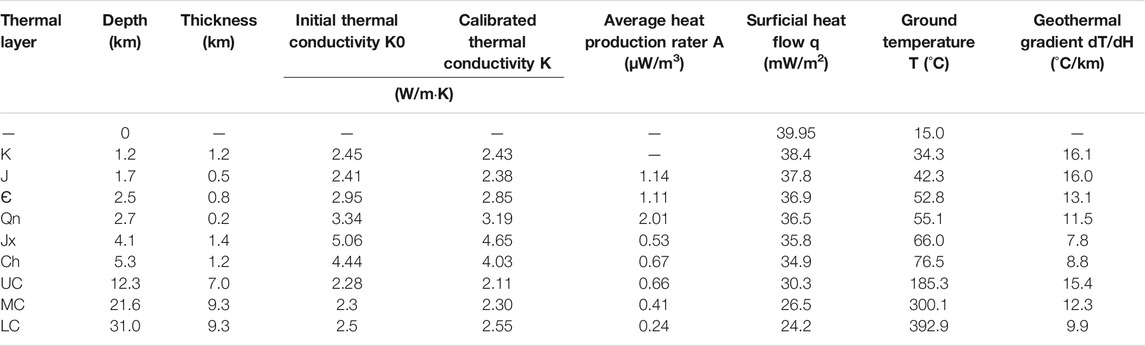
TABLE 5. Deep temperature distribution in the Yanheying Basin.
The Curie point of rocks containing iron minerals is the temperature at which highly magnetic minerals are converted to paramagnetic minerals (Ramotoroko et al., 2021). The depth of the Curie point in a certain region is the Curie isothermal surface or Curie surface. The demagnetized temperature of ilmenite and pyrrhotite is 300–350°C, and; that of magnetite is 585°C. For the minerals containing cobalt, nickel and iron, their demagnetized temperature is 760–800°C (Yang, 2015). Thus, the depth of the Curie isothermal surface can provide an effective clue to the study of the deep thermal state as well as material composition in the lithosphere (Trifonova et al., 2009; Bansal et al., 2013).
Based on the continental Curie surface map of China with data derived from aeromagnetic data (Xiong et al., 2016), the depth of the Curie surface around the Yanheying Basin is 22–25 km. In our research, the Curie surface depth is estimated to be 21.6–26.6 km with a temperature of 300–350°C. This consistency verifies the lithospheric thermal structure and deep temperature distribution in the Yanheying Basin. It also suggests that the lower crust of the Yanheying Basin is composed of rocks containing ilmenite and pyrrhotite.
In this paper, a comprehensive analysis of heat flow and lithospheric thermal structure was performed, with the case study area in the Yanheying Basin, to have a better understanding of the geothermal background and resource utilization potential of the typical intermountain basin in the eastern foothills of Yanshan Mountain. According to these analyses, some conclusions are drawn as follows:
1) The Yanheying Basin is a typical intermountain basin in the Yanshan area, North China due to the uniqueness of its location, lithospheric structure, thermal reservoirs distribution and research degree of geothermal background. The average terrestrial heat flow here is close to that of the Zhangjiakou Basin and the Chengde Basin but far lower than that of the China Mainland and the North China Plain. It indicates a relatively low value of geothermal background in the whole Yanshan area. It can be inferred that hot springs around the basins are mainly controlled by geological structures such as faulting systems. In addition, the ratio of qc/qm in the study area is 0.65. It indicates a hot-mantle-cold-crust type of lithospheric thermal structure, which is consistent with that in the North China Plain. The mantle heat is the main source of terrestrial heat flow in this area. These results provide good thermodynamic evidence for lithospheric thinning in the North China Craton and the crust of the Yanshan area.
2) The distribution of temperatures below the surface was analyzed using the one-dimensional steady-state equation. The temperature at the Moho surface is approximately 400°C, located at the low limit of the global Moho temperature. The low temperature at the deeper portion is attributed to the less thickness (31 km) of the lithosphere and low heat production (less than 1.4 μW/m3) of rocks. The depth of the Curie interface is estimated at 21.6–26.6 km, which is close to the analyzed result on the basis of aeromagnetic data. The consistency verified the regional lithospheric thermal structure and thermophysical parameters in our paper.
3) The calculation results show that the rock temperature in the Yanheying Basin is about 40–70°C at a depth of 2–6 km, where the rock formations such as Є, Qn, Jx, and Ch distribute. As karst fissures in these strata are well developed, the groundwater in the karst aquifers is heated, leading to the presence of several thermal reservoirs formed by dolomite and limestone with mid-temperature geothermal resources. These geothermal reservoirs have a potential for geothermal resources utilization in the future.
The original contributions presented in the study are included in the article/Supplementary Material, further inquiries can be directed to the corresponding author.
FL, writing and revising the manuscript; AW, revising the manuscript; GW, providing the scienctific idea and revising the manuscript; WZ, revising the manuscript; YL, field investigation and resiving the manuscript; JT, revising the manuscript.
This study was financially supported by the National Key Research and Development Program of China (Grant No. 2018YFA0404104), Key Research and Development Program of Jiangxi Province (Grant No. 20203BBG72W011)and grants from the geothermal survey project of the China Geological Survey (Grant No. DD20190128).
The authors declare that the research was conducted in the absence of any commercial or financial relationships that could be construed as a potential conflict of interest.
All claims expressed in this article are solely those of the authors and do not necessarily represent those of their affiliated organizations, or those of the publisher, the editors and the reviewers. Any product that may be evaluated in this article, or claim that may be made by its manufacturer, is not guaranteed or endorsed by the publisher.
Abdulagatova, Z., Abdulagatov, I. M., and Emirov, V. N. (2009). Effect of Temperature and Pressure on the thermal Conductivity of sandstone. Int. J. Rock Mech. Mining Sci. 46 (6), 1055–1071. doi:10.1016/j.ijrmms.2009.04.011
Anand, J., Somerton, W. H., and Gomaa, E. (1973). Predicting thermal Conductivities of Formations from Other Known Properties. Soc. Petrol. Eng. J. 13 (5), 267–273. doi:10.2118/4171-pa
Artemieva, I. M., and Mooney, W. D. (2001). Thermal Thickness and Evolution of Precambrian Lithosphere: a Global Study. J. Geophys. Res. 106 (B8), 16387–16414. doi:10.1029/2000jb900439
Bansal, A. R., Anand, S. P., Rajaram, M., Rao, V. K., and Dimri, V. P. (2013). Depth to the Bottom of Magnetic Sources (DBMS) from Aeromagnetic Data of Central India Using Modified Centroid Method for Fractal Distribution of Sources. Tectonophysics 603, 155–161. doi:10.1016/j.tecto.2013.05.024
Cermak, V., and Rybach, L. (1982). “Thermal Conductivity and Specific Heat of Minerals and Rocks,” in Physical Properties of Rocks. Editor G. Angenheister (Berlin: Springer), 305–343.
Chi, Q. H., and Yan, M. C. (1998). Radioactive Elements of Rocks in North China Platform and the thermal Structure and Temperature Distribution of the Modern continental Lithosphere. J. Chin. J. Geophys. 41 (1), 38–48. (in Chinese).
Cope, T. D., Shultz, M. R., and Graham, S. A. (2007). Detrital Record of Mesozoic Shortening in the Yanshan Belt, NE China: Testing Structural Interpretations with basin Analysis. Basin Res. 19 (2), 253–272. doi:10.1111/j.1365-2117.2007.00321.x
Davies, J. H., and Davies, D. R. (2010). Earth's Surface Heat Flux. Solid Earth 1 (1), 5–24. doi:10.5194/se-1-5-2010
Fullea, J., Muller, M. R., Jones, A. G., and Afonso, J. C. (2014). The Lithosphere-Asthenosphere System beneath Ireland from Integrated Geophysical-Petrological Modeling Ii: 3d thermal and Compositional Structure. Lithos 189 (3), 49–64. doi:10.1016/j.lithos.2013.09.014
Gong, Y. L., Wang, L. S., and Liu, S. W. (2011). The thermal Structure and thermal Evolution of Bohai Bay Basin in East China. Beijing: Atomic Energy Press. (in Chinese).
Guo, P. Y., Zhang, N., He, M. C., and Bai, B. H. (2017). Effect of Water Saturation and Temperature in the Range of 193 to 373k on the thermal Conductivity of sandstone. Tectonophysics 699, 121–128. doi:10.1016/j.tecto.2017.01.024
He, L., Hu, S., Huang, S., Yang, W., Wang, J., Yuan, Y., et al. (2008). Heat Flow Study at the Chinese Continental Scientific Drilling Site: Borehole Temperature, thermal Conductivity, and Radiogenic Heat Production. J. Geophys. Res. 113, B02404. doi:10.1029/2007jb004958
Jia, S. X., Zhang, C. K., Zhao, J. R., Fang, S. M., Liu, Z., and Zhao, J. M. (2009). Crustal Structure of the Rift-Depression basin and Uplift in the Northeast Part of North China. Chin. J. Geophys. 52 (1), 99–110. (in Chinese). doi:10.1002/cjg2.1326
Jiang, G., Hu, S., Shi, Y., Zhang, C., Wang, Z., and Hu, D. (2019). Terrestrial Heat Flow of continental China: Updated Dataset and Tectonic Implications. Tectonophysics 753 (20), 36–48. doi:10.1016/j.tecto.2019.01.006
Jiang, G. Z., Gao, P., Rao, S., Zhang, Y. L., Tang, X. Y., Huang, F., et al. (2016). Compilation of Heat Flow Data in the continental Area of China (4th Edition). J. Chin. J. Geophys. 59 (8), 2892–2910. (in Chinese).
Kern, H., and Siegesmund, S. (1989). A Test of the Relationship between Seismic Velocity and Heat Production for Crustal Rocks. Earth Planet. Sci. Lett. 92 (1), 89–94. doi:10.1016/0012-821x(89)90023-x
Lachenbruch, A. H. (1970). Crustal Temperature and Heat Production: Implications of the Linear Heat-Flow Relation. J. Geophys. Res. 75 (17), 3291–3300. doi:10.1029/jb075i017p03291
Laske, G., Masters, G., Ma, Z., and Pasyanos, M. (2013). Update on CRUST1.0 - A 1-degree Global Model of Earth's Crust: EGU General Assembly.
Lei, X. D., Hu, S. B., Li, J., Jiang, G. Z., Yang, Q. H., and Li, Q. L. (2018). Characteristics of Heat Flow and Geothermal Distribution in the Northwest Beijing Plain. J. Chin. J. Geophys. 61 (9), 3735–3748. (in Chinese with English abstract).
Liu, C. H. (2006). A Study of Hydrochemistry and Isotopes of Baimiao Hot spring, Chicheng Hot spring and Tangzimiao Hot spring. [dissertation]. Beijing: China University of Geosciences (Beijing. (in Chinese).
Liu, F., Lang, X., Lu, C., Lin, W., Tong, J., and Wang, G. (2017). Thermophysical Parameters and Lithospheric thermal Structure in Guide Basin, Northeast Qinghai-Tibet Plateau. Environ. Earth Sci. 76 (5), 199. doi:10.1007/s12665-017-6503-2
Liu, Q., Zhang, L., Zhang, C., and He, L. (2016). Lithospheric thermal Structure of the North China Craton and its Geodynamic Implications. J. Geodynamics 102, 139–150. doi:10.1016/j.jog.2016.09.005
Liu, S. F., Li, Z., and Zhang, J. F. (2004). Evolution and Tectonic System of Mesozoic Basins in Yanshan Area. J. Scientia Sinica (Terrae) 34 (0z1), 19–31. (in Chinese).
Liu, S., Su, S., and Zhang, G. (2013). Early Mesozoic basin Development in North China: Indications of Cratonic Deformation. J. Asian Earth Sci. 62, 221–236. doi:10.1016/j.jseaes.2012.09.011
Liu, Y.-S., Gao, S., Jin, S.-Y., Hu, S.-H., Sun, M., Zhao, Z.-B., et al. (2001). Geochemistry of Lower Crustal Xenoliths from Neogene Hannuoba basalt, north china Craton: Implications for Petrogenesis and Lower Crustal Composition. Geochimica et Cosmochimica Acta 65 (15), 2589–2604. doi:10.1016/s0016-7037(01)00609-3
Qiu, N. S. (1998). Thermal Status Profile in Terrestrial Sedimentary Basins in China. J. Adv. Earth Sci. 13 (5), 447–451. (in Chinese).
Rybach, L., and Buntebarth, G. (1984). The Variation of Heat Generation, Density and Seismic Velocity with Rock Type in the continental Lithosphere. J. Tectonophysics 103 (1-4), 335–344. doi:10.1016/0040-1951(84)90095-7
Sass, J. H., Lachenbruch, A. H., Moses, T. H., and Morgan, P. (1992). Heat Flow from a Scientific Research Well at Cajon Pass, California. J. Geophys. Res. 97 (B4), 5017–5030. doi:10.1029/91jb01504
Shao, X. Z., and Zhang, J. R. (1989), Structure of the Lithosphere in the Northern Part of North China. Atlas of Lithospheric Dynamics in China. Beijing: Map Publishing House. (in Chinese).
Shen, X. W. (2017). Characteristics of Some hot springs in the north of Hebei and Beijing. [dissertation]. Beijing: China University of Geosciences (Beijing. (in Chinese).
Sun, M., Liu, F., Lu, C., and Yue, C. (2020). Terrestrial Heat Flow in Chengde, Hebei Province. J. Sci. Technology Eng. 20 (25), 10144–10150. (in Chinese).
Sun, W. C., Liu, C. Q., Zhu, Z. P., Zhang, L., Song, S. Y., and Zhang, X. K. (1991). Velocity Structure of the Crust and Upper Mantle in the Northern Part of North China,” in Atlas of Lithospheric Dynamics of China, G. Y. Ding. Beijing: China Cartographic Publishing House), 251–154.
Trifonova, P., Zhelev, Z., Petrova, T., and Bojadgievaet, K. (2009). Curie point Depths of Bulgarian Territory Inferred from Geomagnetic Observations and its Correlation with Regional thermal Structure and Seismicity. J. Tectonophysics. 473 (3-4), 362–374. doi:10.1016/j.tecto.2009.03.014
Wang, J. Y., Pang, Z. H., Hu, S. B., Wang, S. J., Xu, P. F., and Wang, G. J. (2015). Geothermics and its Applications. Beijing: Science Press. (in Chinese).
Wang, Z., Jiang, G., Zhang, C., Hu, J., Shi, Y., Wang, Y., et al. (2019). Thermal Regime of the Lithosphere and Geothermal Potential in Xiong'an New Area. Energy Exploration & Exploitation 37 (2), 787–810. doi:10.1177/0144598718778163
Wu, Y., Jin, Z. M., Ou, X. G., Xu, H, J., and Wang, L. (2005). The Lithospheric thermal Structure beneath the Area of the Chinese Continental Scientific Drilling Site (CCSD). J. Acta Petrologica Sinica. 21 (2), 440–450. (in Chinese).
Xiong, S. Q., Yang, H., Ding, Y. Y., and Li, Z. K. (2016). Characteristics of Chinese Continent Curie point Isothermal. J. Chin. J. Geophys. 59 (10), 3604–3617. (in Chinese).
Xu, W., Qiu, N., Wang, Y., and Chang, J. (2018). Evolution of Meso-Cenozoic Lithospheric thermal-rheological Structure in the Jiyang sub-basin, Bohai Bay Basin, Eastern North China Craton. Int. J. Earth Sci. (Geol Rundsch) 107 (1), 153–166. doi:10.1007/s00531-016-1360-x
Yang, H. (2015). Characteristics of Chinese continental Curie point Isotherm. [dissertation]. Chengdu: Chengdu University of Technology. (in Chinese).
Yang, S. Z., Zhang, W. R., Li, G. H., and Shen, X. (1993). Experimental Research on the thermal Conductivity of Water-Saturated Rocks and Correction to the Heat Flow Observed in Qaidam Basin. ACTA petrologica sinca 9 (2), 199–204.
Zang, S. X., Liu, Y. G., and Ning, J. Y. (2002). Thermal Structure of the Lithosphere in North China. J. Chin. J. Geophys. 45(1), 56–66. (in Chinese)doi:10.1002/cjg2.216
Zhang, D. Z., Liu, Z. G., and Lu, H. L. (2013). Hebei Geothermal. Beijing: Geological Publishing House. (In Chinese).
Zhang, J., Huang, S., Zuo, Y., Zhou, Y., Liu, Z., Duan, W., et al. (2020). Terrestrial Heat Flow in the Baiyinchagan Sag, Erlian Basin, Northern China. Geothermics 86, 101799. doi:10.1016/j.geothermics.2019.101799
Zhang, L. Y., Liu, Q. Y., and He, L. J. (2016). The Different Lithospheric thermal Structure of North China Craton and its Implications. Chin. J. Geophys. 59 (10), 3618–3626. (in Chinese).
Zhang, X. (2012). A Study of the Characteristics of hot springs of Low to Moderate Temperature in Chengde District of Northern Hebei. [dissertation]. [Beijing]: China University of Geosciences (Beijing. (in Chinese).
Zhang, X. (2018). The Evolutionary Process of Yanheying Basin and Understanding of Mine Exploration. J. China Well Rock Salt 49 (1), 21–24. (in Chinese).
Zhang, Y. Q., Zhang, Z. L., Liu, Z. X., Jv, Z. Y., Li, Q., and Zhang, Y. H. (2017). Regional Geology of Hebei Province. Beijing: Geological Publishing House. (in Chinese).
Keywords: terrestrial heat flow, lithospheric thermal structure, thermal conductivity, radioactive heat production, intermountain basin, Yanshan mountain
Citation: Liu F, Wang A, Wang G, Zhang W, Liao Y and Tong J (2021) Characteristics of Terrestrial Heat Flow and Lithospheric Thermal Structure in Typical Intermountain Basin at the Eastern Foot of Yanshan Mountain, North China. Front. Earth Sci. 9:758605. doi: 10.3389/feart.2021.758605
Received: 14 August 2021; Accepted: 07 October 2021;
Published: 03 November 2021.
Edited by:
Yanlong Kong, Institute of Geology and Geophysics (CAS), ChinaReviewed by:
Jian Chang, China University of Petroleum, ChinaCopyright © 2021 Liu, Wang, Wang, Zhang, Liao and Tong. This is an open-access article distributed under the terms of the Creative Commons Attribution License (CC BY). The use, distribution or reproduction in other forums is permitted, provided the original author(s) and the copyright owner(s) are credited and that the original publication in this journal is cited, in accordance with accepted academic practice. No use, distribution or reproduction is permitted which does not comply with these terms.
*Correspondence: Guiling Wang, Z3VpbGluZ3dAMTYzLmNvbQ==
Disclaimer: All claims expressed in this article are solely those of the authors and do not necessarily represent those of their affiliated organizations, or those of the publisher, the editors and the reviewers. Any product that may be evaluated in this article or claim that may be made by its manufacturer is not guaranteed or endorsed by the publisher.
Research integrity at Frontiers
Learn more about the work of our research integrity team to safeguard the quality of each article we publish.