 Zhu Zhu
 Jiping Liu
 Mirong Song
 Shaoyin Wang5,4
- 1State Key Laboratory of Numerical Modeling for Atmospheric Sciences and Geophysical Fluid Dynamics, Institute of Atmospheric Physics, Chinese Academy of Sciences, Beijing, China
- 2University of Chinese Academy of Sciences, Beijing, China
- 3Department of Atmospheric and Environmental Sciences, University at Albany, State University of New York, Albany, NY, United States
- 4Southern Marine Science and Engineering Guangdong Laboratory (Zhuhai), Zhuhai, China
- 5School of Geospatial Engineering and Science, Sun Yat-Sen University, Zhuhai, China
- 6Department of Atmospheric and Oceanic Sciences, School of Physics, Peking University, Beijing, China
Some studies have discussed potential influences of Antarctic sea ice anomalies, Atlantic Multi-decadal Variability (AMV), and Interdecadal Pacific Oscillation (IPO) on the Southern Hemisphere (SH) climate, individually. However, it is not clear how different combinations of them influence the extratropical SH climate. Here we select three different combinations of strong anomalies in Antarctic sea ice (SI), AMV and/or IPO identified from observations, and investigate their influence on the winter extratropical SH climate using the Community Atmosphere Model. The model results show that atmospheric responses vary with different combinations. When both SI and AMV are in strong positive polarity (SI + AMV), the polar jet shifts equatorward while the subtropical jet shifts poleward, the amplitude of zonal wave number 1 is reduced in high-latitudes with minimal changes in wave number 2, and a north-south circulation dipole occurs in both the Atlantic and Pacific. Different from SI + AMV, when SI is in strong positive polarity and IPO is in strong negative polarity (SI-IPO), the reduction of wave number 1 is dramatically increased, accompanied by remarkably increased wave number 2. The north-south circulation dipole only occurs in the Pacific and is confined to the central and eastern Pacific, whereas the Atlantic is dominated by anomalously anticyclonic circulation. Together, SI + AMV-IPO leads to the largest reduction of wave number 1 in high-latitudes and subtropics, the strongest north-south circulation dipole in the Pacific as well as the Amundsen Sea Low. As a result, the three combinations produce different patterns of surface temperature and precipitation anomalies over Antarctica, Australia and South America.
Introduction
Most of surface area in the extra-tropics of the Southern Hemisphere (SH) is covered by the ocean. This leads to atmospheric circulation that is more zonally symmetric compared to its counterpart in the Northern Hemisphere (Thompson and Wallace 2000; Hall and Visbeck 2002; Sen Gupta and England 2006). A circumpolar low pressure strengthens during winter, which increases the north-south pressure gradient. A band of high pressure in the subtropics also intensifies during winter, which is featured by subsidence and divergence in the low-level atmosphere (Miyasaka and Nakamura 2010). Hence the middle to high southern latitudes are dominated by the westerly winds.
As the interface between the atmosphere and the ocean, variability of Antarctic sea ice can result in large changes in surface heat and moisture fluxes (Simmonds and Budd 1991), which might have profound influence on weather and climate in the SH extra-tropics (Mesquita et al., 2011). Antarctic sea ice extent underwent a long-term increase (statistically significant) from the late 1970s to the mid-2010s (Liu et al., 2004; Parkinson and Cavalieri 2012). Based on the historical Antarctic sea ice change, Raphael et al. (2011) showed that the positive sea ice anomalies in austral summer tend to result in positive Antarctic Oscillation (AAO, also known as Southern Annular Mode) and noticeable influence not only on polar circulation but also atmospheric circulation in lower latitudes. Associated with sea ice expansion in recent decades, the SH tropospheric jet shifts poleward in winter (Smith et al., 2017). Meanwhile, some studies examined the impacts of decreased Antarctic sea ice on SH atmosphere and showed different results. Menéndez et al. (1999) and Bader et al. (2013) found an equatorward shift of the tropospheric jet stream in winter, while Kidston et al. (2011) suggested that there is no significant change of the jet. England et al. (2018) also showed an equatorward shift of the SH atmospheric jet in winter based on the CESM whole atmosphere model simulation. Ayres and Screen (2019) suggested a weakening of the eddy-driven jet, and to a lesser extent, an equatorward shift of the jet based on the simulation of 11 models involved in the Coupled Model Intercomparison Project phase 5.
There is a growing evidence that sea surface temperature in the tropics and subtropics are playing an important role in forcing atmospheric circulation in the SH extra-tropics. The Atlantic Multi-decadal Variability (AMV) is identified as a coherent climate pattern of multi-decadal variability in the basin-wide North Atlantic sea surface temperature (SST) (Schlesinger and Ramankutty 1994; Ting et al., 2011), which is associated with changes in thermohaline circulation (Knight et al., 2005; Zhang and Delworth 2009), atmospheric blocking (Hakkinen et al., 2011), and aerosol effect (Ting et al., 2009; Booth et al., 2012). A few studies have connected the AMV (especially the tropical Atlantic SST warming) to atmospheric anomalies in the SH extra-tropics through the teleconnection of Rossby wave train. This includes the intensification of the AAO and the deepening of the Amundsen Sea Low, as well as the strong warm signals throughout the Antarctic Peninsula and much of West Antarctica (Li et al., 2014; Simpkins et al., 2014). The Interdecadal Pacific Oscillation (IPO) is identified as a climate mode of decadal to multi-decadal variability in the Pacific SST (Salinger et al., 2001; Tomita et al., 2001). The spatial pattern of IPO is similar to the El Niño–Southern Oscillation (ENSO), but IPO presents a much stronger signal in the extra-tropics than that of the ENSO (Latif and Barnett 1994, 1996; Mantua et al., 1997). The impacts of the IPO on the SH climate have been acknowledged. Sea surface temperature variability associated with IPO in the tropical west Pacific and south Pacific Convergence zone has significant impact on the SH polar circulation and climate (Meehl et al., 2014; Purich et al., 2016; Clem et al., 2018; Clem et al., 2019). During the positive IPO, the lower pressure anomaly around Antarctica and more intense cyclones and anticyclones in the SH were observed (Pezza et al., 2007). During the positive IPO phase, the temperature tends to be warmer over north and east of Australia and south of Africa, and the precipitation tends to be above normal over south of South America and below normal over east Australia and south of Africa (Dong and Dai 2015).
The aforementioned studies have improved our knowledge about the potential impacts of Antarctic sea ice anomalies, and SST anomalies in the North Atlantic or the Pacific on the SH climate, individually. Given their co-occurrences, improved knowledge of the influence of different phase combinations of the Antarctic sea ice, AMV, and/or IPO on the extratropical SH climate is needed. The impacts of Antarctic sea ice anomalies on atmospheric circulation might be not well constrained. This is partly due to atmospheric response to sea ice anomalies is nonlinear and state-dependent. That means a similar Antarctic sea ice anomaly may result in different atmospheric response given different background state associated with modes of climate variability in the North Atlantic and/or Pacific. For example, Screen and Francis (2016) showed that the influence of large reduction of Arctic sea ice on tropospheric circulation and Arctic amplification is modulated by the phase of Pacific Decadal Oscillation; Smith et al. (2017) emphasized the importance of the sea surface temperature state in the North Atlantic in atmospheric response to Arctic sea ice change.
In this study, we select different combinations of strong Antarctic sea ice anomalies, SST anomalies associated with AMV and/or IPO based on the observational data since the satellite era, and then investigate their influences on the SH extratropical climate using an atmospheric circulation model. The paper is organized as follows. Data and Model Experiments describes the data and model experiments. Results analyzes the results of model experiments focusing on changes in zonal mean circulation, atmospheric pattern, and regional temperature and precipitation. Discussion provides discussion and conclusion.
Data and Model Experiments
Data
The merged Hadley-OI SST and sea ice concentration data set is used in this study. It is a combination of the HadISST1 (Rayner et al., 2003) and NOAA OI.v2 (Reynolds et al., 2002) products and is specifically developed as surface forcing for uncoupled simulations of the Community Atmosphere Model (CAM, see Hurrell et al., 2008 for details). The standardized time series of Antarctic sea ice extent (hereafter referred to as SI) is calculated from the sea ice index provided by the National Snow and Ice Data Center (NSIDC, Fetterer et al., 2017). Because the satellite-derived sea ice data from the NSIDC has relatively more accurate total sea ice extent and interannual variability compared to the merged data. The standardized AMV and IPO indices are calculated using the above merged data. Here the AMV index is defined as the area weighted average of SST over the North Atlantic (0–70°N) following Enfield et al. (2001). The IPO index is defined as the difference between the SST averaged over the central equatorial Pacific and the SST averaged in the Northwest and Southwest Pacific following Henley et al. (2015). As shown in Figure 1 and Table 1, based on the standardized SI, AMV, and IPO indices and 0.75 standard deviation (SD) as the threshold to increase the sample size, we select years in which SI is in its large positive anomalies (>0.75 SD), AMV is in its large positive anomalies (>0.75 SD), and IPO is in its large negative anomalies (<−0.75 SD). It should be noted that there are limited cases of extreme SI anomalies, since reliable observations start from the late 1970s. Considering the sample size, we focus on the following three cases in this study:
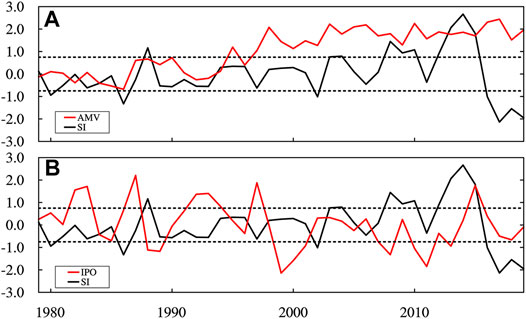
FIGURE 1. The standardized time series of annual mean Antarctic sea ice extent (SI), AMV and IPO indices during 1979–2019. (A) SI and AMV; (B) SI and IPO. The dotted line represents ±0.75 SD.

TABLE 1. List of the years for different phase combinations of the Antarctic sea ice extent (SI), AMV, and IPO based on the standardized SI, AMV and IPO indices that exceed ±0.75 SD.
Case 1: Both SI and AMV are in anomalously strong positive phases (hereafter referred to as SI + AMV).
Case 2: SI is in anomalously strong positive phase, whereas IPO is in anomalously strong negative phase (hereafter referred to as SI-IPO).
Case 3: Strong positive SI, positive AMV and negative IPO occur at the same time (hereafter referred to as SI + AMV-IPO).
We then generate composite fields of SST and sea ice concentration (SIC) anomalies for the above three situations (Figures 2, 3), which are used as the prescribed boundary conditions for our model experiments as described in Model Experiments.
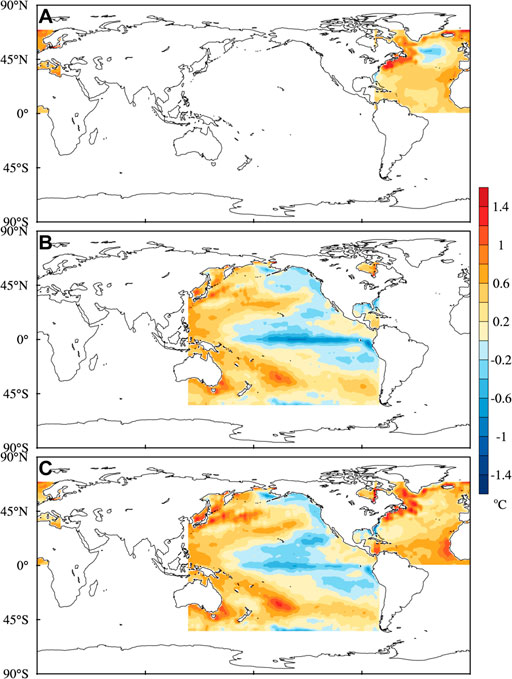
FIGURE 2. The annual-mean composite fields of SST anomalies for three situations. (A) SI + AMV (2004, 2008, 2009, 2010, 2012, 2013, 2014, and 2015); (B) SI-IPO (1988, 2008, 2010, and 2013); (C) SI + AMV-IPO (2008, 2010, and 2013).
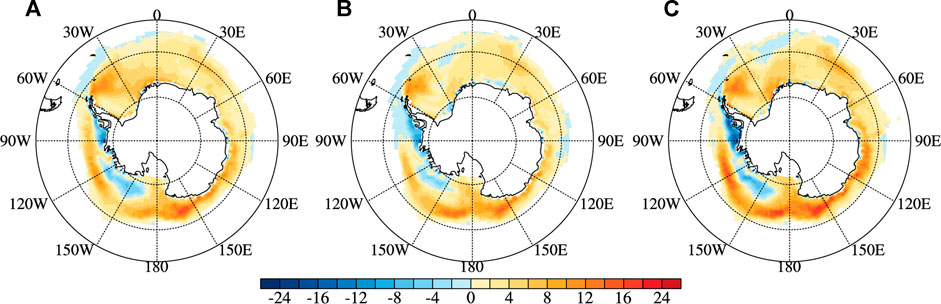
FIGURE 3. Same as Panel 2, but for Antarctic sea ice concentration anomalies.
For case 1, the North Atlantic shows a basin-wide warming that resembles the canonical positive AMV except that there is a cold anomaly south of Greenland (Figure 2A). Much of the Antarctic exhibits more than normal sea ice cover, except the southern Amundsen and Bellingshausen Seas (Figure 3A).
For case 2, the Pacific is characterized by cold anomalies in the central and eastern tropical Pacific and warm anomalies in the western and central subtropical and mid-latitude Pacific that resemble the canonical negative IPO (Figure 2B). The anomalies of sea ice cover are qualitatively consistent with that of case 1 (Figure 3B).
For case 3, the SST patterns in the North Atlantic and Pacific are similar to those of case 1 and 2, but the warm anomalies are enhanced relatively and there is no cold anomaly south of Greenland (Figure 2C). The pattern of Antarctic sea ice is also similar to those of case 1 and 2, but has relatively larger anomalies (Figure 3C). The sea ice anomaly fields are qualitatively consistent with each other in the three cases, which is reflected by high spatial correlation coefficient (r > 0.85).
Model Experiments
Numerical experiments are performed using the Community Atmosphere Model Version 5 (CAM5) developed by the National Center for Atmospheric Research to investigate the atmospheric response in the extratropical Southern Hemisphere to the prescribed SST and sea ice conditions. In this study, the CAM5 is run at a horizontal resolution of 1.9 ° × 2.5 °, with 30 levels vertically. We conduct four model simulations (see Table 2), including one control run and three sensitivity experiments. The SST and SIC forcing fields of all simulations are annually repeated with seasonal cycle. The control run (CON) is forced by the climatological SST and sea ice concentration calculated from the Hadley-OI data. The SST forcings of sensitivity experiments are generated by superimposing the annual-mean composite anomaly fields in the ocean basins as shown in Figure 2 on the climatology; the SIC forcings are generated by superimposing the annual-mean composite anomaly fields in Figure 3 on the climatology at grids where SIC>0 (January to December). The SI + AMV experiment is forced by superimposing the composite anomaly fields of positive SI and AMV (Figures 2A, 3A) on the climatology. The SI-IPO experiment is forced by superimposing the composite anomaly fields of positive SI and negative IPO (Figures 2B, 3B) on the climatology. The SI + AMV-IPO experiment is forced by superimposing the composite anomaly fields of strong positive SI and AMV, and negative IPO (Figures 2C, 3C) on the climatology. Other forcings such as greenhouse gases and ozone are fixed at the level of the year of 2000. All the experiments are run for 71 years, and we analyze the simulation of the last 70 years. The difference between the sensitivity experiments and the control run are used to represent the model response to the prescribed SST and sea ice anomalies. In this study, we focus on the extended Southern Hemisphere winter defined as June to September, which shows the strongest response compared to other seasons. Two-tail student t test is used for significant test.
TABLE 2. List of numerical experiments performed in this study.
Results
Zonal Mean Change
Figure 4 shows the zonal mean temperature difference between the sensitivity experiments and control run during winter. For SI + AMV and SI-IPO experiments, the increased sea ice cover in the Southern Ocean reduces the transfer of heat (sensible and latent) from the ocean to the atmosphere. This results in intensified surface cooling between ∼55°S and ∼75°S, and the cold anomalies decay from the surface (around −2.5°C) to the lower troposphere, indicating a shallow vertical mode. The cooling of SI + AMV is relatively stronger and extends higher in vertical relative to that of SI-IPO. Meanwhile, SI + AMV produces significant warming in the mid-troposphere over the polar cap and the entire troposphere in the subtropics, but there is a minimal temperature change in between (Figure 4A). By contrast, SI-IPO produces significant warming for most of the troposphere in the Southern Hemisphere (Figure 4B). When the high Antarctic sea ice cover, positive AMV and negative IPO are combined, the surface-intensified cooling becomes slightly shallower in the vertical than those of SI + AMV and SI-IPO, but the warming for most of the troposphere in the Southern Hemisphere is greatly enhanced, especially for two warming centers in the mid-troposphere over the polar cap and in the upper troposphere in the subtropics (Figure 4C).
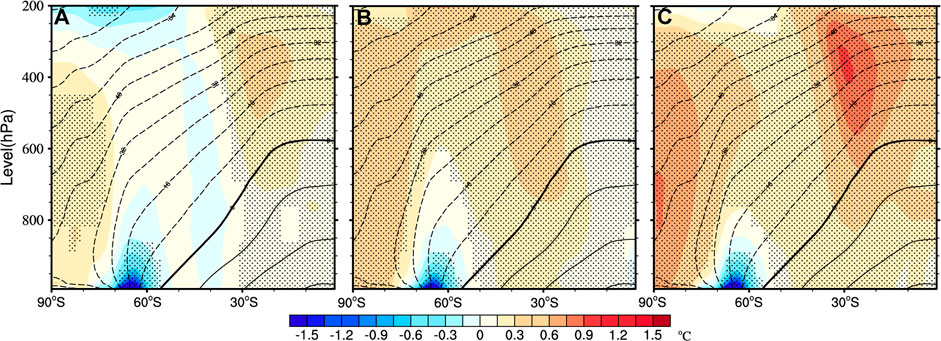
FIGURE 4. Difference in winter zonal mean temperature between the sensitivity experiments and control run. (A) SI + AMV minus control run; (B) SI-IPO minus control run; (C) SI + AMV-IPO minus control run. Dotted areas indicate 95% significance.
Consistent with the changes in the temperature gradient, the response of the zonally averaged zonal wind to SI + AMV exhibits stronger westerlies in the lower troposphere centered ∼50°S and weaker westerlies in the entire troposphere centered ∼75°S (Figure 5A). Such response implies an equatorward shift of the polar front as well as the eddy-driven polar jet stream. In the subtropics, SI + AMV results in stronger westerlies south of 30°S and weaker westerlies north of 30°S, especially in the upper troposphere. This implies a poleward shift of the subtropical jet stream. SI-IPO shows similar responses. However, compared to SI + AMV, the response of the zonal wind to SI-IPO is stronger centered near 75°S and north of 30°S, but weaker in between (Figure 5B). Together, in the middle and upper troposphere, SI + AMV-IPO leads to even weaker westerly anomalies over the polar cap and in the subtropics and stronger westerly anomalies south of 30°S than those of SI + AMV and SI-IPO (Figure 5C).
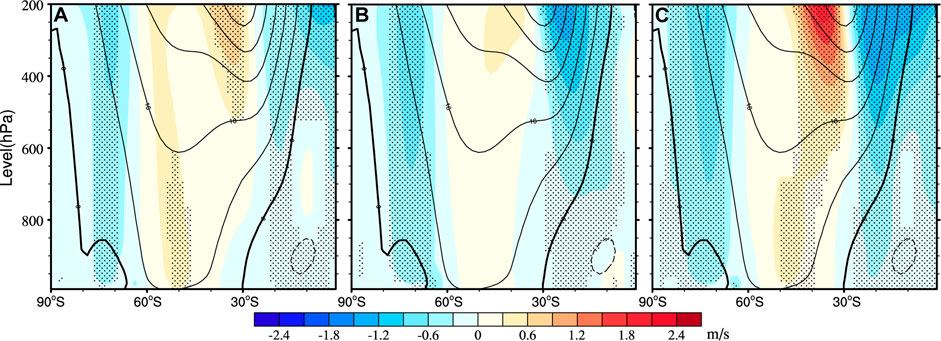
FIGURE 5. Same as Panel 4, but for the zonally averaged zonal wind.
The zonal planetary waves in the high-latitudes of the Southern Hemisphere have a profound impact on the climate of the Antarctic (i.e., sea ice distribution and regional temperature, Williams and Loon 1976; Renwick 2005; Raphael 2007; Irving and Simmonds 2016). The wave number 1 that is strongly influenced by the temperature gradient, has the largest mean amplitude of the planetary waves in winter (Randel 1988; Hobbs and Raphael 2007; Guryanov and Fahrutdinova 2014; Turner et al., 2017). As shown in Figure 6A, the amplitude of wave number 1 during winter is reduced centered ∼60°S in SI + AMV, whereas the amplitudes of wave number 2-4 have no significant change. Compared with SI + AMV, the reduction of wave number 1 in SI-IPO (centered ∼65°S) is about a factor of two larger, which is accompanied by significant increase of wave number 2 to its north (centered ∼55°S) and south (centered ∼75°S) (Figure 6B). With the combined impacts of the high Antarctic sea ice cover, positive AMV and negative IPO, the amplitude of wave number 1 has the largest reduction compared to those of SI + AMV and SI-IPO, but the increased amplitude of wave number 2 is only significant to its north (relatively smaller than that in SI-IPO) (Figure 6C).
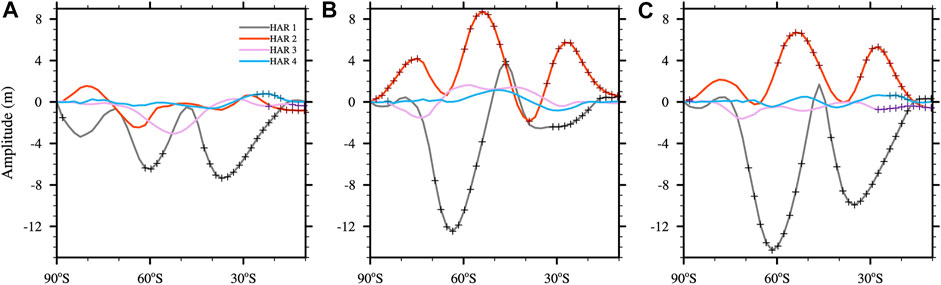
FIGURE 6. Change in the amplitude of wavenumber 1–4 at 500-hPa in winter between the sensitivity experiments and control run. (A) SI + AMV minus control run; (B) SI-IPO minus control run; (C) SI + AMV-IPO minus control run. The Fourier analysis is used to calculate wavenumber 1–4. The plus marks indicate 95% significance.
In the subtropics, the amplitude of wave number 1 is also reduced centered ∼35°S in SI + AMV, whereas the amplitudes of wave number 2–4 have minimal change (Figure 6A). By contrast, a smaller reduction (but significant) of wave number 1 occurs in SI-IPO, which is associated with significant increase in wave number 2 centered ∼30°S (Figure 6B). Together, SI + AMV-IPO results in the largest decrease in the amplitude decreasing of wave number 1 centered ∼35°S and an increased amplitude of wave number 2 centered ∼30°S (comparable to that of SI-IPO) (Figure 6C).
Atmospheric Pattern Change
In the SH extra-tropics, the Antarctic Oscillation (AAO) is the dominant mode of atmospheric variability (nearly zonally symmetric, Gong and Wang 1998; Jones and Widmann 2003), which drives large climate fluctuations stretching from the mid-latitudes across the Southern Ocean to Antarctica. Meanwhile, some studies showed zonal asymmetries of AAO effects, which are associated with zonal wave number 3 (Sallee et al., 2010; Fogt et al., 2012; Zhang et al., 2018). Different from the AAO, the Amundsen Sea Low (ASL) is a non-zonal atmospheric circulation (Turner et al., 2013), which strongly influences the climate of West Antarctica by modulating the meridional circulation (Hosking et al., 2013; Coggins and McDonald 2015; Raphael et al., 2016; Raphael et al., 2019). Three subtropical highs located over the South Atlantic, South Pacific and Indian are intense in winter and have a significant influence on the subtropical and mid-latitude climate (Miyasaka and Nakamura 2010).
Here we examine changes in sea level pressure and near surface wind between the sensitivity experiments and control run during winter. As shown in Figure 7A (the solid red lines outline the subtropical highs based on the 1020-hPa isoline), in response to SI + AMV, in the Atlantic Ocean, a weakening of the easterly flow is found in the subtropics centered ∼30°S and a weakening of the westerly flow lies in the high latitudes centered ∼65°S. (Figure 7A). This is consistent with the below-normal pressure over the subtropical and mid-latitude Atlantic and above-normal pressure over the Weddell Sea. The Pacific Ocean shows quite opposite responses compared to that of the Atlantic Ocean. There is a strengthening of the easterly flow in the subtropics and the southern Ross and Amundsen/Bellingshausen Seas, and a strengthening of the westerly flow in between, centered ∼50°S. Correspondingly, the pressure anomalies show a north-south dipole pattern, and the negative pressure anomalies in the south extend northeastward from the east Ross and Amundsen Seas to the subtropical Atlantic. This indicates a strengthening of the ASL. Following the AAO definition of Gong and Wang, (1999), we calculate AAO index as the difference of zonally averaged sea level pressure between 40°S and 65°S. This index manifests the zonal symmetry structure of AAO. It appears that there is no significant change in the AAO index. However, the amplitude of wave number 1 is weakened in the high-latitude Southern Ocean, with small changes in wave number 2–3. SI + AMV produces a weakening of the Atlantic subtropical high and a strengthening of the Pacific subtropical high, but no obvious change in the Indian subtropical high. The pressure changes induced by SI + AMV in our study are almost similar to the result of Li et al. (2014, in which the CAM4 atmospheric model is forced with SST related to the positive AMV only), but quite opposite to that of Li et al. throughout Antarctica. This suggests that more Antarctic sea ice alters the influence of the positive AMV over the polar cap.
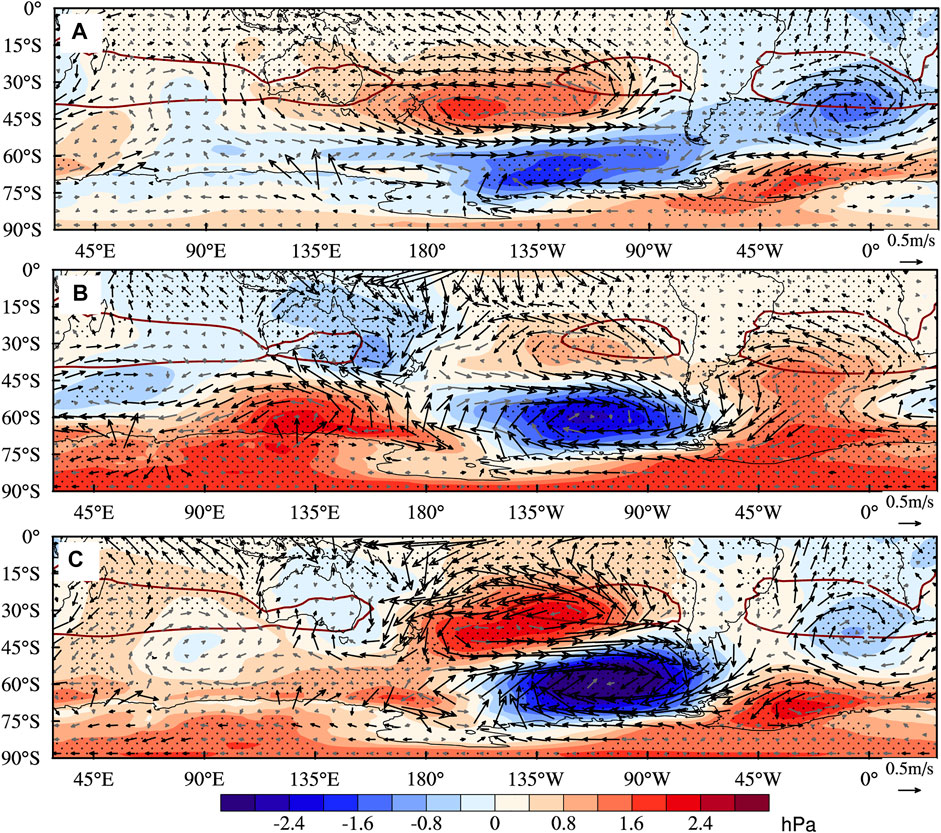
FIGURE 7. The difference of SLP (color shaded) and wind (vector) at 992 hPa (the bottom level of the model) between the sensitivity experiments and control run. (A) SI + AMV minus control run; (B) SI-IPO minus control run; (C) SI + AMV-IPO minus control run. Dotted areas and thick black vectors indicate 95% significance.
For SI-IPO, the circulation changes in most of the Pacific looks similar to that of SI + AMV. However, the north-south dipole pattern of pressure anomalies is limited to the central and eastern Pacific, the location of its north and south centers is more symmetrical, and the negative pressure anomalies in the south are much larger. The western Pacific and eastern Indian are characterized by the north-south dipole pattern having the opposite sign of SI + AMV, and the positive pressure anomalies in the south are significantly strong. Different from SI + AMV, an anomalous anticyclonic circulation occupies the Atlantic, which is consistent with the broad positive pressure anomalies there. The pressure anomalies in the Southern Ocean lead to the much enhanced wave number 2 pattern. Thus SI-IPO results in a much stronger ASL than that of SI + AMV. There is still no significant change in the AAO index. However, the reduction of wave number 1 is dramatically enhanced in the southern high-latitude. Moreover, it is companied with remarkably enhanced wave number 2 to its north and south. Also, there is no significant change in wave number 3. SI-IPO produces a stronger subtropical high in the eastern Pacific and Atlantic and a weaker subtropical high in the western Pacific, and no significant change in the subtropical high in the Indian Ocean.
Associated with the combined high Antarctic sea ice cover, positive AMV and negative IPO, the circulation anomalies in the Atlantic resemble that of SI + AMV, but with weaker negative pressure anomaly over the subtropical Atlantic and stronger positive pressure anomaly over the Weddell Sea. This is due to the cancellation of the pressure anomalies in the subtropical Atlantic and the reinforcement of the pressure anomalies in the southern Atlantic between SI + AMV and SI-IPO. The north-south dipole pattern of circulation anomalies in the Pacific becomes more pronounced, but the anomaly centers are more northwest to southeast oriented, which is due to the reinforcement of circulation anomalies between SI + AMV and SI-IPO. Much of the Indian Ocean shows weak positive pressure anomalies due to a cancellation between SI + AMV and SI-IPO. Compared to SI + AMV and SI-IPO, SI + AMV-IPO results in the strongest ASL. It also produces an insignificant change of AAO, but with the largest reduction in the amplitude of wave number 1 in both the southern high-latitude and subtropics. Like SI-IPO, SI + AMV-IPO also shows enhances wave number 2 pattern in the circumpolar region and small change in wave number 3. Meanwhile, there is a stronger subtropical high in the eastern Pacific and Indian and a weaker subtropical high in the Atlantic.
Regional Temperature and Precipitation Change
What are the influences of the aforementioned changes in atmospheric pattern over the land in the extratropical Southern Hemisphere? Figures 8, 9 show the changes in 2-m temperature and precipitation during winter. Over Antarctica, in response to SI + AMV, significant warm anomalies are found in the west Antarctic Peninsula/Palmer Land and the western Ross Ice Shelf and adjacent land area and significant cold anomalies are found in the land area adjacent to the Ronne Ice Shelf. Meanwhile, significantly decreased precipitation is found at Marie Byrd Land and adjacent Ross Ice Shelf and increased precipitation is found at the western Ross Ice Shelf and adjacent land area. This is a result of the anomalous meridional flows associated with the strengthening of the low pressure extending northeastward from the east Ross and Amundsen Seas to the Atlantic. Besides the warming in the west Antarctic Peninsula/Palmer Land and the western Ross Ice Shelf and adjacent land area, SI-IPO produces a broad significant warming in almost the entire east Antarctica. The out-of-phase precipitation anomalies between the Antarctic Peninsula/Palmer Land and Marie Byrd Land/the eastern Ross Ice Shelf become more pronounced compared to that of SI + AMV. The east Antarctica between 60°E–120°E sees increased precipitation. This is in line with the strengthening of the ASL and the pronounced increase of the wave number 2 patten in the circumpolar region that leads to anomalous poleward heat and moisture flux in east Antarctica (60°E–120°E, Figure 7B). The coastal Antarctica between 30°W–60°E experiences decreased precipitation due to the increasing pressure. Associated with the combined high Antarctic sea ice cover, positive AMV and negative IPO, there are even more pronounced warming (compared with SI-IPO) in the west Antarctic Peninsula/Palmer Land and broad significant warming in the entire east Antarctica. The out-of-phase precipitation changes between the Antarctic Peninsula/Palmer Land and Marie Byrd Land/the eastern Ross Ice Shelf is comparable to that of SI-IPO. The increased precipitation (compared with SI-IPO) covers most of east Antarctica between 30°E–170°E.
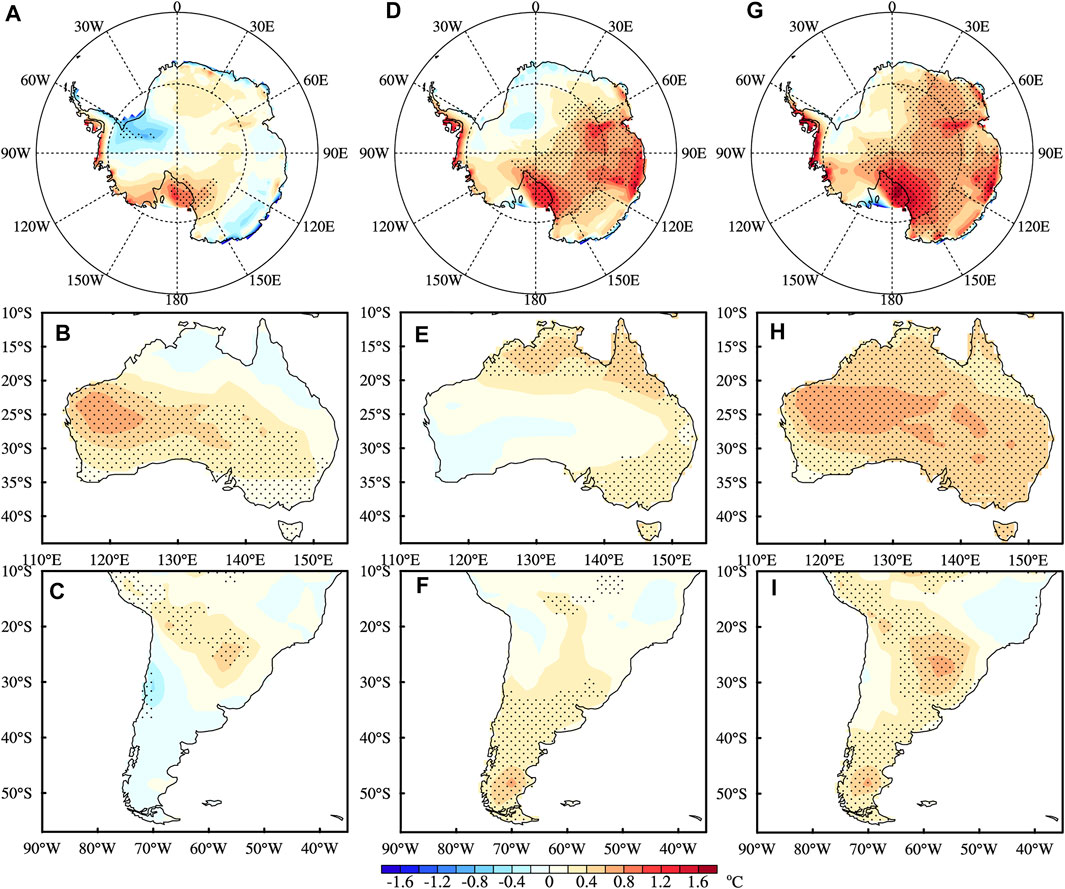
FIGURE 8. Difference in 2-m temperature over Antarctica (top panel), Australia (middle panel) and South America (bottom panel) between the sensitivity experiments and control run in winter. (A–C) SI + AMV minus control run; (D–F) SI-IPO minus control run; (G–I) SI + AMV-IPO minus control run. Dotted areas indicate 95% significance.
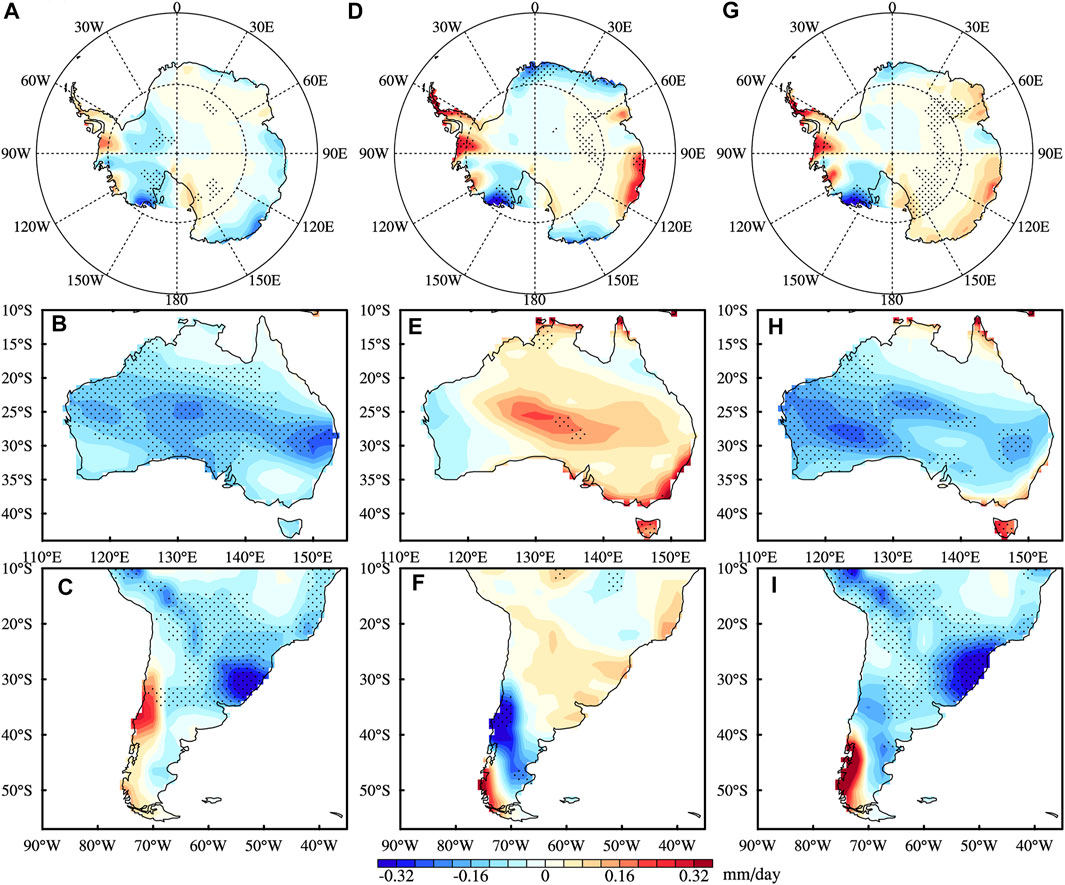
FIGURE 9. Same as Panel 8, but for precipitation.
Over Australia, there are warm anomalies and reduced precipitation in response to SI + AMV, particularly in central Australia. This is consistent with the enhanced subsiding air from the strengthening of the subtropical high in the western Pacific. By contrast, SI-IPO results in significant warming in northern and eastern Australia and increased precipitation in much of central and east Australia. This is associated with the anomalously cyclonic circulation over Australia with its center to southeast of Australia, which brings moisture air from the south and results in increased precipitation. With the combined effects of SI + AMV-IPO, the entire Australia sees significant warming. Large parts of Australia experience decreased precipitation, except the northern and southeastern parts.
Over South America, in response to SI + AMV, warm anomalies and decreased precipitation tend to extend from northwest to southeast, but precipitation has clearer signal. This is consistent with the anomalously cyclonic circulation in the subtropical to mid-latitude Atlantic, which reduces the climatological easterly/southeasterly flow and deprives moisture air from the ocean and result in decreased precipitation. The north-south dipole pattern in the Pacific enhances the easterly flow, resulting in above-normal precipitation over southwestern South America. SI-IPO results in significant warm anomaly in the south part of South America, and quite opposite precipitation pattern (but insignificant) compared to that of SI + AMV. This is due to the enhanced subsiding air from the strengthening of the Atlantic subtropical high in the south portion of South America. With combined effects of SI + AMV-IPO, warm anomalies and decreased precipitation occur large parts of South America.
Discussion
As shown above, three different combinations of strong anomalies in SI, AMV and/or IPO can result in different atmospheric responses in the SH extra-tropics. It is well known that variations in the sea ice cover and SST strongly affect turbulent heat and radiative fluxes at the surface, influencing atmospheric circulation. Here we calculate the response of the net surface heat flux (the sum of the sensible heat, latent heat, and net longwave radiative fluxes) to prescribed sea ice and SST changes in Figure 10. It should be noted the shortwave radiation does not influence the simulation due to sea ice and SST are specified and are not included in the net heat flux calculation. As shown in Figure 10, in all three sensitivity experiments, significant negative net heat flux anomalies (from the ocean to the atmosphere) are found at in the area associated with increased Antarctic sea ice, but positive net heat flux anomalies are located in the southern Amundsen and Bellingshausen Seas. When strong anomalies in positive SI and AMV and negative IPO occur at the same time (SI + AMV-IPO), compared to SI + AMV and SI-IPO, it leads to enhanced changes in the heat flux in the ice covered area. Thus, the atmosphere exhibits a local thermal response to the increased Antarctic sea ice. This also affects baroclinic instability and the atmosphere in remote areas (Kidston et al., 2011).
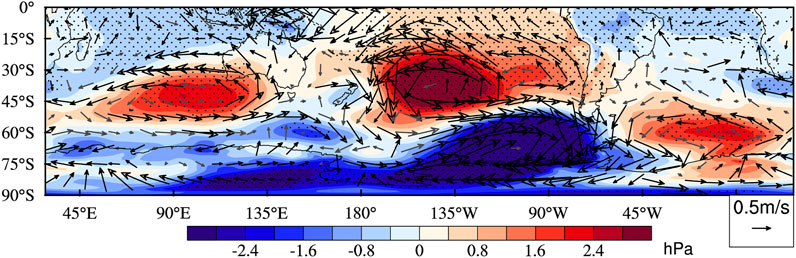
FIGURE 10. The anomalies of composite fields of sea level pressure and 10 m wind in the winter for 2008, 2010, and 2013 calculated from the ERA-Interim reanalysis. The climatology is calculated for the period 1979–2019. Dotted areas and thick black vectors indicate 95% significance.
In the SI + AMV experiment, associated with increased SST in the context of the positive AMV, there are positive net heat flux anomalies over a large fraction of the North Atlantic, especially at tropical Atlantic (Figure 10A). In SI-IPO experiment, associated with negative IPO SST pattern, the eastern Pacific is largely dominated by negative heat flux anomalies, while the western Pacific is largely dominated by positive heat flux anomalies (Figure 10B). In the SI + AMV-IPO experiment, with combined effects, there are significantly enhanced positive heat flux anomalies in the tropical Atlantic and the western south Pacific (Figure 10C). The large surface heat flux perturbations associated with SST changes would perturb local convection and then generate Rossby wave anomalies, which would affect atmospheric circulation in the remote area by wave train (Simpkins et al., 2014; Clem and Fogt 2015; Li et al., 2021). As a result, there are significant changes in zonal wavenumbers, subtropical high and jet stream at Southern Hemisphere.
Recent studies suggested that there are interactions between AMV and IPO. Although it is inappropriate to directly compare our results from sensitivity experiments with the composite from the observation, we note that there are three overlap years when generating the composites of SI + AMV and SI-IPO (Table 2). Here we generate the composite of sea level pressure and near surface winds for these 3 years using the ERA-interim reanalysis, which approximates the observed effects of SI + AMV-IPO (Figure 11). Despite the small sample size, the composite exhibits the out-of-phase circulation anomalies between the subtropical to mid-latitude and high-latitude of the Atlantic Ocean, which weakens the Atlantic subtropical high. There is a pronounced north-south dipole pattern of circulation anomalies in the Pacific Ocean, which results in the intensification of the ASL and Pacific subtropical high. These circulation anomalies are broadly consistent with our model result (Figure 7C). Unlike the sensitivity simulation, the composite shows an anomalous anticyclonic circulation between the subtropics and mid-latitude of the Indian Ocean. Additionally, the pressure response over the polar cap is different between the composite and model simulation. A larger sample size (longer time series) is needed to understand the above discrepancies.
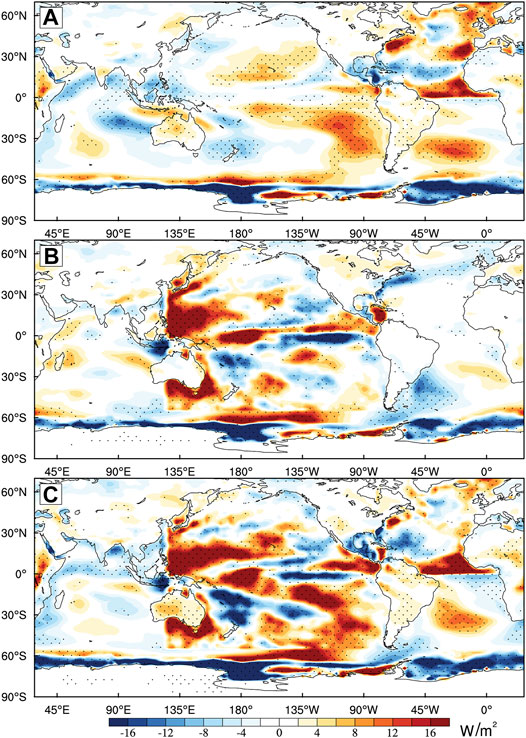
FIGURE 11. The difference of net surface flux (net longwave flux, latent heat flux, sensible heat flux) between the sensitivity experiments and control run. (A) SI + AMV minus control run; (B) SI-IPO minus control run; (C) SI + AMV-IPO minus control run. Positive values indicate the transfer of heat from the ocean to the atmosphere. Dotted areas indicate 95% significance.
The three sensitivity experiments designed in this study is based on the limited cases identified from the observational data, in which Antarctic sea ice, AMV and IPO are in their anomalously strong positive and negative phases. As shown in Table 2, since the late 1970s, there is no case for the opposite of SI + AMV (that is strong low Antarctic sea ice and negative AMV), and SI-IPO (that is strong low Antarctic sea ice and positive IPO), which is primarily due to the observations of Antarctic sea ice are limited to the satellite era. It should be noted that the three patterns are not totally independent due to the limited sample size. Long-term observations are needed to address this issue so that the model experiments could be more systematically contrasted. Recent efforts showed that with the existing proxy records, there is a scope for reconstructing a near continuous circum-Antarctic estimate of sea ice extent back to 1900 (Thomas et al., 2019). Follow-up research will include all possible combinations of different strong phases of Antarctic sea ice, AMV and IPO, and examine differences in atmospheric sensitivity.
Conclusion
The real world is very complex, with many aspects of the climate system changing and varying simultaneously. In this study, we present three different phase combinations of Antarctic sea ice, AMO, and/or IPO on the winter extratropical Southern Hemisphere climate based on the targeted atmospheric model experiments. The key findings are as follows:
1) When both Antarctic sea ice cover and AMV are in anomalously strong positive phases (SI + AMV), the eddy-driven polar jet shifts equatorward, the subtropical jet shifts poleward, and the north-south circulation dipole pattern occurs in both the Atlantic and Pacific. The ASL and Pacific subtropical high become stronger, while the Atlantic subtropical high become weaker. Significant warming is found in the west Antarctic Peninsula/Palmer Land, the western Ross Ice Shelf and adjacent land area, central and south of Australia, and northwest to southeast South America. Meanwhile, decreased precipitation is found in Marie Byrd Land and adjacent Ross Ice Shelf, most of Australia, and northwest to southeast South America and increased precipitation is found in the western Ross Ice Shelf and adjacent land area. The wave train anomaly from the South Atlantic to the Amundsen and Bellingshausen seas in SI + AMV (Figure 7A) is similar to the influence pattern induced by the positive AMO only in previous studies (Li et al., 2014; Li et al., 2021). However, the intensities and positions of wave pattern and responses over polar cap are different, which is in part due to increased Antarctic sea ice and its interaction with the positive AMO.
2) When Antarctic sea ice cover is in anomalously positive phase and IPO is in anomalously negative phase (SI-IPO), the north-south circulation dipole pattern only occurs in the Pacific, whereas the Atlantic is controlled by the anticyclonic circulation anomaly. The ASL is greatly enhanced. SI-IPO leads to increased temperature in much of east Antarctica, northern and eastern Australia, and south part of South America, and quite opposite precipitation anomalies in large parts of Australia and South America. The north-south dipole pattern mentioned above is similar to the influence pattern induced by the negative IPO only in Ding et al. (2011) and Li et al. (2021). However, their intensities and locations and responses over the Antarctic are different, which is in part due to increased Antarctic sea ice and its interaction with the negative IPO.
3) When strong anomalies in positive SI and AMV, and negative IPO occur at the same time (SI + AMV-IPO), compared to SI + AMV and SI-IPO, it leads to the strongest north-south circulation dipole pattern in the Pacific and ASL. It produces enhanced warming in the entire east Antarctica, Australia, and large parts of South America, and decreased precipitation in large parts of Australia and South America.
The atmosphere model-only experiments conducted here have advantages in which SST and sea ice conditions can be prescribed to isolate their impacts on the atmosphere. However, a major issue is such experiments cannot reflect the coupling of atmosphere–sea ice-ocean interactions, as well as associated feedbacks, which can modulate the response in the atmosphere. The next step of our research is to explore full responses to different phase combinations of Antarctic sea ice, AMV and IPO by using a fully coupled climate model, and compare coupled simulations with atmosphere-only simulations. In addition to conducting sensitivity experiments, the long control experiments of the CESM large ensemble (based on the CESM coupled model) may be used to gain insight about the possible response of the SH climate to Antarctic sea ice, AMV and IPO, i.e., Zhang (2015) and Li et al. (2018) showed examples of this alternative approach.
Data Availability Statement
The raw data supporting the conclusion of this article will be made available by the authors, without undue reservation.
Author Contributions
JL and ZZ contributed to the conception of the study; ZZ and MS performed the experiment; ZZ and JL contributed significantly to analysis and manuscript preparation; ZZ performed the data analyses and wrote the manuscript; JL, MS, SW, and YH read the manuscript and gave opinions.
Funding
This research is supported by the National Key R&D Program of China (2018YFA0605901) and the National Natural Science Foundation of China (41830536 and 41941009).
Conflict of Interest
The authors declare that the research was conducted in the absence of any commercial or financial relationships that could be construed as a potential conflict of interest.
Publisher’s Note
All claims expressed in this article are solely those of the authors and do not necessarily represent those of their affiliated organizations, or those of the publisher, the editors and the reviewers. Any product that may be evaluated in this article, or claim that may be made by its manufacturer, is not guaranteed or endorsed by the publisher.
Acknowledgments
We thank the National Center for Atmospheric Research (NCAR) for developing the Community Atmosphere Model and making the model available. We thank the European Centre for Medium-Range Weather Forecasts (ECMWF) for producing and making their reanalysis data available.
References
Ayres, H. C., and Screen, J. A. (2019). Multimodel Analysis of the Atmospheric Response to Antarctic Sea Ice Loss at Quadrupled CO 2. Geophys. Res. Lett. 46, 9861–9869. doi:10.1029/2019gl083653
Bader, J., Flügge, M., Kvamstø, N. G., Mesquita, M. D. S., and Voigt, A. (2013). Atmospheric winter response to a projected future Antarctic sea-ice reduction: a dynamical analysis. Clim. Dyn. 40, 2707–2718. doi:10.1007/s00382-012-1507-9
Booth, B. B. B., Dunstone, N. J., Halloran, P. R., Andrews, T., and Bellouin, N. (2012). Aerosols implicated as a prime driver of twentieth-century North Atlantic climate variability. Nature 484, 228–232. doi:10.1038/nature10946
Clem, K. R., and Fogt, R. L. (20151979-2012). South Pacific circulation changes and their connection to the tropics and regional Antarctic warming in austral spring, 1979-2012. J. Geophys. Res. Atmos. 120, 2773–2792. doi:10.1002/2014jd022940
Clem, K. R., Lintner, B. R., Broccoli, A. J., and Miller, J. R. (2019). Role of the South Pacific Convergence Zone in West Antarctic Decadal Climate Variability. Geophys. Res. Lett. 46, 6900–6909. doi:10.1029/2019gl082108
Clem, K. R., Orr, A., and Pope, J. O. (2018). The Springtime Influence of Natural Tropical Pacific Variability on the Surface Climate of the Ross Ice Shelf, West Antarctica: Implications for Ice Shelf Thinning. Sci. Rep. 8, 10. doi:10.1038/s41598-018-30496-5
Coggins, J. H. J., and McDonald, A. J. (2015). The influence of the Amundsen Sea Low on the winds in the Ross Sea and surroundings: Insights from a synoptic climatology. J. Geophys. Res. Atmos. 120, 2167–2189. doi:10.1002/2014jd022830
Ding, Q., Steig, E. J., Battisti, D. S., and Küttel, M. (2011). Winter warming in West Antarctica caused by central tropical Pacific warming. Nat. Geosci 4, 398–403. doi:10.1038/ngeo1129
Dong, B., and Dai, A. (2015). The influence of the Interdecadal Pacific Oscillation on Temperature and Precipitation over the Globe. Clim. Dyn. 45, 2667–2681. doi:10.1007/s00382-015-2500-x
Enfield, D. B., Mestas-Nuñez, A. M., and Trimble, P. J. (2001). The Atlantic Multidecadal Oscillation and its relation to rainfall and river flows in the continental U.S. Geophys. Res. Lett. 28, 2077–2080. doi:10.1029/2000gl012745
England, M., Polvani, L., and Sun, L. (2018). Contrasting the Antarctic and Arctic Atmospheric Responses to Projected Sea Ice Loss in the Late Twenty-First Century. J. Clim. 31, 6353–6370. doi:10.1175/JCLI-D-17-0666.1
Fetterer, F., Knowles, K., Meier, W. N., Savoie, M., and Windnagel, A. K. (2017). updated daily. Sea Ice Index, Version 3. Boulder, Colorado USA: NSIDC: National Snow and Ice Data Center. doi:10.7265/N5K072F8
Fogt, R. L., Jones, J. M., and Renwick, J. (2012). Seasonal Zonal Asymmetries in the Southern Annular Mode and Their Impact on Regional Temperature Anomalies. J. Clim. 25, 6253–6270. doi:10.1175/jcli-d-11-00474.1
Gong, D., and Wang, S. (1998). Antarctic oscillation: concept and applications. Chin. Sci. Bull. 43, 734–738. doi:10.1007/bf02898949
Gong, D., and Wang, S. (1999). Definition of Antarctic Oscillation index. Geophys. Res. Lett. 26, 459–462. doi:10.1029/1999GL900003
Guryanov, V. V., and Fahrutdinova, A. N. (2014). Height-latitude structure of stationary planetary waves in the stratosphere and lower mesosphere. Adv. Space Res. 53, 674–688. doi:10.1016/j.asr.2013.12.010
Häkkinen, S., Rhines, P. B., and Worthen, D. L. (2011). Atmospheric Blocking and Atlantic Multidecadal Ocean Variability. Science 334, 655–659. doi:10.1126/science.1205683
Hall, A., and Visbeck, M. (2002). Synchronous variability in the southern hemisphere atmosphere, sea ice, and ocean resulting from the annular mode. J. Clim. 15, 3043–3057. doi:10.1175/1520-0442(2002)015<3043:Svitsh>2.0.Co;2
Henley, B. J., Gergis, J., Karoly, D. J., Power, S., Kennedy, J., and Folland, C. K. (2015). A Tripole Index for the Interdecadal Pacific Oscillation. Clim. Dyn. 45, 3077–3090. doi:10.1007/s00382-015-2525-1
Hobbs, W. R., and Raphael, M. N. (2007). A representative time-series for the Southern Hemisphere zonal wave 1. Geophys. Res. Lett. 34, 6. doi:10.1029/2006gl028740
Hosking, J. S., Orr, A., Marshall, G. J., Turner, J., and Phillips, T. (2013). The Influence of the Amundsen-Bellingshausen Seas Low on the Climate of West Antarctica and its Representation in Coupled Climate Model Simulations. J. Clim. 26, 6633–6648. doi:10.1175/jcli-d-12-00813.1
Hurrell, J. W., Hack, J. J., Shea, D., Caron, J. M., and Rosinski, J. (2008). A new sea surface temperature and sea ice boundary dataset for the Community Atmosphere Model. J. Clim. 21, 5145–5153. doi:10.1175/2008jcli2292.1
Irving, D., and Simmonds, I. (2016). A New Method for Identifying the Pacific-South American Pattern and its Influence on Regional Climate Variability. J. Clim. 29, 6109–6125. doi:10.1175/jcli-d-15-0843.1
Jones, J. M., and Widmann, M. (2003). Instrument- and tree-ring-based estimates of the Antarctic oscillation. J. Clim. 16, 3511–3524. doi:10.1175/1520-0442(2003)016<3511:Iateot>2.0.Co;2
Kidston, J., Taschetto, A. S., Thompson, D. W. J., and England, M. H. (2011). The influence of Southern Hemisphere sea-ice extent on the latitude of the mid-latitude jet stream. Geophys. Res. Lett. 38, 5. doi:10.1029/2011gl048056
Knight, J. R., Allan, R. J., Folland, C. K., Vellinga, M., and Mann, M. E. (2005). A signature of persistent natural thermohaline circulation cycles in observed climate. Geophys. Res. Lett. 32, 4. doi:10.1029/2005gl024233
Latif, M., and Barnett, T. P. (1994). Causes of Decadal Climate Variability over the North Pacific and North America. Science 266, 634–637. doi:10.1126/science.266.5185.634
Latif, M., and Barnett, T. P. (1996). Decadal climate variability over the North Pacific and North America: Dynamics and predictability. J. Clim. 9, 2407–2423. doi:10.1175/1520-0442(1996)009<2407:Dcvotn>2.0.Co;2
Li, D., Zhang, R., and Knutson, T. (2018). Comparison of Mechanisms for Low-Frequency Variability of Summer Arctic Sea Ice in Three Coupled Models. J. Clim. 31, 1205–1226. doi:10.1175/jcli-d-16-0617.1
Li, X., Cai, W., Meehl, G. A., Chen, D., Yuan, X., Raphael, M., et al. (2021). Tropical teleconnection impacts on Antarctic climate changes. Nat. Rev. Earth Environ. 2, 680–698. doi:10.1038/s43017-021-00204-5
Li, X., Holland, D. M., Gerber, E. P., and Yoo, C. (2014). Impacts of the north and tropical Atlantic Ocean on the Antarctic Peninsula and sea ice. Nature 505, 538–542. doi:10.1038/nature12945
Liu, J., Curry, J. A., and Martinson, D. G. (2004). Interpretation of recent Antarctic sea ice variability. Geophys. Res. Lett. 31, L02205. doi:10.1029/2003gl018732
Mantua, N. J., Hare, S. R., Zhang, Y., Wallace, J. M., and Francis, R. C. (1997). A Pacific interdecadal climate oscillation with impacts on salmon production. Bull. Amer. Meteorol. Soc. 78, 1069–1079. doi:10.1175/1520-0477(1997)078<1069:Apicow>2.0.Co;2
Meehl, G. A., Teng, H., and Arblaster, J. M. (2014). Climate model simulations of the observed early-2000s hiatus of global warming. Nat. Clim Change 4, 898–902. doi:10.1038/nclimate2357
Menéndez, C. G., Serafini, V., and Le Treut, H. (1999). The effect of sea-ice on the transient atmospheric eddies of the Southern Hemisphere. Clim. Dyn. 15, 659–671. doi:10.1007/s003820050308
Mesquita, M. D. S., Hodges, K. I., Atkinson, D. E., and Bader, J. R. (2011). Sea-ice anomalies in the Sea of Okhotsk and the relationship with storm tracks in the Northern Hemisphere during winter. Tellus A: Dynamic Meteorology and Oceanography 63, 312–323. doi:10.1111/j.1600-0870.2010.00483.x
Miyasaka, T., and Nakamura, H. (2010). Structure and Mechanisms of the Southern Hemisphere Summertime Subtropical Anticyclones. J. Clim. 23, 2115–2130. doi:10.1175/2009jcli3008.1
Parkinson, C. L., and Cavalieri, D. J. (20121979-2010). Antarctic sea ice variability and trends, 1979-2010. The Cryosphere 6, 871–880. doi:10.5194/tc-6-871-2012
Pezza, A. B., Simmonds, I., and Renwick, J. A. (2007). Southern Hemisphere cyclones and anticyclones: Recent trends and links with decadal variability in the Pacific Ocean. Int. J. Climatol. 27, 1403–1419. doi:10.1002/joc.1477
Purich, A., England, M. H., Cai, W., Chikamoto, Y., Timmermann, A., Fyfe, J. C., et al. (2016). Tropical Pacific SST Drivers of Recent Antarctic Sea Ice Trends. J. Clim. 29, 8931–8948. doi:10.1175/jcli-d-16-0440.1
Randel, W. J. (1988). The seasonal evolution of planetary waves in the southern hemisphere stratosphere and troposphere. Q.J R. Met. Soc. 114, 1385–1409. doi:10.1002/qj.49711448403
Raphael, M. N., Hobbs, W., and Wainer, I. (2011). The effect of Antarctic sea ice on the Southern Hemisphere atmosphere during the southern summer. Clim. Dyn. 36, 1403–1417. doi:10.1007/s00382-010-0892-1
Raphael, M. N., Holland, M. M., Landrum, L., and Hobbs, W. R. (2019). Links between the Amundsen Sea Low and sea ice in the Ross Sea: seasonal and interannual relationships. Clim. Dyn. 52, 2333–2349. doi:10.1007/s00382-018-4258-4
Raphael, M. N., Marshall, G. J., Turner, J., Fogt, R. L., Schneider, D., Dixon, D. A., et al. (2016). The Amundsen Sea Low: Variability, Change, and Impact on Antarctic Climate. Bull. Amer. Meteorol. Soc. 97, 111–121. doi:10.1175/bams-d-14-00018.1
Raphael, M. N. (2007). The influence of atmospheric zonal wave three on Antarctic sea ice variability. J. Geophys. Res. 112, 9. doi:10.1029/2006jd007852
Rayner, N. A., Parker, D. E., Horton, E. B., Folland, C. K., Alexander, L. V., Rowell, D. P., et al. (2003). Global analyses of sea surface temperature, sea ice, and night marine air temperature since the late nineteenth century. J. Geophys. Res. 108, 37. doi:10.1029/2002jd002670
Renwick, J. A. (2005). Persistent positive anomalies in the Southern Hemisphere circulation. Mon. Wea. Rev. 133, 977–988. doi:10.1175/mwr2900.1
Reynolds, R. W., Rayner, N. A., Smith, T. M., Stokes, D. C., and Wang, W. Q. (2002). An improved in situ and satellite SST analysis for climate. J. Clim. 15, 1609–1625. doi:10.1175/1520-0442(2002)015<1609:Aiisas>2.0.Co;2
Salinger, M. J., Renwick, J. A., and Mullan, A. B. (2001). Interdecadal Pacific Oscillation and South Pacific climate. Int. J. Climatol. 21, 1705–1721. doi:10.1002/joc.691
Sallée, J. B., Speer, K. G., and Rintoul, S. R. (2010). Zonally asymmetric response of the Southern Ocean mixed-layer depth to the Southern Annular Mode. Nat. Geosci 3, 273–279. doi:10.1038/ngeo812
Schlesinger, M. E., and Ramankutty, N. (1994). An oscillation in the global climate system of period 65-70 years. Nature 367, 723–726. doi:10.1038/367723a0
Screen, J. A., and Francis, J. A. (2016). Contribution of sea-ice loss to Arctic amplification is regulated by Pacific Ocean decadal variability. Nat. Clim Change, 6, 856, 860. doi:10.1038/nclimate3011
Sen Gupta, A., and England, M. H. (2006). Coupled ocean-atmosphere-ice response to variations in the Southern Annular Mode. J. Clim. 19, 4457–4486. doi:10.1175/jcli3843.1
Simmondsxs, I., and Budd, W. F. (1991). Sensitivity of the southern hemisphere circulation to leads in the Antarctic pack ice. Q.J R. Met. Soc. 117, 1003–1024. doi:10.1002/qj.49711750107
Simpkins, G. R., Mcgregor, S., Taschetto, A. S., Ciasto, L. M., and England, M. H. (2014). Tropical Connections to Climatic Change in the Extratropical Southern Hemisphere: The Role of Atlantic SST Trends. J. Clim. 27, 4923–4936. doi:10.1002/joc.69110.1175/jcli-d-13-00615.1
Smith, D. M., Dunstone, N. J., Scaife, A. A., Fiedler, E. K., Copsey, D., and Hardiman, S. C. (2017). Atmospheric Response to Arctic and Antarctic Sea Ice: The Importance of Ocean-Atmosphere Coupling and the Background State. J. Clim. 30, 4547–4565. doi:10.1175/jcli-d-16-0564.1
Thomas, E. R., Allen, C. S., Etourneau, J., King, A. C. F., Severi, M., Winton, V. H. L., et al. (2019). Antarctic Sea Ice Proxies from Marine and Ice Core Archives Suitable for Reconstructing Sea Ice over the Past 2000 Years. Geosciences 9, 506. doi:10.3390/geosciences9120506
Thompson, D. W. J., and Wallace, J. M. (2000). Annular modes in the extratropical circulation. Part I: Month-to-month variability. J. Clim. 13, 1000–1016. doi:10.1175/1520-0442(2000)013<1000:Amitec>2.0.Co;2
Ting, M., Kushnir, Y., Seager, R., and Li, C. (2009). Forced and Internal Twentieth-Century SST Trends in the North Atlantic*. J. Clim. 22, 1469–1481. doi:10.1175/2008jcli2561.1
Ting, M. F., Kushnir, Y., Seager, R., and Li, C. H. (2011). Robust Features of Atlantic Multi-Decadal Variability and Its Climate Impacts. Geophys. Res. Lett. 38, 6. doi:10.1029/2011gl048712
Tomita, T., Wang, B., Yasunari, T., and Nakamura, H. (2001). Global patterns of decadal-scale variability observed in sea surface temperature and lower-tropospheric circulation fields. J. Geophys. Res. 106, 26805–26815. doi:10.1029/2000jc000619
Turner, J., Hosking, J. S., Bracegirdle, T. J., Phillips, T., and Marshall, G. J. (2017). Variability and trends in the Southern Hemisphere high latitude, quasi-stationary planetary waves. Int. J. Climatol. 37, 2325–2336. doi:10.1002/joc.4848
Turner, J., Phillips, T., Hosking, J. S., Marshall, G. J., and Orr, A. (2013). The Amundsen Sea low. Int. J. Climatol. 33, 1818–1829. doi:10.1002/joc.3558
Williams, J., and Loon, H. V. (1976). The Connection between Trends of Mean Temperature and Circulation at the Surface: Part I. Winter. Mon. Wea. Rev. 104, 2. doi:10.1175/1520-0493(1976)1042.0.CO10.1175/1520-0493(1976)104<1591:tcbtom>2.0.co;2
Zhang, R., and Delworth, T. L. (2009). A new method for attributing climate variations over the Atlantic Hurricane Basin's main development region. Geophys. Res. Lett. 36, 5. doi:10.1029/2009gl037260
Zhang, R. (2015). Mechanisms for low-frequency variability of summer Arctic sea ice extent. Proc. Natl. Acad. Sci. USA. 112, 4570–4575. doi:10.1073/pnas.1422296112
Keywords: extratropical Southern hemisphere, Antarctic sea ice, AMV, IPO, community atmosphere model
Citation: Zhu Z, Liu J, Song M, Wang S and Hu Y (2021) Impacts of Antarctic Sea Ice, AMV and IPO on Extratropical Southern Hemisphere Climate: A Modeling Study. Front. Earth Sci. 9:757475. doi: 10.3389/feart.2021.757475
Received: 12 August 2021; Accepted: 08 October 2021;
Published: 22 October 2021.
Edited by:
Guihua Wang, Fudan University, ChinaReviewed by:
Zhaoru Zhang, Shanghai Jiao Tong University, ChinaDawei Li, Shanghai Jiao Tong University, China
Copyright © 2021 Zhu, Liu, Song, Wang and Hu. This is an open-access article distributed under the terms of the Creative Commons Attribution License (CC BY). The use, distribution or reproduction in other forums is permitted, provided the original author(s) and the copyright owner(s) are credited and that the original publication in this journal is cited, in accordance with accepted academic practice. No use, distribution or reproduction is permitted which does not comply with these terms.
*Correspondence: Jiping Liu, amxpdTI2QGFsYmFueS5lZHU=