- 1State Key Laboratory of Geomechanics and Geotechnical Engineering, Institute of Rock and Soil Mechanics, Chinese Academy of Sciences, Wuhan, China
- 2School of Engineering Science, University of Chinese Academy of Sciences, Beijing, China
- 3China-Pakistan Joint Research Center on Earth Sciences, Islamabad, Pakistan
- 4Broadvision Engineering Consultants, National Engineering Laboratory for Surface Transportation Weather Impact Prevention, Kunming, China
Rockfall geologic hazards are widely distributed. Due to their concealed nature, rockfalls are difficult to investigate using traditional contact survey methods, and the hazards they pose affect major projects and people’s safety. Reproducing methods, including scene survey and movement process analysis, are primary tasks used to prevent these hazards; however, few reconstruction methods can directly apply the parameters of the rockfall geologic hazards obtained by the scene survey to evaluate the movement process. To address this problem, a method of reproduction based on oblique photography and three-dimensional discontinuous deformation analysis (3D-DDA) is proposed; the method consists of three key techniques (oblique photography, 3D rock block system modeling, and 3D rock block system analysis). First, geometric characteristic parameters of the terrain, rockfall, and discontinuities are extracted based on oblique photography using an unmanned aerial vehicle (UAV). Second, the block system model of rockfall is reconstructed by using 3D computational geometry theory and taking these geometric characteristic parameters as an input. Finally, the whole evolution process of rockfall geologic hazard, including initiation, movement, and accumulation, is simulated by the 3D-DDA method. To verify the practicability of this reproduction method, a typical rockfall geologic hazard, located in the K8 + 050 section of the Gaohai expressway, Yunnan, China, is studied. In addition, the characteristics of 19 dangerous rock masses in the survey area are clarified, and the geometric features of the discontinuities in the rock masses are extracted based on oblique photography using an UAV. The block system model of a potential rockfall is reconstructed, the movement trajectory is simulated by the 3D-DDA method, and the evolution process of velocity and kinetic energy of the rockfall verifies that the spatial layout of the current three-level passive protective nets system is reasonable. The case study indicates that the proposed method provides a geological and mechanical model for the risk assessment of rockfall geologic hazards.
Introduction
After complex geological processes, geological discontinuities with different sizes and properties, such as faults, joints, and fissures, are widely distributed in rock masses. These deterministic or random discontinuities cut the rock masses into rock blocks with different shapes, sizes, and compositions. Under the action of environmental factors (earthquakes, precipitation, and inter alia) and engineering-induced disturbance (excavation, blasting, etc.), these rock blocks readily induce geological hazards such as rockfalls (Finlay et al., 1997; Keefer, 2002; Zhang et al., 2012; Wang et al., 2014; Fu et al., 2020; Yang et al., 2020). At present, rockfall geologic hazards are widely distributed, seriously affecting major projects such as hydropower, transportation, and mining, and endangering people’s property safety (Sättele et al., 2016). Their prevention has become a major demand on ensuring the project safety and economic development.
The reconstruction method of modeling of rockfall geologic hazards is the primary task in their prevention, and scene survey and movement process analyses are two important aspects of reconstruction. In terms of the scene survey, rockfall geologic hazards are often distributed in poor natural conditions, such as at high, hard-to-reach positions, under concealment from other surface materials, and in inclement environmental conditions, which leads to the limited use of traditional survey methods with contact and single-point characteristics. In recent years, many noncontact measurement technologies, such as oblique photography using unmanned aerial vehicle (UAV), interferometric synthetic aperture radar (InSAR), and laser Doppler velocimetry (LDV), have developed rapidly. Fruneau et al. (1996)first proved that DInSAR can be used to monitor the deformations associated with small-scale landslides. Then many scholars successively investigated the applications of DInSAR in landslide monitoring to good effect (Wasowski and Bovenga, 2014; Costantini et al., 2017; Fan et al., 2017; Vecchioli, 2017). Mutar and Biswajeet (2018) proposed a comprehensive method of evaluation of rockfall disasters based on UAV and high-resolution laser scanning data. Du et al. (2020) proposed a dangerous rock mass identification method based on LDV, which can distinguish dangerous rock from a stable rock mass through two indices of natural vibration frequency and vibration amplitude. Considering the characteristics of different measurement technologies, Xu et al. (2019) integrated a multisource space–air–ground observation system, including InSAR, LIDAR, and UAV, and slope surface observations. Many case studies prove that noncontact measurement techniques play an important role in determining the characteristic parameters of rock falls, and the efficiency and accuracy of identification of hazards have been improved.
Various simulation models or techniques have been proposed to analyze movement processes of the rockfall geologic hazards since the 1960s (Dorren, 2003; Volkwein et al., 2011). Based on these simulation models or techniques, some practical programs, such as STONE (Guzzetti et al., 2002), HY-STONE (Crosta and Agliardi, 2004), Rockyfor3-D (Dorren et al., 2004), and RAMMS: Rockfall (Christen et al., 2007), have been developed. Many commercial software packages have also been applied to the rockfall simulation, for example, Rocfall software based on an interactional model between the rockfall and the slope surface (Alejano et al., 2007; Ahmad et al., 2013; Yan et al., 2020), discrete element method software (PFC, UDEC, and 3DEC) based on the discontinuous medium theory (Lin et al., 2012; Thoeni et al., 2014; Jiang et al., 2015; Gao and Meguid, 2018; Wu et al., 2018; Liu et al., 2020; Liu et al., 2021; Zheng et al., 2021). In addition, some rock block analysis methods, such as the key block theory (Goodman and Shi, 1985; Fu et al., 2019a) and discontinuous deformation analysis (DDA) (Shi, 1988; Wu et al., 2013; Fu et al., 2017a; Peng et al., 2018), have also developed rapidly. Ohnishi et al. (1996) first applied two-dimensional DDA (2D-DDA) to assess the rockfall movement. Chen (2003) and Ma et al. (2011) also conducted numerical simulations of typical cases of rockfall geologic hazards using 2D-DDA; because 2D-DDA is limited to simulation of lateral movements and impacts, which are closely related to the 3D shape of both the rock block and slope surface, the three-dimensional discontinuous deformation analysis (3D-DDA) theory proposed by Shi (2001) can overcome these limitations. Using the 3D-DDA codes developed by Shi (2001), much research into the movement and underlying mechanisms of rockfall geologic hazards has been carried out (Yang et al., 2004; Chen et al., 2013; Zheng et al., 2014; Wang et al., 2017; Liu et al., 2019). These results show that the 3D-DDA method can simulate not only the free falling, sliding, rolling, and rebound of rockfall, but also the spatial effect of the interaction between a rockfall and the slope surface.
Scholars have carried out much research into two important aspects of reconstruction of rockfall geologic hazards; however, few methods of reconstruction can directly apply the parameters of the rockfall geologic hazards obtained by a scene survey to assess the movement process (Lan et al., 2010), which restricts the development of prevention techniques against such hazards. To address this problem, a method of reproduction based on oblique photography and 3D-DDA is demonstrated. In this article, A Brief of the Reproduction Method presents a brief of the reproduction method; Background of a Rockfall Geologic Hazard Case introduces a case of rockfall geologic hazard; in Basic Data Extracted Using Oblique Photography, 3D Rock Block System Modeling, and Movement Process Analysis of the Rockfall Geologic Hazard, three key techniques used in the reproduction method, including oblique photography, 3D rock block system modeling, and 3D rock block system analysis, are described and verified by the way of a case study.
A Brief of the Reproduction Method
To combine the measurement data with the movement process analysis, a method of reproduction of rockfall geologic hazard based on oblique photography and 3D-DDA is proposed; this method mainly includes the following steps:
a) UAV is used to take photographs of the hazard scene from multiple perspectives, the panoramic high-precision 3D model is constructed based on oblique photography, and geometric characteristic parameters of the terrain, rockfall, and discontinuities are extracted.
b) The 3D surface triangular grid of hazard scene is reconstructed through surface contouring of the terrain, and then the sliding bed block model is established using the 3D surface triangular grid.
c) For a single rockfall, the geometric surfaces that comprise the rock block are regarded as polygonal surfaces surrounded by a series of vertices. These polygonal surfaces form the rockfall block.
d) For the block system of the rock collapse, taking the triangular grid of geometric contours of rock collapse as the boundary constraint, the geometric characteristic parameters of random discontinuities are used to generate a 3D random joint network, and a 3D block-cutting algorithm is used to construct the block system.
e) These different types of rock blocks adopt the same topological description and are integrated into a 3D rock block system that can be used for the computational analysis.
f) The physico-mechanical parameters of different types of rock blocks, and the calculation parameters required for the 3D-DDA method are input.
g) The movement process of a rockfall geologic hazard is divided into multiple real-time steps. In each time step, the 3D-DDA method is used to simulate various movement modes of rockfall, including the sliding, rolling, collision, bouncing, and free movement in the air.
h) The rock block system simulation results in each real-time step are combined to reproduce the rockfall geologic hazard scene.
Using the proposed method, the evolution of a rockfall geologic hazard can be reproduced. This method of reproduction consists of three key techniques, including oblique photography in step (a), 3D rock block system modeling in steps (b)–(e) and 3D rock block system analysis in steps (f)–(h). The three techniques will now be described and applied to a case study involving a rockfall event.
Background of a Rockfall Geologic Hazard Case
As shown in Figure 1A, the study area is located at chainage K8 + 050 on the Gaohai expressway in Yunnan Province, China (longitude 102°38′57″and latitude 24°56′00″). The rockfall geologic hazard is distributed along Dianchi Lake at the northwest edge of the Dianchi fault basin and is classified as a collapse accumulation landform.
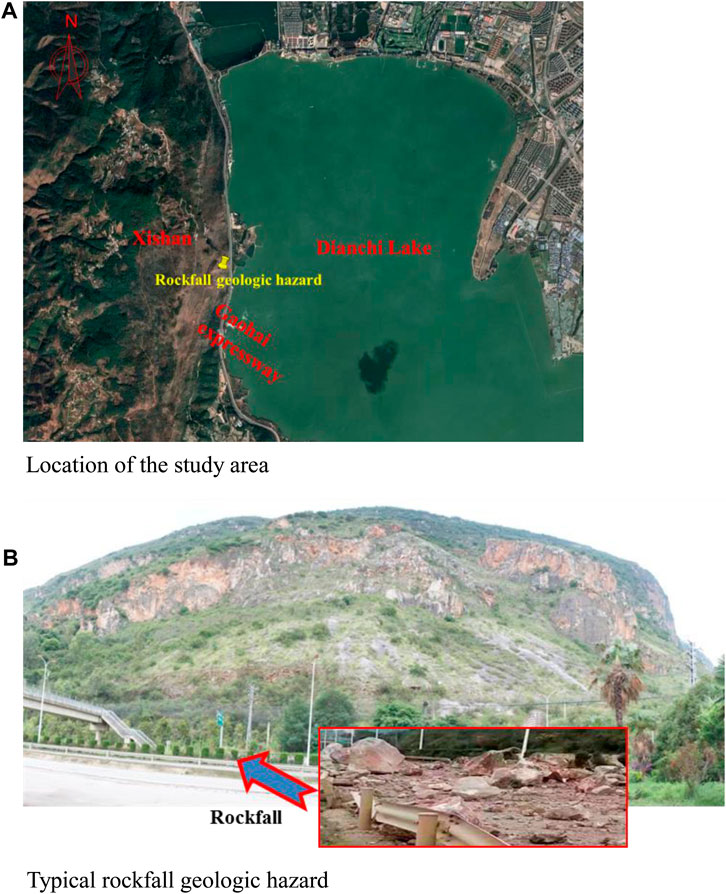
FIGURE 1. (A) Location of the study area. (B) Typical rockfall geologic hazard location and photographs of the rockfall used as a case study.
The site is composed of Palaeozoic strata, gently sloping in the east and steeping in the west; a high, linear fault cliff is apparent on the west side. The highest point is the peak of Xishan, with an altitude of 2,511 m, and the lowest point is the water surface of Dianchi Lake, at an altitude of 1886 m. The lower part of the slope is gentle with a gradient of 40°–50° and is covered with residual diluvial and colluvial silty clay and rubble. The middle and upper parts of the slope are steep with a gradient of 70°–90°, the rock mass is mainly dolomite of the Weining formation (c2w) of the Middle Carboniferous system and is broken due to the development of many joints groups.
Since the opening of the Gaohai expressway in December 2006, the slope has collapsed and fallen many times due to seismic events and intense rainfall. For example, on September 8, 2016, the natural slope collapsed, and the collapsed rock mass rolled down the hillside, washing away the passive protective nets and isolation fence of the expressway, hitting the road pavement and blocking the traffic (Figure 1B). Therefore, due to the steep terrain and the development of rock mass joints, triggered by rainfall, earthquakes, and other factors, there is the possibility of a recurrence of such rockfall events, which may pose significant potential hazards to the expressway at the foot of the slope and the passing pedestrians or vehicles, and the tasks investigating and evaluating such rockfall geologic hazards are very important.
Basic Data Extracted Using Oblique Photography
Panoramic High-Precision 3D Model
To establish a panoramic, high-precision, 3D model, the basic data pertaining to rockfall geologic hazards must be obtained by a UAV equipped with a high-definition camera. Through the field investigation of the rockfall geologic hazard, the flight altitude, camera exposure interval, flight speed, aerial landing, and other parameters are determined. After planning the flight route, ultralow altitude flights are undertaken, and the high-resolution photographs of the overall terrain and local rockfall from different vertical and oblique angles are obtained.
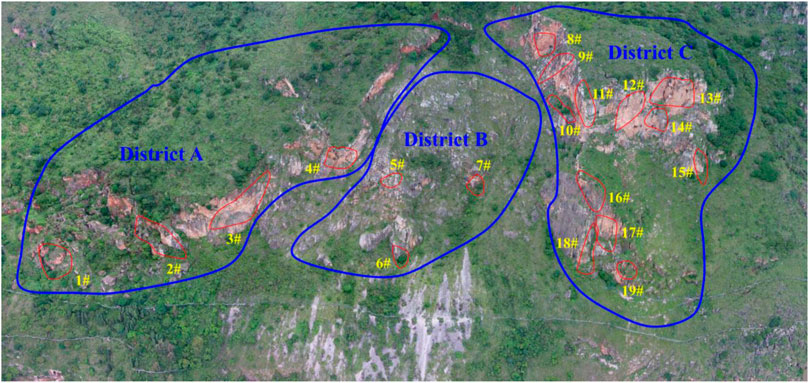
Then, the high-resolution photos are imported into professional post-processing software, such as Smart3D software. Through a series of operations, for example, aerial triangulation, geometric processing, multiview matching, triangulation, and automatic texturing, the panoramic high-precision 3D model can be established. Figure 2 shows the process of construction of the 3D model using oblique photography data. As illustrated in Figure 3, the panoramic high-precision 3D model of the rockfall case is established; the rockfall case can be divided into three districts (A, B, and C). The corresponding highway lengths within these districts are 320, 180, and 220 m, respectively. The rock masses in each district exhibit different structural characteristics due to different geologic processes or engineering activities therein.
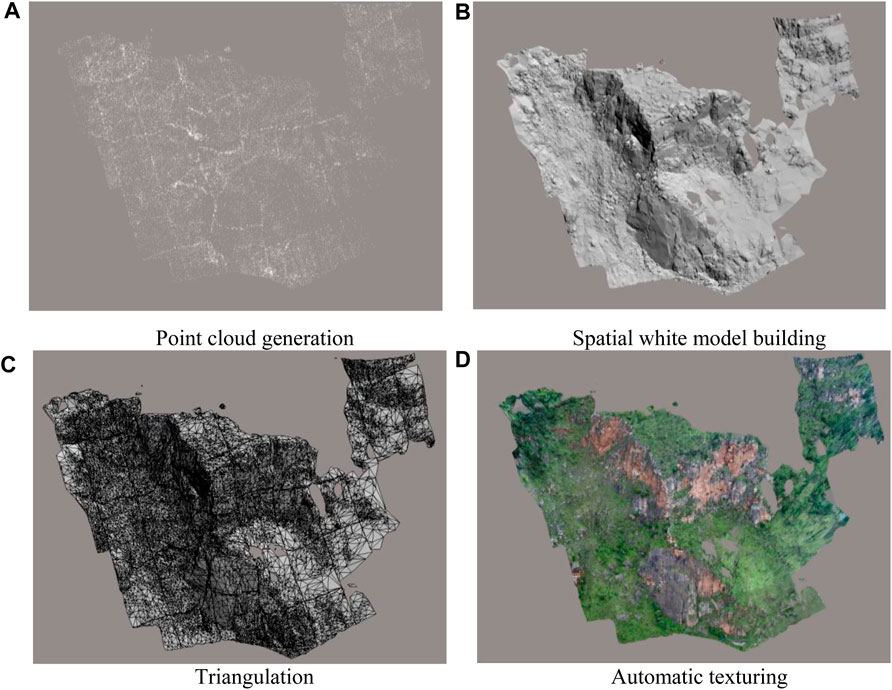
FIGURE 2. (A) Point cloud generation. (B) Spatial white model building. (C) Triangulation. (D) Automatic texturing. Construction of the 3D model using oblique photography data.
Extraction of Structural Features of Rock Masses
In the panoramic high-precision 3D model, the spatial point coordinate parameters (X, Y, and Z-coordinates) of any position can be obtained by the use of post-processing software. Not only can the control points of terrain contours but also the vertices that enclose the outline of the rockfall can be extracted. In addition, for the discontinuities in rock mass, by measuring the point coordinate parameters, the occurrence of each structural plane can be calculated. A structural plane can be expressed by the dip angle α, dip direction β, and the three-dimensional coordinates of a point in the plane (xj, yj, and zj), and the equation of the plane can be written as follows:
where sin α sin β, sin α cos β, and cos α is the unit normal vector of the plane and D represents the location of the plane as determined from (xj, yj, and zj). The coordinates of three different points on each structural plane are measured and substituted into Eq. 1: the unknowns, including the dip angle, dip direction, and D, can be obtained by solving the resulting equations. Conducting the statistical analysis on all measured discontinuities, the dip angle, the dip direction, and development density of each group of joints can be obtained. Table 1 displays statistics pertaining to results from the joint groups, there are six groups of joints (J1–J6) in District A, three groups of joints (J7–J9) in District B, and four groups of joints (J10–J13) in District C. Photographs of typical joints groups in each district are given in Figure 4.
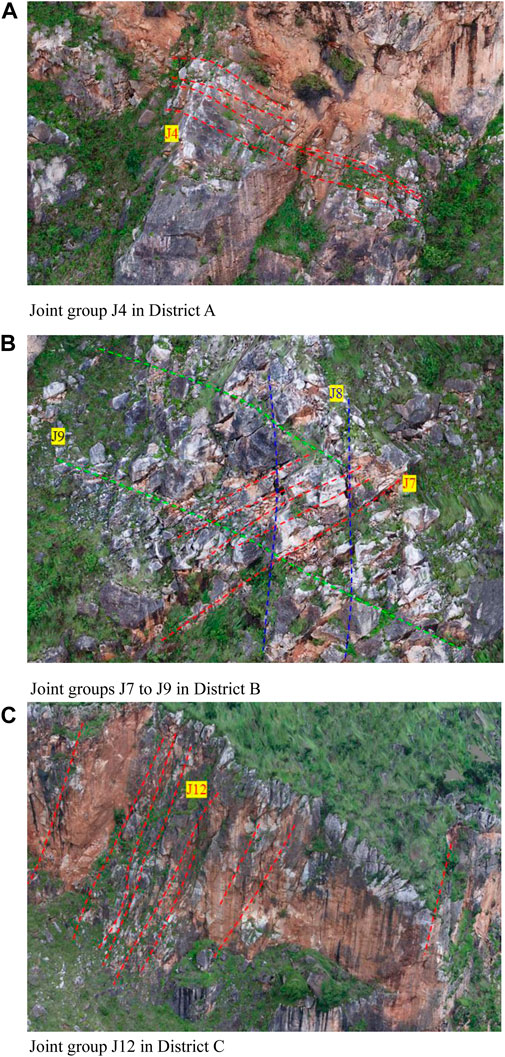
FIGURE 4. (A) Joint group J4 in District A. (B) Joint groups from J7 to J9 in District B. (C) Joint group J12 in photographs of typical joint groups in different districts.
Distribution of the Dangerous Rock Masses
According to the statistical results of joints groups in Districts A, B, and C, the inverted and near-vertical structural plane are relatively well-developed, which may cut the rock into many independent blocks. According to the formation conditions leading to rock collapse in the Code for Highway Engineering Geological Investigation of China (2011), if there are two groups of joints (X-shaped joints) oblique to the slope trend in the rock mass, a wedge inclined to the slope toe is easy to form, and the rockfall geologic hazards are prone to be induced. The rock masses in Districts A, B, and C meet the conditions for the development of rockfall geologic hazards.
The panoramic high-precision 3D model is used to identify the dangerous rock masses in the survey area, and the characteristic parameters such as block size and spatial distribution of each dangerous rock mass are obtained. As shown in Table 1, there are four dangerous rock masses (1#–4#) in District A, three dangerous rock masses (5#–7#) in District B, and 12 dangerous rock masses (8#–19#) in District C. The spatial distributions of these dangerous rock masses are marked in Figure 3. Most of these dangerous rock masses are irregular massive and columnar, and a few are massive. In terms of altitude distribution, there are three dangerous rock masses at 1950–2000 m, nine at 2000–2,100 m, and seven above 2,100 m. Among the 19 dangerous rock masses in the survey area, there are no large collapses (i.e., those with a volume >5,000 m3), 12 medium collapses (500 < volume ≤5,000 m3), and seven small collapses (volume ≤500 m3). There are four medium-sized collapses in District A, three in District B, and four small collapses and eight medium-sized collapses in District C.
3D Rock Block System Modeling
Topological Representation of a Rock Block
The block system of a rockfall geologic hazard is composed of many blocks, including the sliding bed block and many independent rockfall blocks. To integrate these different types of rock blocks for movement process analysis, a reasonable data structure accurately describing a rock block is necessary. In the present work, each rock block is assumed to meet the characteristics of simply connected regions, the basic data structure of a rock block is defined as oriented body→oriented face→oriented edge→vertex (Figure 5A). Wherein, vertex is the basic geometric element, and it is expressed by the three-dimensional coordinate; oriented edge is defined as two vertices associated with an edge and the orientation of the edge; oriented face consists of an ordered and closed set of oriented edges, where each oriented face is a polygonal loop with a specified orientation; each oriented body consists of a closed set of oriented faces, and the orientation of each oriented face should point to the outside of the oriented body. In this definition, it is no longer necessary to distinguish between convex and concave polyhedra.
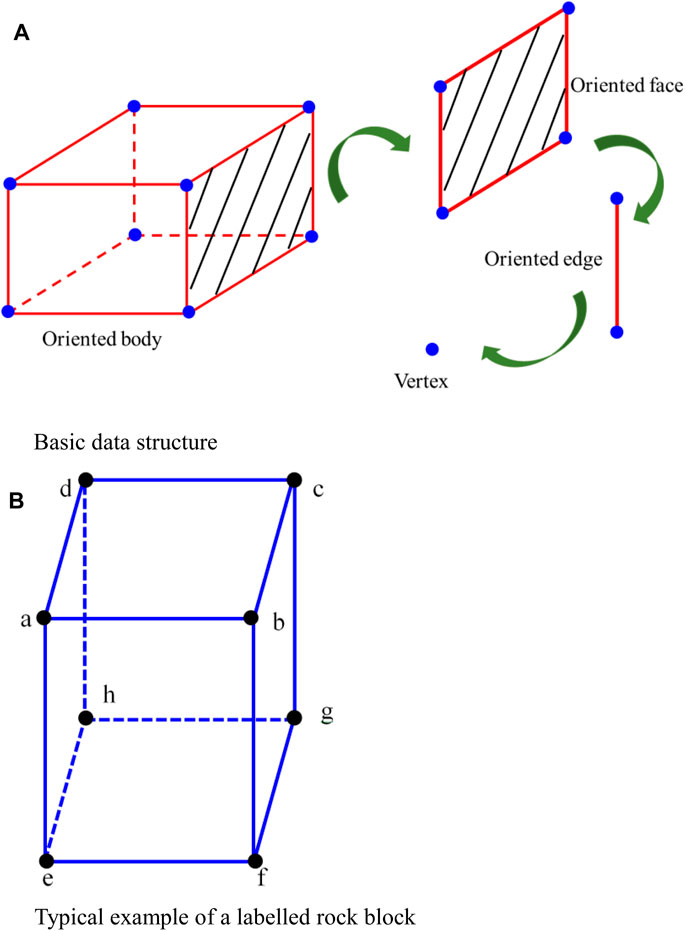
FIGURE 5. (A) Basic data structure. (B) Typical example of a labeled rock block topological representation of a rock block.
In Figure 5B, the oriented body can be defined with six oriented faces, including Face 1 (loop adhea), Face 2 (loop baefb), Face 3 (loop cbfgc), Face 4 (loop dcghd), Face 5 (loop hgfeh), and Face 6 (loop abcda); according to the right hand rule, each face contains four oriented edges, for example, Face 1 contains ad, dh, he, and ea; all oriented edges consist of eight vertices (a–h).
3D Sliding Bed Block Model
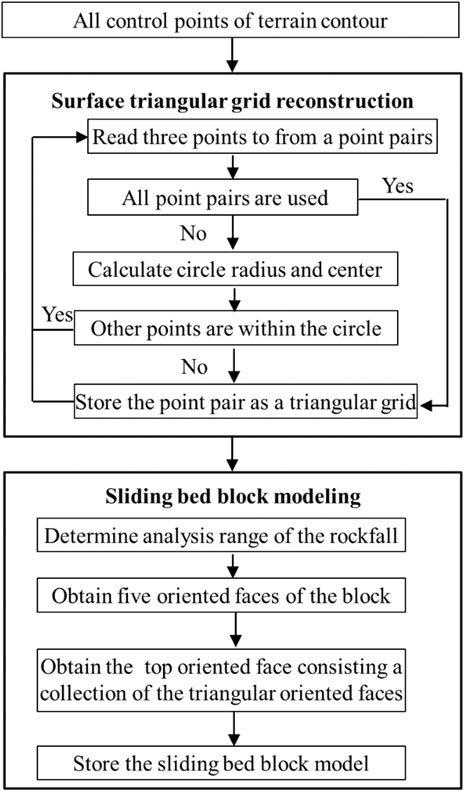
The establishment of a 3D sliding bed block model includes the following two steps: surface triangular grid reconstruction and sliding bed block modeling (Figure 6).
In the process of surface triangular grid reconstruction, all the control points of terrain contour, measured by oblique photography, are used to form the surface triangular grids, and the implementation process is as follows:
a) All control points of terrain contour are placed in a point set.
b) Three control points from the point set are read to form a point pair. If all point pairs are used, go to Step (f).
c) The point pair is used to form a triangular grid, and its circumscribed circle radius and center are calculated.
d) Whether the other control points of the point set are within the circle is judged. If they are outside the circle, the triangular grid is a part describing the surface, otherwise go to Step (b).
e) The point pair is stored as a triangular grid and return to Step (b).
f) End.
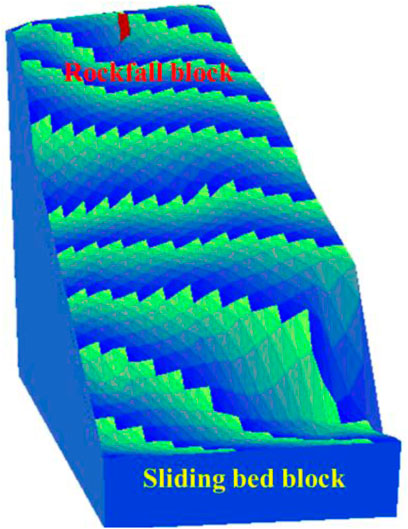
In the process of sliding bed block modeling, by projecting 3D surface triangular grids into the plane of the X–Y coordinate system, the analysis range of rockfall geologic hazard is calculated, and the bottom elevation of the sliding bed block model is also determined by reducing a certain elevation of the minimum value in the Z-direction of the 3D surface triangular grids. The sliding bed block is regarded as an approximate hexahedron. Following the topological representation described of a rock block in Topological Representation of a Rock Block, five oriented faces of the hexahedron, including the bottom, front, back, left, and right oriented faces, can be generated using the boundary control points and the bottom elevation. The top oriented face, that is, the ground surface can be regarded as a collection of triangular oriented faces, and each triangular oriented face is a 3D surface triangular grid. The 3D sliding bed block model of the rockfall taken as a case study can be established using the surface digital elevation model obtained by oblique photography technology (Figure 7A), and top oriented face of the sliding bed block model is composed of 79,743 surface triangular grids (Figure 7B).
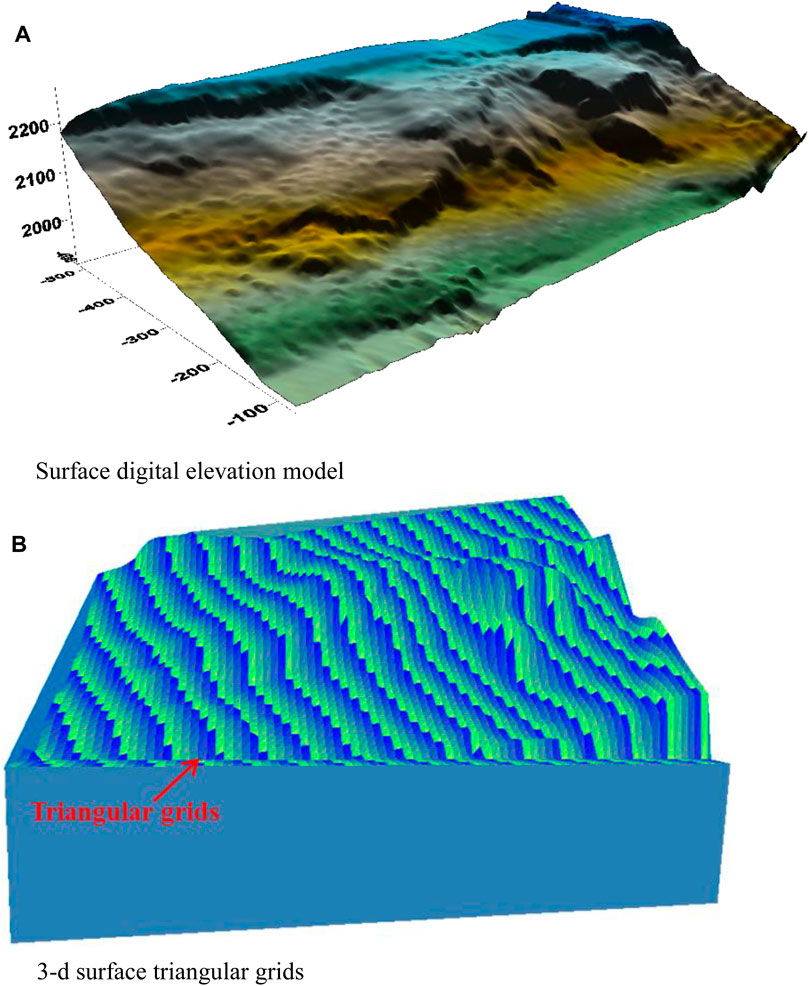
FIGURE 7. (A) Surface digital elevation model (B) 3D surface triangular grids sliding bed rock block model.
Block System Model of the Dangerous Rock Masses
The modeling of dangerous rock masses includes the following two types: the modeling of a single block of the rockfall, for which the modeling is relatively simple. Following the topological representation of rock block described in the Topological Representation of a Rock Block, the geometric surfaces that make up the rockfall are regarded as oriented faces surrounded by a series of vertices, and these oriented faces form a rock block (Figure 8). The sliding bed block model is a local part of the panoramic, high-precision 3D model, and the rockfall block is quasi-cuboidal with a volume of 115.47 m3.
The second type is the modeling of block system of the rock collapse, and the implementation flow mainly has two steps: in the first step, the statistical data pertaining to joint groups obtained by oblique photography are input, and effective random structural planes within the range of the rock collapse are reproduced using a 3D joint network generation algorithm. In the second step, geometric boundaries of the rock collapse, deterministic discontinuities, and random structural planes are input and the rock block system model is formed using a block-cutting algorithm. The 3D joint network generation algorithm and the block-cutting algorithm are detailed by Fu et al. (2019b). Figure 9A shows the reproduced random structural planes of a rock collapse in District C of the rockfall case, and Figure 9B illustrates the corresponding rock block system model, wherein there are 638 blocks, and the total volume of the rock that collapsed is 3,840 m3.
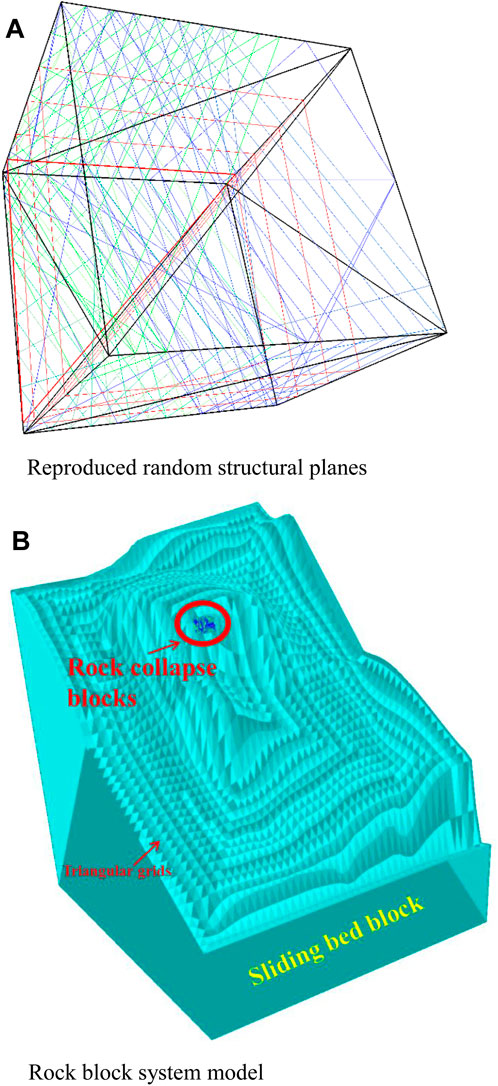
FIGURE 9. (A) Reproduced random structural planes. (B) Rock block system model rock block system model of a rock collapse.
Movement Process Analysis of the Rockfall Geologic Hazard
A Brief of the 3D-DDA Method
Conducting the techniques in the 3D Rock Block System Modeling, the 3D rock block system model is formed, and then the movement process of rockfall geologic hazard can be analyzed using the 3D-DDA method. In the DDA method, each discrete deformable block is a basic unit. To represent the displacement of block-i in the 3D plane with the first-order approximation, twelve mechanical variables with a clear physical meaning are chosen, which are as follows:
where (u0, v0, and w0) is the block centroid for the rigid body translation; (rx, ry, and rz) is the rotation angle around the block centroid; (εx, εy, and εz) is the normal strain of the block deformation and (γyz, γzx, and γxy) is the shear strain of the block deformation.
In DDA, the Newmark integration method is used, and the discontinuous displacement of the block system is simulated with real-time steps. The displacement of any point (x, y, z) of block i in the current time step is expressed as follows:
where
is the shape function matrix and (x0, y0, and z0) is the centroid of block i. Thus, the large displacements are the accumulation of the small displacements of steps, and {ΔDi} is the displacement solution of the block in one time-step.
During the DDA calculation, it is necessary to set the physical and mechanical parameters of each rock block, including rock density, Young’s modulus, and Poisson’s ratio, as well as the strength parameters of each contact face. Since DDA is solved with real-time steps, the calculation parameters (Fu et al., 2017b), e.g., calculation steps, interval of time step, dynamic coefficient, maximum ratio of step displacement, and spring stiffness, need to be input. Individual blocks are connected and form the block system by the boundary conditions, such as the contacts, the displacement constraint, and the load boundary. Assuming there are n blocks in the defined block system, with the principle of minimum potential energy, the total equilibrium equations are written as follows:
where [Kjl] is a stiffness sub-matrix with a 12 × 12 order; and {Fj} is a load sub-vector with a 12 × 1 order; j, l = 1,2,…,n.
After the total equilibrium equations are solved by satisfying their convergences, two other convergences, including the convergence of open–close iterations for all contacts and the convergence of the maximum displacement for static computations (Shi, 2009), should be checked. If all the convergences are satisfied, the stress and displacement fields can be obtained.
Analysis of the Movement Process of a Typical Rockfall
The panoramic, high-precision 3D model of the rockfall case shows that the slope surface is not only relatively concentrated within the block system of rock collapse, but also sporadically distributed across more independent rockfalls. Field investigation indicates that, in history, many rockfalls moved along the slope surface after losing stability, finally falling into Dianchi Lake next to the Gaohai expressway (Figure 10A).
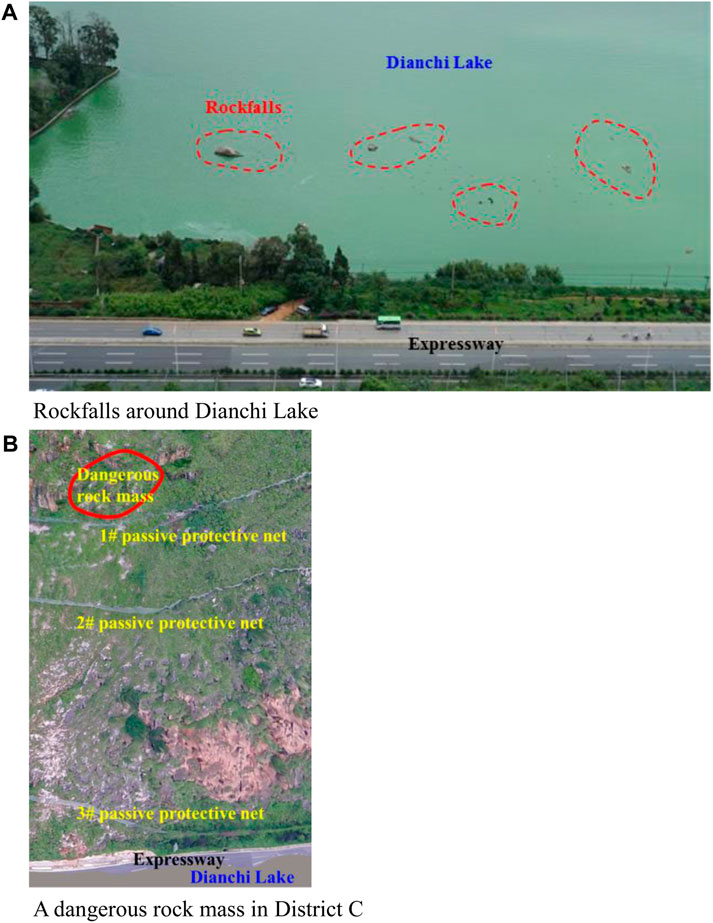
FIGURE 10. (A) Rockfalls around Dianchi Lake. (B) A dangerous rock mass in District C field investigation of the rockfall used as a case study.
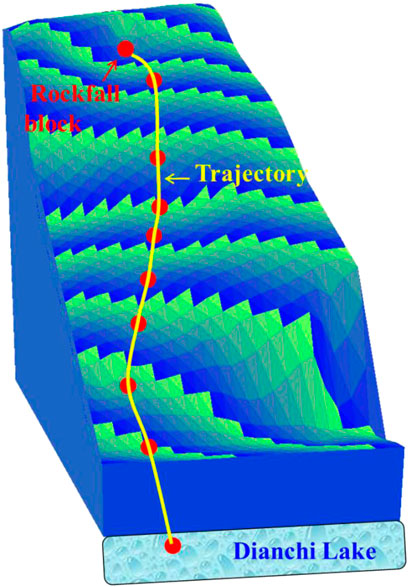
To reproduce the typical movement process of rockfall (Figure 10B), a dangerous rock mass in District C is selected for simulation. Using the proposed modeling method based on oblique photography, a 3D model of the selected dangerous rock mass is reconstructed (Figure 11A), and the volume of each rock block is 4 m3. The 3D-DDA method is used to simulate the movement process of the rock block. The physico-mechanical parameters of the rock and contact face are listed in Table 2. In terms of calculation parameters setting, interval of time step is 0.0025 s, and the maximum ratio of the step displacement is 0.001. Figure 11 demonstrates the simulation results at different times, and the moving processes of the rock block, including initiation, along the slope (friction, rolling, collision, and bouncing), and free movement in the air, are presented. After leaving the slope, the rock block falls into the expressway area and hits the pavement, finally entering Dianchi Lake. The simulation results are basically consistent with the field survey data.
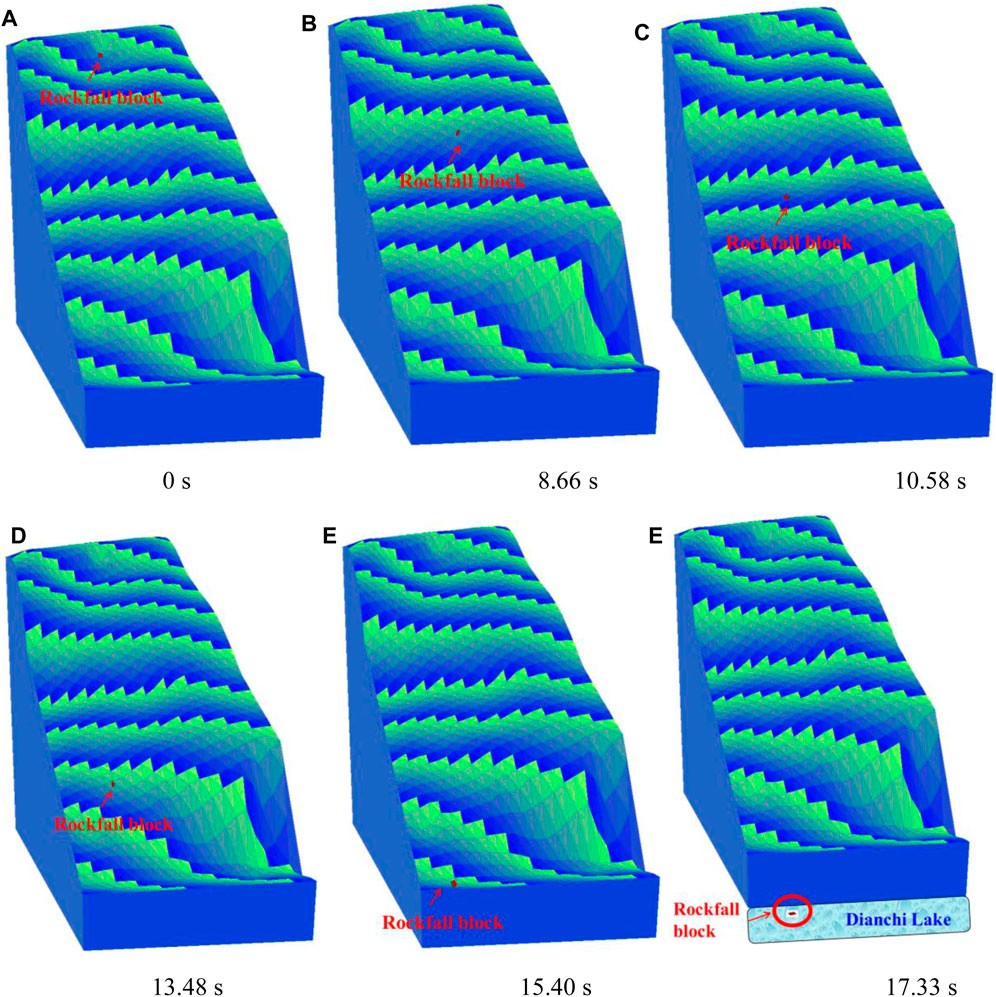
FIGURE 11. (A) 0 s. (B) 8.66 s. (C) 10.58 s. (D) 13.48 s. (E) 15.40 s. (F) 17.33 s. Simulated results of the movement process of the rockfall at different times.
Figure 12 illustrates the movement trajectory of the rock block, showing obvious 3D spatial effects, suggesting that the trajectory is affected by the terrain. In fact, in the formation of a rockfall geologic hazard, there is not only vertical movement in the Z-direction, but lateral movement in the X–Y plane perpendicular to the elevation. This phenomenon is difficult to reproduce in 2d simulations, but is critical to design of the layout of protective structures.
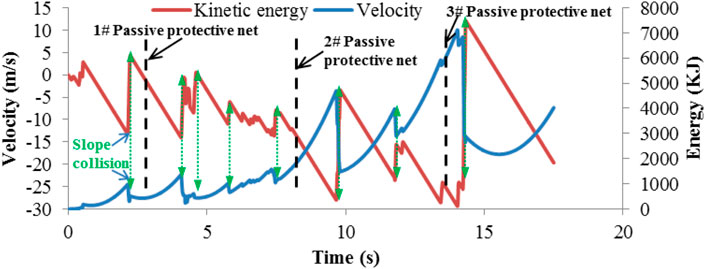
Figure 13 demonstrates simulated velocity in the Z-direction and the kinetic energy of the rock block. The overall trend of the kinetic energy is increasing, but there are many falls, which is caused by collisions between the rock block and the sloping surface. The temporal variation of the velocity in the Z-direction shows that, before each collision, the velocity vector of the rock block points downslope; when a collision occurs, the velocity of the rock block suddenly changes to upslope, reducing the kinetic energy; after the collision, the rock block moves freely in the air, the velocity recovers its downward direction along the slope, and the kinetic energy also increases. When the rock block reaches the expressway, the velocity in the Z-direction is about 10 m/s and the kinetic energy is about 7,000 kJ (posing a very serious hazard).
To prevent such high-energy rockfall geologic hazards, the combined protective structures based on the idea of cascade energy dissipation should be adopted (Peila et al., 1998; Tran et al., 2013). As shown in Figures 10A,B, a three-level passive protective net system has been arranged on site. When reaching the 1#, 2#, and 3# passive protective nets, the kinetic energy of the rock block is 437, 1,150, and 5,672 kJ, respectively, the first passive protective net is arranged at the stage when the kinetic energy begins to increase, and the second passive protective net is sited beyond the original point of collision (i.e., where the kinetic energy temporarily decreases). These two passive protective nets can help to prevent rockfall geologic hazards arising before the kinetic energy of the rock block has reached too high a level. The third net is arranged near the expressway, as a last resort; therefore, the relationship between the location of the combined protective structures and the evolution of kinetic energy of the rock block proves that the spatial layout of the three-level passive protective net system is reasonable.
Conclusion
To prevent rockfall geologic hazards, a practical method of their reproduction is crucial. Scene survey and movement process analyses are two key steps therein; however, at present, they are difficult to integrate with engineering design protocols, which means that the parameters pertinent to such rockfall geologic hazards obtained by a scene survey cannot be used to elucidate the movement process directly. In the present work, a method of reproduction based on oblique photography and 3D-DDA is presented to address the existing shortcomings, and three key techniques invoked in the proposed method of reproduction are described. A typical rockfall case, located at chainage K8 + 050 on the Gaohai expressway, Yunnan Province, China, is employed to test the practicability of the method. The main conclusions are as follows:
a) The proposed method of reproduction is implemented using the UAV and 3D-DDA and includes three key techniques: oblique photography, 3D rock block system modeling, and 3D rock block system analysis. When applying this method, using UAV, geometric characteristic parameters of the terrain, rockfall, and discontinuities are first extracted using oblique photography. Then, the block system model of rockfall is established through reconstructing the sliding bed block and block system of the dangerous rock masses. Last, the interaction behaviors between rock blocks, including friction, rolling, collisions, and bouncing, are calculated by invoking the 3D-DDA method, and the evolution of rockfall geologic hazard, including initiation, movement, and accumulation, is simulated.
b) Based on oblique photography by UAV, the panoramic, high-precision 3D model of a typical rockfall event is built: the parameters relating to the occurrence of rock mass discontinuities in different districts are extracted, and the distribution of dangerous rock masses is studied. The movement trajectory of a representative rockfall is simulated by the 3D-DDA method, and the simulation results are consistent with field investigation data. The case study shows that the proposed method has many advantages, such as advanced technology, complete theory, and simple operation; it integrates the data arising from measurement, modeling, and calculation to reproduce the evolution of rockfall geologic hazards, providing a geomechanical model for the risk assessment of rockfall geologic hazards.
c) Compared with the 2d simulation method, the 3D-DDA method can better reproduce the spatial effects of rockfall movement as affected by the local terrain. The analysis of the evolution of the velocity and kinetic energy in the case study indicates that the kinetic energy tends to increase; however, due to collisions between the rockfall and the slope surface, the velocity vector suddenly changes from pointing downslope to upslope, and the kinetic energy shows several sudden drops; when the rockfall reaches the road surface, its kinetic energy is about 7,000 kJ.
d) The rationality of a three-level passive protective net system is assessed by analyzing the relationship between the spatial layout of the combined protective structures and the evolution of the kinetic energy of the rockfall. The first two nets prevent the development of a more serious geologic hazard (acting before the kinetic energy of the rockfall can become excessive). The third net is arranged near the highway and is the last resort in rockfall geologic hazard prevention. The current three-level passive protective net system satisfies the idea of cascade energy dissipation, and the spatial layout thereof is deemed reasonable.
Data Availability Statement
The original contributions presented in the study are included in the article/Supplementary Material; further inquiries can be directed to the corresponding authors.
Ethics Statement
Written informed consent was obtained from the [individual(s) AND/OR minor(s)' legal guardian/next of kin] for the publication of any potentially identifiable images or data included in this article.'
Author Contributions
XF and QS were involved in the final development of the project and manuscript preparation. HD and WD wrote the manuscript draft. JC and HC analyzed the data. GL and LF carried out the field investigation. All authors contributed to corrections, modifications, and final acceptation.
Funding
The work reported in this paper is financially supported by the Youth Innovation Promotion Association CAS (No.2021325), the National Natural Science Foundation of China (No. 51779250; No. 52179117), and the International Partnership Program of Chinese Academy of Sciences Grant No. 131551KYSB20180042.
Conflict of Interest
Authors HC, GL, and LF are employed by Broadvision Engineering Consultants.
The remaining authors declare that the research was conducted in the absence of any commercial or financial relationships that could be construed as a potential conflict of interest.
Publisher’s Note
All claims expressed in this article are solely those of the authors and do not necessarily represent those of their affiliated organizations, or those of the publisher, the editors and the reviewers. Any product that may be evaluated in this article, or claim that may be made by its manufacturer, is not guaranteed or endorsed by the publisher.
Acknowledgments
The authors thank G.H. Shi for his guidance in understanding the DDA method and providing the DDA program. A special acknowledgement should be expressed to China-Pakistan Joint Research Center on Earth Sciences that supported the implementation of this study.
References
Ahmad, M., Umrao, R. K., Ansari, M. K., Singh, R., and Singh, T. N. (2013). Assessment of rockfall hazard along the Road Cut Slopes of State Highway-72, Maharashtra, India. Geomaterials 3 (1), 15–23. doi:10.4236/gm.2013.31002
Alejano, L. R., Pons, B., Bastante, F. G., Alonso, E., and Stockhausen, H. W. (2007). Slope Geometry Design as a Means for Controlling Rockfalls in Quarries. Int. J. Rock Mech. Mining Sci. 44 (6), 903–921. doi:10.1016/j.ijrmms.2007.02.001
Chen, G. Q. (2003). Numerical Modeling of Rock Fall Using Extended DDA. Chin. J. Rock Mech. Eng. 22 (6), 926–931. doi:10.3321/j.issn:1000-6915.2003.06.008
Chen, G., Zheng, L., Zhang, Y., and Wu, J. (2013). Numerical Simulation in Rockfall Analysis: A Close Comparison of 2-D and 3-D DDA. Rock Mech. Rock Eng. 46 (3), 527–541. doi:10.1007/s00603-012-0360-9
Christen, M., Bartelt, P., and Gruber, U. (2007). RAMMS—a Modeling System for Snow Avalanches, Debris Flows and Rockfalls Based on IDL. Photogramm. Fernerkun. Geoinfo. 4, 289–292.
Code for Highway Engineering Geological Investigation of China (2011). Code for Highway Engineering Geological Investigation: JTGC20-2011. Beijing: Ministry of Transport of the People’s Republic of China.
Costantini, M., Ferretti, A., Minati, F., Falco, S., Trillo, F., Colombo, D., et al. (2017). Analysis of Surface Deformations over the Whole Italian Territory by Interferometric Processing of ERS, Envisat and COSMO-SkyMed Radar Data. Remote Sensing Environ. 202, 250–275. doi:10.1016/j.rse.2017.07.017
Crosta, G. B., and Agliardi, F. (2004). Parametric Evaluation of 3D Dispersion of rockfall Trajectories. Nat. Hazards Earth Syst. Sci. 4, 583–598. doi:10.5194/nhess-4-583-2004
Dorren, L. K. A. (2003). A Review of rockfall Mechanics and Modeling Approaches. Prog. Phys. Geogr. 27 (1), 69–87. doi:10.1191/0309133303pp359ra
Dorren, L. K. A., Maier, B., Putters, U. S., and Seijmonsbergen, A. C. (2004). Combining Field and Modelling Techniques to Assess rockfall Dynamics on a protection forest Hillslope in the European Alps. Geomorphology 57, 151–167. doi:10.1016/s0169-555x(03)00100-4
Du, Y., Lu, Y. D., Xie, M. W., and Jia, J. L. (2020). A New Attempt for Early Warning of Unstable Rocks Based on Vibration Parameters. Bull. Eng. Geol. Environ. 79 (8), 4363–4368. doi:10.1007/s10064-020-01839-2
Fan, X. M., Qiang, X., Scaringi, G., Dai, L. X., Li, W. L., Dong, X. J., et al. (2017). Failure Mechanism and Kinematics of the Deadly June 24th 2017 Xinmo Landslide, Maoxian, Sichuan, China. Landslides 14 (3), 2129–2146. doi:10.1007/s10346-017-0907-7
Finlay, P. J., Fell, R., and Maguire, P. K. (1997). The Relationship between the Probability of Landslide Occurrence and Rainfall. Can. Geotech. J. 34 (6), 811–824. doi:10.1139/t97-047
Fruneau, B., Achache, J., and Delacourt, C. (1996). Observation and Modelling of the Saint-Tienne-De-Tinée Landslide Using SAR Interferometry. Tectonophysics 265 (3-4), 181–190. doi:10.1016/s0040-1951(96)00047-9
Fu, X. D., Sheng, Q., Li, G., Zhang, Z. P., Zhou, Y. Q., and Du, Y. X. (2020). Analysis of Landslide Stability under Seismic Action and Subsequent Rainfall: a Case Study on the Ganjiazhai Giant Landslide along the Zhaotong-Qiaojia Road during the 2014 Ludian Earthquake, Yunnan, China. Bull. Eng. Geol. Environ. 79, 5229–5248. doi:10.1007/s10064-020-01890-z
Fu, X. D., Sheng, Q., Tang, H., Chen, J., Du, Y. X., Zhang, Z. P., et al. (2019a). Seismic Stability Analysis of a Rock Block Using the Block Theory and Newmark Method. Int. J. Numer. Anal. Methods Geomech. 43 (7), 1392–1409. doi:10.1002/nag.2903
Fu, X. D., Sheng, Q., Wang, L. W., and Chen, J. (2019b). Spatial Topology Identification of Three-Dimensional Complex Block System of Rock Masses. Int. J. Geomech. (ASCE) 19 (12), 04019127. doi:10.1061/(ASCE)GM.1943-5622.0001522
Fu, X. D., Sheng, Q., Zhang, Y. H., Chen, J., and Leng, X. L. (2017a). Extension of Discontinuous Deformations Analysis Method to Simulate Seismic Response of Large Rock Cavern Complex. Int. J. Geomech. (ASCE) 17 (5), E4016008. doi:10.1061/(asce)gm.1943-5622.0000712
Fu, X. D., Sheng, Q., Zhang, Y. H., Chen, J., Zhang, S. K., and Zhang, Z. P. (2017b). Computation of the Safety Factor for Slope Stability Using Discontinuous Deformation Analysis and the Vector Sum Method. Comput. Geotech. 92, 68–76. doi:10.1016/j.compgeo.2017.07.026
Gao, G., and Meguid, M. A. (2018). Modeling the Impact of a Falling Rock Cluster on Rigid Structures. Int. J. Geomech. (ASCE) 18 (2), 04017141.1–04017141.15. doi:10.1061/(asce)gm.1943-5622.0001045
Goodman, R. E., and Shi, G. H. (1985). Block Theory and its Application to Rock Engineering. Englewood Cliffs, New Jersey: Prentice-Hall.
Guzzetti, F., Crosta, G., Detti, R., and Agliardi, F. (2002). STONE: a Computer Program for the Three Dimensional Simulation of Rock-Falls. Comput. Geosci. 28, 1079–1093. doi:10.1016/s0098-3004(02)00025-0
Jiang, M. J., Jiang, T., Crosta, G. B., Shi, Z. M., Chen, H., and Zhang, N. (2015). Modeling Failure of Jointed Rock Slope with Two Main Joint Sets Using a Novel DEM Bond Contact Model. Eng. Geol. 193, 79–96. doi:10.1016/j.enggeo.2015.04.013
Keefer, D. K. (2002). Investigating Landslides Caused by Earthquakes: A Historical Review. Surv. Geophys. 23 (6), 473–510. doi:10.1023/a:1021274710840
Lan, H. X., Martin, C. D., Zhou, C. H., and Lim, C. H. (2010). Rockfall hazard Analysis Using LiDAR and Spatial Modeling. Geomorphology 118 (1–2), 213–223. doi:10.1016/j.geomorph.2010.01.002
Lin, Y. D., Zhu, D. P., Deng, Q. L., and He, Q. D. (2012). Collapse Analysis of Jointed Rock Slope Based on UDEC Software and Oractical Seismic Load. Proced. Eng. 31, 441–446. doi:10.1016/j.proeng.2012.01.1049
Liu, G. Y., Li, J. J., and Kang, F. (2019). Failure Mechanisms of Toppling Rock Slopes Using a Three-Dimensional Discontinuous Deformation Analysis Method. Rock Mech. Rock Eng. 52 (10), 3825–3848. doi:10.1007/s00603-019-01797-6
Liu, X. W., Hu, C., Liu, Q. S., and He, J. (2021). Grout Penetration Process Simulation and Grouting Parameters Analysis in Fractured Rock Mass Using Numerical Manifold Method. Eng. Anal. Boundary Elem. 123, 93–106. doi:10.1016/j.enganabound.2020.11.008
Liu, Z. Y., Su, L. J., Zhang, C. L., Iqbal, J., Hu, B. L., and Dong, Z. B. (2020). Investigation of the Dynamic Process of the Xinmo Landslide Using the Discrete Element Method. Comput. Geotech. 123, 103561. doi:10.1016/j.compgeo.2020.103561
Ma, G. C., Matsuyama, H., Nishiyama, S., and Ohnishi, Y. (2011). Practical Studies on rockfall Simulation by DDA. J. Rock Mech. Geotech. Eng. 3 (1), 57–63. doi:10.3724/sp.j.1235.2011.00057
Mutar, F. A., and Biswajeet, P. (2018). A Novel rockfall hazard Assessment Using Laser Scanning Data and 3D Modelling in GIS. Catena 172, 435–450. doi:10.1016/j.catena.2018.09.012
Ohnishi, Y., Yamamukai, K., and Chen, G. Q. (1996). “Application of DDA in rockfall Analysis,” in Proceedings of the 2nd North American rock mechanics symposium, Quebec, Canada, June 19–21, 1996 (Montreal, QC, Canada, 2031–2037.
Peila, D., Pelizza, S., and Sassudelli, F. (1998). Evaluation of Behavior of rockfall Restraining Nets by Full Scale Tests. Rock Mech. Rock Eng. 31 (1), 1–24. doi:10.1007/s006030050006
Peng, X. Y., Yu, P. C., Zhang, Y. B., and Chen, G. Q. (2018). Applying Modified Discontinuous Deformation Analysis to Assess the Dynamic Response of Sites Containing Discontinuities. Eng. Geol. 246, 349–360. doi:10.1016/j.enggeo.2018.10.011
Sättele, M., Krautblatter, M., Bründl, M., and Straub, D. (2016). Forecasting Rock Slope Failure: How Reliable and Effective Are Warning Systems? Landslides 13 (4), 737–750. doi:10.1007/s10346-015-0605-2
Shi, G. H. (1988). Discontinuous Deformation Analysis: a New Numerical Model for the Statics and Dynamics of Block Systems. PhD thesis. Berkeley, USA: University of California.
Shi, G. H. (2009). “Rock Stability Analysis and Three Convergences of Discontinuous Deformation Analysis (DDA),” in Proceedings of the 9th International Conference on Analysis of Discontinuous Deformation, Singapore, November 25–27, 2009 (Singapore: Nanyang Technological University (NTU)), 1–11. doi:10.3850/9789810844554-keynote-shi-genhua
Shi, G. H. (2001). “Three Dimensional Discontinuous Deformation Analysis,” in Proceedings of the 4th international conference on analysis of discontinuous deformation, Glasgow, Scotland, June 6–8, 2001 (Scotland, UK).
Thoeni, K., Giacomini, A., Lambert, C., Sloan, S. W., and Carter, J. P. (2014). A 3D Discrete Element Modelling Approach for rockfall Analysis with Drapery Systems. Int. J. Rock Mech. Mining Sci. 68, 107–119. doi:10.1016/j.ijrmms.2014.02.008
Tran, P. V., Maegawa, K., and Fukada, S. (2013). Prototype of a Wire-Rope rockfall Protective Fence Developed with Three-Dimensional Numerical Modeling. Comput. Geotech. 54, 84–93. doi:10.1016/j.compgeo.2013.06.008
Volkwein, A., Schellenberg, K., Labiouse, V., Agliardi, F., Berger, F., Bourrier, F., et al. (2011). Rockfall Characterisation and Structural protection—a Review. Nat. Hazards Earth Syst. Sci. 11, 2617–2651. doi:10.5194/nhess-11-2617-2011
Wang, J. J., Liang, Y., Zhang, H. P., Wu, Y., and Lin, X. (2014). A Loess Landslide Induced by Excavation and Rainfall. Landslides 11 (1), 141–152. doi:10.1007/s10346-013-0418-0
Wang, W., Zhang, H., Zheng, L., Zhang, Y. B., Wu, Y. Q., and Liu, S. G. (2017). A New Approach for Modeling Landslide Movement over 3D Topography Using 3D Discontinuous Deformation Analysis. Comput. Geotech. 81, 87–97. doi:10.1016/j.compgeo.2016.07.015
Wasowski, J., and Bovenga, F. (2014). Investigating Landslides and Unstable Slopes with Satellite Multi Temporal Interferometry: Current Issues and Future Perspectives. Eng. Geol. 174 (1), 103–138. doi:10.1016/j.enggeo.2014.03.003
Wu, J. H., Chen, J. H., and Lu, C. W. (2013). Investigation of the Hsien-Du-Shan Rock Avalanche Caused by Typhoon Morakot in 2009 at Kaohsiung County, Taiwan. Int. J. Rock Mech. Mining Sci. 60, 148–159. doi:10.1016/j.ijrmms.2012.12.033
Wu, J. H., Lin, W. K., and Hu, H. T. (2018). Post-failure Simulations of a Large Slope Failure Using 3DEC: The Hsien-Du-Shan Slope. Eng. Geol. 242, 92–107. doi:10.1016/j.enggeo.2018.05.018
Xu, Q., Dong, X. J., and Li, W. L. (2019). Integrated Space-Air-Ground Early Detectionmonitoring And Warning System for Potential Catastrophic Geohazards. Geomat. Inf. Sci. Wuhan Univ. 44 (7), 957–966.
Yan, P., Zhang, J. H., Kong, X. Z., and Fang, Q. (2020). Numerical Simulation of rockfall Trajectory with Consideration of Arbitrary Shapes of Falling Rocks and Terrain. Comput. Geotech. 122, 103511. doi:10.1016/j.compgeo.2020.103511
Yang, M., Fukawa, T., Ohnishi, Y., Nishiyama, S., Miki, S., Hirakawa, Y., et al. (2004). The Application of 3-dimensional DDA with a Spherical Rigid Block for rockfall Simulation. Int. J. Rock Mech. Mining Sci. 41 (3), 611–616. doi:10.1016/j.ijrmms.2004.03.108
Yang, Y. T., Xu, D. D., Liu, F., and Zheng, H. (2020). Modeling the Entire Progressive Failure Process of Rock Slopes Using a Strength-Based Criterion. Comput. Geotech. 126, 103726. doi:10.1016/j.compgeo.2020.103726
Zhang, F., Liu, G., Chen, W., Chen, W. W., Liang, S. Y., Chen, R. S., et al. (2012). Human-induced Landslide on a High Cut Slope: a Case of Repeated Failures Due to Multi-Excavation. J. Rock Mech. Geotech. Eng. 4 (4), 367–374. doi:10.3724/sp.j.1235.2012.00367
Zheng, L., Chen, G. Q., Li, Y. G., Zhang, Y. B., and Kasama, K. (2014). The Slope Modeling Method with GIS Support for rockfall Analysis Using 3D DDA. Geomech. Geoeng. 9 (2), 142–152. doi:10.1080/17486025.2013.871070
Keywords: rockfall geologic hazard, reproduction method, oblique photography, modeling technology, dda
Citation: Fu X, Ding H, Sheng Q, Chen J, Chen H, Li G, Fang L and Du W (2021) Reproduction Method of Rockfall Geologic Hazards Based on Oblique Photography and Three-Dimensional Discontinuous Deformation Analysis. Front. Earth Sci. 9:755876. doi: 10.3389/feart.2021.755876
Received: 09 August 2021; Accepted: 24 August 2021;
Published: 22 October 2021.
Edited by:
Faming Huang, Nanchang University, ChinaCopyright © 2021 Fu, Ding, Sheng, Chen, Chen, Li, Fang and Du. This is an open-access article distributed under the terms of the Creative Commons Attribution License (CC BY). The use, distribution or reproduction in other forums is permitted, provided the original author(s) and the copyright owner(s) are credited and that the original publication in this journal is cited, in accordance with accepted academic practice. No use, distribution or reproduction is permitted which does not comply with these terms.
*Correspondence: Xiaodong Fu, eGRmdUB3aHJzbS5hYy5jbg==; Wenjie Du, MTA3OTUwMjI0OUBxcS5jb20=
 Xiaodong Fu
 Haifeng Ding1,2
 Qian Sheng