 Xianzheng Zhao1
 Bixiao Xin
 Jinqiang Tian
- 1PetroChina Dagang Oil Field Company, Tianjin, China
- 2Key Laboratory of Deep Oil and Gas, China University of Petroleum (East China), Qingdao, China
- 3School of Geosciences, China University of Petroleum (East China), Qingdao, China
The study of lithofacies identification and its distribution characterizations of shales is essential for the geological evaluation of shale oil exploration and development. In this study, core description, optical microscope, total organic carbon (TOC) content, whole-rock X-ray diffraction (XRD), Rock-Eval pyrolysis, X-ray fluorescence (XRF), scanning electron microscope (SEM), and well logging data were used in the qualitative analyses of the geochemical and mineralogical characteristics of shales. Since the work of detailed lithofacies identification is still lacking in the previous studies, based on TOC, sedimentary structure, and ternary diagram of siliceous minerals, carbonate minerals, and clay minerals, eight predominant lithofacies were identified in the shale of the second member of the Kongdian Formation (Ek2): ① low to moderate organic matter content (referred to as “low to moderate TOC”) massive calcareous mudstone (C-1); ② low to moderate TOC laminated calcareous mudstone (C-2); ③ low to moderate TOC layered mixed calcareous mudstone (C-3); ④ moderate to high organic matter content (referred to as “moderate to high TOC”) laminated calcareous siliceous mudstone (S-1); ⑤ moderate to high TOC massive mixed siliceous mudstone (S-2); ⑥ moderate to high TOC laminated clayey siliceous mudstone (S-3); ⑦ low to moderate TOC massive mixed mudstone (M-1); ⑧ moderate to high TOC layered calcareous/siliceous mixed mudstone (M-2). The favorability of lithofacies was investigated based on TOC, pyrolysis parameters, pore structures, and specific mineral contents. S-1 was currently considered as the most favorable lithofacies with excellent hydrocarbon potential, high amount of free hydrocarbon, and abundant organic pores; S-2, S-3, and M-2 were considered as favorable lithofacies, while C-1 and M-1 were ranked as the least-promising lithofacies in the research area. The lateral distribution of the shale is quite different, and Ek23 contains the most favorable lithofacies for shale oil exploration.
1 Introduction
Since the successful exploration and development of shale gas in North America, the world petroleum industry has gradually entered an era of unconventional oil and gas. According to the U.S. Energy Information Administration (EIA) survey report, the technically recoverable resources of global shale oil are about 469 × 108t, and shale oil has become another critical unconventional resource after shale gas (Zhang et al., 2015; Wang et al., 2016; U.S. Energy Information Administration, 2017). Shale oil and gas have become an important energy source in North America, a major high-yield area in the world, especially in the Bakken Formation, Eagle Ford Formation, and Barnett Formation (Jarvie et al., 2007; Jarvie, 2012). Organic-rich shales are widely developed in lacustrine basins in China including Bohai Bay Basin, Songliao Basin, Ordos Basin, Jungar Basin, and other large basins (Zhang et al., 2012; Liu et al., 2019; Zhao et al., 2019), and previous studies have proved that some of these lacustrine basins were rich in shale oil resources (Zou et al., 2013; Zhang et al., 2014). Compared with the United States, which has decades of exploration and development history, China is lagging in the exploration and development of unconventional oil. Due to the differences in geological characteristics between the lacustrine shale in China and the marine shale in North America, such as complex structure, deep burial, and strong heterogeneity, it is hard to copy the successful experience and models of North America (Cui et al., 2015; Zhou et al., 2015; Jin et al., 2016). At present, the research of lacustrine shale has already made certain understanding and essential progress in mineral composition and genesis (Aplin and Macquaker, 2011; Slatt and Rodriguez, 2012; Chermak and Schreiber, 2014; Liu et al., 2020a), shale sedimentary environment (Wang et al., 2019; Liu et al., 2020b; Ji et al., 2020; Liu et al., 2021; Wang et al., 2021), and pore types and characteristics (Loucks et al., 2012; Milliken et al., 2013; Ji et al., 2019). The lithofacies of shale contain information including mineral components, rock types, sedimentary structures, and organic matter abundance (Loucks and Ruppel, 2007; Ross and Bustin, 2009; Xu et al., 2018; Xu et al., 2019; Xu et al., 2020), which makes the division and distribution of lithofacies become a fundamental geology issue (Newport et al., 2016; Tang et al., 2016; Wang et al., 2018). However, due to differences in application purposes and research methods, there is still no unified standards to classify and characterize shale lithofacies, and the predecessors have made some explorations and attempts in different regions (Dill et al., 2005; Loucks and Ruppel, 2007; Wu et al., 2016). Taking Wufeng-Longmaxi Formation shale as an example, Liang et al. (2012) divided the shale into five lithofacies based on the mineral composition. Wu et al. (2016) improved the three-terminal element diagram and divided shale into eight lithofacies types; Wang et al. (2018) divided shale into four categories based on mineral composition and then combined geological factors such as sedimentary environment which are further subdivided into 31 lithofacies. Hu et al. (2019) determined three shale lithofacies, siliceous lithofacies, argillaceous lithofacies, and mixed lithofacies based on the shale mineral components, to discuss the effect of the lithofacies on the pore system of over-mature shales. Six lithofacies were identified with the combination of the three-end-member method and TOC, and shale lithofacies evaluation criteria were established (Wang et al., 2020).
As the understanding of shale geology continues to deepen, shale color and mineral content, parameters such as paleontological type, grain size, organic matter type, and abundance, and sedimentary structure have also been applied to the lithofacies classification scheme (Dill et al., 2005; Liu et al., 2019). Since the development and distribution characteristics of different lithofacies have not been systematically explained, it will severely limit the exploration of shale oil (Wu et al., 2016; Ma et al., 2017, Ma et al., 2019; Wang et al., 2020). To solve this problem, the author takes the second member of the Kongdian Formation (Ek2) as the research object with the critical wells in the Cangdong Sag. The division of shale facies in the Cangdong Sag has been in the exploratory stage (Yan and Zheng, 2015; Chen et al., 2019; Deng et al., 2020; Xin et al., 2021). Yan and Zheng (2015) proposed a three-terminal and four-component division scheme based on XRD data to classify the Ek2 shale into 4 categories and 12 lithofacies types, including felsic shale, carbonate shale, clay shale, and fine-grained mixed shale. On this basis, Deng et al., 2020, divided Ek2 into two major categories and five lithofacies according to the differences in material composition and mixing methods. In this study, the lithofacies of shales and their characteristics will be clarified based on the thin-section description, scanning electron microscopy, total organic carbon content testing, XRD, and other test data. This study will summarize the dominant lithofacies and spatial distribution characteristics of the lacustrine shale, facilitating shale oil exploration in lacustrine settings.
2 Geological Background
The Bohai Bay Basin is located on the east coast of China, with a total area of 200,000 km2 (Figure 1A) (Chang, 1991; Huang et al., 2018). The Cangdong Sag is a secondary structural unit in the southern area of the Huanghua Depression in the Bohai Bay Basin, with an exploration area of about 1760 km2 (Figure 1B). It has a structural background of weak tectonic activity, high frequency, and small amplitude and belongs to a faulted lake basin. The study area is held between the Xuhei Uplift in the south and reaches the Cangxian Uplift in the north. It is composed of the Kongdian structural belt, the Shenvsi fault nose, the Kongxi slope, the Kongdong slope, and the Nanpi slope (Pu et al., 2016). The Kongdian Formation is distributed with the third member of Kongdian Formation (Ek3) to the first member of Kongdian Formation (Ek1) developed from bottom to top (Zhao et al., 2019) (Figure 2). The Ek2 is deposited in a relatively closed semi-deep water-deep water environment with a thickness of 400–600 m (Pu et al., 2019), which is the main oil-generating interval in the study area (Zhou et al., 2020).
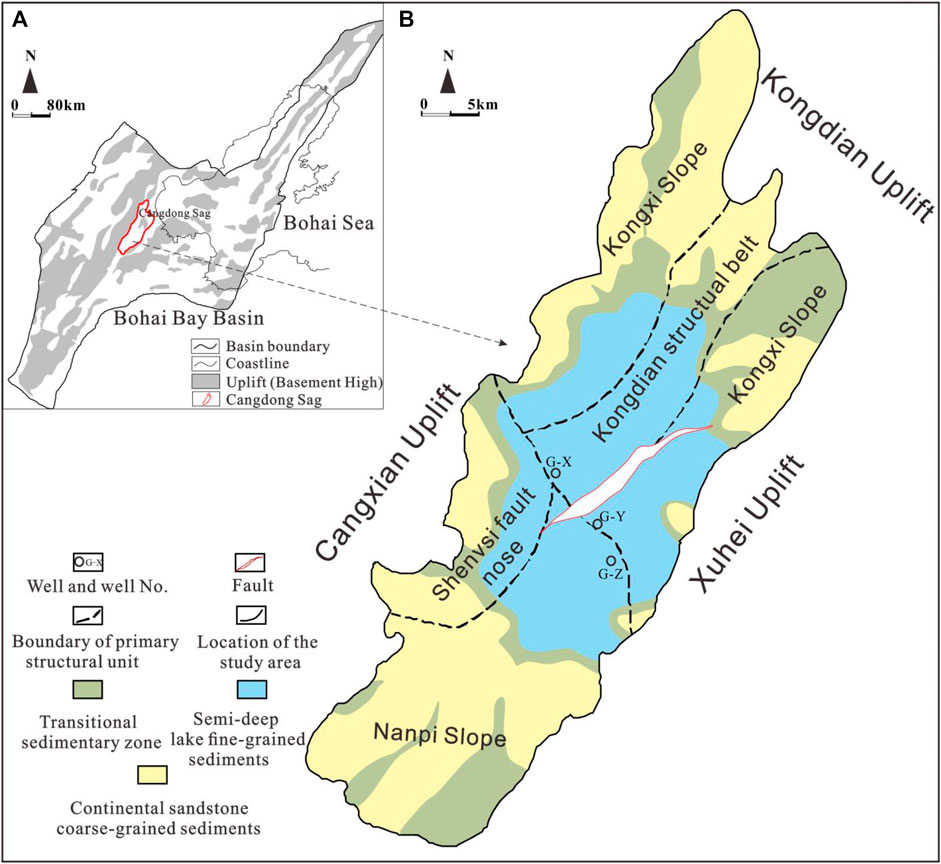
FIGURE 1. (A) Sketch map showing depressions of the Bohai Bay Basin (modified after Hao et al., 2007). (B) Simplified structural map of the regional setting of the Cangdong Sag (modified after Zhao et al., 2018; Zhou et al., 2020).
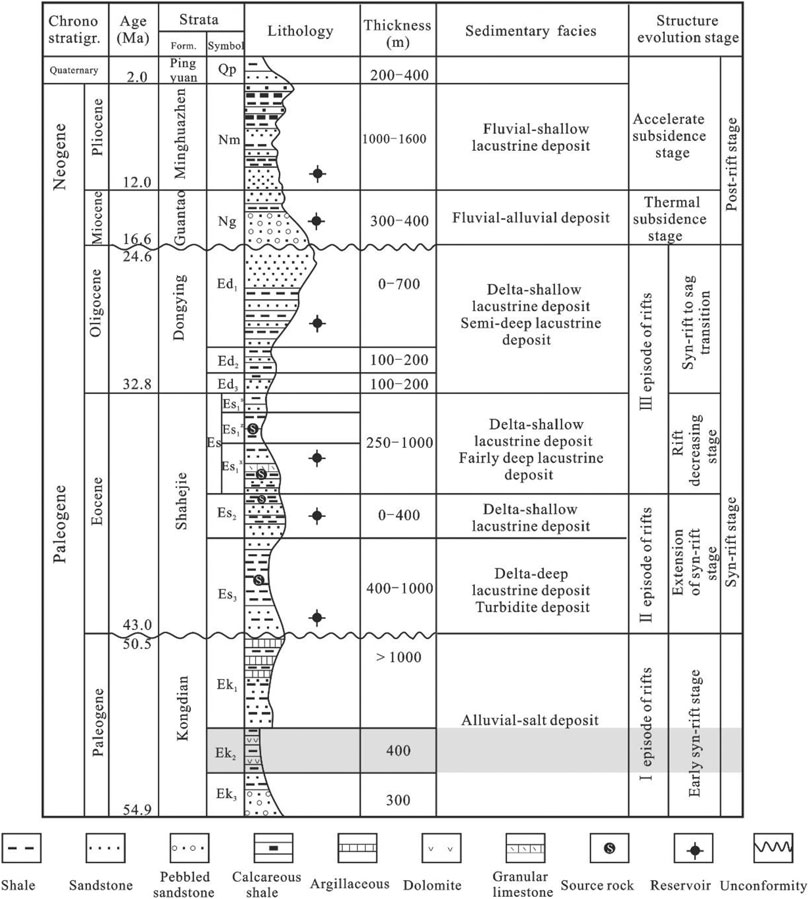
FIGURE 2. The synthetic column of strata, sedimentary facies, possible source rocks, and reservoirs (modified after Jiang et al., 2015; Liu et al., 2017).
The Kongdian Formation is a second-order sequence stratigraphic unit, and the Ek2 is a complete third-order sequence, which can be further divided into four third-order sequence stratigraphic sub-members (Ek24, Ek23, Ek22, and Ek21 from bottom to top) and the shales of different sub-members have apparent differences in vertical distribution (Pu et al., 2016). The Ek24 is low-stand system tract (LST) and mainly composed of the combination of sandstone and mudstone of the delta-front subfacies. The Ek23 and Ek22 belong to lake expansion system tract (EST), and the top of Ek22 exhibits the maximum flooding surface. The two sub-members were deposited with a set of semi-deep-lake fine-grain deposits and mainly consisted of organic-rich shale, pelitic dolomite, and fine siltstone. The Ek21 is high-stand system tract (HST) and consists of black shale and laminated dolomite, as well as thin-layer sandstone (Zhao et al., 2018).
This research takes three typical wells in Cangdong Sag G-X well, GD-Y well, and GD-Z well as objects. Well G-X is located at the southwestern edge of the Kongdian structural belt in Cangdong Sag. The total thickness of the coring section in the Ek2 is 468.5 m. Ek24 is dominated by fine gray sandstone and gray mudstone, with a thickness of 68.9 m; Ek23 is dominated by gray-black mud shale and dark-gray dolomite shale, with a thickness of 136 m; Ek22 is dominated by dark-gray shale and argillaceous dolomite, with a thickness of 181.75 m, and its top surface is the largest flooding surface of the Kongdian Formation with a set of fine sandstones; Ek21 is mainly gray-black mud shale with some interbedded dolomite layers, with a thickness of 81.85 m. GD-Y well and GD-Z well are situated in the center of Cangdong Sag, with a total thickness of 147.8 m in the coring section in the Ek2.
3 Methods and Samples
The samples were collected from the core of Ek2 in Cangdong Sag (well G-X, GD-Y, and GD-Z), which is gray-black shale. These whole cores are dissected at 1/3 position, of which 1/3 retained with detailed core description was performed, and the remaining 2/3 is used for sampling analysis. Since G-X well contains all four sub-members of the Ek2, 30 samples were collected from each sub-member for thin-section observation, TOC, Rock-Eval pyrolysis, SEM, X-ray fluorescence (XRF), and XRD experiments in this study. The other two wells, the GD-Y well and GD-Z well, mainly provide observations and supplements for the research.
One hundred twenty samples were crushed and ground to a size of 100–200 mesh for TOC analyses, Rock-Eval pyrolysis, and XRD. Total organic carbon (TOC) analyses were carried out for 120 bulk powder samples and were performed in the Key Laboratory of Deep Oil and Gas of the China University of Petroleum (East China) using a Leco CS-744 carbon-sulfur analyzer to determine the TOC. 120 samples were analyzed by using a Rock-Eval seven instrument following the standard technique (Espitalié and Bordeave, 1993), which yielded the free oil or volatile hydrocarbon content (S1), the residual hydrocarbon generation potential (S2), and the temperature of the maximum pyrolysis yield (Tmax). The analytical instrument of the XRD is X’pert Pro MPD, and the relative mineral percentages were estimated according to Pecharsky and Zavalij (2003). Scanning electron microscopy (SEM) was used to observe the mineral arrangement, laminar characteristics, and pore structure of samples.
4 Results
4.1 Geochemical Characteristics
The Ek2 shales in the Cangdong Sag have TOC of up to 12.92%, with an average of 3.26% and mainly between 0.5 and 5%, and the hydrocarbon generation potential (S1 + S2) ranges from 0.08 to 73 mg/g, on average 19.47 mg/g (Supplementary Material). The original hydrogen index (HI) and Tmax plot indicate that these samples are in the mature zone of hydrocarbon generation (Espitalié and Bordenave, 1993; Mukhopadhyay et al., 1995). The organic-rich shales are dominated by Type I and Type II1 kerogen and are typical oil-prone lacustrine mudstones (Figure 3). According to the classification standard of lacustrine source rocks in China (Qin, 2005), two-thirds of the shale samples of Ek2 are included in the range of good to excellent source rocks and a part of the samples (about 1/3) are distributed in the poor-fair region, which exhibits strong heterogeneity (Figure 4). The correlation between the hydrogen index (HI) of shale samples and the TOC value shows that when the TOC value is less than 1%, the HI is low; when the TOC value is 1–3%, the HI is positively correlated with the TOC value; when the TOC value is greater than 3%, HI tends to stabilize and no longer increases with the increase of the TOC value. Considering the organic matter content and occurrence characteristics of the organic-rich shale of Cangdong Sag, TOC value less than 1% is defined as low organic matter content, a TOC value of 1–3% is defined as moderate organic matter content, and a TOC value greater than 3% is defined as high organic matter content.
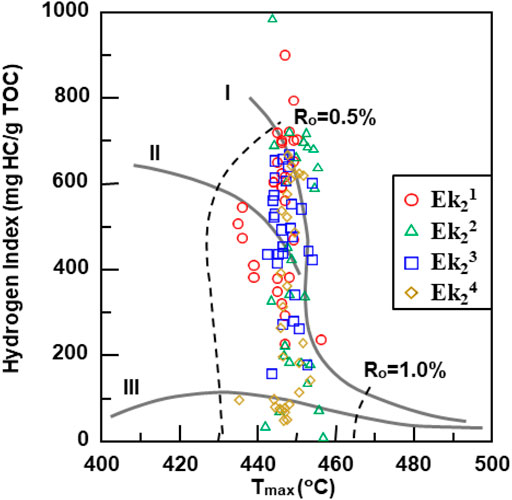
FIGURE 3. The plot of HI versus the Tmax for the Ek2 samples, showing the kerogen quality and the thermal maturity stages (modified after Mukhopadhyay et al. (1995)).
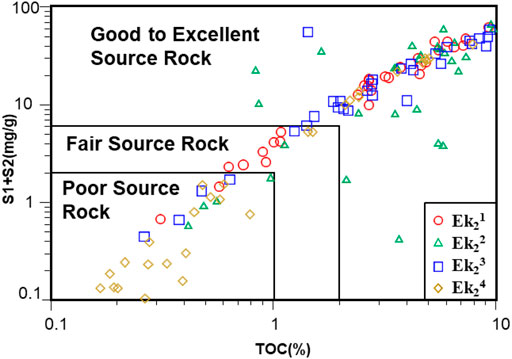
FIGURE 4. Diagrams of S1 + S2 versus TOC content showing generative source rock potential; the classification standard distinguishes the source rocks of poor quality, fair quality, and good to excellent quality from Qin (2005).
4.2 Mineral Compositions
The mineral composition of the shale in the Ek2 is mainly felsic minerals (quartz and feldspar), carbonate minerals (calcite and dolomite), clay minerals, and other minerals such as analcime and pyrite. The content of felsic minerals is mostly concentrated in 20–44%, with an average of 32.82%; the content of carbonate minerals is mostly concentrated in 8–36%, with an average of 32.97%, and is concentrated in dolomite; the content of clay minerals is relatively small, mostly less than 25%, with an average of 16.02%; the content of analcime is 0–47%, with an average of 16.56%. The Ek2 is mainly formed in semi-deep water to deep water environment, so it is also rich in pyrite (0–17%, on average 0.62%). The mineral content of different depths is quite different, in particular, the felsic mineral content and carbonate mineral content at different depths are quite different (Figure 5), which shows that the lacustrine shale has strong heterogeneity. The average content of felsic minerals in the Ek21 is the lowest, ranging from 4 to 44%, with an average of 27.8%; the dolomite content is relatively high in the Ek21, ranging from 4 to 85%, with an average of 39.33%, while the clay mineral content is generally low, with an average of 12.77% (Figure 5A). Ek22 and Ek23 show similar mineral composition characteristics. The average felsic minerals content is 31.1 and 34.93%, and the average carbonate minerals content is 35.23 and 33.8%, respectively (Figures 5B,C). The vertical difference of mineral composition is mainly controlled by paleoclimate conditions, provenance conditions, and deposition rate during the deposition period (Curtis, 2002; Schmoker, 2002; Ratcliffe et al., 2010; Roy and Roser, 2013).
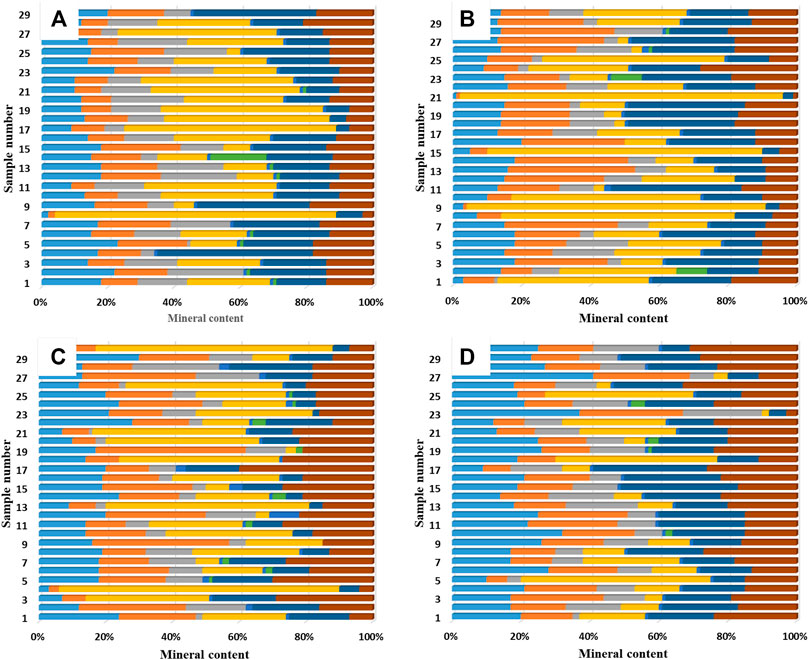
FIGURE 5. The whole-rock mineral component of shale samples from Ek2. (A) Ek21; (B) Ek22; (C) Ek23; (D)Ek24.
4.3 Sedimentary Structure
The typical sedimentary structures of shales in the Ek2 contain massive, layered, and laminated structure, and the mineral grains of the Ek2 are mostly smaller than 62 μm (Figure 6). The massive structure is relatively homogeneous in vertical color and grain size, with occasional mineral composition changes (Figure 7A). The thickness of the single layer of the layered structure is generally 1–10 mm, and the clear layer interface can be recognized by the naked eye. The interlayer mainly includes dolomite interlayers and analcime interlayers (Figure 7D). The laminated structure is also developed of shale in the Ek2, with the apparent changes of color, grain size, and mineral composition at the sedimentary level. The thickness of a single layer is less than 1 mm and shows an abrupt variation in color, grain size, and mineral composition at sedimentary horizontal planes. Dolomite laminae, felsic laminae, clay mineral laminae, and the transition of these laminae types repeatedly appear in different combinations in the vertical direction (Figure 7G). The laminated structure is the most developed type of shale in the Ek2. Among all the laminae types, the organic layer and clay laminations are darker and difficult to identify, while the dolomite layer and felsic layer are brighter and more comfortable to identify. The addition of sedimentary structural factors in the naming process and the perfection of shale naming from a more macroscopic perspective will help reflect the meaning of “facies” in the division of lithofacies (Liu et al., 2020a).
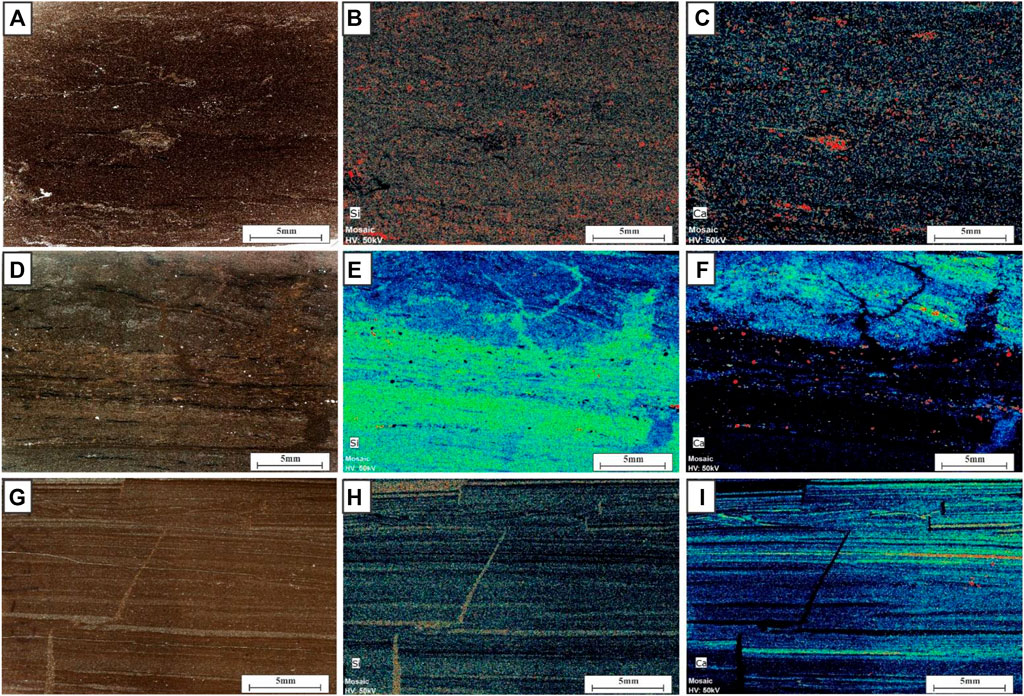
FIGURE 6. Typical sedimentary structures of shales in the Ek2. Borehole locations are available in Figure 1B. (A) Thin-section photograph of massive structure sample from GD-Z well, 3862.22 m. (B) The XRF elemental maps showing the distribution and content of Si in the same sample with image (A). (C) The XRF elemental maps showing the distribution and content of Ca in the same sample with image (A). (D) Thin-section photograph of layered structure sample from GD-Y well, 4089.45 m. (E) The XRF elemental maps showing the distribution and content of Ca in the same sample with image (D). (F) The XRF elemental maps showing the distribution and content of Ca in the same sample with image (D). (G) Thin-section photograph of laminated structure sample from G-X well, 3107.33 m. (H) The XRF elemental maps showing the distribution and content of Ca in the same sample with image (G). (I) The XRF elemental maps showing the distribution and content of Ca in the same sample with image (G).
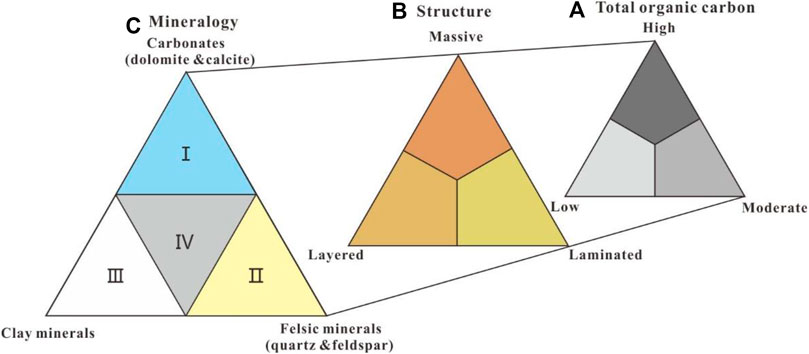
FIGURE 7. Classification of shale lithofacies using (A) content of total organic carbon (rich, more than 3 wt.%; moderate, 1–3 wt.%; low, less than 1 wt.% (modified from Allix et al., 2010; Liu et al., 2019), (B) structure types, and (C) mineral composition. I: calcareous shale; II: argillaceous marlstone; III: siliceous shale.
5 Discussion
5.1 The Classification of Lithofacies
In the current research, the classification and naming of the shale facies have not yet been unified, and the author believes that reasonable lithofacies classification needs to be based on the perspective of sedimentary genesis, comprehensively considering geological factors such as shale petrology, sedimentary structure, and sedimentary environment. Simultaneously, the characteristics of different regions should be fully considered to reveal the diversity of petrological characteristics of organic-rich shale.
The division of shale lithofacies adopted in this paper mainly considers the sedimentary structure, mineral composition, and abundance of organic matter developed by the shale. The “clay minerals-carbonate minerals-felsic minerals” are regarded as the three-terminal elements (Allix et al., 2010; Wu et al., 2016; Liu et al., 2019). Felsic minerals include quartz, k-feldspar, and plagioclase, representing brittle silica minerals. Carbonate minerals are composed of calcite and dolomite. Taking 50% of their respective content as the boundary, and shale with clay, carbonate, and felsic minerals contents all below 50%, is defined as being in the mixed shale group. The shale samples are preliminarily divided into calcareous shale, siliceous shale, clay shale, and mixed shale. Among the four major types of lithofacies, the samples in the study area mainly developed calcareous shale facies, siliceous shale facies, and mixed shale facies, while clay shale facies were rarely developed (Figure 8).
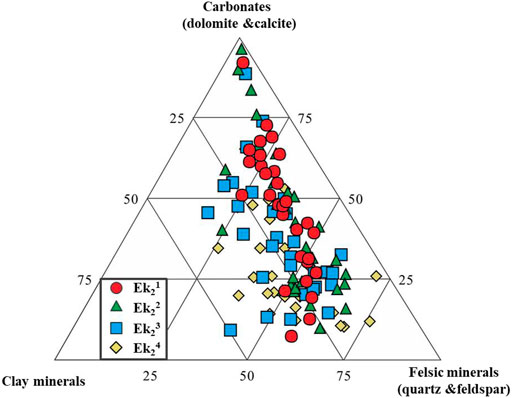
FIGURE 8. Ternary diagrams of the whole-rock mineral component of the Ek2 shales.
As mentioned earlier, for the organic-rich shale of Cangdong Sag, TOC < 1% can be defined as low organic matter content, TOC between 1 and 3% is defined as the moderate organic matter content, and TOC > 3% is defined as high organic matter content. Since the shale was characterized by strong heterogeneity and no strict linear relationship between mineral composition and TOC, a relatively broad concept is used when classifying lithofacies types including low to moderate and moderate to high. The sedimentary structure classification standard refers to the rock macrostructure classification standard proposed by Dong et al. (2015). The interlayer spacing is greater than 50 cm for massive, 1–50 cm for layers, and less than 1 cm for laminar structures. Finally, in consideration of practicality, prominent dominant components, and retention of traditional names, the simplification was further divided into eight lithofacies types: ① low to moderate organic matter content (referred to as “low to moderate TOC”) massive calcareous mudstone (C-1); ② low to moderate TOC laminated calcareous mudstone (C-2); ③ low to moderate TOC layered mixed calcareous mudstone (C-3); ④ moderate to high organic matter content (referred to as “moderate to high TOC”) laminated calcareous siliceous mudstone (S-1); ⑤ moderate to high TOC massive mixed siliceous mudstone (S-2); ⑥ moderate to high TOC laminated clayey siliceous mudstone (S-3); ⑦ low to moderate TOC massive mixed mudstone (M-1); ⑧ moderate to high TOC layered calcareous/siliceous mixed mudstone (M-2).
5.1.1 Low to Moderate TOC Massive Calcareous Facies (C-1)
C-1 is expected in the upper Ek2 and is mainly composed of dolomite and calcite, with the lowest TOC, with an average TOC of 2.12% (Figure 9A). The color is grayish-yellow, relatively uniform, and massive, and few apparent laminations development is identified in the core by naked eye observation. Partially, pyrite, analcime, and charcoal chips are of slightly oriented distribution. Under the SEM, rhombus dolomite is often observed with less laminar bedding, quartz, feldspar, and clay minerals which were observed occasionally, with a small amount of silt and pyrite crystals scattered sporadically. XRD results show that the carbonate mineral content is more than 50% (mainly dolomite), and it also contains varying amounts of felsic and clay minerals.
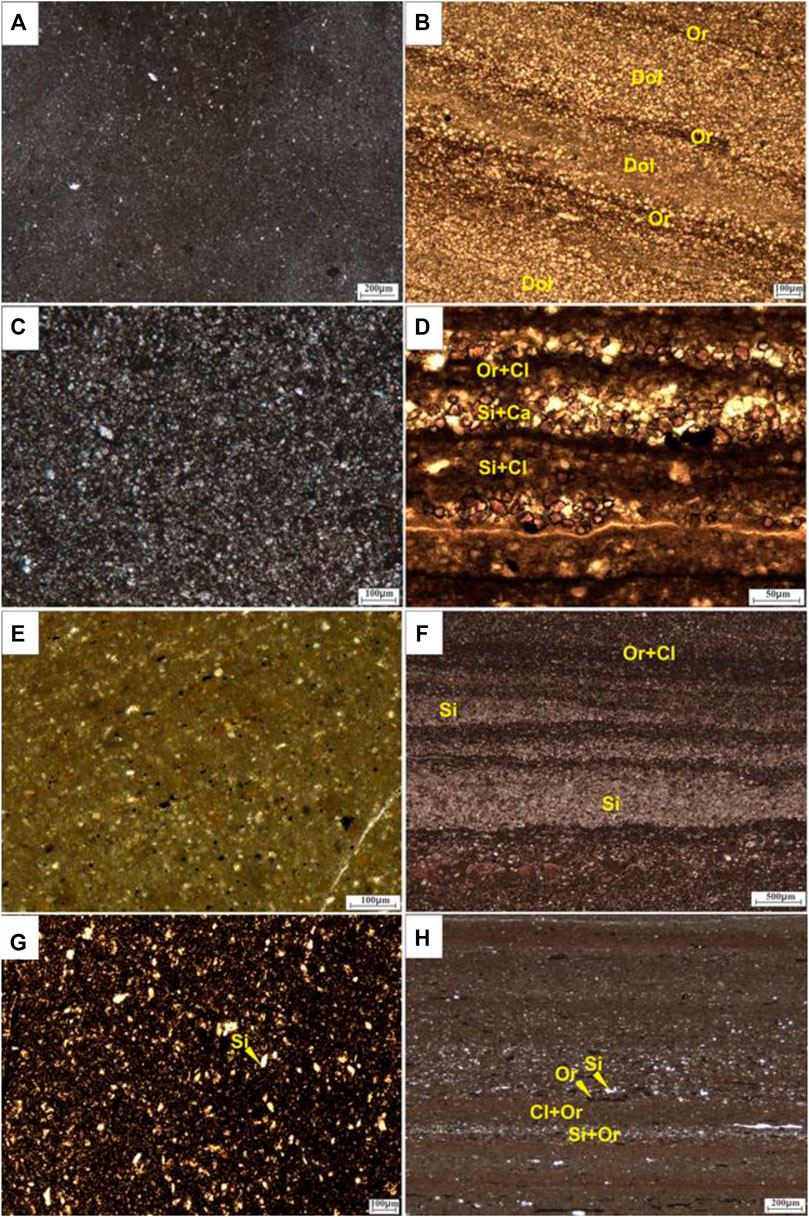
FIGURE 9. Thin sections and SEM images of shale samples. Borehole locations are available in Figure 1B. (A) Thin-section photograph of the sample from GD-Y well, 4138.2 m, lithofacies: C-1. (B) Thin-section photograph of the sample from G-X well, 2943.64 m, lithofacies: C-2. (C) Thin-section photograph of the sample from GD-Y well, 4111.44 m, lithofacies: C-3. (D) Thin-section photograph of the sample from G-X well, 3187.53 m, lithofacies: S-2. (E) Thin-section photograph of the sample from GD-Y well, 2929.04 m, lithofacies: S-1. (F) Thin-section photograph of the sample from GD-Z well, 3854.94 m, lithofacies: S-3. (G) Thin-section photograph of the sample from GD-Z well, 3858.2 m, lithofacies: M-1. (H) Thin-section photograph of the sample from G-X well, 2991.9 m, lithofacies: M-2. Or, organic matter; Cl, clay minerals; Si, quartz + feldspar; Ca, calcite; Dol, dolomite.
5.1.2 Low to Moderate TOC Laminated Calcareous Mudstone (C-2)
C-2 is mainly developed in the middle and upper parts of the Ek2. From the core, it is generally gray or light gray, and the interlayer of light and dark laminations can be observed, with clear boundaries (Figure 9B). The dolomite is often observed as lenticular, striped, and discontinuous layers. The dark layer is clay laminations and organic matter laminations, and the light layer is mainly composed of calcite or dolomite; the content of carbonate minerals is more than 50%; the clay mineral content is less than 15%, and the content of siliceous minerals is about 25%.
5.1.3 Low to Moderate TOC Layered Mixed Calcareous Mudstone (C-3)
C-3 is mainly develops in the middle and lower Ek2. From the observation of the core, it is usually gray or light gray, and sandwich of light and dark layers can be often observed with clear boundaries. The dark layer is a combination of clay and organic matter, and the light layer is mainly composed of the calcite and felsic layers (Figure 9C). The carbonate minerals content is more than 50%; the clay minerals content is 15–25%, and the content of siliceous minerals is about 20%.
5.1.4 Moderate to High TOC Laminated Calcareous Siliceous Mudstone (S-1)
S-1 is the most common lithofacies in the Ek2, occurring mainly in the middle and lower part of Ek2, and the average TOC is 4.38%. The cores mainly show a dark color and the lamination structures can be observed, which may be affected by the paleoenvironment and provenance (Figure 9D), and the fractures were filled with organic material. Under the microscope, silty quartz and feldspar grains are arranged orderly, and the pyrite crystals are of sporadic distribution. In terms of mineral composition, it is characterized by high siliceous mineral content (more than 50%), and the content of carbonate minerals ranges from 15 to 30%.
5.1.5 Moderate to High TOC Massive Mixed Siliceous Mudstone (S-2)
S-2 is mainly developed in the middle and lower part of Ek2. The content of quartz + feldspar is 30–53%, the average is 43.7%, and the average TOC is 4.97%. The lithofacies are dark black/black on the cores, with less-developed shale fractures and occasionally thin pyrite bands (Figure 9E). Thin-section observations show that quartz and feldspar are rounded ones, with the edges slightly metasomatized and infected by clay and carbon.
5.1.6 Moderate to High TOC Laminated Clayey Siliceous Mudstone (S-3)
S-3 is mainly developed at the lower Ek2 and is characterized by the highest TOC (avg. 5.53%). The content of siliceous minerals is 31–69%, and the average is 43.78%, with a clay mineral content of 11–24%, with average 17.33%. Core observation shows that the facies are gray-black, with occasional calcite bands and felsic bands, and are mainly characterized by lamination structures (Figure 9F). Under the microscope, horizontal laminations 0.1–2 mm thick are seen, and the content of clay minerals exceeds 20%, slightly infested by carbon and mixed with fine-grained quartz, clay minerals, and a small amount of silt sand form mud debris, which are distributed along with layers in long strips. Compared with S-2, its clay mineral content has increased.
5.1.7 Low to Moderate TOC Massive Mixed Mudstone (M-1)
M-1 is mainly developed in the lower Ek2 and characterized by low TOC (avg. 1.17%). The content of clay minerals ranges from 15 to 40%, with an average of 23.19%; the content of siliceous minerals is 17–41%, with an average of 30.23%; carbonate mineral content ranges from 8 to 45%, and the average is 28.12% (Figure 9G). The lithofacies are dark black on the core, and a large number of graptolites are distributed disorderly; under the microscope, it can be seen that most of the mineral components are quartz and feldspar, with occasional lamina development.
5.1.8 Moderate to High TOC Laminated Calcareous/Siliceous Mixed Mudstone (M-2)
M-2 is common lithofacies in the Ek2 and is characterized by high TOC (avg. 4.96%). It is dark gray to black in the cores, and occasionally pyrite bands are developed. The thin sections show that the minerals are arranged in a directional arrangement and have a laminated structure, including clay mineral layers, siliceous layers, and carbonate mineral laminations (Figure 9H), with a small amount of silt and pyrite crystals scattered sporadically. In terms of mineral composition, average siliceous, carbonate, and clay mineral contents all are below 50%.
5.2 Sedimentary Characteristics of Lacustrine Shale
5.2.1 Relationship Between TOC and Lithofacies
By counting the thickness of different lithofacies in different sub-members, it is found that the total thickness of calcareous shale is mainly developed on the top of the Ek2 (Ek21). From Ek23 to Ek21, the total thickness of siliceous shale gradually increases, and the content of mixed shale gradually decreases (Figure 10). This is mainly controlled by the size of the lake basin, the depth of the lake water, and the change of paleoclimate, and it also reflects the changes in the sedimentary environment of Ek2. Ek24 cannot be included in the comparison range, mainly because this sedimentary period mainly deposited a large set of sandstone, and the black shale was deposited in the form of interlayers. The TOC content of different lithofacies is quite different. As mentioned above, combining the exploration and development and production experience of the shale oil field in the Cangdong Sag, using 1 and 3% as the standard points, the shales of Ek2 are divided into low TOC (<1%) and moderate TOC (1–3%) and high TOC (>3%). According to the test data, the TOC content of the Ek2 is mainly greater than 1%. The siliceous shale facies (S-1, S-2, and S-3) and M-2 show the highest TOC, which is up to 12.92%, with an average of 4.38, 4.97, 5.53, and 4.96%, respectively. The calcareous shale facies (C-1, C-2, and C-3) and M-1 show moderate TOC, with an average of 2.12, 1.91, 1.49, and 1.17%. Figure 11 reveals the average organic carbon content of different lithofacies. The lithofacies with the best organic carbon content is S-3, followed by S-2, M-2, and S-1.
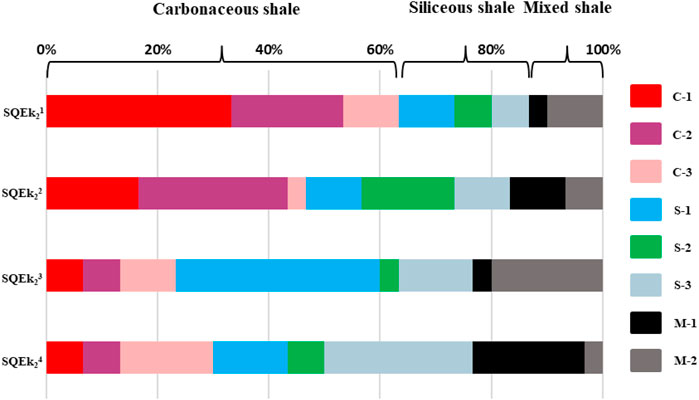
FIGURE 10. Statistics of lithofacies distribution thickness in different sub-members.
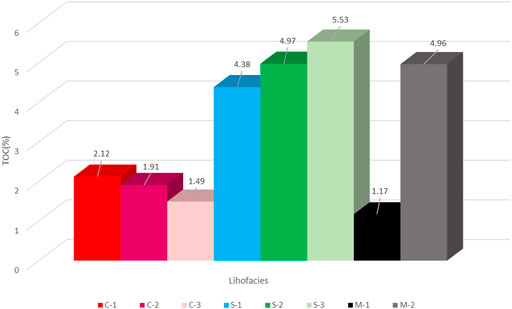
FIGURE 11. Comparison of TOC content of different lithofacies.
5.2.2 Pore Structure Characteristics
The pore structure is an essential basis for evaluating the porosity, seepage, and effectiveness of shale reservoirs. Although shale is relatively dense, the pores are dominated by nano-micro pores, a large number of nano-scale pores in the organic matter of shale and inorganic pores in the crystal layer of clay minerals can increase the specific surface area of shale pores, which is conducive to the enrichment of shale oil. Based on the observation results of scanning electron microscopy and argon ion polishing scanning electron microscopy in the study area, it can be seen that compared to inorganic pores, organic pores are less abundant in the study area and often develop associated with clay minerals or pyrites.
Inorganic pores are generally dominated by inorganic pores, such as intragranular pores, dissolution pores, and intergranular pores, and are usually distributed dispersedly in the shale. The pore size ranges from nanometer to micrometer with good connectivity. Clay minerals and dolomite often result in the development of intracrystal pores, and intergranular pores are developed between quartz, feldspar, calcite, or other brittle minerals (Figure 12). Detailed observations were studied on the four main lithofacies. According to SEM statistics, the lithofacies C-2 and S-1 were characterized by the highest porosity, followed by S-3, S-2, C-3, and M-2, while C-1 and M-1 were characterized by the lowest porosity.
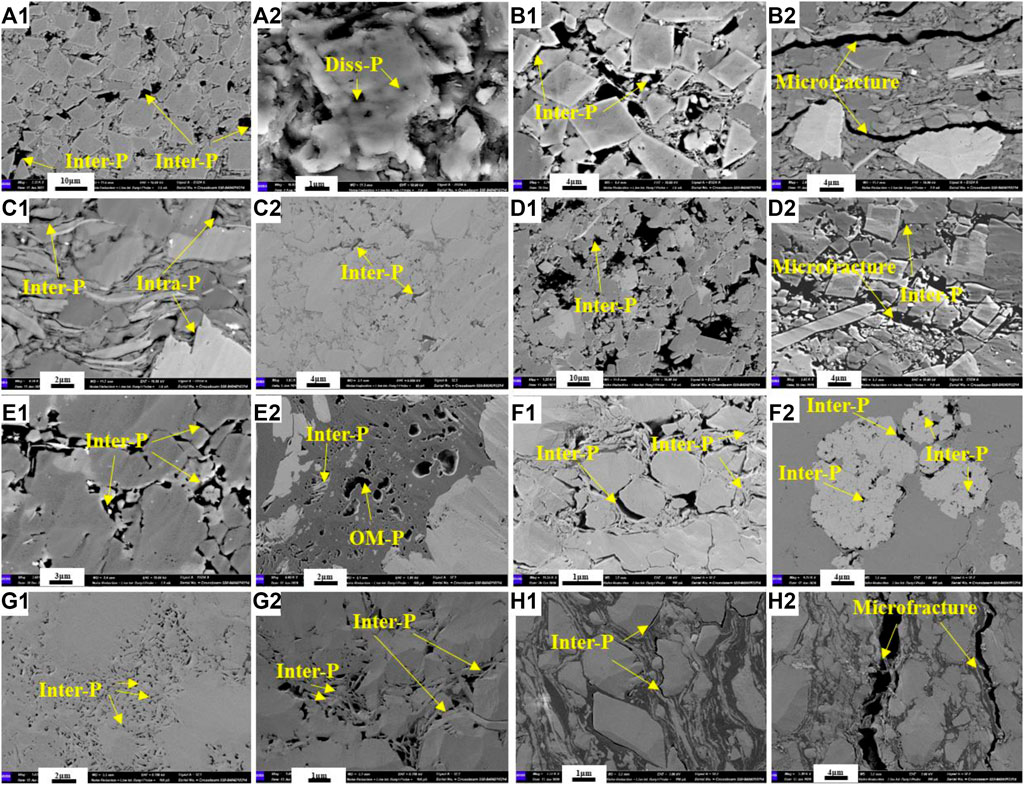
FIGURE 12. SEM images of shale samples show reservoir porosity types in different lithofacies. Borehole locations are available in Figure 1B. A1) Interparticle pores of C-1 shale sample from G-X well, 2952.04 m. A2) Dissolution pores of C-1 shale sample from GD-Y well, 4142.31 m. B1) Interparticle pores of C-2 shale sample from G-X well, 3176.75 m. B2) Microfractures of C-2 shale sample from G-X well, 3176.75 m. C1) Interparticle pores of C-3 shale sample from GD-Y well, 4115.55 m. C2) Interparticle pores of C-3 shale sample from G-Z well, 3840.71 m. D1) Interparticle pores of S-1 shale sample from GD-X well, 2952.04 m. D2) Interparticle pores and microfractures of S-1 shale sample from G-Z well, 3858.2 m. E1) Interparticle pores of S-2 shale sample from GD-Y well, 4111.44 m. E2) Organic and interparticle pores of S-2 shale sample from GD-Y well, 4134.52 m. F1) Interparticle pores of S-3 shale sample from GD-X well, 3315.75 m. F2) Interparticle pores of S-3 shale sample from GD-Y well, 4117.37 m. G1) Interparticle pores of M-1 shale sample from G-X well, 3057.7 m. G2) Interparticle pores of M-1 shale sample from GD-Z well, 3866.47 m. H1) Interparticle pores of M-2 shale sample from G-X well, 3176.75 m. H2) Microfractures of M-2 shale sample from G-X well, 3176.75 m.
The pore structure of C-1 is dominated by intragranular pores, dissolved pores, and intercrystalline pores within dolomite, calcite, or clay minerals, while organic pores are underdeveloped (Figure 13). The pore structure of C-2 is dominated by intragranular pores of siliceous minerals, organic pores, and microfractures which are often observed (Figures 12C,D). The pore structure of C-3 is dominated by intragranular pores and intercrystalline pores (Figures 12E,F). The pore structure of S-1 is dominated by intragranular pores and microfractures, with organic pores well redeveloped (Figures 12G,H). The pore types of S-2 are diverse, and organic pores and inorganic pores are generally developed (Figures 12I,J). The pore structure of S-3 is dominated by intergranular pores of siliceous minerals and intercrystalline pores within clay minerals and pyrite (Figures 12K,L). The pore structure of M-1 is dominated by inorganic pores and is mainly clay mineral intercrystalline pores and primary intergranular pores of detrital particles (Figures 12M,N). The pore structure of M-2 is dominated by intergranular pores of siliceous minerals and intercrystalline pores provided by clay minerals, and microfractures are often observed (Figures 12O,P). In addition to qualitative observation and rough statistics with AIP-SEM, adsorption-desorption isothermal curves are usually used to investigate the pore structure characteristics of shales (Sing et al., 1985; Thommes et al., 2015). According to the IUPAC classification, the hysteresis loops are divided into four types (H1-H4) to reflect the pore structure characteristics (Sing et al., 1985; Peters and Cassa, 1994; Thommes et al., 2015). Two typical samples of each lithofacies were selected for low-pressure nitrogen adsorption experiments, and the results show that the hysteresis loops show a mixture of Type H2 and H3, with significant differences between different lithofacies (Figure 13). As shown in Figure 13, the C-2, S-1, S-2, S-3, and M-2 samples are characterized high porosity and dominated by macropores, while the C-1, C-3, and M-1 samples are dominated by mesopores.
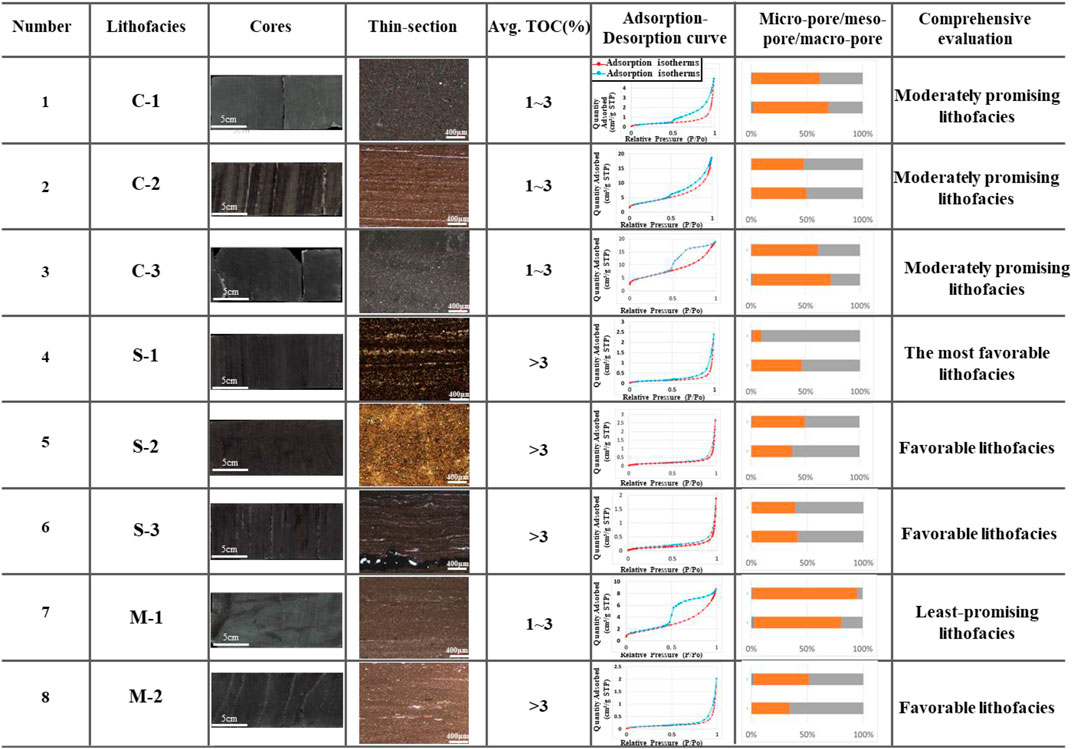
FIGURE 13. Comparison of experimental results and comprehensive evaluation of different lithofacies types of the Ek2 shale in Cangdong Sag.
5.3 Evaluation and Distribution Characterizations of Lithofacies
During the deposition process, lacustrine shales are under the comprehensive control of multiple factors and are extremely sensitive to changes in accommodation space, provenance, water conditions, and paleoclimate changes (Carroll and Bohacs, 1999; Bohacs et al., 2000). The depositional environment controls the type and distribution characterizations of shale lithofacies. Similarly, lithofacies can reflect a certain sedimentary environment and process (Loucks and Ruppel, 2007; Wang and Carr, 2012; Newport et al., 2016). By observing and depicting more than 600 m cores in the Ek2, combined with the division of lithofacies, the main lithofacies vertical facies evolution characteristics of Ek2 shale are calculated, and the research results show that all eight lithofacies types were developed throughout Ek2. At the same time, there are significant differences in eight lithofacies.
Calcareous shales are (C-1, C-2, and C-3) mainly composed of carbonate minerals which are dominated by dolomite, mainly developed in Ek21, reflecting the arid climate during this depositional period and the decrease in terrestrial supply (Ma et al., 2019; Xin et al., 2021). Due to the low input of terrestrial sources and the high salinity of the lake, the lake productivity is not high. Siliceous shales (S-1, S-2, and S-3) are mainly composed of feldspar and quartz, which is mainly deposited in humid paleoclimate with strong detrital input. These lithofacies are developed throughout the whole Ek2, and the main distribution sub-members are Ek23 and Ek21. The TOC content of M-1 is the lowest among the eight lithofacies, and M-1 contains clay minerals, felsic minerals, and carbonate minerals and is characterized by a homogeneous mixture with no laminae, indicating that the sediments settled rapidly and continuously in a short period without water stratification, and the organic matter is difficult to preserve in high-energy water. M-1 is mainly distributed in Ek24. The mineral composition of M-2 is relatively complex and usually dominated by two of the three main types of minerals (clay minerals, felsic minerals, and carbonate minerals), with a high TOC content. The laminae of M-2 are fine and straight with clear boundaries, indicating that the sedimentary environment is low-energy lake with water stratification, which is conducive to preserving organic matter. M-2 is mainly distributed in Ek23, followed by Ek21.
From the perspective of stratigraphic unit composition, the lithofacies composition of different sub-members also shows significant differences. Ek21 is dominated by calcareous shale lithofacies; the lithofacies type of the Ek22 changes from siliceous shale lithofacies in the lower part to calcareous shale lithofacies in the upper part. Ek23 is dominated by siliceous shale lithofacies and mixed shale lithofacies, which accounts for more than 50%, and calcareous shale lithofacies are the least developed. Ek24 is dominated by mixed shale lithofacies, and siliceous shale lithofacies are observed frequently.
Hydrocarbon potential and associated storage capacity are two significant factors in shale oil production. Given that S-1 shows the highest hydrocarbon potential with abundant storage space, it is currently regarded as the most favorable lithofacies and followed by S-2, S-3, and M-2. Although the hydrocarbon generation potential of C-1, C-2, and C-3 is worse than favorable lithofacies, while the shale can provide storage space and is rich in brittle minerals, therefore, C-2 and C-3 are assumed to be moderately promising for shale oil, while C-1 and M-1 shales are ranked as the least-promising lithofacies in the study area (Figure 13). Therefore, the most potential sub-member is Ek23, followed by Ek22.
6 Conclusion
The shale of the Ek2 in the Cangdong Sag is dominated by Type I and Type II1 kerogen, indicating that it is a typical oil-prone lacustrine shale in the mature stage. The mineral composition is dominated by quartz, feldspar, and dolomite, followed by calcite, clay minerals, and analcime.
Based on the combination of TOC, mineral components, and sedimentary structure, eight lithofacies were identified in the Ek2 shales: ① low to moderate organic matter content (referred to as “low to moderate TOC”) massive calcareous mudstone (C-1); ② low to moderate TOC laminated calcareous mudstone (C-2); ③ low to moderate TOC layered mixed calcareous mudstone (C-3); ④ moderate to high organic matter content (referred to as “moderate to high TOC”) laminated calcareous siliceous mudstone (S-1); ⑤ moderate to high TOC massive mixed siliceous mudstone (S-2); ⑥ moderate to high TOC laminated clayey siliceous mudstone (S-3); ⑦ low to moderate TOC massive mixed mudstone (M-1); ⑧ moderate to high TOC layered calcareous/siliceous mixed mudstone (M-2).
The eight lithofacies are different in terms of geochemical characteristics. S-1, S-2, S-3, and M-2 samples show high TOC and a very good to excellent potential for oil generation, while C-1, C-2, C-3, and M-1 samples are characterized by lower TOC. The pore structure characteristics of the eight lithofacies are different. The C-2, S-1, S-2, S-3, and M-2 samples are characterized by high porosity and dominated by macropores, while the C-1, C-3, and M-1 samples are dominated by mesopores. S-1 is currently regarded as the most favorable lithofacies with the highest hydrocarbon potential and abundant organic pores, and M-1 were regarded as the least-promising lithofacies. The distribution characteristics of shale facies in four sub-members are quite different, and the most favorable lithofacies for shale oil exploration were mainly distributed in Ek23.
Data Availability Statement
The raw data supporting the conclusion of this article will be made available by the authors, without undue reservation.
Author Contributions
All authors listed have made a substantial, direct, and intellectual contribution to the work and approved it for publication.
Funding
This work was supported by PetroChina Dagang Oil Field Company (Grant No. DGYT-2018-0602), the National Natural Science Foundation of China (Grant Nos. 41821002 and 41902131), and Innovative Research Projects for Graduates of China University of Petroleum (East China) (Grant No. YCX2020003).
Conflict of Interest
Authors XZ, XP, LZ, WH, and ZS were employed by the company PetroChina.
The remaining authors declare that the research was conducted in the absence of any commercial or financial relationships that could be construed as a potential conflict of interest.
Publisher’s Note
All claims expressed in this article are solely those of the authors and do not necessarily represent those of their affiliated organizations, or those of the publisher, the editors, and the reviewers. Any product that may be evaluated in this article, or claim that may be made by its manufacturer, is not guaranteed or endorsed by the publisher.
Supplementary Material
The Supplementary Material for this article can be found online at: https://www.frontiersin.org/articles/10.3389/feart.2021.755714/full#supplementary-material
References
Allix, P., Burnham, A., Fowler, T., Herron, M., Kleinberg, R., and Symington, B. (2010). Coaxing Oil from Shale. Oilfield Rev. 22 (4), 4–15.
Aplin, A. C., and Macquaker, J. H. S. (2011). Mudstone Diversity: Origin and Implications for Source, Seal, and Reservoir Properties in Petroleum Systems. Bulletin 95 (12), 2031–2059. doi:10.1306/03281110162
Carroll, A. R., and Bohacs, K. M. (1999). Stratigraphic Classification of Ancient Lakes: Balancing Tectonic and Climatic Controls. Geol. 27 (2), 99–102. doi:10.1130/0091-7613(1999)027<0099:scoalb>2.3.co;2
Chen, K., Liu, X., Liu, J., Zhang, C., Guan, M., and Zhou, S. (2019). Lithofacies and Pore Characterization of continental Shale in the Second Member of the Kongdian Formation in the Cangdong Sag, Bohai Bay Basin, China. J. Pet. Sci. Eng. 177, 154–166. doi:10.1016/j.petrol.2019.02.022
Cheng-yong Chang, C. (1991). Geological Characteristics and Distribution Patterns of Hydrocarbon Deposits in the Bohai Bay Basin, East China. Mar. Pet. Geology 8 (1), 98–106. doi:10.1016/0264-8172(91)90048-6
Chermak, J. A., and Schreiber, M. E. (2014). Mineralogy and Trace Element Geochemistry of Gas Shales in the United States: Environmental Implications. Int. J. Coal Geology 126, 32–44. doi:10.1016/j.coal.2013.12.005
Cui, J. W., Zhu, R. K., Yang, Z., Bai, B., Wu, S., and Su, L. (2015). Progresses and Enlightenment of Overseas Shale Oil Exploration and Development. Unconventional Oil and Gas 2 (4), 68–82. doi:10.3969/j.issn.2095-8471.2015.04.012
Curtis, J. B. (2002). Fractured Shale-Gas Systems. AAPG Bull. 86, 1921–1938. doi:10.1306/61eeddbe-173e-11d7-8645000102c1865d
Deng, Y., Chen, S. Y., Pu, X. G., Yan, J., Chen, J., et al. (2020). Formation Mechanism and Environmental Evolution of fine-grained Sedimentary Rocks from the Second Member of Kongdian Formation in the Cangdong Sag, Bohai Bay Basin. Oil &Gas Geology 41 (4), 811–823. 890. doi:10.11743/ogg20200414
Dill, H. G., Ludwig, R.-R., Kathewera, A., and Mwenelupembe, J. (2005). A Lithofacies Terrain Model for the Blantyre Region: Implications for the Interpretation of Palaeosavanna Depositional Systems and for Environmental Geology and Economic Geology in Southern Malawi. J. Afr. Earth Sci. 41, 341–393. doi:10.1016/j.jafrearsci.2005.07.005
Dong, C., Cunfei, M. A., Lin, C., Sun, X., and Yuan, M. (2015). A Method of Classification of Shale Set. J. China Univ. Pet. 39 (3), 1–7. doi:10.3969/j.issn.1673-5005.2015.03.001
Espitalié, J., and Bordenave, M. L. (1993). “Source Rock Parameters,” in Applied Petroleum Geochemistry (Paris: Editions Technip), 524.
Hao, F., Zou, H., Gong, Z., and Deng, Y. (2007). Petroleum Migration and Accumulation in the Bozhong sub-basin, Bohai Bay Basin, China: Significance of Preferential Petroleum Migration Pathways (PPMP) for the Formation of Large Oilfields in Lacustrine Fault Basins. Mar. Pet. Geology 24, 1–13. doi:10.1016/j.marpetgeo.2006.10.007
Hu, H., Hao, F., Guo, X., Yi, J., Shu, Z., Bao, H., et al. (2019). Effect of Lithofacies on the Pore System of Over-mature Longmaxi Shale in the Jiaoshiba Area, Sichuan Basin, China. Mar. Pet. Geology 109, 886–898. doi:10.1016/j.marpetgeo.2019.06.050
Huang, C., Zhang, J., Hua, W., Yue, J., and Lu, Y. (2018). Sedimentology and Lithofacies of Lacustrine Shale: A Case Study from the Dongpu Sag, Bohai Bay Basin, Eastern China. J. Nat. Gas Sci. Eng. 60, 174–189. doi:10.1016/j.jngse.2018.10.014
Jarvie, D. M., Hill, R. J., Ruble, T. E., and Pollastro, R. M. (2007). Unconventional Shale-Gas Systems: the Mississippian Barnett Shale of north-central Texas as One Model for Thermogenic Shale-Gas Assessment. Bulletin 91 (4), 475–499. doi:10.1306/12190606068
Jarvie, D. M. (2012). “Shale Resource Systems for Oil and Gas: Part 2-Shale-Oil Resource Systems,” in Shale Reservoirs-Giant Resources for the 21st century. Editor J.A. Breyer (AAPG Memoir), 97, 89–119.
Ji, W., Hao, F., Schulz, H.-M., Song, Y., and Tian, J. (2019). The Architecture of Organic Matter and its Pores in Highly Mature Gas Shales of the Lower Silurian Longmaxi Formation in the Upper Yangtze Platform, south China. Bulletin 103 (12), 2909–2942. doi:10.1306/04101917386
Ji, W., Hao, F., Song, Y., Tian, J., Meng, M., and Huang, H. (2020). Organic Geochemical and Mineralogical Characterization of the Lower Silurian Longmaxi Shale in the southeastern Chongqing Area of China: Implications for Organic Matter Accumulation. Int. J. Coal Geology 220, 103412. doi:10.1016/j.coal.2020.103412
Jiang, F., Pang, X., Yu, S., Hu, T., Bai, J., Han, G., et al. (2015). Charging History of Paleogene Deep Gas in the Qibei Sag, Bohai Bay Basin, China. Mar. Pet. Geology 67, 617–634. doi:10.1016/j.marpetgeo.2015.04.022
Jin, Z. J., Hu, Z. Q., Gao, B., and Zhao, J. (2016). Controlling Factors on the Enrichment and High Productivity of Shale Gas in the Wufeng-Longmaxi Formations, southeastern Sichuan Basin. Earth Sci. Front. 23 (1), 1–10. doi:10.13745/j.esf.2016.01.001
Liang, C., Jiang, Z., X., Yang, Y. T., and Wei, X. (2012). Characteristics of Shale Lithofacies and Reservoir Space of the Wufeng–Longmaxi Formation, Sichuan Basin. Pet. Exploration Dev. 39 (6), 691–698. doi:10.1016/s1876-3804(12)60098-6
Liu, B., Wang, H., Fu, X., Bai, Y., Bai, L., Jia, M., et al. (2019). Lithofacies and Depositional Setting of a Highly Prospective Lacustrine Shale Oil Succession from the Upper Cretaceous Qingshankou Formation in the Gulong Sag, Northern Songliao Basin, Northeast China. Bulletin 103 (2), 405–432. doi:10.1306/08031817416
Liu, Q., Song, Y., Jiang, L., Cao, T., Chen, Z., Xiao, D., et al. (2017). Geochemistry and Correlation of Oils and Source Rocks in Banqiao Sag, Huanghua Depression, Northern China. Int. J. Coal Geology 176-177, 49–68. doi:10.1016/j.coal.2017.04.005
Liu, R., Hao, F., Engelder, T., Zhu, Z., Yi, J., Xu, S., et al. (2020a). Influence of Tectonic Exhumation on Porosity of Wufeng-Longmaxi Shale in the Fuling Gas Field of the Eastern Sichuan Basin, China. Bulletin 104, 939–959. doi:10.1306/08161918071
Liu, R., Jiang, D., Zheng, J., Hao, F., Jing, C., Liu, H., et al. (2021). Stress Heterogeneity in the Changning Shale-Gas Field, Southern Sichuan Basin: Implications for a Hydraulic Fracturing Strategy. Mar. Pet. Geology 132, 105218. doi:10.1016/j.marpetgeo.2021.105218
Liu, R., Zheng, J., Hao, F., Nie, Z., Heng, D., Tan, X., et al. (2020b). Variation in Pore Systems with Tectonic Stress in the Overthrust Wufeng-Longmaxi Shale of the Southern Sichuan Basin, China. J. Nat. Gas Sci. Eng. 83, 103617. doi:10.1016/j.jngse.2020.103617
Loucks, R. G., Reed, R. M., Ruppel, S. C., and Hammes, U. (2012). Spectrum of Pore Types and Networks in Mudrocks and a Descriptive Classification for Matrix-Related Mudrock Pores. Bulletin 96 (6), 1071–1098. doi:10.1306/08171111061
Loucks, R. G., and Ruppel, S. C. (2007). Mississippian Barnett Shale: Lithofacies and Depositional Setting of a Deep-Water Shale-Gas Succession in the Fort Worth Basin, Texas. Bulletin 91 (4), 579–601. doi:10.1306/11020606059
Ma, Y., Fan, M., Lu, Y., Liu, H., Hao, Y., Xie, Z., et al. (2017). Middle Eocene Paleohydrology of the Dongying Depression in Eastern China from Sedimentological and Geochemical Signatures of Lacustrine Mudstone. Palaeogeogr. Palaeoclimatol. Palaeoecol. 479, 16–33. doi:10.1016/j.palaeo.2017.04.011
Ma, Y., Lu, Y., Liu, X., Zhai, G., Wang, Y., and Zhang, C. (2019). Depositional Environment and Organic Matter Enrichment of the Lower Cambrian Niutitang Shale in Western Hubei Province, South China. Mar. Pet. Geology 109, 381–393. doi:10.1016/j.marpetgeo.2019.06.039
Milliken, K. L., Rudnicki, M., Awwiller, D. N., and Zhang, T. (2013). Organic Matter-Hosted Pore System, marcellus Formation (Devonian), Pennsylvania. Bulletin 97 (2), 177–200. doi:10.1306/07231212048
Mukhopadhyay, P. K., Wade, J. A., and Kruge, M. A. (1995). Organic Facies and Maturation of Jurassic/Cretaceous Rocks, and Possible Oil-Source Rock Correlation Based on Pyrolysis of Asphaltenes, Scotian Basin, Canada. Org. Geochem. 22 (1), 85–104. doi:10.1016/0146-6380(95)90010-1
Newport, L. P., Aplin, A. C., Gluyas, J. G., and Greenwell, H. C. (2016). Geochemical and Lithological Controls on a Potential Shale Reservoir: Carboniferous Holywell Shale, Wales. Mar. Pet. Geology 71, 198–210. doi:10.1016/j.marpetgeo.2015.11.026
Pecharsky, V. K., and Zavalij, P. Y. (2003). Fundamentals of Powder Diffraction and Structural Characterization of Materials. Kluwer Academic.
Peters, K. E., and Cassa, M. R. (1994). “Applied Source Rock Geochemistry,” in The Petroleum System-From Source to Trap: AAPG Memoir. Editors L.B. Magoon, and W.G. Dow, 60, 93–120. doi:10.1306/m60585c5
Pu, X. G., Shi, Z. N., Han, W. Z., et al. (2019). Petroleum Geological Characteristics and Hydrocarbon Discovery of Shale Rock System in fine-grained Sedimentary Area of continental Lacustrine basin——a Case Study of Kong 2 Member in Cangdong Sag, Huanghua Depression. Pet. Geology Recovery Efficiency 26, 46–58.
Pu, X. G., Zhou, L. H., Han, W. Z., Zhou, J., Wang, W., Zhang, W., et al. (2016). Geologic Features of fine-grained Facies Sedimentation and Tight Oil Exploration: a Case from the Second Member of Paleogene Kongdian Formation of Cangdong Sag, Bohai Bay Basin. Petrolerm Exploration Dev. 43, 24–33. doi:10.1016/s1876-3804(16)30003-9
Ratcliffe, K. T., Wright, A. M., Montgomery, P., Palfrey, A., Vonk, A., Vermeulen, J., et al. (2010). Application of Chemostratigraphy to the Mungaroo Formation, the Gorgon Field, Offshore Northwest Australia. Aust. Pet. Prod. Explor. Assoc. J. 50, 371–388. doi:10.1071/aj09022
Ross, D. J. K., and Bustin, M. R. (2009). The Importance of Shale Composition and Pore Structure upon Gas Storage Potential of Shale Gas Reservoirs. Mar. Pet. Geology 26 (6), 916–927. doi:10.1016/j.marpetgeo.2008.06.004
Roy, D. K., and Roser, B. P. (2013). Climatic Control on the Composition of Carboniferouspermian Gondwana Sediments, Khalaspir basin. Bangladesh. Gondwana Res. 23 (3), 1163–1171. doi:10.1016/j.gr.2012.07.006
Schmoker, J. W. (2002). Resource-assessment Perspectives for Unconventional Gas Systems. AAPG Bull. 86 (11), 1993–1999. doi:10.1306/61eedddc-173e-11d7-8645000102c1865d
Slatt, R. M., and Rodriguez, N. D. (2012). Comparative Sequence Stratigraphy and Organic Geochemistry of Gas Shales: Commonality or Coincidence?. J. Nat. Gas Sci. Eng. 8, 68–84. doi:10.1016/j.jngse.2012.01.008
Tang, X., Jiang, Z., Huang, H., Jiang, S., Yang, L., Xiong, F., et al. (2016). Lithofacies Characteristics and its Effect on Gas Storage of the Silurian Longmaxi marine Shale in the Southeast Sichuan Basin, China. J. Nat. Gas Sci. Eng. 28, 338–346. doi:10.1016/j.jngse.2015.12.026
U.S. Energy Information Administration (2017). Annual Energy Outlook 2017. Washington DC: U.S. Energy Information Administration.
Wang, C., Zhang, B. Q., Lu, Y. C., Bao, H., Meng, Z., and Chen, L. (2018). Lithofacies Distribution Characteristics and its Controlling Factors of Shale in Wufeng Formation-Member 1 of Longmaxi Formation in the Jiaoshiba Area. Pet. Res. 3, 306–319. doi:10.1016/j.ptlrs.2018.11.005
Wang, G., and Carr, T. R. (2012). Methodology of Organic-Rich Shale Lithofacies Identification and Prediction: A Case Study from Marcellus Shale in the Appalachian basin. Comput. Geosciences 49, 151–163. doi:10.1016/j.cageo.2012.07.011
Wang, H. J., Ma, F., Tong, X. G., Liu, Z., Zhang, X., Wu, Z., et al. (2016). Assessment of Global Unconventional Oil and Gas Resources. Pet. Exploration Dev. 43 (6), 850–862. doi:10.1016/s1876-3804(16)30111-2
Wang, Y., Xu, S., Hao, F., Lu, Y., Shu, Z., and Yan, D. (2019). Geochemical and Petrographic Characteristics of Wufeng-Longmaxi Shales, Jiaoshiba Area, Southwest China: Implications for Organic Matter Differential Accumulation. Mar. Pet. Geology 102, 138–154. doi:10.1016/j.marpetgeo.2018.12.038
Wang, Y., Xu, S., Hao, F., Poulton, S. W., Zhang, Y., and Guo, T. (2021). Arid Climate Disturbance and the Development of Salinized Lacustrine Oil Shale in the Middle Jurassic Dameigou Formation, Qaidam Basin, Northwestern China. Palaeogeogr. Palaeoclimatol. Palaeoecol. 577, 110533. doi:10.1016/j.palaeo.2021.110533
Wang, Z. Y., Chen, L., Chen, D. X., Lai, J., Deng, G., and Liu, Z. (2020). Characterization and Evaluation of Shale Lithofacies within the Lowermost Longmaxi-Wufeng Formation in the Southeast Sichuan Basin. J. Pet. Sci. Eng. 193, 107353. doi:10.1016/j.petrol.2020.107353
Wu, L. Y., Hu, D. F., Lu, Y. C., Liu, R. B., and Liu, X. F. (2016). Advantageous Shale Lithofacies of Wufeng Formation-Longmaxi Formation in Fuling Gas Field of Sichuan Basin, SW China. Petrol. Explor. Dev. 43 (2), 189–197. doi:10.1016/s1876-3804(16)30024-6
Xin, B., Hao, F., Han, W., Xu, Q., Zhang, B., and Tian, J. (2021). Paleoenvironment Evolution of the Lacustrine Organic-Rich Shales in the Second Member of Kongdian Formation of Cangdong Sag, Bohai Bay Basin, China: Implications for Organic Matter Accumulation. Mar. Pet. Geology 133, 105244. doi:10.1016/j.marpetgeo.2021.105244
Xu, Q. L., Ma, Y. S., Liu, B., Song, B., Li, L., and Xu, J. (2018). Fractal Characteristics of Lacustrine Tight Carbonate Nanoscale Reservoirs. Energy & Fuels 32, 107–118. doi:10.1021/acs.energyfuels.7b02625
Xu, Q. L., Ma, Y. S., Liu, B., Song, X., Su, J., and Chen, Z. (2019). Characteristics and Control Mechanism of Nanoscale Pores in Lacustrine Tight Carbonates: Examples from the Jurassic Da'anzhai Member in the central Sichuan Basin, China. J. Asian Earth Sci. 178, 156–172. doi:10.1016/j.jseaes.2018.05.009
Xu, S., Hao, F., Shu, Z., Zhang, A., and Yang, F. (2020). Pore Structures of Different Types of Shales and Shale Gas Exploration of the Ordovician Wufeng and Silurian Longmaxi Successions in the Eastern Sichuan Basin, South China. J. Asian Earth Sci. 193, 104271. doi:10.1016/j.jseaes.2020.104271
Yan, L. J., and Zheng, M. P. (2015). The Response of lake Variations to Climate Change in the Past Forty Years: a Case Study of the Northeastern Tibetan Plateau and Adjacent Areas, China. Quternary Int. 371, 31–48. doi:10.1016/j.quaint.2014.12.057
Zhang, J., Lin, L., Li, Y., Tang, X., Zhu, L., Xing, Y., et al. (2012). Classification and Evaluation of Shale Oil. Earth Sci. Front. 19 (5), 322–331.
Zhang, L., Li, J., Li, Z., Zhang, J., Zhu, R., and Bao, Y. (2014). Advances in Shale Oil/gas Research in North America and Considerations on Exploration for continental Shale Oil/Gas in China. Adv. Earth Sci. 29 (6), 700–711.
Zhang, T. S., Peng, Z., Yang, W., Ma, Y., and Zhang, J. (2015). Enlightenments of American Shale Oil Research towards China. Lithologic Reservoirs 27 (3), 1–10. doi:10.3969/j.issn.1673-8926.2015.03.001
Zhao, J. Y., Zin, Z. J., Wen, X., Jin, H. F., Geng, Y., and Nie, H. (2016). Lithofacies Types and Sedimentary Environment of Shale in Wufeng-Longmaxi Formation, Sichuan Basin. Acta Petrolei Sinica 37 (5), 572–586. doi:10.7623/syxb201605002
Zhao, X. Z., Zhou, L. H., Pu, X. G., Jin, H. F., Xiao, D., and Shi, Z. (2019). Exploration Breakthroughs and Geological Characteristics of continental Shale Oil: A Case Study of the Kongdian Formation in the Cangdong Sag, China. Mar. Pet. Geology 102, 544–556. doi:10.1016/j.marpetgeo.2018.12.020
Zhao, X. Z., Zhou, L. H., Pu, X. G., Jin, Z., Han, W., and Xiao, D. (2018). Geological Characteristics of Shale Rock System and Shale Oil Exploration Breakthrough in a Lacustrine basin: a Case Study from the Paleogene 1st Sub-member of Kong 2 Member in Cangdong Sag, Bohai Bay Basin, China. Pet. Explor. Dev. 45, 361–372. doi:10.1016/s1876-3804(18)30043-0
Zhou, L., Chen, C., Yang, F., Han, W., and Guan, Q. (2020). Micropore Structure Characteristics and Quantitative Characterization Methods of Lacustrine Shale-A Case Study from the Member 2 of Kongdian Formation, Cangdong Sag, Bohai Bay Basin. Pet. Res. 5 (2), 93–102. doi:10.1016/j.ptlrs.2020.01.001
Zhou, L. H., Pu, X. G., Han, W. Z., Chen, C., Zhang, W., Lin, C., et al. (2015). Sedimentary Characteristics and Hydrocarbon Exploration of Ek2 of Nanpi Slope Area, Cangdong Sag, Huanghua Depression, North China. J. Chengdu Univ. Tech. (Science Tech. Edition) 42 (5), 539–546. doi:10.3969/j.issn.1671-9727.2015.05.04
Keywords: lithofacies, shale oil, Kongdian Formation, Bohai Bay Basin, pore structure
Citation: Zhao X, Pu X, Zhou L, Han W, Xin B, Shi Z and Tian J (2021) Geochemical, Mineralogical, and Lithofacies Characterizations of Lacustrine Shale: A Case Study From the Cangdong Sag, Bohai Bay Basin, China. Front. Earth Sci. 9:755714. doi: 10.3389/feart.2021.755714
Received: 09 August 2021; Accepted: 02 September 2021;
Published: 18 November 2021.
Edited by:
Rui Liu, Southwest Petroleum University, ChinaReviewed by:
Yiquan Ma, Chengdu University of Technology, ChinaXiaoyan Chen, Northwest University, China
Copyright © 2021 Zhao, Pu, Zhou, Han, Xin, Shi and Tian. This is an open-access article distributed under the terms of the Creative Commons Attribution License (CC BY). The use, distribution or reproduction in other forums is permitted, provided the original author(s) and the copyright owner(s) are credited and that the original publication in this journal is cited, in accordance with accepted academic practice. No use, distribution or reproduction is permitted which does not comply with these terms.
*Correspondence: Bixiao Xin, WGluYngyMDE5QG91dGxvb2suY29t; Jinqiang Tian, dGlhbmpxQHVwYy5lZHUuY24=