 Guangtao Dong
 Ye Xie2
 Zhan Tian
- 1Shanghai Climate Center, Shanghai, China
- 2Shanghai Institute of Technology, Shanghai, China
- 3Shanghai Meteorological Disaster Prevention Technology Center, Shanghai, China
- 4School of Environmental Science and Engineering, Southern University of Science and Technology, Shenzhen, China
Based on the outputs of the global climate models (GCMs) HadGEM2-ES, NorESM1-M and MPI-ESM-LR from Coupled Model Intercomparison Project Phase 5 (CMIP5) and the downscaling results with the regional climate model (RCM) REMO, the ability of the climate models to reproduce the extreme precipitation in China during the current period (1986–2005) is evaluated. Then, the future extreme precipitation in the mid (2036–2065) and the late 21st century (2066–2095) is projected under the RCP8.5 scenario. The results show that the RCM simulations have great improvements compared with the GCMs, and the ensemble mean of the RCM results (ensR) outperforms each single RCM simulation. The annual precipitation of the RCM simulations is more consistent with the observation than that of the GCMs, with the overestimation of the peak precipitation reduced, and the ensR further reduces the bias. For the extreme precipitation, the RCM simulations significantly decrease the underestimation of intensity in the GCMs. The RCM simulations and the ensR can greatly improve the simulations of Rx5day and CWD compared with the GCMs, decreasing the wet bias in North China and Northwest China. In the future, the consecutive dry days (CDD) will decrease in the northern arid regions, especially in North China and Northeast China. However, the southern regions will experience longer dry period. Both the amount and the intensity of precipitation will increase in various regions of China. The number of wet days will decrease in the south and increase in the north area. The significantly greater Rx5day and R95t indicate more intensive extreme precipitation in the future, and the intensity in the late 21st century will be stronger than that in the middle. Attribution analysis indicates that the extreme precipitation indices especially the R95t have significant positive temporal and spatial correlations with the water vapor flux.
Introduction
More and more carbon has been released into the atmosphere with the global development, and it increases the greenhouse effect which leads to more extreme climate (Lashof and Ahuja, 1990; Matthews et al., 2009; Peters et al., 2013). The extreme precipitation is one of the most severe extreme climate disasters that damage the nature and society, and both its intensity and frequency demonstrate increasing trends (Donat et al., 2016; Qin et al., 2021). In order to effectively respond to the stronger extreme precipitation in the future, we need to understand its variation trend and explore the reasons for the changes. At present, climate models have been widely used to study the extreme precipitation change, including global climate model (GCM) and regional climate model (RCM) (Gao and Zhang, 2020, Gao et al., 2018, Huang et al., 2020).
GCMs play an important role in exploring the future changes of extreme precipitation on a global scale. Donat et al. (2016) found that the extreme precipitation in arid and humid regions shows evident increase in both the observation and the 26 GCMs. In addition, the extreme daily precipitation will continuously increase in the rest of this century according to the model projections. Based on 21 GCMs, Wang et al. (2020) found that an increase of 0.5°C in temperature will lead the extreme precipitation to double. Wu et al. (2020) applied 28 GCMs to study the changes of temperature and precipitation in Shanghai. They found that both the number of days and the intensity of heavy precipitation show increasing trends with less uncertainty. However, the GCMs used in the previous studies have low resolutions, which cannot accurately simulate the complex regional climates and cannot provide detailed spatio-temporal variation information of precipitation (Zhang and Wang, 2018). In comparison, high-resolution RCMs perform better than GCMs in simulating extreme precipitation and reduce the underestimation of extreme precipitation in the GCMs (Li et al., 2018; Liu et al., 2018).
RCMs have higher resolutions than GCMs and can contain detailed terrain, vegetation and other underlying surface information, so they can accurately demonstrate regional climate characteristics and have been widely used to study extreme precipitation changes (Xu and Xu, 2016, Yang et al., 2016, Zhang et al., 2020). At present, the RCM simulations under the framework of Coordinated Regional Climate Downscaling Experiment Phase II (CORDEX-II) have been widely used for climate projections, but single RCM driven by single GCM is used in most studies (Chen et al., 2018; Lu et al., 2019). Due to the uncertainty of a single RCM, evident differences exist among different models, which has a great adverse effect on the projection of future climate changes. In order to reduce the uncertainty, multi-GCMs-driven RCM simulations and ensemble methods are adopted to obtain more reliable projections of extreme precipitation changes (Yu et al., 2019; Zhou et al., 2019).
Under CORDEX East Asia Phase I framework, several researches have been conducted in terms of the simulation and projection of extreme precipitation of East Asia. Gu et al. (2018) applied four RCMs at 50 km resolution driven by one GCM and found that model ensemble performs better than a single RCM and the annual precipitation will increase in most region apart from Tibetan Plateau. Park and Min (2018) used five 50 km-resolution RCMs driven by one GCM and found that the increase of extreme precipitation in the future is due to the increase of moderate-heavy rainfall events. Under CORDEX East Asia Phase II framework, there are also several research related to the simulation of climate extremes over China. Chen and Gao (2019) found that precipitation will increase in the winter, but mixture of increasing and decreasing in the summer by using one RCM driven by one GCM. Yu et al. (2019) used three RCMs driven by ERA-interim Reanalysis data and find that RCMs can only well simulate the seasonal cycle of precipitation in the north area. Han et al. (2021) found that the extreme precipitation will be more in the east Asia and the consecutive dry days (CDD) will be enhanced in South China by using 15 setup of 50 km/25 km RCMs under CORDEX East Asia Phase I/II framework. Jiang et al. (2020) applied two 25 km resolution RCMs driven by one GCMs to project the extreme precipitation in the future warming climate and also found that annual precipitation and extreme precipitation intensity will increase in most areas. Wu et al. (2020) found that there will be more extreme precipitation in future under global warming of 1.5°C–4°C after applied four GCMs to drive 25 km-resolution RegCM4. While the projection of extreme precipitation through the whole 21st century by using multiple GCMs to drive one RCM under CORDEX East Asia Phase II framework are still insufficient.
Up to now, the CORDEX project has entered the second phase in East Asia. The specified simulation domain in East Asia has been reduced and the resolution of RCMs has been enhanced from 50 to 25 km. The RCMs’ ability to simulate extreme precipitation will be improved when the resolution is increased from 50 to 60 km to about 25 km (Shi et al., 2017; Bucchignani et al., 2018; Xu et al., 2018; Fu et al., 2021). However, there are still few works on the multi-GCMs dynamical downscaling ensemble projection of extreme precipitation in China under CORDEX East Asia Phase II framework. This research uses three GCMs from CMIP5 to drive the high resolution RCM of REMO to simulate and project the extreme precipitation in china. The simulation domain is consistent with the CORDEX East Asia II domain, and the resolution of the RCM is 25 km. Based on the evaluation of the RCMs’ performance in simulating the extreme precipitation during the historical period, the extreme precipitation in the entire 21st century is projected with a multi-GCMs dynamical downscaling ensemble under the RCP8.5 scenario, and the reasons for the extreme precipitation changes are also explored.
Data and Methods
Observational Data and Model Data
This research uses the CN05.1 dataset as the observational data (Wu and Gao, 2013). The CN05.1 dataset is a gridded dataset with a resolution of 0.25° × 0.25° interpolated from more than 2,400 stations in China. This dataset contains daily average, maximum and minimum temperature and precipitation in the period of 1961–2007. It has been widely used for model verification and evaluation (Yu et al., 2019).
The simulated precipitation data are from the GCMs HadGEM2-ES, NorESM1-M and MPI-ESM-LR and the regional model REMO driven by these GCMs. It includes the current period (1986–2005) and the future period (2036–2065 and 2066–2095) under the RCP8.5 scenario. All the RCMs are download from the website (https://esg-dn1.nsc.liu.se/projects/esgf-liu/).
The resolution for HadGEM2-ES, NorESM1-M and MPI-ESM-LR are respectively 1.875° × 1.25°, 1.8725° × 2.5° and 1.875° × 1.875°. These three CMIP5 GCMs are selected as these GCMs have better performance on climate simulation especially for the simulation of mean and extreme precipitation (Chen and Sun, 2015; Jiang et al., 2015). And the availability of 6-hourly datasets of GCMs is also exist in consideration.
The RCM REMO is developed on the basis of the numerical weather forecast model of German Climate Center. The resolution is 0.22° × 0.22° under the CORDEX-EA-II framework. The performance of REMO driven by reanalysis data in the simulation of large scale circulation over East Asia, the distribution of annual and seasonal precipitation climatology over China had been evaluated (Zhang et al., 2005; Xu et al., 2016; Xu et al., 2018; Remedio et al., 2019; Pang et al., 2021). It was found that REMO can reproduce the mean climatology of large scale circulation, annual and seasonal precipitation well, even though it has a wet bias for the most of China and dry bias for the Southern China in Summer. It give us confidence for the projection of mean and extreme precipitation in future warming climate by using REMO driven by CMIP5 GCMs.
To facilitate the comparison and the calculation, the RCM data are interpolated to the CN05.1 grid points. The study area is divided into eight sub-regions to analyze the models’ simulation capabilities (Hui et al., 2018a; Hui et al., 2018b; Jiang et al., 2020) including northwest (NW, 35°–45°N, 78°–99°E), Tibetan Plateau (TP, 28°–35°N, 80°–99°E), eastern northwest (ENW, 34°–42°N, 99°–110°E), southwest (SW, 24°–34°N, 99°–110°E), northeast (NE, 42°–52°N, 115°–132°E), north (N, 35°–42°N, 110°–122.5°E), southeast (SE, 27°–35°N, 110°–122.5°E) and south (S, 21°–27°N, 110°–120°E).
Analytical Methods
The simulation ability of each model is evaluated in the historical period (1986–2005) in eight regions of China by analyzing the average precipitation and the extreme indices. On the basis of the model evaluation, the future change of extreme precipitation under the RCP8.5 scenario is investigated with an ensemble mean of the RCMs, and the relationships between the future changes in the circulation indicators and the extreme indices are explored. The extreme indices are selected from the 27 indices defined by the Expert Team on Climate Change Detection and Indices (ETCCDI) (Sillmann et al., 2013). They have been widely used in evaluating the extreme climate change in China and have been proved to be effective by numerous studies (Li et al., 2018; Li et al., 2020; Wu et al., 2020). The introduction of the extreme indices can be seen in Table 1.
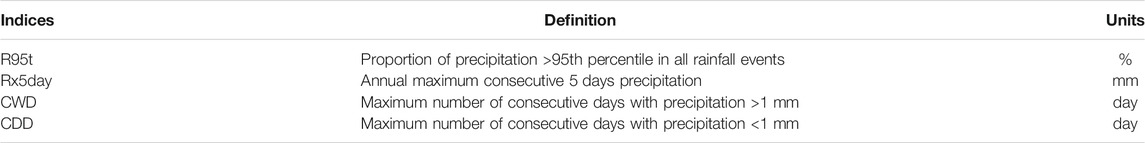
TABLE 1. Definitions of extreme precipitation indices.
In order to accurately assess the simulation capabilities of various climate models, The root mean square errors (RMSEs) between the model data and the observation data are calculated to accurately assess the models’ simulation capabilities. According to Gleckler et al. (2008), the simulation ability of a model relative to the average ability of several models is calculated as follows:
where
Results
Evaluation of Historical Simulation
Mean Climatology
In order to evaluate the models’ ability to reproduce the historical precipitation, the biases between the model and the observation during the historical period (1986–2005) for the annual, summer, and winter precipitation are shown in Figure 1. Figure 2 shows the RMSE’ of each model in each region.
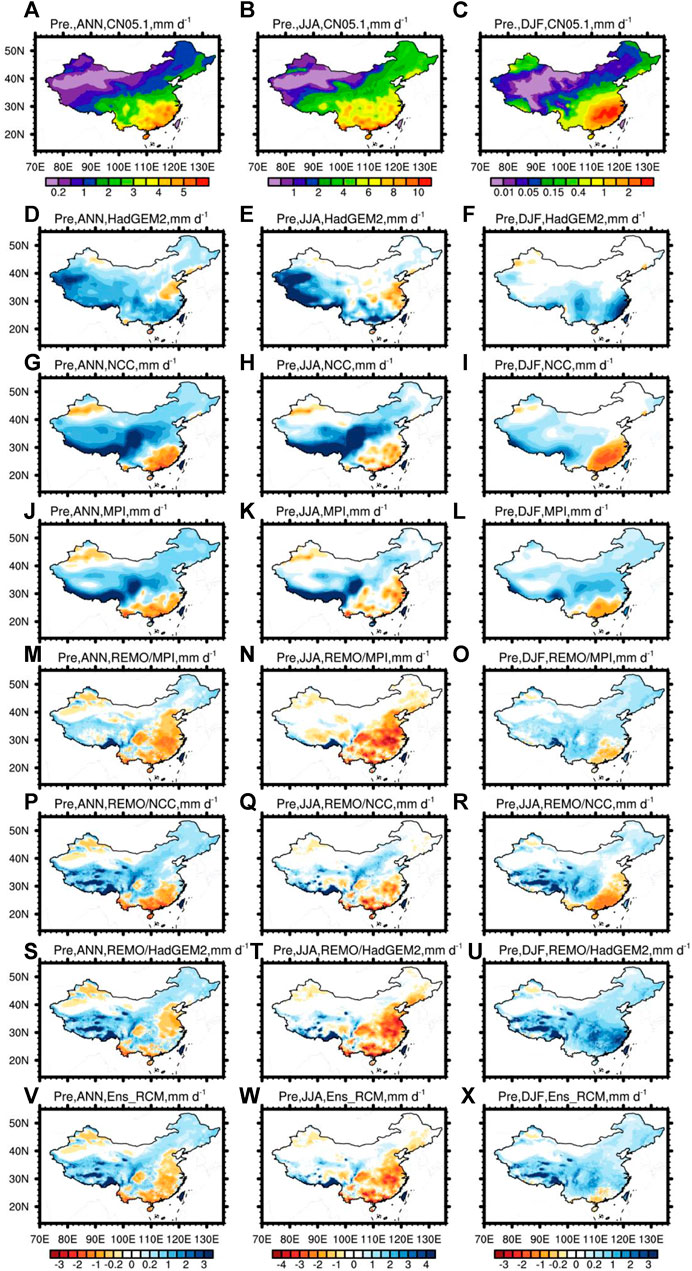
FIGURE 1. The spatial distributions of the observed annual average (A), summer (B) and winter (C) precipitation, the biases of the global climate model (GCM) simulations (D–L), the biases of the regional climate model (RCM) simulations (M–U) and the biases of the RCM ensemble (V–X).
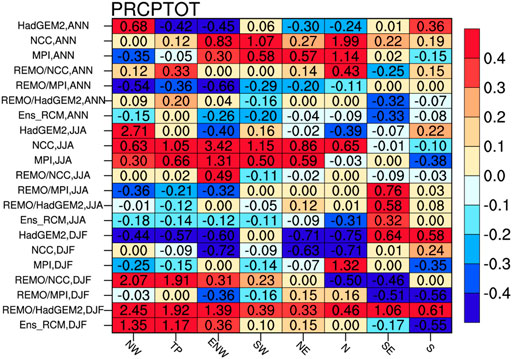
FIGURE 2. The relative root mean square error (RMSE’) of the annual (ANN), summer (JJA) and winter (DJF) precipitation in eight sub-regions from the GCMs, the RCM simulations and the RCM ensemble. Negative values indicate better performances.
The observed precipitation shows diverse distributions in China, with more precipitation in the southeast and less in the northwest. The annual precipitation is overestimated by the GCMs in most areas (Figures 1D–L). Specifically, NCC and MPI produce large positive biases in mid-western China and negative biases in the south and northwest areas. HadGEM2 overestimates the precipitation in most areas especially the northwest areas, and underestimation only exists in the southeast. The RMSE’ (Figure 2) indicates that the GCMs perform poorly in most regions. The first three rows of Figure 2 present the RMSE’ of the GCMs in each region. A negative value indicates that the RMSE is smaller than the median RMSE and the simulation effect is better than half of the models. A positive value indicates that the RMSE is larger than the median. The NCC model performs poorly in all the regions especially in the ENW, SW and N areas. MPI performs well in a few areas, and shows poor skill in the ENW, SW, NE and N areas. The regions with higher RMSE’ in NCC and MPI are consistent with the results in Figure 1. The simulation results of HadGEM2 are better than the other two GCMs. The biases in all the GCMs are reduced by the downscaling. The large wet biases in mid-western China in NCC and MPI are reduced, and the simulation in the regions with large RMSE’ is significantly improved by the dynamical downscaling, especially for MPI. However, the improvement of the downscaling is limited for HadGEM2 which performs relatively well. The ensemble mean collects the advantages of all the three RCM simulations, with good performance in all the sub-regions except the Tibet Plateau. The ensemble annual mean precipitation has smaller errors relative to the observation in each region.
In summer, the RMSE’ is high in all the three GCMs, especially MPI and NCC (Figure 2, rows 8–10). The GCMs generally simulate too much precipitation while the RCMs too less, especially in eastern and southern China. Great overestimations are produced by NCC and MPI in mid-western China, and by HadGEM2 in the northwest and the Tibet Plateau. After dynamical downscaling, the biases in the mid-western areas in NCC and MPI are reduced. However, the downscaling shows dry biases, which may be due to the underestimation of specific humidity and water vapor flux (Qin et al., 2021). In summer, the downscaling greatly decreases the RMSE’ in most regions, especially in the north. However, in the southern region with complex terrain and climate, the RCM does not show clear improvement. In winter, HadGEM2 performs well in most regions except southeastern and southern China. When the RCM driven by GCM, the bias partly come from the driving GCM, and partly come from the RCM itself. Take the simulation of winter precipitation from REMO/HadGEM2 as a example, the bias of the overestimation over South China maybe mainly come from HadGEM2-ES as the bias is quite small over this region when REMO driven by Reanalysis data (Xu et al., 2016), while over the edge of Tibetan Plateau, the overestimation of REMO/HadGEM2 is quite bigger than HadGEM2-ES, and the overestimation of REMO over this region also exist when it was driven by Reanalysis (Xu et al., 2016; Xu et al., 2018), possible because the underestimation of surface air temperature and thus leading to increasing the amount of atmospheric water vapor transported onto the TP (Xu et al., 2018). Both NCC and MPI have large negative biases in the southern region, which are reduced by the RCM. In terms of RMSE’, HadGEM2 with good performance is not obviously improved after downscaling. The large errors of NCC and MPI in southern and southeastern China are significantly corrected, with the RMSE’ notably reduced. The ensemble mean of the RCM simulations further reduces the biases in some regions in summer and winter, and the RMSE’ is also significantly decreased. However, the downscaling improvement is not evident for the GCMs with lower RMSE’.
Seasonal Cycle
Figure 3 shows the seasonal cycle of precipitation in each sub-region to evaluate the models’ ability in simulating the precipitation peak and variation characteristics. Table 2 shows the RMSE and the correlation coefficient between the simulated and the observed seasonal cycle. The observed precipitation peak occurs in July in most regions except the south and the southeast with the peak in June. The GCMs produce large biases of peak precipitation which can be found in all the regions. Specifically, HadGEM2 exhibits unobvious precipitation peak in the NW region, but produces significantly excessive precipitation from May to August. In some areas, the peak is clearly advanced or delayed by the GCMs. For example, the precipitation peak is advanced to May by NCC in the NW region and to June in the SW region. In the SW and S regions, the seasonal cycles in the GCMs are all unsatisfactory. The RCMs significantly improve the GCMs’ simulations with the precipitation peak value reduced, especially for HadGEM2 in the NW region and NCC in the ENW region. Table 2 shows that the RMSE in HadGEM2 is reduced from 1.357 to 0.352 mm/day in the NW region after downscaling, and that in NCC is reduced from 2.063 to 0.751 mm/day in the ENW region. The RCM simulations are more consistent with the observations than the GCMs in most regions. The RCM simulations partially correct the precipitation peak time in the GCMs. The precipitation peak in the SW region in NCC is corrected from June to July by the downscaling, but the improvement is limited. Table 2 shows that the RMSEs are reduced by the RCM in most sub-regions, but the improvement for the correlation is not evident.
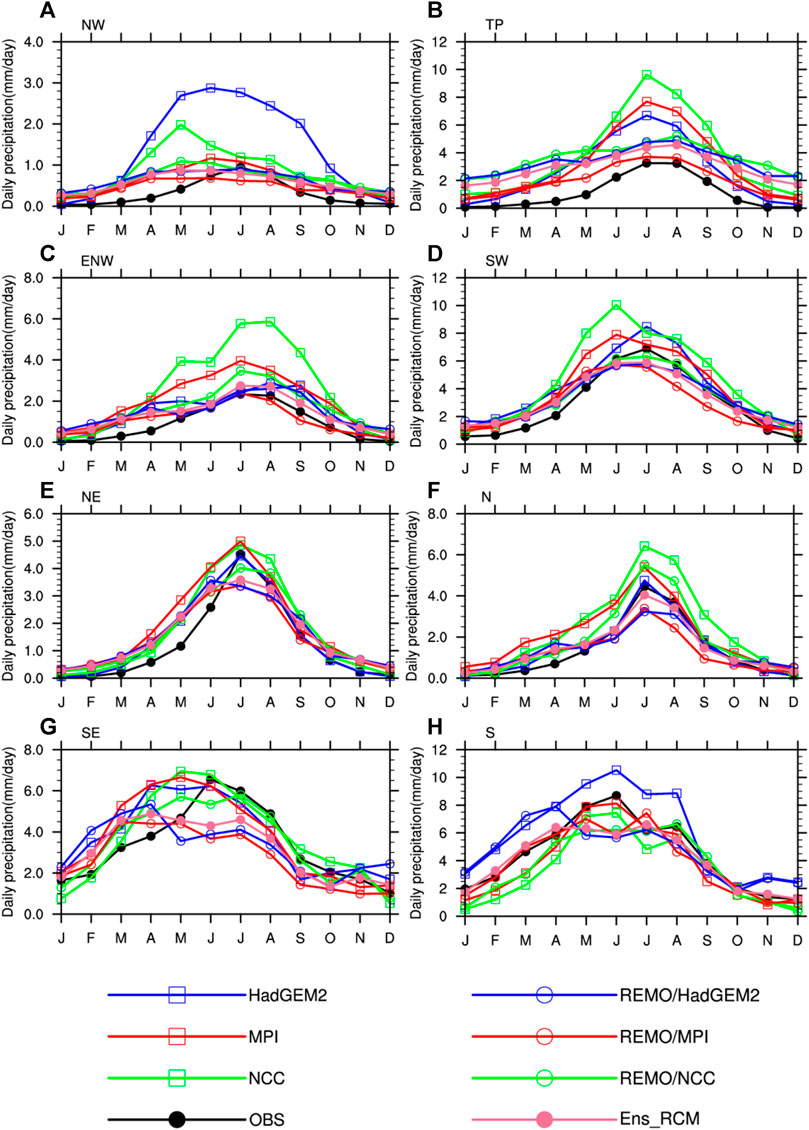
FIGURE 3. Monthly cycle of precipitation in the eight sub-regions from the simulations and the observations.
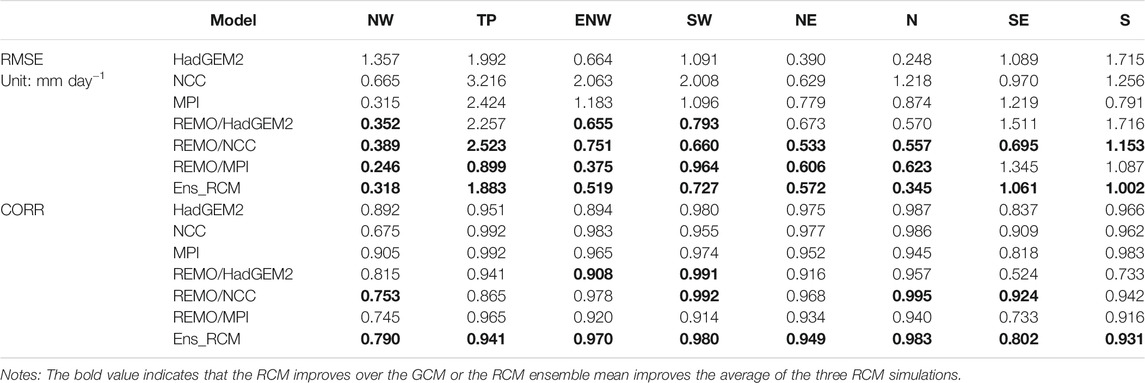
TABLE 2. The RMSEs and the correlation coefficients between the simulation and the observation for the seasonal cycle of precipitation in the eight sub-regions.
The ensemble mean of the RCM simulations not only reduces the overestimation of precipitation but also demonstrates the precipitation curve more consistent with the observation. The precipitation peak in the ensemble mean appears in July in the N region, with the value of 4 mm/day that is consistent with the observation. The ensemble mean also well captures the precipitation curve in other months and most sub-regions, indicating a significant improvement of the ensemble mean over the GCMs and the single RCM simulations. As shown in Table 2, the RCM ensemble mean performs better than at least one of the three RCMs in terms of both RMSE and correlation coefficient. Therefore, the RCM ensemble mean has an obvious improvement over the GCMs and the three RCM simulations.
Frequency of Precipitation Intensity
Figure 4 shows the frequencies of daily precipitation in different sub-regions. Generally, the frequency of light rain (1–5 mm day-1) is higher than 60% in the NW, TP, ENW sub-regions where have less heavy (20–50 mm day-1) and extreme precipitation (>50 mm day-1). More heavy and extreme precipitation are simulated in the east China like SE and S sub-regions. Obviously, there are some differences in the ability of the GCMs and RCMs to simulate precipitation. The RCM-simulated frequencies of precipitation are Closer to CN05.1 in the SE sub-region while GCM-simulated less extreme precipitation (>50 mm day-1) and more light rain. In the NW, TP, ENW, and SW, the RCMs simulate less light rain than observation and GCMs. In general, the RCM simulations produce more extreme precipitation than the GCMs. The better simulation of heavy precipitation by the RCMs may own to its higher resolution and better representation of cumulus process, while the RCM tend to overestimate the frequency of extreme precipitation in which daily intensity higher than 50 mm day-1 over most of sub-regions.
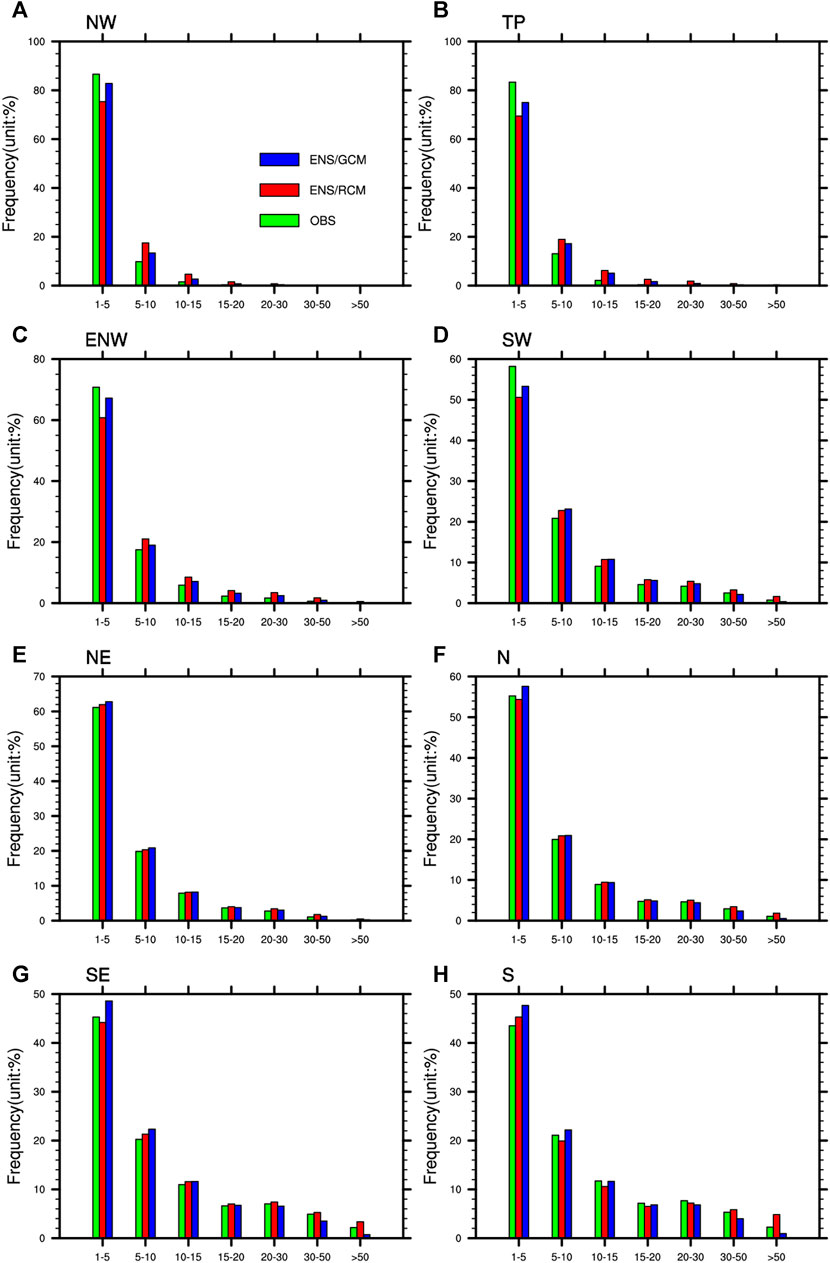
FIGURE 4. The frequencies of daily precipitation from the simulations and the observation in the eight sub-regions over China. The blue bar and the red bar represent the ensemble mean of GCMs and the RCMs simulations, respectively.
Extreme Indices
Figure 5 shows the observed spatial distributions of the extreme precipitation indices during 1986–2005 and the difference between each model and the observation. Figure 6 further illustrates the relative error of each model in the eight sub-regions. The observation shows that the indices of CWD, Rx5day and R95t exhibit a decreasing distribution from southeast to northwest, while the CDD on the contrary. This distribution is associated with the wetter condition in the southeast and it is consistent with the previous research (Xu et al., 2016). However, biases exist in each simulation. The GCMs underestimate most of the indices in the southeast and overestimate them in the northwest. Specifically, the Rx5day is significantly overestimated in the northern regions, while the CDD is underestimated in most regions, especially in NCC and MPI. R95t is well reproduced in most regions, but it is also underestimated in the southern areas. In general, the bias of R95t in the GCMs is relatively small.
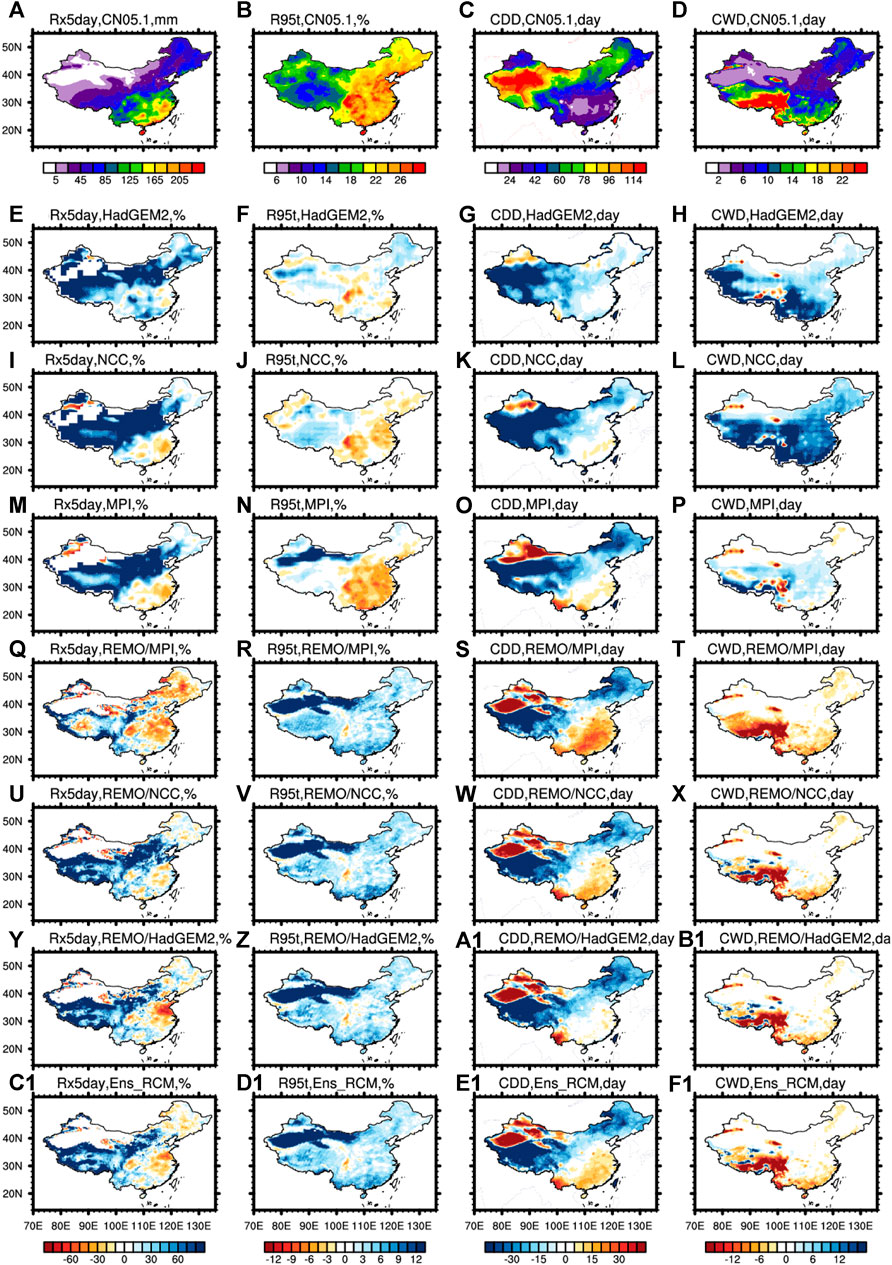
FIGURE 5. The spatial distribution of the extreme precipitation indices in the observation (A–D), and the deviation between each simulation and the observation. Rows 2–4 illustrate the deviation in the GCMs, rows 5–7 show the deviation in the RCM simulations, and row eight shows the deviation in the ensemble mean.
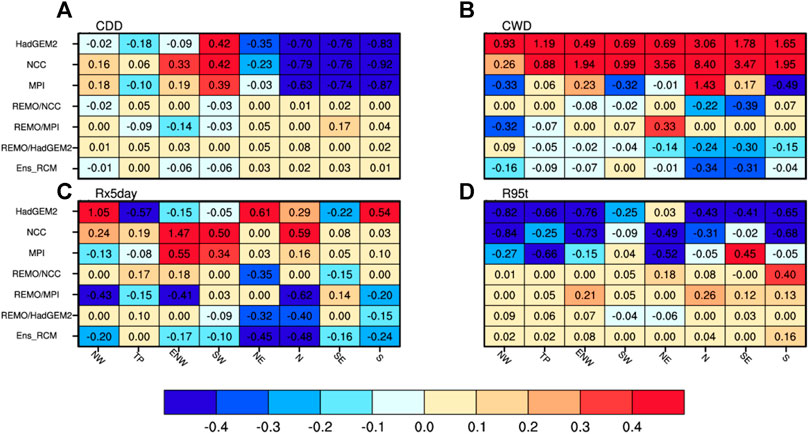
FIGURE 6. The RMSE’ of the extreme indices for the three GCMs, the three RCM simulations and the RCM ensemble mean in the eight sub-regions. The number with blue color indicates a relatively better model result.
In the RCM simulations, the CWD is significantly improved by REMO over HadGEM2 and NCC. The overestimation in the GCMs is evidently reduced by the downscaling across the country, but underestimation is produced over the Tibet Plateau. For the Rx5day, REMO greatly reduces the overestimation in the northern and western regions of China in MPI. However, the RCM shows unobvious improvement for the CDD and the R95t. The limited improvement of R95t in the RCM is due to the small error between the GCM and the observation. For the CDD, the RCM reduces the biases in the southwest region and also shows improvements in other regions.
The RMSE’ (Figure 6) indicates that the GCMs simulate the CDD well in N, SE, and S regions while perform poorly in SW. The R95t is well simulated by HadGEM2 and NCC in most sub-regions, while MPI underperforms in SE and SW regions, especially SE region. NCC and HadGEM2 show poor skill in simulating CWD in all the eight sub-regions, and NCC and MPI reproduce Rx5day unsatisfactorily in ENW and SW regions. The RCM simulations exhibit significant improvement over the GCMs in producing the extreme indices. For the Rx5day, the RMSE’ in MPI in the ENW area is reduced from 0.55 to −0.41 by the downscaling. This confirms the great improvement of the downscaling over the GCM. For the CDD and the R95t, the GCMs have low RMSE’ in most regions, especially for R95t. The downscaling has limited improvement even regression in the regions where the GCMs perform well, but the RMSE’ is generally low. GCMs and the RCM show quite different biases for R95t and CWD, possibly due to the enhancement of resolution and representation of physical process. Due to the relatively lower resolution and the defect for the representation of cumulus parameterization, the overestimation of rain days especially for the light rainfall days the underestimation of daily intensity are the common problems of CMIP5 GCMs (Jiang, et al., 2015; Chen and Sun, 2015). While the enhancement of RCMs especially for the RCM higher than 25 km might lead to opposite bias, i.e. the overestimation of daily intensity and underestimation of wet days (Shi et al., 2017; Jiang et al., 2020), thus leading to opposite bias of R95t and CWD with the driving GCMs. In the ensemble mean, a great improvement on the CWD is found compared with the single RCM simulations, especially in the north and the southeast. For the Rx5day, the ensemble performs well in all the regions, especially in Northeast China and northern China where the GCM results are greatly improved. In addition, the ensemble further improves the single RCM simulations in all the regions.
Projection of Future Climate
Mean Climatology
Figure 7 describes the changes in the annual precipitation, the wet days, and the daily precipitation intensity during 2036–2065 (2050s) and 2066–2095 (2080s) under the RCP8.5 scenario. The RCM ensemble demonstrates an increase of about 5% in the annual precipitation in each region during 2036–2065. The increase in the NW region reaches nearly 20%, with a consistent increase in all the simulations, indicating that the future increase in precipitation in the northwest region is highly reliable. The RCM ensemble shows slight change in summer precipitation relative to that in the historical period (1986–2005). This may be due to the complex climate in summer and the underestimation of water vapor flux by the RCM. The winter precipitation is projected to increase in all the regions, especially the N, NE, ENW, and NW regions where the increase gets above 20%. This indicates that there will be more precipitation in the future in winter, and the increase tendency is reliable. In a word, the precipitation will generally increase in the future, especially in winter. The annual number of wet days will be obviously reduced in the southern region in the ensemble, and all the models project fewer wet days in the SW region. In the northern region, the RCM ensemble mean projects an increase in the number of wet days, especially in the NW region. In summer, the number of wet days is projected to decrease by all the models, especially in the SW region. The number of winter wet days will generally decrease in the southern areas while increase in the northern areas. In terms of the annual precipitation intensity, all the models demonstrate a great increase of about 10%, especially in the SE and S regions. In summer, the change of daily rainfall intensity ranges between ±5% in different regions. The winter rainfall intensity shows a relatively large increase of above 40% over all the regions except the NE region in the HadGEM2 simulation. This indicates a high probability of precipitation intensification in various regions in the future.
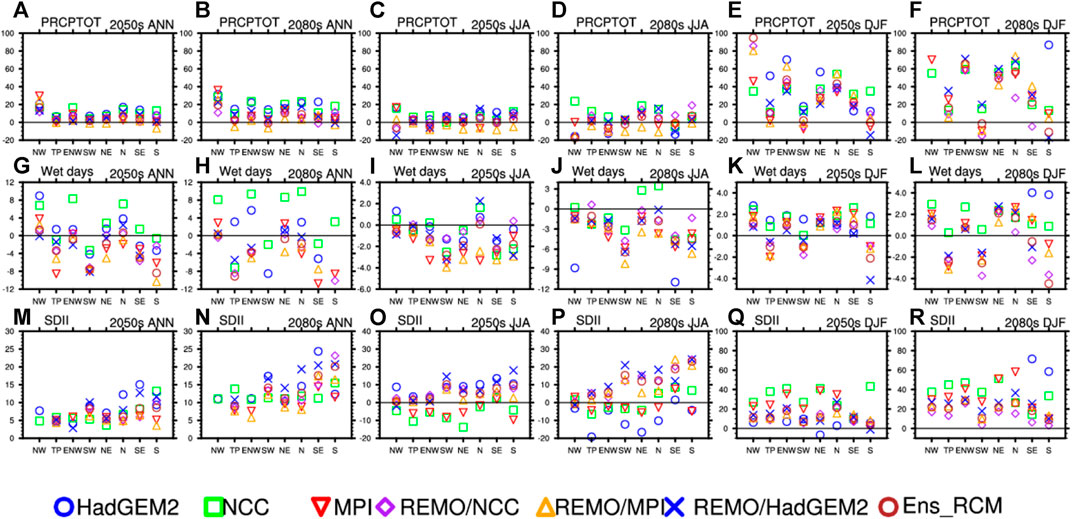
FIGURE 7. The future changes of annual (ANN), summer (JJA) and winter (DJF) precipitation, precipitation intensity and number of wet days in each model during 2036–2065 and 2066–2095.
During 2066–2095, the change and uncertainty in the precipitation is greater than that in the mid 21st century, especially in winter. The decrease of the number of wet days in southern China is more obvious in the late 21st century. The annual average precipitation intensity will generally increase, but the winter precipitation intensity will decrease compared with that in the mid 21st century. Over all, there will be more heavy precipitation in the late 21st century. The summer precipitation won’t change too much compared with that in the historical period, but the number of wet days will significantly decrease. The southern wet areas will experience more drought days, but the arid and semi-arid areas in the north will be more humid. In winter, the precipitation will increase obviously, with the precipitation in the 2080s more than that in the 2050s.
Frequency of Precipitation Intensity
The changes in frequencies of daily precipitation intensity in the eight sub-regions in the future period of 2066–2095 under the RCP8.5 scenario are shown in Figure 8. We can see that there will be less light rain (1–5 mm day-1) in the future, GCMs in all sub-regions will decrease for about 3% while RCMs decrease less than GCMs. The rain intensity greater than 50 mm day-1 will increase and RCMs increases more than GCMs. RCMs and GCMs all predict increasing trend of extreme precipitation which means the result of more extreme precipitation in the future is reliable. But in the NW and TP sub-regions, the increase for rain intensity greater than 50 mm day-1 is relatively less than other regions.
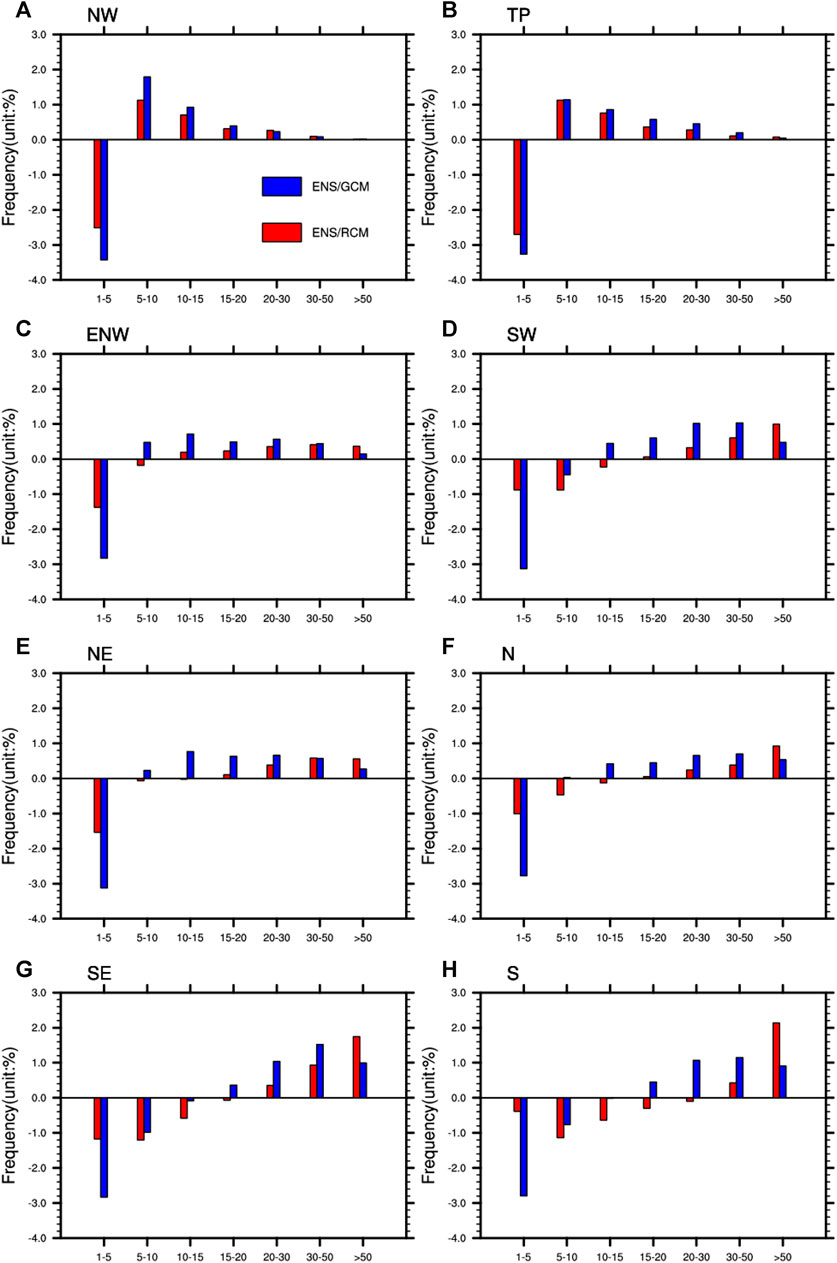
FIGURE 8. Changes in frequencies of daily precipitation in the eight sub-regions under the RCP8.5 scenario in the historical period and the future period of 2066–2095. The blue bar and the red bar represent the ensemble mean of GCMs and the RCMs simulations, respectively.
Extreme Indices
Figure 9 demonstrate the future changes in the extreme indices. The RCM ensemble mean shows that the Rx5day will increase in most sub-regions except the eastern northwest. While GCMs are showing a growth trend in all regions. This is consistent with the increase of precipitation in the future and indicates that the future precipitation will be stronger. The R95t will increase in all sub-regions Whether it is GCMs or RCMs. Spatially, the increase of R95t weakens gradually from the southeast to the northwest. The CWD predicted by RCMs showed a decrease in almost all regions. GCMs are predicted to increase in most regions except in the TP and part of the SW. It may be caused by the excessive wet days simulated by GCMs. The CDD will increase in the south while decrease in the north, which is in accordance with the projection of increasing precipitation in the north in the future. However, there will be longer CDD in the RCM simulation than GCMs. Generally speaking, under the background of increasing precipitation in the future, the wet extreme indices will increase in most regions except a few areas and different extreme indices demonstrate different change patterns.
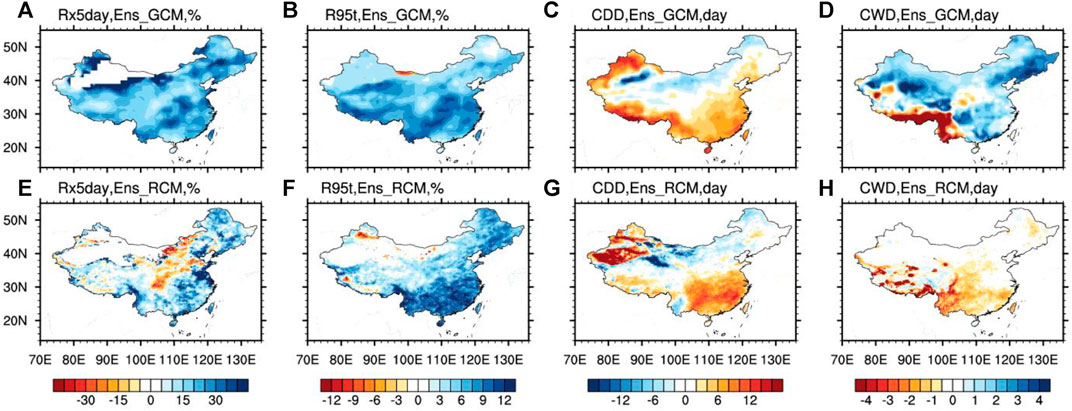
FIGURE 9. Changes in the extreme indices in the future period of 2066–2095 (2080s) relative to the historical period.
Figure 10 describes the regional average changes of the extreme indices in the future. The ensemble mean Rx5day and R95t generally increase throughout the country. Both GCMs and RCMs have this trend. For Rx5day, the growth at the late 21st century is greater than that in the middle of the 21st century. Except for the ENW region, where the ensemble mean of RCMs show a decreasing trend, the rest of the region, the ensemble mean of GCMs and the RCMs all show an increasing tendency. The R95t will increase in all the regions in the mid 21st century, It indicates that there will be more rainstorms in the future, especially in the south China, and R95t gets even larger in the late 21st century. The CDD increases obviously in southern China and decreases in the northern China in the mid 21st century and GCMs decrease more than RCMs. In the late 21st century, the drop of CDD will weaken in the northern regions while strengthen in the southern regions. The CWD decreases in most regions in the mid 21st century, but in the late 21st century, GCMs show an increasing trend in most sub-regions. In general, the drought in the northern regions will be alleviated with the increasing precipitation, and extreme precipitation will increase in various regions.
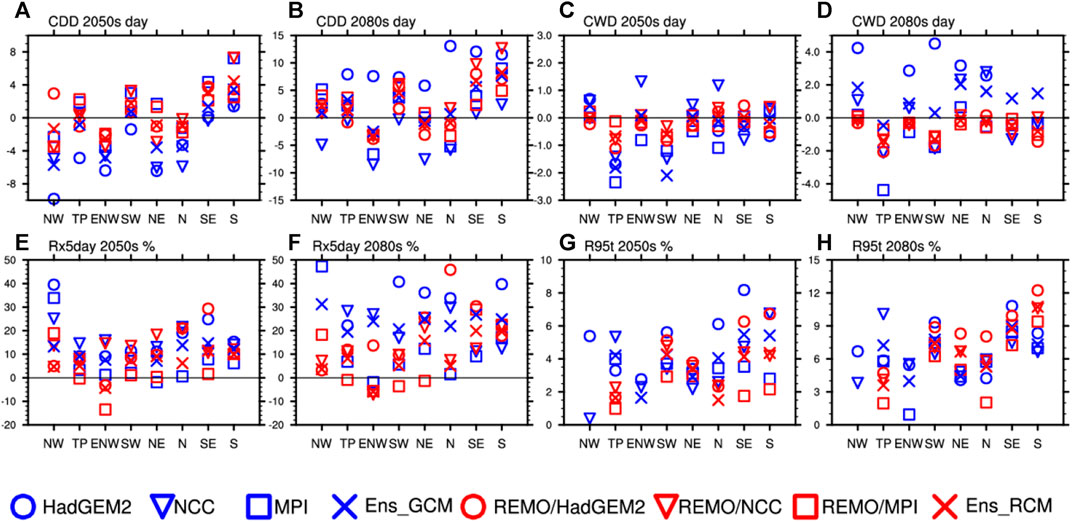
FIGURE 10. The changes in the extreme indices in the mid 21st century (2036–2065, 2050s) and the late 21st century (2066–2095, 2080s) relative to the historical period in the eight sub-regions.
The water vapor flux and the water vapor flux divergence are analyzed to investigate the factors affecting the precipitation changes (Figure 11). Under the RCP8.5 scenario, the atmospheric water content will be higher during 2066–2095 than that in the historical period. The increase of water vapor flux is more obvious in the northeast areas and some southern coastal areas. This pattern is found in all the three simulations, which is consistent with the pattern of precipitation growth in the future. Meanwhile, the water vapor flux divergence is negative in the northwestern region, which indicates the accumulation of water vapor and thus more rain. This is consistent with the conclusion that the western region will be wetter, with the drought alleviated.
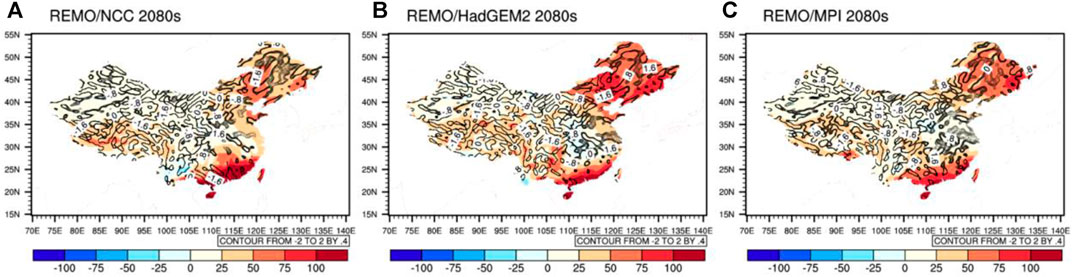
FIGURE 11. The changes in the water vapor flux and the water vapor flux divergence at 850 hPa in the future period of 2066–2095 relative to the historical period from the downscaling simulations driven by different GCMs.
Figure 12 illustrates the scatter plots of the extreme precipitation indices against the circulation elements as well as the linear regressions. The correlation coefficients passing the 0.05 significance test are asterisked. The extreme indices are highly sensitive to the annual precipitation, especially the Rx5day, with the correlation coefficients in all the simulations passing the significance test (Figure 12A). This reveals that the change of extreme precipitation in the future is highly related to the precipitation amount. Most indices are highly correlated with the water vapor flux, and the R95t has the highest correlation that passes the significance test in all the three RCM simulations (Figure 12F). This indicates that the change of water vapor will obviously affect the change of precipitation, especially the extreme precipitation. However, the correlations between the extreme indices and the wind are not significant.
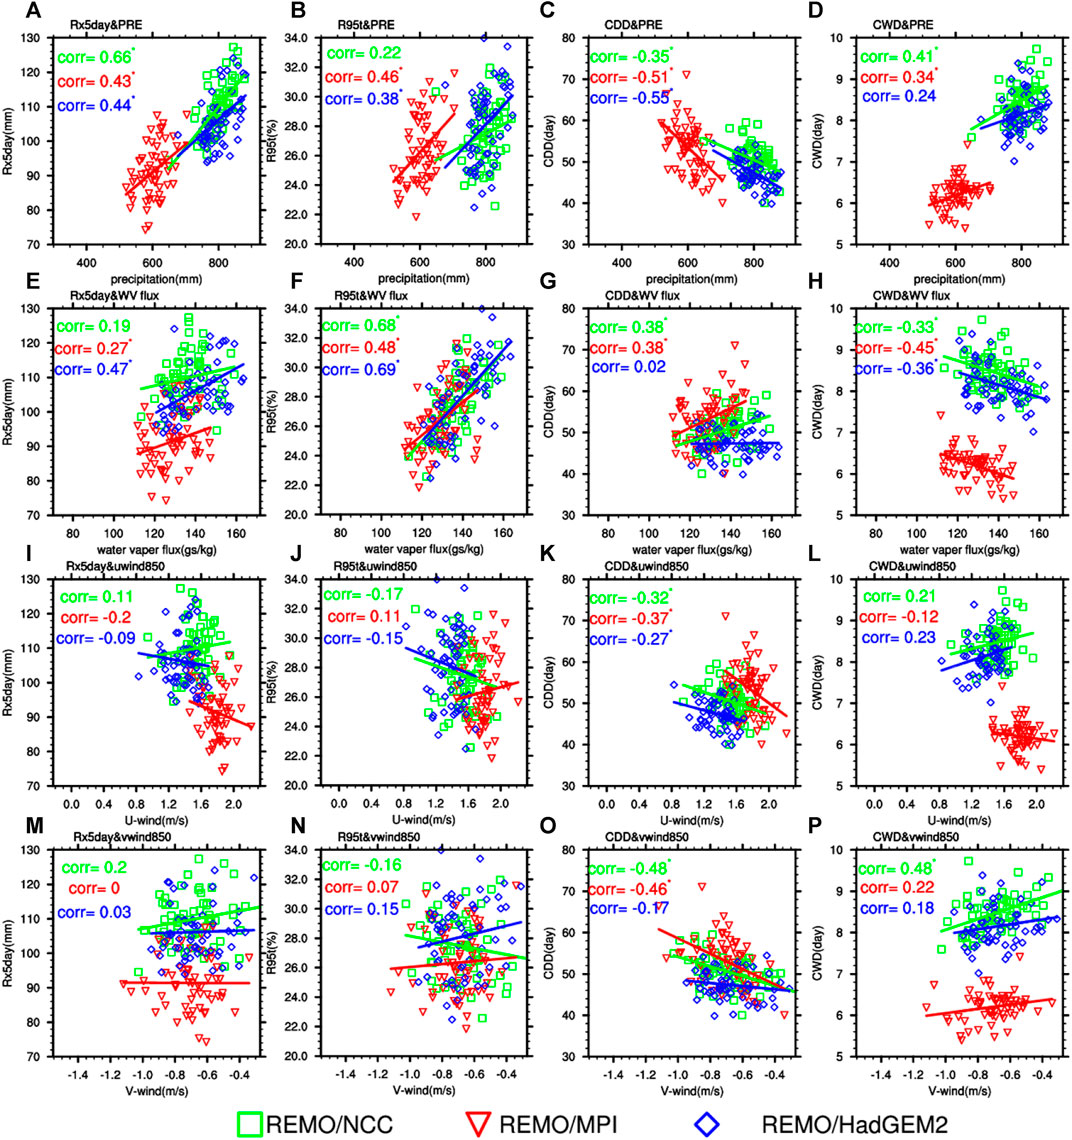
FIGURE 12. Scatter plots of the extreme precipitation indices against the annual precipitation, the water vapor flux and the wind accompanied with the linear regressions. The correlation coefficients passing the 0.05 significance test are asterisked.
Figure 12 shows that the future changes of extreme indices are closely related to the annual precipitation and the water vapor flux by calculating the temporal regression correlation. In order to explore the spatial characteristic of the climate change in China, it is necessary to study the spatial correlations between the extreme indices and the circulation factors. The correlation coefficients between the changes in the extreme indices and the changes in the water vapor flux, the zonal wind and the meridional wind during 2066–2095 relative to the historical period are presented in Table 3. The values in bold pass the 0.01 significant test. The results show that the change of R95t is closely related to the change of the circulation factors especially the water vapor flux, with the correlations all passing the 0.01 significance test. The change of Rx5day is negatively correlated with the change of meridional wind and the correlations are significant. In general, there are high correlations between the changes in the extreme indices and the changes in the circulation factors, especially the R95t. It indicates that the future climate change will be profoundly affected by the circulation, and the spatial distribution of the future changes in China is credible.
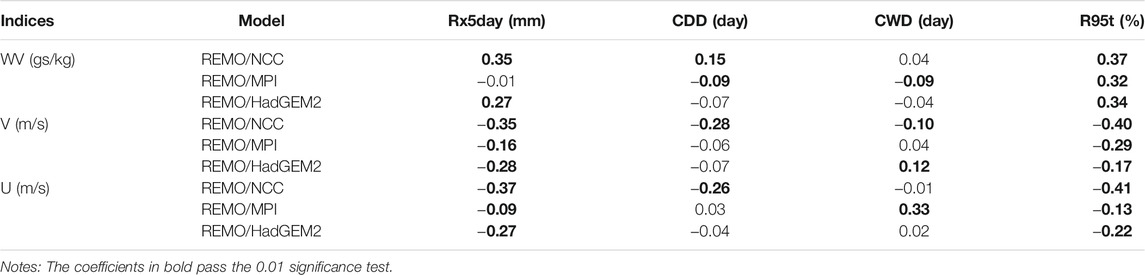
TABLE 3. Correlation coefficients between the changes in the extreme indices and the changes in the water vapor flux and the wind from the three downscaling simulations.
Conclusion and Discussion
Based on the downscaling with the RCM of REMO driven by the GCMs of HadGEM2-ES, NorESM1-M and MPI-ESM-LR under the CORDEX-EA-II framework, the extreme precipitation change in China in the mid and the late 21st century is projected under the RCP8.5 scenario. First, the simulations of different models are evaluated during 1986–2005. Then, the extreme precipitation in the mid (2035–2066) and the late (2066–2095) 21st century is analyzed. Finally, the relationship between the extreme precipitation indices and the circulation factors are investigated.
The results show that the high resolution RCM can significantly improve the GCM simulations. The RCM simulations reduce the RMSE’ of precipitation and the overestimation of precipitation peak in summer in the GCMs. However, the improvement of the RCM is limited in the areas with small errors. The annual precipitation in the RCM ensemble has smaller errors than the summer and winter precipitation in all the eight sub-regions. Thus, it can be concluded that the RCM ensemble can integrate the improvement of each single RCM over the GCMs and better reproduce the spatial distribution characteristics of the annual precipitation. For the extreme precipitation, the RCM evidently improves the GCM simulations. Regarding the extreme precipitation indices, the RCM simulations exhibit great improvements for the Rx5day and the CWD by significantly reducing the errors. The improvement for the Rx5day is mainly demonstrated in the northern and the northeastern regions, and the positive bias of CWD is reduced in most areas in China. For the R95t and the CDD, the improvements of RCM are limited due to the good performance of the GCMs.
There will be more precipitation in China in the future, and the drought in the northern regions will be alleviated, especially in the ENW and the N sub-regions. There will be more dry days and less wet days in the southern regions, especially in the SE and the SW sub-regions. However, extreme precipitation events would be more frequent in the future over various regions, which is mainly featured by the significant increase of Rx5day and R95t. With the decrease of rainy days and the increase of precipitation intensity, the southern regions will experience more frequent rainstorm disasters in the future. The attribution analyses reveal that the increasing water vapor flux will result in the increase of future precipitation extremes, and the accumulated water vapor leads to the drought relief in the northern regions. Most of the extreme indices are well correlated with the circulation factors. In particular, the R95t has significantly positive spatial-temporal correlations with the water vapor flux and negative spatial correlations with the wind.
Since multiple GCMs are used to drive the high resolution RCM and the RCM ensemble is adopted to project the future extreme precipitation in this study, the projection results are more reliable with smaller uncertainty. However, there is still much room for improvement. First, we use the CN05.1 grid data whose accuracy is affected by the number of observational stations in each region, so the bias can be large where the observation stations are sparse. The observation will be more reliable if different observational datasets are employed. Second, the resolution of the RCM used in this study is 25 km, but a higher resolution is required, such as convection-permitting scale, i.e. resolution higher than 4 km, to project the future extreme precipitation more accurately. Third, the ensemble of multiple GCMs dynamical downscaling is applied to reduce the uncertainty in the future climate projection. However, the uncertainty reduction is limited since only three GCMs are used for the ensemble projection, and more GCMs dynamical downscaling as well as more RCMs are needed for the future study. Fourth, the coupling of regional atmosphere model with an ocean model is needed to resolve the air-sea coupling process and to better reproduce the East Asia climate and thus enhance the confidence of future climate change (Zou et al., 2016; Zou and Zhou, 2016; Zou and Zhou, 2017). Finally, the future extreme precipitation is projected only under the RCP8.5 scenario without the other scenarios considered, resulting in an incomprehensive presentation of the future extreme precipitation change. Therefore, more scenarios should be contained in the future work.
Data Availability Statement
The original contributions presented in the study are included in the article/supplementary material, further inquiries can be directed to the corresponding authors.
Author Contributions
Conceptualization, GD, ZT; Data curation, GD, YX; Formal analysis, GD, YX, YW; Methodology, GD, ZT, YW; Writing–original draft, GD, YX; Writing–review and editing, GD, DF, ZT.
Funding
The authors would like to thank the sponsors of this work: the National Key R&D Program of China (Grant No. 2019YFE0124800), National Natural Science Foundation of China (51761135024 and 41730959), the High-level Special Funding of the Southern University of Science and Technology (Grant Nos. G02296302, G02296402), the Social Development Projects of STCSM (19DZ1201402, 19DZ1201500 and 20DZ1200401) and Natural Science Foundation of Shanghai (21ZR1457600).
Conflict of Interest
The authors declare that the research was conducted in the absence of any commercial or financial relationships that could be construed as a potential conflict of interest.
Publisher’s Note
All claims expressed in this article are solely those of the authors and do not necessarily represent those of their affiliated organizations, or those of the publisher, the editors and the reviewers. Any product that may be evaluated in this article, or claim that may be made by its manufacturer, is not guaranteed or endorsed by the publisher.
Acknowledgments
We thank Dr. Jia Wu from NCC of CMA and Dr. Xuejie Gao from Institute of Atmospheric Physics of Chinese Academy of Sciences for providing the CN05.1 gridded dataset. We also thank the CORDEX-East Asia project team for providing their model simulation datasets (downloadable from https://esg-dn1.nsc.liu.se/projects/esgf-liu/).
References
Bucchignani, E., Mercogliano, P., Panitz, H.-J., and Montesarchio, M. (2018). Climate Change Projections for the Middle East-North Africa Domain with COSMO-CLM at Different Spatial Resolutions. Adv. Clim. Change Res. 9 (1), 66–80. doi:10.1016/j.accre.2018.01.004
Chen, H., and Sun, J. (2015). Assessing Model Performance of Climate Extremes in China: an Intercomparison between CMIP5 and CMIP3. Climatic Change 129 (1-2), 197–211. doi:10.1007/s10584-014-1319-5
Chen, L., Ma, Z., Li, Z., Wu, L., Flemke, J., and Li, Y. (2018). Dynamical Downscaling of Temperature and Precipitation Extremes in China under Current and Future Climates. Atmosphere-Ocean 56 (1), 55–70. doi:10.1080/07055900.2017.1422691
Chen, N., and Gao, X. (2019). Climate Change in the Twenty-First Century Over China: Projections by an RCM and the Driving GCM. Atmos. Oceanic Sci. Lett. 12 (4), 270–277. doi:10.1080/16742834.2019.1612695
Donat, M. G., Lowry, A. L., Alexander, L. V., O’Gorman, P. A., and Maher, N. (2016). More Extreme Precipitation in the World's Dry and Wet Regions. Nat. Clim Change 6 (5), 508–513. doi:10.1038/nclimate2941
Fu, Y.-H., Gao, X.-J., Zhu, Y.-M., and Guo, D. (2021). Climate Change Projection Over the Tibetan Plateau Based on a Set of RCM Simulations. Adv. Clim. Change Res. 12, 313–321. doi:10.1016/j.accre.2021.01.004
Gao, X., and Zhang, D. (2020). Climate Change of the 21st Century Over China from the Ensemble of RegCM4 Simulations. Chin. Sci. Bull. 65 (23), 2516–2526. doi:10.1360/TB-2020-0231
Gao, Y., Xiao, L., Chen, D., Xu, J., and Zhang, H. (2018). Comparison between Past and Future Extreme Precipitations Simulated by Global and Regional Climate Models Over the Tibetan Plateau. Int. J. Climatol 38 (3), 1285–1297. doi:10.1002/joc.5243
Gleckler, P. J., Taylor, K. E., and Doutriaux, C. (2008). Performance Metrics for Climate Models. J. Geophys. Res. 113, D06104. doi:10.1029/2007JD008972
Gu, H., Yu, Z., Yang, C., Ju, Q., Yang, T., and Zhang, D. (2018). High-Resolution Ensemble Projections and Uncertainty Assessment of Regional Climate Change over China in CORDEX East Asia. Hydrol. Earth Syst. Sci. 22 (5), 3087–3103. doi:10.5194/hess-22-3087-2018
Han, Z., Gao, X., and Xu, Y. (2021). Mean and Extreme Precipitation Projection Over Land Area of East Asia Based on Multiple Regional Climate Models. Chin. J. Geophys. 64 (6), 1869–1884. doi:10.6038/cjg2021O0103
Hui, P., Tang, J., Wang, S., Niu, X., Zong, P., and Dong, X. (2018a). Climate Change Projections Over China Using Regional Climate Models Forced by Two CMIP5 Global Models. Part I: Evaluation of Historical Simulations. Int. J. Climato. 38, e57–e77. doi:10.1002/joc.5351
Hui, P., Tang, J., Wang, S., Niu, X., Zong, P., and Dong, X. (2018b). Climate Change Projections Over China Using Regional Climate Models Forced by Two CMIP5 Global Models. Part II: Projections of Future Climate. Int. J. Climato. 38, e78–e94. doi:10.1002/joc.5409
Huang, Y., Xiao, W., Hou, G., Yi, L., Li, Y., and Zhou, Y. (2020). Changes in Seasonal and Diurnal Precipitation Types during Summer over the Upper Reaches of the Yangtze River Basin in the Middle Twenty-First century (2020–2050) as Projected by RegCM4 Forced by Two CMIP5 Global Climate Models. Theor. Appl. Climatology 142 (3-4), 1055–1070. doi:10.1007/s00704-020-03364-4
Jiang, Z., Li, W., Xu, J., and Li, L. (2015). Extreme Precipitation Indices Over China in CMIP5 Models. Part I: Model Evaluation. J. Clim. 28 (21), 8603–8619. doi:10.1175/JCLI-D-15-0099.1
Jiang, Z., Tian, Z., Dong, G., Sun, L., Zhang, P., Buonomo, E., et al. (2020). High-Resolution Projections of Mean and Extreme Precipitation Over China by Two Regional Climate Models. J. Meteorol. Res. 34 (5), 965–985. doi:10.1007/s13351-020-9208-5
Li, L., Xiao, Z., Luo, S., and Yang, A. (2020). Projected Changes in Precipitation Extremes Over Shaanxi Province, China, in the 21st Century. Adv. Meteorol. 2020, 1–13. doi:10.1155/2020/1808404
Lashof, D. A., and Ahuja, D. R. (1990). Relative Contributions of Greenhouse Gas Emissions to Global Warming. Nature 344 (6266), 529–531. doi:10.1038/344529a0
Li, W., Jiang, Z., Zhang, X., Li, L., and Sun, Y. (2018). Additional Risk in Extreme Precipitation in China from 1.5 °C to 2.0 °C Global Warming Levels. Sci. Bull. 63 (4), 228–234. doi:10.1016/j.scib.2017.12.021
Liu, P., Qiu, X., Yang, Y., Ma, Y., and Jin, S. (2018). Assessment of the Performance of Three Dynamical Climate Downscaling Methods Using Different Land Surface Information over China. Atmosphere 9 (3), 101. doi:10.3390/atmos9030101
Lu, C., Huang, G., and Wang, X. (2019). Projected Changes in Temperature, Precipitation, and Their Extremes over China through the RegCM. Clim. Dyn. 53 (9-10), 5859–5880. doi:10.1007/s00382-019-04899-7
Matthews, H. D., Gillett, N. P., Stott, P. A., and Zickfeld, K. (2009). The Proportionality of Global Warming to Cumulative Carbon Emissions. Nature 459 (7248), 829–832. doi:10.1038/nature08047
Pang, G., Wang, X., Chen, D., Yang, M., and Liu, L. (2021). Evaluation of a Climate Simulation Over the Yellow River Basin Based on a Regional Climate Model (REMO) within the CORDEX. Atmos. Res. 254, 105522. doi:10.1016/j.atmosres.2021.105522
Park, C., and Min, S. K. (2018). Multi-RCM Near-Term Projections of Summer Climate Extremes over East Asia. Clim. Dyn. 52 (7-8), 4937–4952. doi:10.1007/s00382-018-4425-7
Peters, G. P., Andrew, R. M., Boden, T., Canadell, J. G., Ciais, P., Le Quéré, C., et al. (2013). The Challenge to Keep Global Warming below 2 °C. Nat. Clim Change 3 (1), 4–6. doi:10.1038/nclimate1783
Qin, P., Xie, Z., Zou, J., Liu, S., and Chen, S. (2021). Future Precipitation Extremes in China under Climate Change and Their Physical Quantification Based on a Regional Climate Model and CMIP5 Model Simulations. Adv. Atmos. Sci. 38, 460–479. doi:10.1007/s00376-020-0141-4
Remedio, A. R., Teichmann, C., Buntemeyer, L., Sieck, K., Weber, T., Rechid, D., et al. (2019). Evaluation of New CORDEX Simulations Using an Updated Köppen–Trewartha Climate Classification. Atmosphere 10 (11), 726. doi:10.3390/atmos10110726
Shi, Y., Wang, G., and Gao, X. (2017). Role of Resolution in Regional Climate Change Projections over China. Clim. Dyn. 51 (5-6), 2375–2396. doi:10.1007/s00382-017-4018-x
Sillmann, J., Kharin, V. V., Zhang, X., Zwiers, F. W., and Bronaugh, D. (2013). Climate Extremes Indices in the CMIP5 Multimodel Ensemble: Part 1. Model Evaluation in the Present Climate. J. Geophys. Res.: Atmospheres 118 (4), 1716–1733. doi:10.1002/jgrd.50203
Wang, G., Zhang, Q., Yu, H., Shen, Z., and Sun, P. (2020). Double Increase in Precipitation Extremes across China in a 1.5 °C/2.0 °C Warmer Climate. Sci. Total Environ. 746, 140807. doi:10.1016/j.scitotenv.2020.140807
Wu, J., and Gao, X. J. (2013). A Gridded Daily Observation Dataset Over China Region and Comparison with the Other Datasets. Chin. J. Geophys. 56, 1102–1111. (in Chinese). doi:10.6038/cjg20130406
Wu, J., Han, Z., Xu, Y., Zhou, B., and Gao, X. (2020). Changes in Extreme Climate Events in China under 1.5 °C–4 °C Global Warming Targets: Projections Using an Ensemble of Regional Climate Model Simulations. J. Geophys. Res. Atmospheres 125 (2), e2019JD031057. doi:10.1029/2019jd031057
Xu, J., Koldunov, N., Remedio, A. R. C., Sein, D. V., Zhi, X., Jiang, X., et al. (2018). On the Role of Horizontal Resolution Over the Tibetan Plateau in the REMO Regional Climate Model. Clim. Dyn. 51 (11-12), 4525–4542. doi:10.1007/s00382-018-4085-7
Xu, J., and Xu, M. (2016). The Assessment of Surface Air Temperature and Precipitation Simulated by Regional Climate Model REMO Over China. Clim. Change Res. 12 (4), 286. (in Chinese). doi:10.12006/j.issn.1673-1719.2015.194
Xu, J., Zhang, M., Jiang, X., Remedio, C., Sein, A. V., Koldunov, N., et al. (2016). The Assessment of Surface Air Temperature and Precipitation Simulated by Regional Climate Model REMO Over China. Clim. Change Res. 12 (04), 286–293. (in Chinese). doi:10.12006/j.issn.1673-1719.2015.194
Yang, H., Jiang, Z., and Li, L. (2016). Biases and Improvements in Three Dynamical Downscaling Climate Simulations over China. Clim. Dyn. 47 (9-10), 3235–3251. doi:10.1007/s00382-016-3023-9
Yu, K., Hui, P., Zhou, W., and Tang, J. (2019). Evaluation of Multi‐RCM High‐Resolution Hindcast Over the CORDEX East Asia Phase II Region: Mean, Annual Cycle and Interannual Variations. Int. J. Climatol 40 (4), 2134–2152. doi:10.1002/joc.6323
Zhang, L., and Wang, C. (2018). A Review of Future Climate Change Based on Regional Climate Models. Planteau Meteorology 37 (05), 1440–1448. (in Chinese). doi:10.7522/j.issn.1000-0534.2018.00018
Zhang, L., Xu, Y., Meng, C., Li, X., Liu, H., and Wang, C. (2020). Comparison of Statistical and Dynamic Downscaling Techniques in Generating High-Resolution Temperatures in China from CMIP5 GCMs. J. Appl. Meteorology Climatology 59 (2), 207–235. doi:10.1175/jamc-d-19-0048.1
Zhang, Y., Gao, H., and Lammel, G. (2005). Simulation of Monsoon Seasonal Variation of Rehional Climate Model REMO in East Asia. Clim. Environ. Res. 10 (01), 41–55. (in Chinese). doi:10.3878/j.issn.1006-9585.2005.01.04
Zhou, B., Wu, J., Xu, Y., Han, Z., and Shi, Y. (2019). Projected Changes in Autumn Rainfall Over West China: Results from an Ensemble of Dynamical Downscaling Simulations. Int. J. Climatol 39 (12), 4869–4882. doi:10.1002/joc.6115
Zou, L., and Zhou, T. (2017). Dynamical Downscaling of East Asian winter Monsoon Changes with a Regional Ocean–Atmosphere Coupled Model. Q. J. R. Meteorol. Soc. 143 (706), 2245–2259. doi:10.1002/qj.3082
Zou, L., and Zhou, T. (2016). Future Summer Precipitation Changes Over CORDEX‐East Asia Domain Downscaled by a Regional Ocean‐Atmosphere Coupled Model: A Comparison to the Stand‐Alone RCM. J. Geophys. Res. Atmospheres 121 (6), 2691–2704. doi:10.1002/2015JD024519
Keywords: precipitation extremes, regional climate model, dynamical downscaling, ensemble projection, different GCMs, CORDEX-EA-II
Citation: Dong G, Xie Y, Wang Y, Fan D and Tian Z (2021) Ensemble Projection of Extreme Precipitation Over China Based on Three Dynamical Downscaling Simulations. Front. Earth Sci. 9:755041. doi: 10.3389/feart.2021.755041
Received: 07 August 2021; Accepted: 30 August 2021;
Published: 14 September 2021.
Edited by:
Anning Huang, Nanjing University, ChinaReviewed by:
Liwei Zou, Institute of Atmospheric Physics (CAS), ChinaJianping Tang, Nanjing University, China
Copyright © 2021 Dong, Xie, Wang, Fan and Tian. This is an open-access article distributed under the terms of the Creative Commons Attribution License (CC BY). The use, distribution or reproduction in other forums is permitted, provided the original author(s) and the copyright owner(s) are credited and that the original publication in this journal is cited, in accordance with accepted academic practice. No use, distribution or reproduction is permitted which does not comply with these terms.
*Correspondence: Guangtao Dong, Z3Rkb25nQDE2My5jb20=; Zhan Tian, dGlhbnpAc3VzdGVjaC5lZHUuY24=