 Zezhang Song
 Junyi Zhao1,2
 Yuanyin Zhang
- 1State Key Laboratory of Petroleum Resources and Prospecting, China University of Petroleum, Beijing, China
- 2College of Geosciences, China University of Petroleum, Beijing, China
- 3Oil and Gas Survey Center of China Geological Survey, Beijing, China
- 4Southwest Oil and Gas Field Company PetroChina, Chengdu, China
Fluid seepage performance and accumulation in tight sandstone is a critical research topic for in-depth exploration and development, closely related to the heterogeneity of the pore network. The fractal characterization is one of the most compelling and direct ways for quantitative investigation of heterogeneity. However, only one kind of fractal is used in most studies, and the differences and relations between different fractal dimensions are rarely discussed. This paper chose one of the most representative tight sandstone formations in China, the second member of the Xujiahe Formation, as the research object. First, based on physical analysis and XRD analysis, we carried out a qualitative investigation on pore structure utilizing thin-section and scanning electron microscopy. Then, detailed pore structure parameters were obtained using high-pressure mercury intrusion (HPMI). Lastly, we combined two-dimensional fractal analysis on thin-section images and three-dimensional fractal analysis on HPMI data to characterize the pore network heterogeneity quantitatively. The Xu2 tight sandstone is mainly medium- to fine-grained lithic feldspathic sandstone or feldspathic lithic sandstone with low porosity and permeability. Also, the Xujiahe tight sandstone is mainly composed of quartz, feldspar, and clay. The pore types of Xu2 tight sandstones are primarily intergranular pores, micro-fractures, and intra- and intergranular dissolution pores. Moreover, most of the micro-fractures in gas-bearing formation are open-ended, while most are filled by clay minerals in the dry formation. The r50 (median pore radius) is the most sensitive parameter to seepage capability (permeability) and gas-bearing status. The 2D fractal dimension (Ds) of gas-bearing samples is significantly larger than that of dry samples, while the 3D fractal dimension (D1, D2) of gas-bearing samples is lower than that of dry samples. There is a strong negative correlation between D2 and gas-bearing status, permeability, quartz content, and r50, but a positive correlation between Ds and these parameters. D2 represents the heterogeneity of pore space, while the Ds indicates the development of the pore network. Tectonic movements that generate micro-fractures and clay cementation that blocks the seepage channels are the two main controlling factors on fractal dimensions. Combining 2D and 3D fractal analysis could give a more in-depth investigation of pore structure.
1 Introduction
After about 10 years of rapid development of unconventional hydrocarbon, tight gas plays a vital role in the energy framework of China. In 2019, the increases of the world proved gas reserves and gas demand were both driven by China, reaching as high as 3 Tcm (trillion cubic meters) and 24 bcm (billion cubic meters), respectively [BP 2019 energy review, (Ersoy et al., 2019)]. Compared with shale gas (Xu et al., 2020a; Xu et al., 2020b), tight sandstone gas has a more significant role in China’s natural gas industry, accounting for 39.2 and 24.6% of China’s total gas reserves and annual natural gas production as early as 2010 (Dai et al., 2012), respectively. To date, tight sandstone gas is one of the most developed unconventional gas resources in the world.
A typical tight sandstone gas reservoir is characterized by low porosity (<10%), ultra-low permeability (<0.1 mD under overburden pressure, < 1 mD under atmospheric pressure), and strong reservoir heterogeneity (Zou et al., 2012). The tightness and substantial heterogeneity bring significant challenges to the exploration and development of tight gas: challenging to predict the sweet spots of the reservoir, the main controlling factors for gas-bearing remains unclear (complex gas-water spatial distribution). Comprehensive and in-depth reservoir characterization is the core for successfully solving the problems mentioned above in tight gas exploration.
In recent years, the reservoir characterization of tight sandstone emphasized more on reservoir heterogeneity characterization. Fractal theory, first proposed by Mandelbrot and Wheeler (1983), has been widely utilized in the microscopic heterogeneity characterization for tight sandstone reservoirs. Fractal geometry has a unique advantage in the quantitative characterization of irregular objects: it can quantitatively characterize the heterogeneity of objects across scales by giving it a numerical value—the fractal dimension (Xie et al., 2001). Unlike Euclidean geometry, fractal dimension is not an integer but a decimal. Generally, the greater the fractal dimension, the more substantial the roughness or heterogeneity of the pore network. Besides, we may further use fractal dimension for predicting petrophysical properties such as permeability, tortuosity, and even connectivity (Daigle et al., 2014).
In the area of pore structure characterization, based on the value range of fractal dimension and experiments, we may categorize it into two groups—two-dimensional and three-dimensional characterization. Accordingly, the range of fractal dimensions is (1, 2) and (2, 3), respectively, as summarized in Table 1.
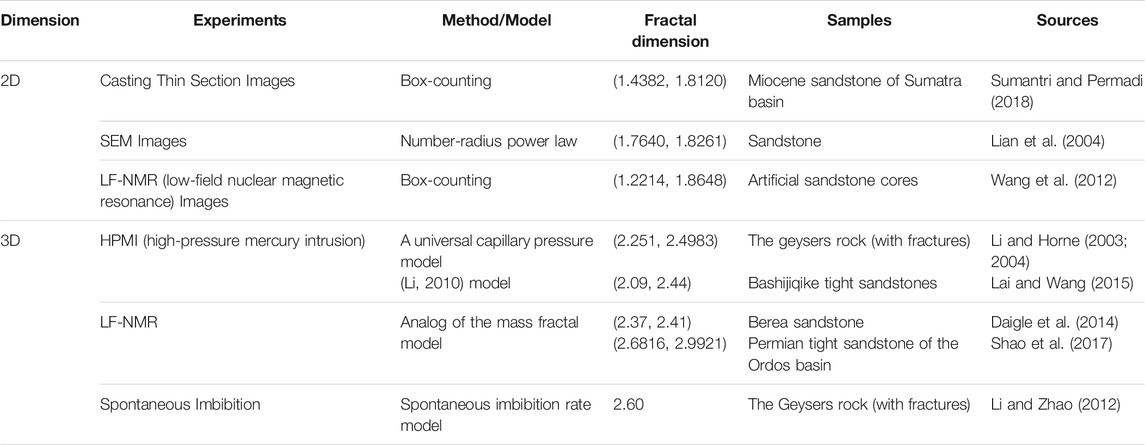
TABLE 1. Several examples for fractal characterization of pore structure of (tight) sandstone.
Two-dimensional fractal analysis is based on visual observation (image analysis), which consists of three steps: (1) obtaining 2D image through direct microscopic observation; (2) extracting and processing on pore structure characteristics; and (3) analyzing the fractal distribution of the pore network in 2D space. In addition, the box-counting method is the most frequently utilized method. The image for 2D fractal analysis could be obtained from casting thin section, scanning electron microscopy (SEM) and low-field nuclear magnetic resonance (LF-NMR), and others. The casting thin section is the most convenient and cost-effective technique to obtain pore structure by filling the pore network with colorful epoxy resin under vacuum. Sumantri and Permadi (2018) utilized the 2D fractal dimension obtained from the casting thin section of the Menggala and Bekasap sandstone of the Miocene age from the Central Sumatra Basin to predict permeability. It is worth noting that this paper has not shown the pore network extraction—fractal analysis is directly carried out on thin-section images using the software. Compared with thin-section images, SEM images could represent pore networks on a smaller scale. For example, Lian et al. (2004) carried out the morphological decomposition of sandstone pore network on SEM images, then calculated the fractal dimension using number-radius power law. However, the sampling process of the two techniques as mentioned above, especially that of the SEM, may significantly alter the pore network. As a more non-destructive technique, LF-NMR is also capable of representing a pore network. Based on LF-NMR images, Wang et al. (2012) not only calculated the fractal dimension of sandstone but also discussed the influencing factors (selected box sizes, threshold value, and image resolution) for fractal analysis. Also, it deserves to pay special attention that LF-NMR has its own weakness brought by the technique itself. The image from LF-NMR is based on NMR signal intensity from pore fluid. Thus, the LF-NMR image generally is with relatively low resolution and can only represent pore space with scales between hundreds of nanometers and micron-scales. Moreover, when it comes to tight sandstones, due to the low content of fluid in the pore network, the signal may be so weak that the LF-NMR image can hardly reflect the pore space. Hence, by comparison, casting thin section is generally the first choice for 2D fractal analysis for tight sandstone owing to low-cost, high-resolution, and sufficient observation scale for analysis.
Three-dimensional fractal analysis is carried out through the interpretation of fluid flow behavior in three-dimensional pore space. Thus, fluid intrusion techniques, like high-pressure mercury intrusion (HPMI), LF-NMR, and spontaneous imbibition (SI), are frequently combined with fractal theory to analyze the fractal characteristics of the pore network. Li and Zhao (2012) established a fractal production model based on SI experiments to estimate sandstone’s fractal dimension to predict production rate. Also, in recent years, we noticed more and more works applied fractal analysis on LF-NMR data, not only for the pore structure characterization of sandstone (Daigle et al., 2014; Zhao et al., 2017) but also for that of shale (Li et al., 2018; Sun et al., 2019; Yuan and Rezaee, 2019). Compared with the two techniques mentioned above, the combination of HPMI/capillary pressure and fractal theory has a long history, and numerous models have been established for the fractal interpretation of HPMI data. This is attributed to the convenience and relatively low cost of the HPMI experiment compared with that of LF-NMR and SI. As early as the 1950s, Corey (1954) proposed a model to demonstrate the relationship between gas and oil relative permeability, which revealed the power-law relations between capillary pressure and effective saturation. It is worth noting that establishing a power-law relation between two parameters is crucial for determining fractal dimension and is regarded as one of the most critical steps for fractal analysis. Later, in the research of Thomeer (1960), the pore geometrical factor was directly introduced to the exponent of the power-law between capillary pressure and fractional bulk volume occupied by mercury (could be related to saturation). Similarly, Brooks and Corey (1964) introduced a pore structure parameter—pore size distribution index, to relate the logarithmic capillary pressure and logarithmic effective saturation. At the end of the last century, with the explicit proposal of fractal dimension (Mandelbrot and Wheeler, 1983; Mandelbrot et al., 1984), capillary pressure analysis began to combine with fractal dimension. Li and Horne (2003) studied the heterogeneity of Geysers sandstone quantitatively using fractal dimension derived from HPMI data. Then, more and more investigations on the combination of fractal theory and HPMI technique further confirmed its effectiveness in quantitative characterization of pore network heterogeneity of rocks (Li and Horne, 2004; Li and Horne, 2006; Li, 2010; Lai and Wang, 2015; Guo et al., 2019). Also, HPMI can provide various pore structure parameters, representing pore network connectivity and seepage capacity, which makes it the first choice to combine with fractal theory.
It can be seen from the above review that both 2D and 3D fractal studies have been widely utilized in the heterogeneity characterization of pore structure. However, it is rarely seen that the differences and connections between two-dimensional and three-dimensional fractal analysis of pore structure are discussed and compared in one study. In the past 30 years, scholars worldwide also pointed out coincidentally that it is inappropriate to depict pore structure heterogeneity merely by one parameter—fractal dimension (Xie et al., 1999; Peng et al., 2018; Hou et al., 2019).
Given these research gaps, this study aims to combine 2D and 3D fractal analysis for the pore structure characterization of tight sandstone, comparing the advantages and disadvantages of 2D and 3D fractal characterization and investigating their relations. We selected the tight sandstone of the Xujiahe Formation (one of the most important tight sandstone formations in Sichuan Basin) as the research object, integrating 2D fractal analysis on thin-section images and 3D fractal analysis on HPMI data for the pore structure characterization. The related issues are discussed in this paper.
2 Geologic Background
The Sichuan Basin is a typical superimposed basin with an area of about 180,000 km2 and a total sedimentary thickness of about 8000–12,000 m (Zecheng et al., 2013). According to the tectonic division of the Sichuan Basin, our research area (Figures 1A, 2, 3), the giant Anyue gas field, is located in the eastern axial region of the Leshan-Longnvsi paleo-uplift in the central Sichuan Basin (Li et al., 2020). The exploration of the target formation, the Xujiahe Formation in central Sichuan, began in the 1950s. To date, several giant gas fields of Xujiahe Formation, like Guang ‘an, Hechuan, Anyue, and Xinchang, have been discovered successively, with proven gas reserves of more than 0.6 × 10¹² m3 (Tao et al., 2014).
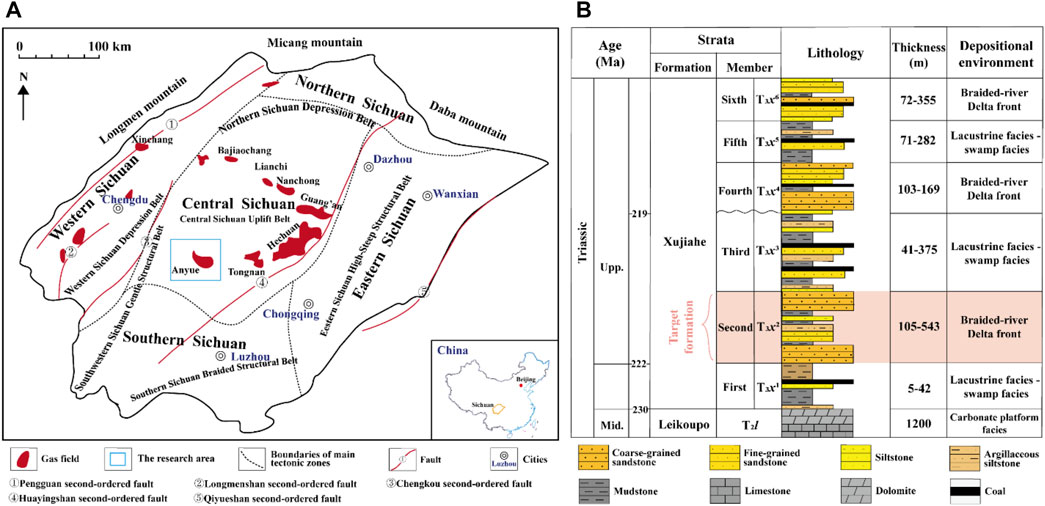
FIGURE 1. (A) Geological map, demonstrating: I. the tectonic units of the Sichuan Basin; II. the location of main Xujiahe gas fields; III. the location of our research area. (B) The stratigraphic setting of the Xujiahe Formation.
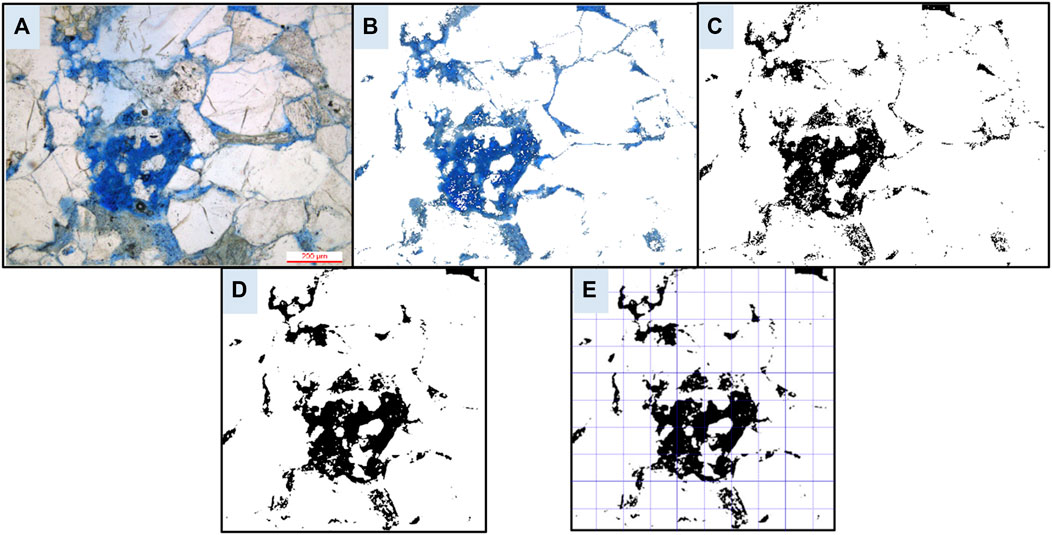
FIGURE 2. (A) The original casting thin section image; (B) Extracted pore structure; (C) Binarised image of pore structure; (D) Cropping the binary image of pore structure into square-shaped for fractal analysis; (E) Fractal analysis on pore structure using the box counting method.
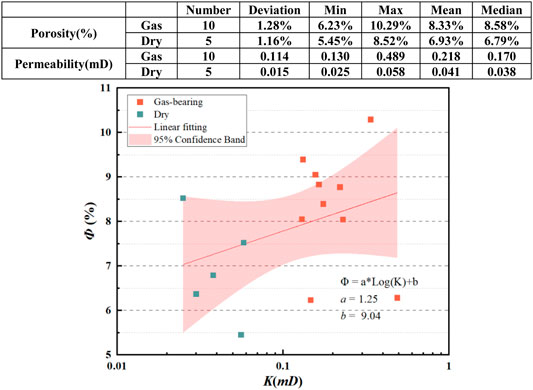
FIGURE 3. The scatter plot showing the relationship between porosity and permeability of the Xujiahe Formation.
The upper Triassic Xujiahe Formation is the first continental strata since Paleozoic. The overall thickness of the Xujiahe Formation in the study area ranges from 532 to 860 m. Vertically, the Xujiahe formation can be divided into six members (Figure 1B). The first, third, and fifth members are mainly black mudstone and shale of lacustrine facies, containing coal seams and the primary source layers. The second, fourth, and sixth members are mainly grey fine-grained tight sandstone interbedded with black mudstone and thin coal lines. Our target formation is the second member of the Xujiahe Formation (Xu2), mainly braided-river delta front deposits. The lithology of the Xu2 member is primarily grey, medium and fine feldspathic quartz sandstone, lithic quartz sandstone, and lithic feldspathic quartz sandstone. The grains are well sorted, sub-angular, point-line contact, and mainly medium-grained. The cumulative thickness of the Xu2 member varies from 105 to 543 m, which lays a solid foundation for a qualified reservoir.
3 Sampling and Methodology
Fifteen tight sandstone samples from eight exploration wells were obtained from the second member of the Xujiahe Formation (Xu2) of the Upper Triassic. The tight sandstone in this study is mainly deposited in the delta-front facies of the braided river. Its lithology is mainly lithic sandstone or lithic quartz sandstone. Also, for comparison’s sake, some of these samples are from the gas-bearing formation when the others are from the dry formation.
3.1 Sampling and Experiments
Guided by standard SY/T 5368–2016, thin sections were made by impregnating with epoxy resin under vacuum. To better distinguish the pore network with matrix, we chose to dye the epoxy resin blue. The porosity and permeability were measured by helium porosimeter in the state key laboratory of petroleum resources and prospecting according to the standard SY/T5336-2006. Also, HPMI was also carried out here. Furthermore, the Beijing Research Institute of Uranium Geology (BRIUG) supported the X-ray diffraction experiment for whole-rock mineral analysis.
3.2 2D Fractal Analysis on Casting Thin Section Images
Casting thin section images contains pore structure information; however, we should first extract the pore network for quantitative image analysis’s sake. Thus, pre-processing of casting thin section images is required. In this study, the pre-processing of casting thin section images before 2D fractal analysis contains three steps: (1) Extracting pore network (blue part) by filtering out redundant matrix information (Figure 2A,B); (2) binarization of the pore network to make the calculation simpler (Figure 2C); and (3) cropping the image to a square shape (1024 pixel × 1024 pixel) for fractal analysis. After pre-processing, we carried out the fractal analysis on the pore network using the box-counting method (Figure 2D,E).
The box-counting method, also known as the pixel-coverage method, is realized by iteratively covering the same set of shapes (square boxes with length r) on a fractal object (image) and calculating the number of boxes (N(r)) carrying information. When the side length of the box decreases, the number of boxes increases. Theoretically, the fractal dimension of the fractal object equals log (N(r))/log (1/r) when the side length of the box tends to zero (Equation 1):
In this study, the relationship between the calculated box number N(r) and the side length of the box is shown in double-logarithmic coordinates, then the slope of log(r) and log (N(r)) is calculated by the least squares method. The fractal dimension D of the fractal (pore network) equals the negative slope.
3.3 3D Fractal Analysis on HPMI Data
Though there are various models established for the fractal analysis of HPMI data, in this study, we carried out a 3D fractal analysis on HPMI data using models derived by Li (2010). The detailed derivation of the model could be referred to as the works of Song et al. (2018).
4 Results
4.1 Petrophysical Properties and Mineral Composition
The overall porosity of the second member of the Xujiahe tight sandstone is relatively low, ranging from 5.45 to 10.29%, with an average value of about 7.86%. Meanwhile, the permeability ranges from 0.025 to 0.489 mD, with an average value of 0.159 mD. The physical parameters further confirm that the Xujiahe formation is a typical tight sandstone formation. Further analysis of physical parameters shows that the formation quality of gas-bearing formation is better than that of dry formation, with relatively higher porosity and permeability. The average porosity of gas-bearing samples is 8.33%, while that of the dry formation is only 6.93%. The permeability difference between gas-bearing formation and dry formation is significant—more than one order of magnitude: the permeability of gas-bearing samples ranges from 0.130 to 0.489 mD, with an average value of 0.218 mD. In contrast, the permeability of dry samples ranges from 0.025 to 0.058 mD, with an average of 0.041 mD.
The Xujiahe tight sandstone is mainly composed of quartz, feldspar, and clay (Figures 4A,B). Quartz is the dominating mineral, with a relative content from 55.40% to as high as 85.60% (average value: 75.39%, median value: 78.60%). Feldspar (plagioclase and orthoclase) and clay ranked second and third, accounting for 13.43 and 10.49%, respectively. We can also see from the ternary plot that brittle minerals have a dominant position in composition. In addition, the content of plagioclase is slightly higher (4.75%) than that of orthoclase. The content of carbonate minerals such as calcite and dolomite is relatively low (only 0.69% on average). Moreover, comparative analysis shows that the gas-bearing formation is characterized by relatively higher contents of quartz and feldspar while a relatively lower content of clay minerals. The contents of quartz in the gas-bearing formation are 11.18% higher than those in the dry formation, while the content of feldspar and clay minerals is 5.12 and 4.34% lower on average, respectively.
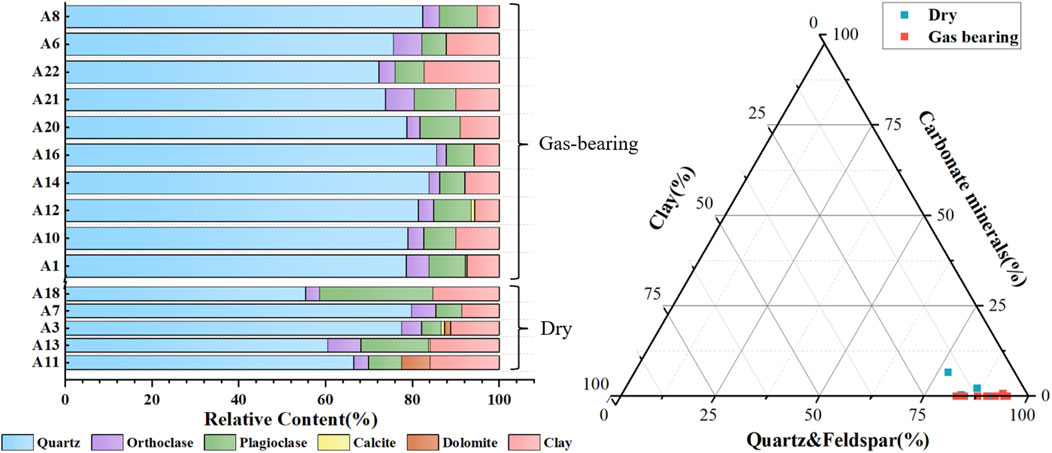
FIGURE 4. Mineralogy comparison (stacked bar chart on the left and ternary plot on the right) between samples from gas-bearing formation and the dry formation based on XRD data.
4.2 Direct Observation of Pore Space
This study investigated the microscopic characteristics of 23 Xu2 tight sandstone samples based on thin sections. Generally, the Xu2 tight sandstone is mainly medium- to fine-grained lithic feldspathic sandstone or feldspathic lithic sandstone. The particle contact mode is mainly linear contact (Figure 5), reflecting that the tight sandstone of Xu2 has been subjected to medium-strong compaction. The pore types of Xu2 tight sandstones are primarily intergranular pores, micro-fractures, and intra- and intergranular dissolution pores (Figure 5). The existence of sharp and angular particles demonstrates a low-medium structural maturity—relatively short transportation before deposition. Intergranular pores are mostly residual primary intergranular pores and dissolution pores. Due to severe compaction, only a small fraction of the primary intergranular pores is preserved. In contrast, the dissolution pores are widely developed due to the acidic environment caused by hydrocarbon generation. The dissolution occurs at the edge of feldspar and calcite particles, forming large intergranular pores and at some residual feldspars particles transformed by kaolinization, forming intragranular dissolution pores. As shown in Figure 5, we can see apparent differences between gas-bearing and dry formations: (1) The pore space is more developed in the gas-bearing formation. (2) Micro-fractures are more developed in the gas-bearing formations. We can also see some micro-fractures in the dry formations. However, most of them are filled with clay minerals, while most of the micro-fractures in the gas-bearing formations are open-ended. (3) Most of the micro-fractures are developed in quartz particles.
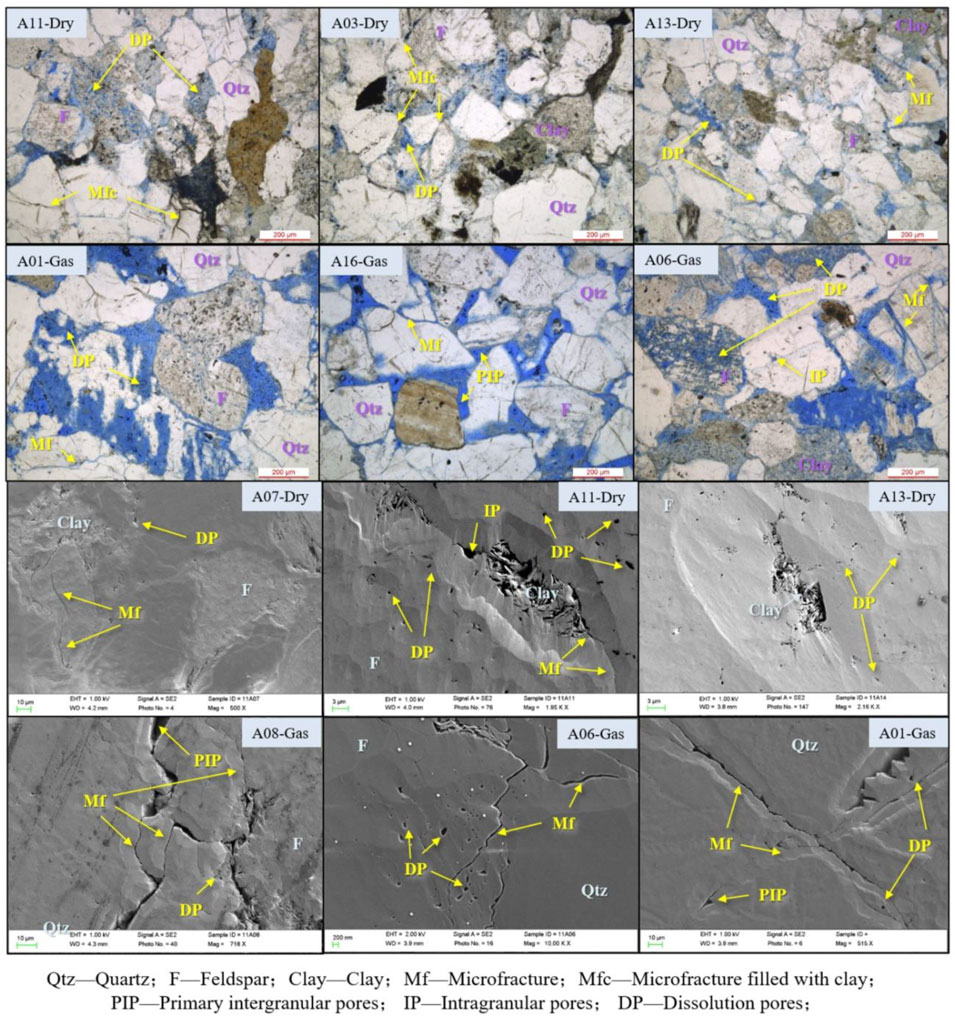
FIGURE 5. Casting thin section images and SEM images, demonstrating the pore structure difference between gas-bearing and dry formations.
To further compare the pore network of gas-bearing and dry formations, this paper studied their pore structure on a smaller scale with the help of SEM (Figure 5). In nanoscale, it is more evident that though quartz and feldspar dominate in both gas-bearing and dry formations, rigid particles (quartz and feldspar) are highly cracked in the gas-bearing formation than in the dry formation. Also, it is apparent that the majority of intragranular space and micro-fractures of the dry formation are filled with clay minerals (primarily chlorite).
4.3 Quantitative Pore Structure Characterization
The experimental results of high-pressure mercury injection of samples from the gas-bearing and dry formations show apparent differences. First, it is reflected in the curve shape of HPMI. The HPMI curves of all gas-bearing samples are remarkably consistent: the displacement pressure is all lower than 1 MPa, with an average value of 0.62 MPa (Table 2); the injection branch has a relatively flat “platform section” (Figure 6); the overall shape of “platform section” is concave, demonstrating coarse-grained skewness/relatively large pore-throat diameter; the maximum mercury saturation is basically greater than 90%, reaching as high as 96.27%. In sharp contrast with the gas-bearing samples, the HPMI shape of the dry samples is quite different, which is directly reflected in the significant wide range in the maximum mercury saturation (68.18–96.81%). The HPMI shape of all dry samples also reflects some similarities: the displacement pressure is all greater than 1 MPa (average value: 1.50 MPa); compared with the gas-bearing formation, the injection branch is more inclined, showing fine-grained skewness (relatively finer pore size).
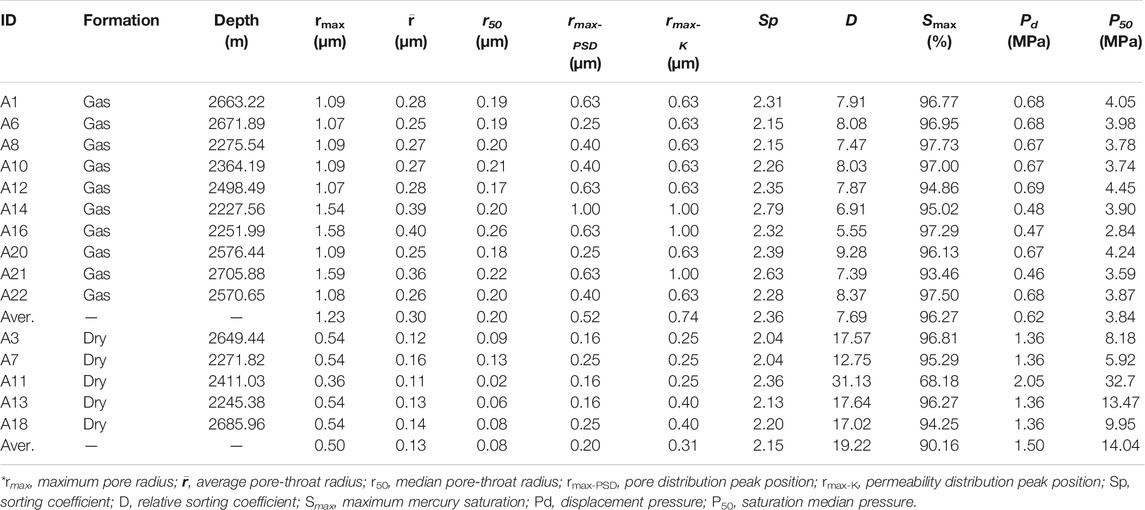
TABLE 2. Parameters obtained from HPMI experiment.
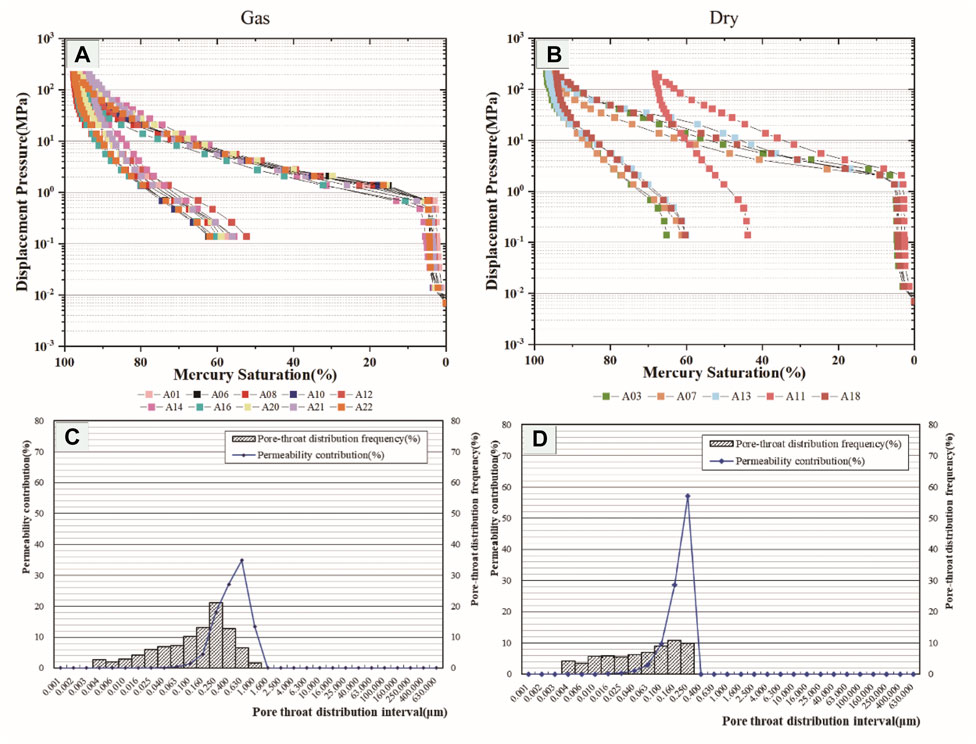
FIGURE 6. Typical HPMI curves of samples from gas-bearing (A) and dry (B) formations; and the typical PSDs obtained from HPMI experiments for gas-bearing [(C), sample A4] and dry [(D), sample A11] formations.
Furthermore, from the perspective of pore size distribution (PSD), the PSD of gas-bearing samples (taking sample A4 as an example) and dry formation (taking sample A11 as an example) also show distinct characteristics. The PSD (histogram) of gas-bearing samples shows a significant primary peak, which proves that the pore space is mainly in specific pore size (63–630 nm). On the other hand, from the perspective of contribution to permeability, pores with a diameter from 100 nm to 1 μm play a significant role in the fluid seepage in pore space. In contrast, the PSD of dry samples does not show a peak state. PSD distribution is flat and gentle, demonstrating that the pore space consists of pores with a wide range of sizes. The heterogeneity of pore space of the dry formation is stronger than that of the gas formation from pore size. From the perspective of contribution to permeability, pores with diameters from 63 to 250 nm play a significant role. On the one hand, it shows that the space of fluid seepage of the dry formation is narrower than that of the gas-bearing formation; on the other hand, it is also explained from the point of view of pore structure that the flow of fluid in such a space is more complicated than that in the gas-bearing formation.
Statistics of HPMI parameters from 10 gas-bearing and 5 dry samples help to make a more in-depth quantitative comparison on the pore structure of gas-bearing and dry formations. P50 (the median pressure) and r50 (the median pore radius) are the two most intuitive parameters reflecting the tightness of rock. The average values of P50 of gas-bearing and dry samples are 3.84 and 14.04 MPa, respectively. At the same time, r50 (the median pore radius), the representative parameter for pore/throat average size, of gas-bearing and dry samples are 200 and 80 nm, respectively. A relatively low value of P50 and a high value of r50 correspond to the coarse skewness of gas-bearing samples. Furthermore, we can also see that the average pore radius
4.4 2D and 3D Fractal Analysis for Pore Structure Characterization
With the help of the “box-counting” method, based on the qualitative characterization of the pore structure of the casting thin section images, we optimized typical casting thin section images that can reflect the pore structure characteristics of the corresponding sample for two-dimensional fractal analysis. The results (Figure 7) show that: (1) on the bi-logarithmic coordinates of r and N (r), the data points show a significant linear distribution, and the fitting goodness of linear regression generally reaches more than 95%, indicating that the two-dimensional analysis is adequate, and the result is reliable. (2) It should be noted that the fitting goodness of gas-bearing samples is generally better than that of dry samples, which may indicate a better self-similarity of pore space. (3) For both gas-bearing and dry samples, the two-dimensional fractal dimension is in the range of (1, 2), demonstrating that the calculated fractal dimensions are reasonable. (4) The surface porosity of gas-bearing samples is significantly better than that of dry samples. The face rates of two typical gas-bearing samples are 14.09 and 16.58%, respectively, far better than that of dry samples of 1.87 and 1.44%. (5) The two-dimensional fractal dimension of gas layer samples is significantly larger than that of dry layer samples. (6) From the point of view of pore network 2D distribution, the extracted pore space of gas-bearing samples is more homogeneous distributed in 2D space and better connected. In contrast, the 2D pore space of dry formation is heterogeneously distributed/concentrated in some areas with low connectivity.
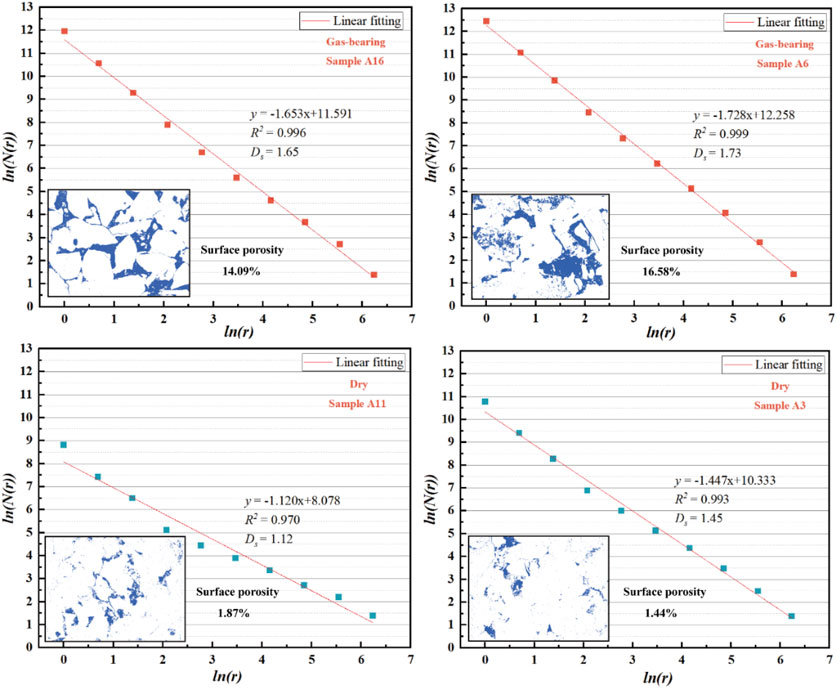
FIGURE 7. Two-dimensional fractal analysis on thin-section images of typical gas-bearing (A16, A6) and dry samples (A11, A3). *Ds: 2D fractal dimension obtained from casting thin section image fractal analysis.
Moreover, statistics (Table 3) show apparent differences in two-dimensional fractal results between gas-bearing and dry samples. The calculated surface fractal dimension of gas-bearing samples varies from 1.44 to 1.80, with an average value of 1.65. In contrast, the calculated surface fractal dimension of dry samples is in the range of (1.12, 1.45), with an average value of 1.39. Also, it is more apparent that the surface porosity of gas-bearing samples is far better than that of dry samples.
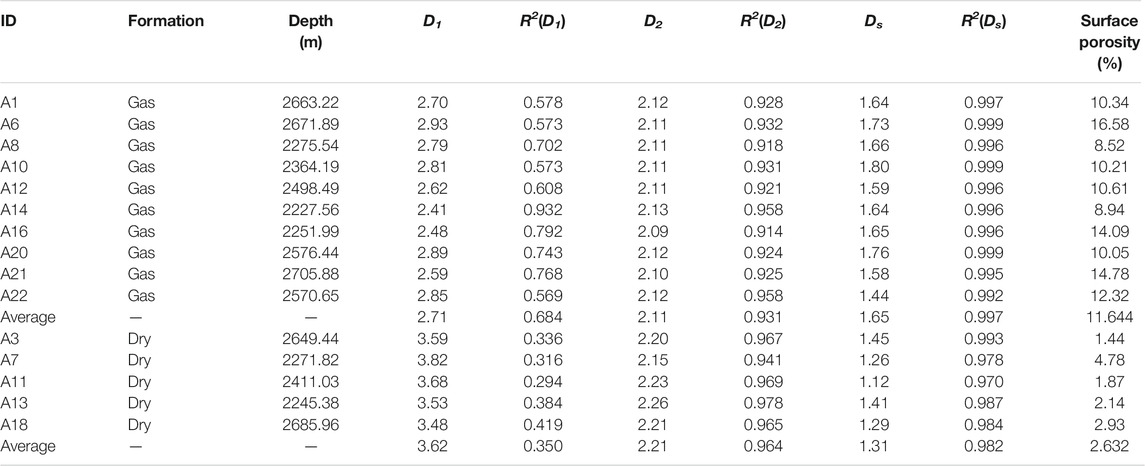
TABLE 3. Parameters obtained from 2D Fractal analysis.
Based on the two-dimensional fractal analysis on pore structure with the help of thin-section images, we further combined the Li (2010) model and HPMI data to carry out three-dimensional fractal analysis on pore structure. The results of three-dimensional fractal analysis on typical gas-bearing and dry samples (Figure 7) show that the data points apparently show a two-stage linear distribution on the bi-logarithmic coordinates of Pc and SHg. The piecewise linear regression of data points shows that the goodness of fit of all samples has reached more than 90%, proving that the applied fractal model is effective in analyzing HPMI data. The breakpoint of the two-stage distribution is near Log (Pc) = 0.8 for both and gas-bearing and dry samples. The pore/throat radius corresponding to this breakpoint is 116.5 nm, indicating that the pore spaces with a pore radius greater than this value and less than this value have different self-similar characteristics (fractal characteristics). In addition, according to Figure 8 and Table 3, D1 of all dry samples is greater than 3, while D2 of all dry layers, D1 and D2 of all gas-bearing samples are within the normal range of 3D fractal dimension—(2, 3). Therefore, in the fractal results of Li (2010), the relatively smaller pore space in the dry samples cannot be reasonably explained by fractal dimension, so this part of the pore space is not considered. However, according to the results of Section 3.3, pores less than 116.5 nm play an essential role in fluid seepage in the pore space of dry formations, which should be paid attention to in the analysis.
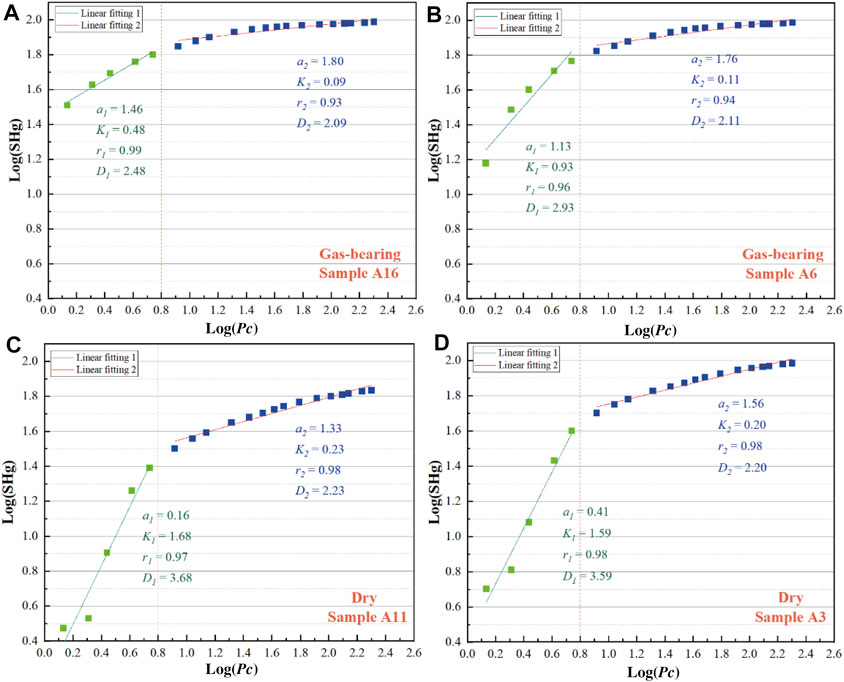
FIGURE 8. Three-dimensional fractal analysis on HPMI data of typical gas-bearing (A,B) and dry samples (C,D).
5 Discussion
The core issue in tight sandstone reservoir characterization is how the reservoir quality controls the gas-bearing property (Zou et al., 2012; Sakhaee-Pour and Bryant, 2014; Gao and Li, 2015; Schmitt et al., 2015; Xi et al., 2016; Zhang et al., 2018). Therefore, in this study, we took the gas-bearing property of the reservoir as a parameter (“Gas-bearing Status” in Figure 9) and made a bi-correlation analysis on parameters, including gas-bearing property, the mineral composition, reservoir pore structure parameters, and fractal dimensions. The results were shown in the form of a heatmap (Figure 9).
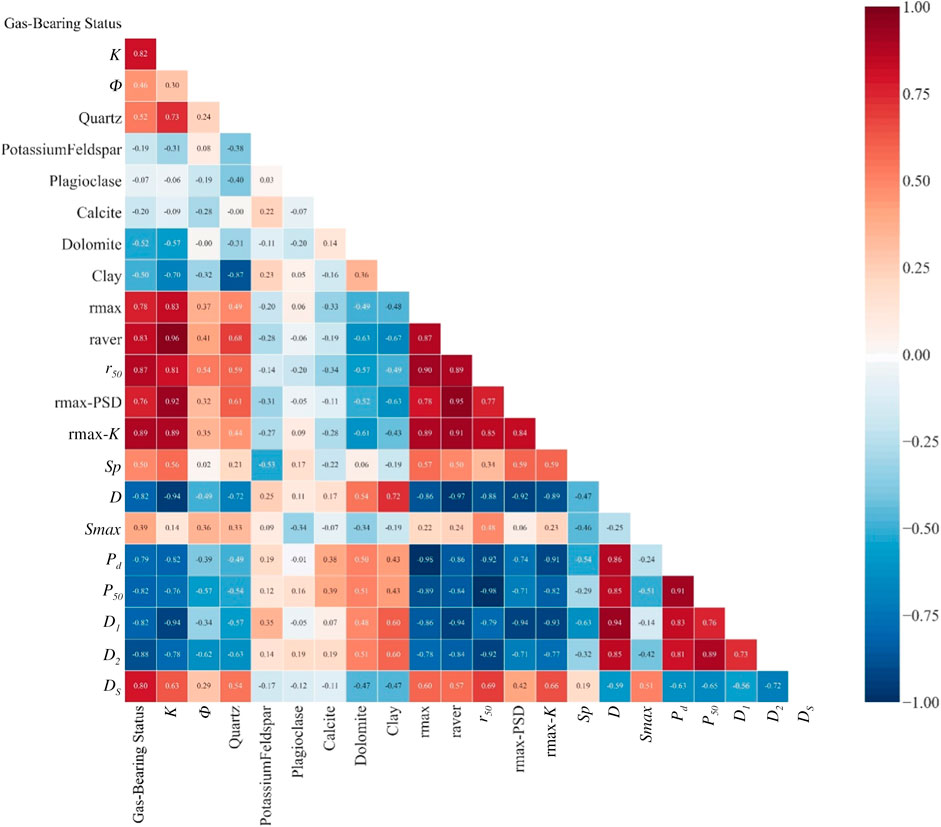
FIGURE 9. Heatmap showing the correlation relationships among petrophysical parameters, mineral compositions, pore structure parameters, and gas-bearing status. *There are two values for “Gas-bearing status”: True or False, representing gas-bearing and dry formations. The color of the heatmap ranges from dark blue to dark red, representing a correlation coefficient of −1 (negative correlation) to 1 (positive correlation), respectively.
5.1 Relationships Between Gas-Bearing Status and Physical Properties, Mineral Composition
First, the gas-bearing property related issues shall be analyzed. From the perspective of physical properties, there is an apparent positive correlation between permeability and gas-bearing status (the correlation coefficient equals 0.82). In contrast, the correlation between porosity and gas-bearing status is not apparent, indicating that the controlling effect of reservoir seepage performance on gas-bearing status is more dominant than the porosity. From the perspective of mineral composition, quartz and clay minerals, the main minerals of Xu2 formation, have a stronger correlation relationship with gas-bearing status than any minerals except dolomite (the content of dolomite is too low to be considered), and the correlation coefficients reach 0.52 and −0.50, respectively. From the correlation diagram between permeability, porosity, and mineral components (Figure 10), it can be seen that quartz and clay minerals have a much more significant impact on physical properties than other minerals. Quartz has a positive correlation with physical parameters, while clay minerals negatively correlate with physical parameters. Whether quartz or clay, their correlation with permeability is significantly higher than that with porosity, indicating the existence of quartz and clay minerals primarily controls the seepage capability of the reservoir. The positive correlation between quartz and rock physical properties and gas-bearing property can be explained in Figure 5: the rigid particles (mainly quartz) of gas-bearing samples are intensely cracked to form a good seepage channel conducive to natural gas migration and accumulation. When clay minerals block the formed seepage channel, the seepage performance decreases sharply, resulting in poor gas-bearing status and the formation of dry formation. In the dry samples shown in Figure 5, we also see many microcracks, but most of them have been filled with clay minerals. Therefore, there is a negative correlation between clay mineral content and seepage performance (permeability) and gas-bearing status. It is also worth noting that even in the dry formation, though most seepage channels (micro-fractures) are filled with clay minerals, micro-fractures developed in rigid particles is still the dominant factor affecting their seepage (permeability). Therefore, there is a good positive correlation between quartz content in the dry samples and permeability, gas content.
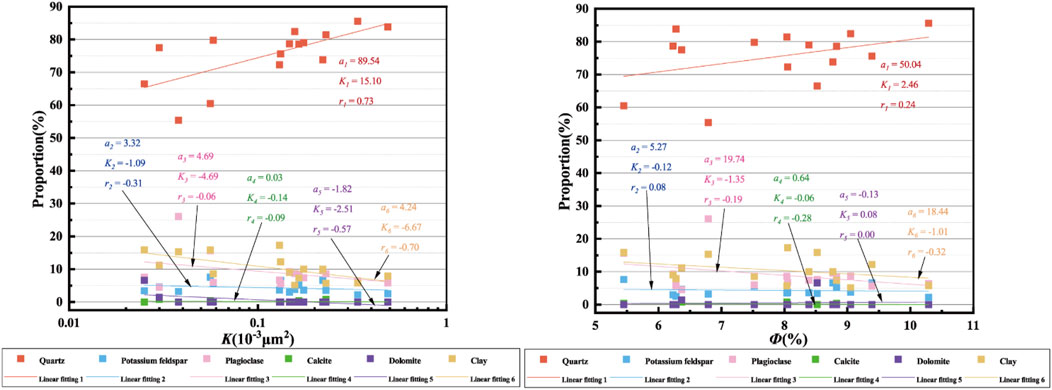
FIGURE 10. Correlation relationships between permeability (left), porosity, and mineral composition.
Furthermore, if the gas-bearing status is analyzed from the perspective of diagenesis, most of the diagenetic processes that contribute to porosity, like compaction and dissolution, are not the controlling factors on gas-bearing status. That is why we see in Figure 3, that even with low porosity, some formation can be gas-bearing. In contrast, clay cementation, which blocks the seepage channel, and tectonic movements, which generate micro-fractures, control gas-bearing status. Correspondingly, we see from Figure 3 that there is a clear boundary between gas-bearing and dry samples, and the permeability of all gas-bearing samples are higher than that of dry samples.
5.2 Relationships Between Gas-Bearing Status and Pore Structure Parameters
To more specifically characterize the controlling effect of pore structure on gas-bearing status, five pore/throat-size-related parameters are selected for comparison in this paper: the average pore/throat radius
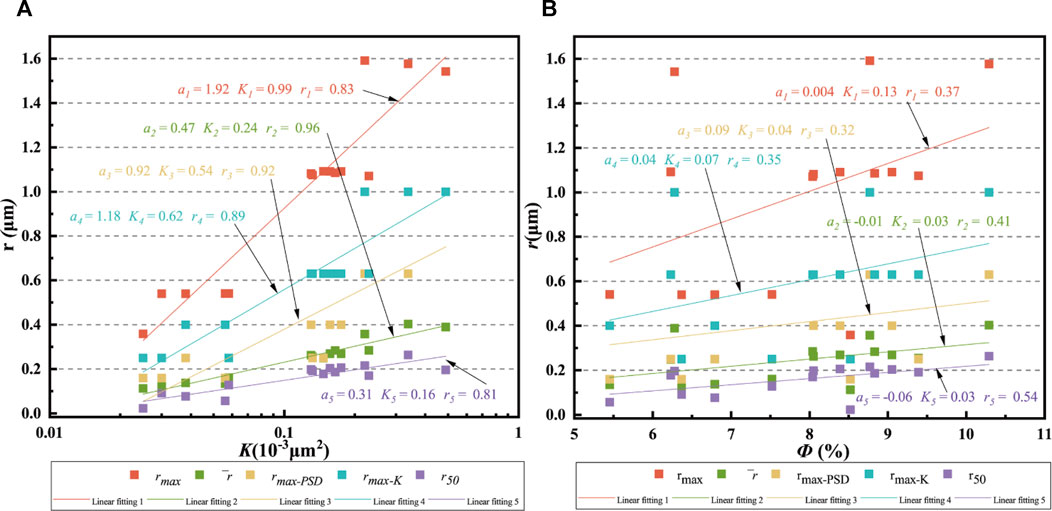
FIGURE 11. Correlation relationships between permeability (A), porosity (B), and five representative pore/throat-size-related parameters.
In contrast to r50, Pd and P50 have a good negative correlation with gas-bearing status and permeability, a weak negative correlation with porosity and quartz content, and a weak positive correlation with clay minerals. When the pore structure tends to coarse skewness (P50 is small), it is conducive to fluid seepage in the reservoir. Through comparison of gas-bearing and dry samples (Figure 12), it is found that the Pd and P50 of dry samples fluctuate considerably, reflecting a strong heterogeneity of dry samples. In comparison, the gas-bearing samples are relatively uniform: Pd and P50 are small.
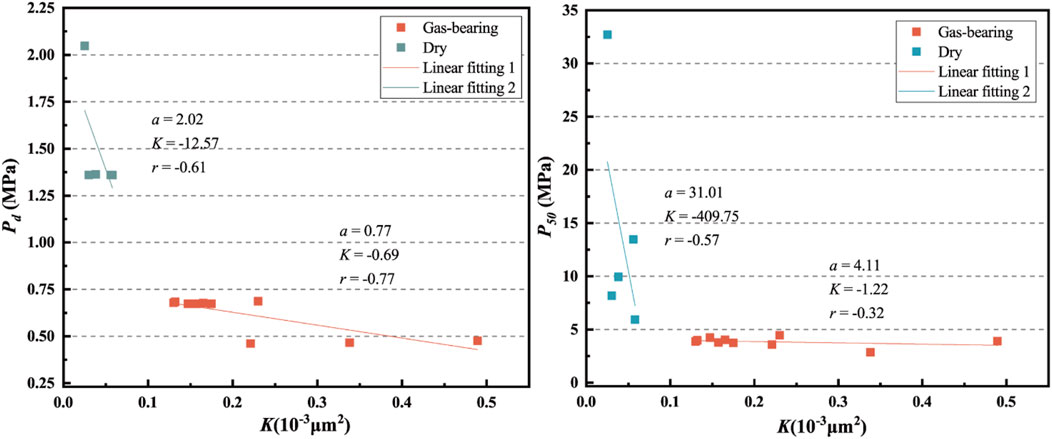
FIGURE 12. Comparison of gas-bearing status on the correlation between permeability (left), and Pd, P50.
5.3 Relationships Between Fractal Dimensions (2D and 3D) and Pore Structure Parameters
There is a strong negative correlation between gas-bearing status, permeability, and three-dimensional fractal dimension (D1, D2), but a positive correlation with two-dimensional fractal dimension (Ds) (Figure 9). The reason for this: the three-dimensional fractal dimension is obtained based on the analysis of the seepage behavior of the fluid in the pore space. The greater its value, the rougher the surface that the fluid passes through during seepage, that is, the more substantial the heterogeneity of the three-dimensional pore space. Correspondingly, the more complex the fluid seepage in the pore space and the worse the gas-bearing status. In contrast, the two-dimensional fractal dimension is obtained by analyzing the distribution of pore networks in two-dimensional space using the box-counting method. The more developed the pore network is in the plane/surface, the better the connectivity is, and the larger the two-dimensional fractal dimension obtained by the box-counting method. A more developed pore network is more conducive to the migration of fluid in pore space. Therefore, the larger the Ds, the better the seepage performance and the better the gas-bearing status. From a diagenetic point of view, when micro-fractures resulting from tectonic movements are more developed and better connected, the seepage channels for gas flow are more homogeneous; as a result, the D2 is smaller, and the Ds is larger. When the micro-fractures are severely blocked by clay cementation, the seepage channels become more heterogeneous, and the plane distribution of connected pore spaces is limited. Correspondingly, the D2 is larger, and the Ds is smaller. Thus, it seems safe to say that the 3D fractal dimension represents pore space heterogeneity while the 2D fractal dimension indicates the development of the pore network.
From the perspective of mineral composition, the analysis of the correlation between D2, DS, and mineral components shows that quartz and clay still have the best correlation with D2 and DS (Figure 13). D2 has a negative correlation with quartz content and a positive correlation with clay content—the seepage channel of Xu2 member is mainly micro-fractures formed by the cracking of rigid particles, which mainly occur in quartz. When the quartz content is relatively high, and the clay mineral content is low, the connectivity of the seepage channel is good, and the heterogeneity is relatively weak. With the increase of clay mineral content, the seepage channels such as micro-fractures are blocked (Figures 5A,B), the heterogeneity of seepage channels increases significantly. In contrast, DS positively correlates with quartz content and a negatively correlates with clay mineral content. As the seepage channel is mainly the micro-fractures in rigid particles. With the increase of quartz content, the plane distribution of this seepage channel network is more expansive, and the connectivity is better, so DS is larger. When the content of clay minerals gradually increases, the seepage channel network is gradually blocked by clay minerals. As a result, the effective seepage channels on the plane become less, the connectivity of the pore network becomes worse, even concentrated in some local areas, so DS becomes smaller.
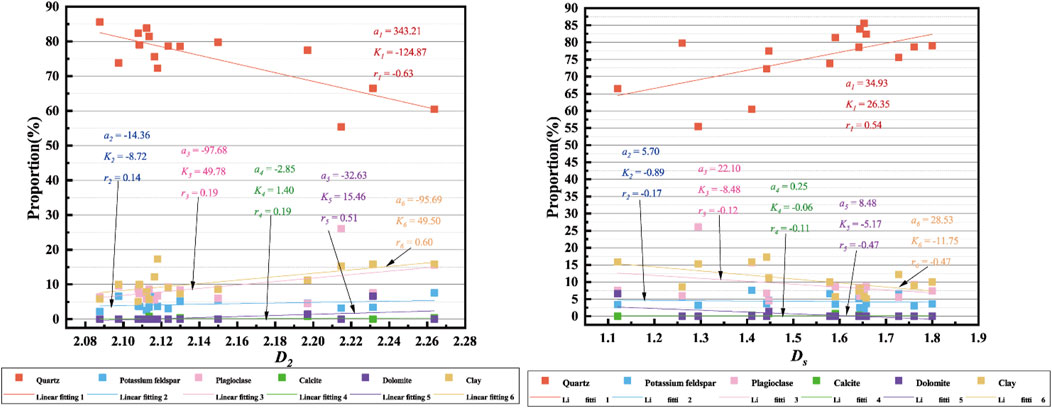
FIGURE 13. Correlation relationship of 2D and 3D fractal dimension with mineral components.
From the perspective of pore size, the correlation of five pore/throat-size-related parameters with fractal dimensions (D2 and DS) (Figure 14) shows that r50 correlates with fractal dimensions (D2 and DS) best while rmax fluctuates with fractal dimension the most. It is consistent with the analysis result on the correlation between permeability and pore/throat-size-related parameters. On the one hand, it shows that using fractal dimension to characterize fluid seepage performance is effective; on the other hand, it also shows that r50 is a representative parameter to characterize pore seepage performance.
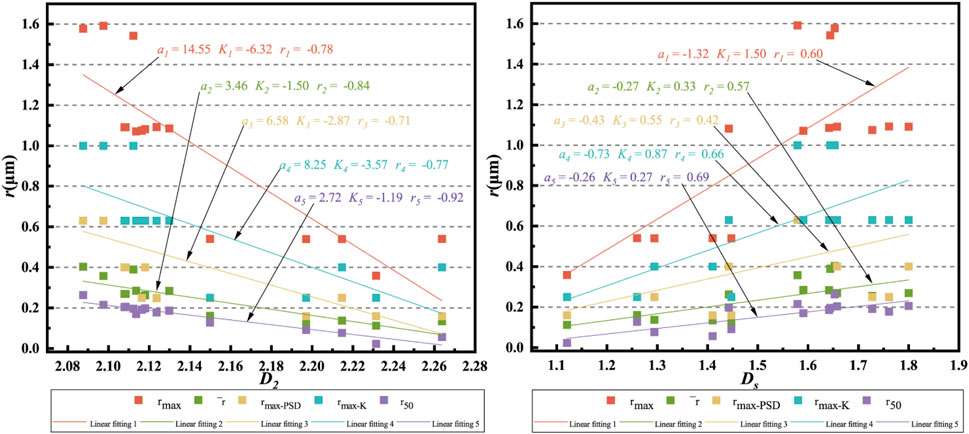
FIGURE 14. Correlation relationship of 2D and 3D fractal dimension with representative pore/throat-size-related parameters.
6 Conclusion
This paper combined 2D and 3D fractal analysis for the pore structure characterization to gain insight into the controlling factors on fluid seepage performance in tight sandstone. Physical analysis, mineral composition analysis (XRD), and HPMI were combined with 2D and 3D fractal analysis for an in-depth investigation on the pore structure of tight sandstone. The relationship between fractal dimensions (2D and 3D) and physical parameters, mineral composition, and pore structure parameters was discussed. The following conclusions were achieved.
1) The Xu2 tight sandstone is mainly medium- to fine-grained lithic feldspathic sandstone or feldspathic lithic sandstone with low porosity and permeability. Quartz is the dominating mineral (average value: 75.39%), 11.18% higher in the gas-bearing formation than in the dry formation. The pore types of Xu2 tight sandstones are primarily intergranular pores, micro-fractures, and intra- and intergranular dissolution pores. Most of the micro-fractures in gas-bearing formation are open-ended while filled mainly by clay minerals in dry formation.
2) The gas-bearing formation is distinguished from the dry formation by relatively low displacement pressure (<1 MPa), coarse skewness, and apparent peak in PSD (pore size distribution).
3) Ds of gas-bearing samples is significantly larger than that of dry samples, while D1 and D2 of gas-bearing samples are lower.
4) There is a strong negative correlation between D2 and gas-bearing status, permeability, quartz content, and r50, but a positive correlation between Ds and these parameters.
5) D2 represents the heterogeneity of pore space, while the Ds indicates the development of the pore network.
Data Availability Statement
The raw data supporting the conclusion of this article will be made available by the authors, without undue reservation.
Author Contributions
Methodology and writing—original draft preparation, ZS; supervision, YZ and ZS; investigation, JZ; visualisation and formal analysis, JZ; writing—review and editing, ZS and JZ; project administration, LH, CL and WL, sampling and experiments; DY and YW.
Funding
The present research was funded by the National Natural Science Foundation of China, grant number 41472118, and the State Key Laboratory of Petroleum Resources and Prospecting, grant number PRP/indep 04-1611 and 2462017YJRC025. All the relevant projects can be found on the website of ZS: https://www.cup.edu.cn/geosci/szdw/fujiaoshou/179957.htm.
Conflict of Interest
Authors DY, YW, LH, CL and WL are employed by PetroChina.
The remaining authors declare that the research was conducted in the absence of any commercial or financial relationships that could be construed as a potential conflict of interest.
Publisher’s Note
All claims expressed in this article are solely those of the authors and do not necessarily represent those of their affiliated organizations, or those of the publisher, the editors, and the reviewers. Any product that may be evaluated in this article, or claim that may be made by its manufacturer, is not guaranteed or endorsed by the publisher.
Acknowledgments
We thank the PetroChina Southwest Oilfield Company for providing core samples and necessary data.
References
Brooks, R. H., and Corey, A. T. (1964). Hydraulic Properties of Porous Media. Colorado 26 (1), 352–366. doi:10.13031/2013.40684
Corey, A. T. (1954). The Interrelation between Gas and Oil Relative Permeabilities. Producers monthly 19 (1), 38–41.
Dai, J., Ni, Y., and Wu, X. (2012). Tight Gas in China and its Significance in Exploration and Exploitation. Pet. Exploration Develop. 39 (3), 277–284. doi:10.1016/S1876-3804(12)60043-3
Daigle, H., Johnson, A., and Thomas, B. (2014). Determining Fractal Dimension from Nuclear Magnetic Resonance Data in Rocks with Internal Magnetic Field Gradients. Geophysics 79 (6), D425–D431. doi:10.1190/geo2014-0325.1
Gao, H., and Li, H. A. (2015). Pore Structure Characterization, Permeability Evaluation and Enhanced Gas Recovery Techniques of Tight Gas Sandstones. J. Nat. Gas Sci. Eng. 28, 536–547. doi:10.1016/j.jngse.2015.12.018
Guo, X., Huang, Z., Zhao, L., Han, W., Ding, C., Sun, X., et al. (2019). Pore Structure and Multi-Fractal Analysis of Tight sandstone Using MIP, NMR and NMRC Methods: A Case Study from the Kuqa Depression, China. J. Pet. Sci. Eng. 178, 544–558. doi:10.1016/j.petrol.2019.03.069
Hou, X., Zhu, Y., Chen, S., Wang, Y., and Liu, Y. (2020). Investigation on Pore Structure and Multifractal of Tight sandstone Reservoirs in Coal Bearing Strata Using LF-NMR Measurements. J. Pet. Sci. Eng. 187, 106757. doi:10.1016/j.petrol.2019.106757
Lai, J., and Wang, G. (2015). Fractal Analysis of Tight Gas Sandstones Using High-Pressure Mercury Intrusion Techniques. J. Nat. Gas Sci. Eng. 24, 185–196. doi:10.1016/j.jngse.2015.03.027
Lay Lian, T., Radhakrishnan, P., and Daya Sagar, B. S. (2004). Morphological Decomposition of sandstone Pore-Space: Fractal Power-Laws. Chaos, Solitons & Fractals 19 (2), 339–346. doi:10.1016/S0960-0779(03)00046-8
Li, A., Ding, W., Jiu, K., Wang, Z., Wang, R., and He, J. (2018). Investigation of the Pore Structures and Fractal Characteristics of marine Shale Reservoirs Using NMR Experiments and Image Analyses: A Case Study of the Lower Cambrian Niutitang Formation in Northern Guizhou Province, South China. Mar. Pet. Geology. 89, 530–540. doi:10.1016/j.marpetgeo.2017.10.019
Li, K. (2010). Analytical Derivation of Brooks–Corey Type Capillary Pressure Models Using Fractal Geometry and Evaluation of Rock Heterogeneity. J. Pet. Sci. Eng. 73 (1-2), 20–26. doi:10.1016/j.petrol.2010.05.002
Li, K., and Horne, R. N. (2003). “Fractal Characterization of the Geysers Rock,” in Proceedings Of the GRC 2003 Annual Meeting.
Li, K., and Horne, R. N. (2006). Fractal Modeling of Capillary Pressure Curves for the Geysers Rocks. Geothermics 35 (2), 198–207. doi:10.1016/j.geothermics.2006.02.001
Li, K., and Horne, R. N. (2004). "Universal Capillary Pressure and Relative Permeability Model from Fractal Characterization of Rock", in Stanford Geothermal Workshop on Geothermal Reservoir Engineering, Stanford University, Stanford, California.
Li, K., and Zhao, H. (2012). Fractal Prediction Model of Spontaneous Imbibition Rate. Transp Porous Med. 91 (2), 363–376. doi:10.1007/s11242-011-9848-0
Li, Y., Qin, S., Wang, Y., Holland, G., and Zhou, Z. (2020). Tracing Interaction between Hydrocarbon and Groundwater Systems with Isotope Signatures Preserved in the Anyue Gas Field, central Sichuan Basin, China. Geochimica et Cosmochimica Acta 274, 261–285. doi:10.1016/j.gca.2020.01.039
Mandelbrot, B. B., Passoja, D. E., and Paullay, A. J. (1984). Fractal Character of Fracture Surfaces of Metals. Nature 308 (5961), 721–722. doi:10.1038/308721a0
Mandelbrot, B. B., and Wheeler, J. A. (1983). The Fractal Geometry of Nature. Q. Rev. Biol. 147, 468. (Volume 58, Number 3). doi:10.1119/1.13295
Peng, J., Han, H., Xia, Q., and Li, B. (2018). Evaluation of the Pore Structure of Tight sandstone Reservoirs Based on Multifractal Analysis: a Case Study from the Kepingtage Formation in the Shuntuoguole Uplift, Tarim Basin, NW China. J. Geophys. Eng. 15 (4), 1122–1136. doi:10.1088/1742-2140/aaab9d
Sakhaee-Pour, A., and Bryant, S. L. (2014). Effect of Pore Structure on the Producibility of Tight-Gas Sandstones. Bulletin 98 (4), 663–694. doi:10.1306/08011312078
Schmitt, M., Fernandes, C. P., Wolf, F. G., Bellini da Cunha Neto, J. A., Rahner, C. P., and Santiago dos Santos, V. S. (2015). Characterization of Brazilian Tight Gas Sandstones Relating Permeability and Angstrom-To Micron-Scale Pore Structures. J. Nat. Gas Sci. Eng. 27, 785–807. doi:10.1016/j.jngse.2015.09.027
Shao, X., Pang, X., Li, H., and Zhang, X. (2017). Fractal Analysis of Pore Network in Tight Gas Sandstones Using NMR Method: A Case Study from the Ordos Basin, China. Energy Fuels 31 (10), 10358–10368. doi:10.1021/acs.energyfuels.7b01007
Song, Z., Liu, G., Yang, W., Zou, H., Sun, M., and Wang, X. (2018). Multi-fractal Distribution Analysis for Pore Structure Characterization of Tight sandstone-A Case Study of the Upper Paleozoic Tight Formations in the Longdong District, Ordos Basin. Mar. Pet. Geology. 92, 842–854. doi:10.1016/j.marpetgeo.2017.12.018
Sumantri, Y., and Permadi, P. (2018). A Study of Sandstone Permeability Anisotropy through Fractal Concept. Am. J. Sci. Eng. Technol. 3 (2), 34–45. doi:10.11648/j.ajset.20180302.12
Sun, W., Zuo, Y., Wu, Z., Liu, H., Xi, S., Shui, Y., et al. (2019). Fractal Analysis of Pores and the Pore Structure of the Lower Cambrian Niutitang Shale in Northern Guizhou Province: Investigations Using NMR, SEM and Image Analyses. Mar. Pet. Geology. 99, 416–428. doi:10.1016/j.marpetgeo.2018.10.042
Tao, S., Zou, C., Mi, J., Gao, X., Yang, C., Zhang, X., et al. (2014). Geochemical Comparison between Gas in Fluid Inclusions and Gas Produced from the Upper Triassic Xujiahe Formation, Sichuan Basin, SW China. Org. Geochem. 74, 59–65. doi:10.1016/j.orggeochem.2014.05.008
Thomeer, J. H. M. (1960). Introduction of a Pore Geometrical Factor Defined by the Capillary Pressure Curve. J. Pet. Technol. 12 (03), 73–77. doi:10.2118/1324-g
Wang, H., Liu, Y., Song, Y., Zhao, Y., Zhao, J., and Wang, D. (2012). Fractal Analysis and its Impact Factors on Pore Structure of Artificial Cores Based on the Images Obtained Using Magnetic Resonance Imaging. J. Appl. Geophys. 86, 70–81. doi:10.1016/j.jappgeo.2012.07.015
Xi, K., Cao, Y., Haile, B. G., Zhu, R., Jahren, J., Bjørlykke, K., et al. (2016). How Does the Pore-Throat Size Control the Reservoir Quality and Oiliness of Tight Sandstones? the Case of the Lower Cretaceous Quantou Formation in the Southern Songliao Basin, China. Mar. Pet. Geology. 76, 1–15. doi:10.1016/j.marpetgeo.2016.05.001
Xie, H. P., Sun, H. Q., Ju, Y., and Feng, Z. G. (2001). Study on Generation of Rock Fracture Surfaces by Using Fractal Interpolation. Int. J. Sol. Structures 38 (32-33), 5765–5787. doi:10.1016/s0020-7683(00)00390-5
Xie, H., Wang, J.-A., and Kwaśniewski, M. A. (1999). Multifractal Characterization of Rock Fracture Surfaces. Int. J. Rock Mech. Mining Sci. 36 (1), 19–27. doi:10.1016/s0148-9062(98)00172-7
Xu, S., Gou, Q., Hao, F., Zhang, B., Shu, Z., Lu, Y., et al. (2020a). Shale Pore Structure Characteristics of the High and Low Productivity wells, Jiaoshiba Shale Gas Field, Sichuan Basin, China: Dominated by Lithofacies or Preservation Condition? Mar. Pet. Geology. 114, 104211. doi:10.1016/j.marpetgeo.2019.104211
Xu, S., Hao, F., Shu, Z., Zhang, A., and Yang, F. (2020b). Pore Structures of Different Types of Shales and Shale Gas Exploration of the Ordovician Wufeng and Silurian Longmaxi Successions in the Eastern Sichuan Basin, South China. J. Asian Earth Sci. 193, 104271. doi:10.1016/j.jseaes.2020.104271
Yuan, Y., and Rezaee, R. (2019). Fractal Analysis of the Pore Structure for clay Bound Water and Potential Gas Storage in Shales Based on NMR and N2 Gas Adsorption. J. Pet. Sci. Eng. 177, 756–765. doi:10.1016/j.petrol.2019.02.082
Zecheng, W., Shipeng, H., Deyu, G., Wei, W., and Chong, Y. (2013). Geochemical Characteristics of Natural Gases in the Upper Triassic Xujiahe Formation in the Southern Sichuan Basin, SW China. Int. J. Coal Geology. 120, 15–23. doi:10.1016/j.coal.2013.09.002
Zhang, Y., Bao, Z., Yang, F., Mao, S., Song, J., and Jiang, L. (20182018). The Controls of Pore-Throat Structure on Fluid Performance in Tight Clastic Rock Reservoir: A Case from the Upper Triassic of Chang 7 Member, Ordos Basin, China. Geofluids 2018, 1–17. doi:10.1155/2018/3403026
Zhao, P., Wang, Z., Sun, Z., Cai, J., and Wang, L. (2017). Investigation on the Pore Structure and Multifractal Characteristics of Tight Oil Reservoirs Using NMR Measurements: Permian Lucaogou Formation in Jimusaer Sag, Junggar Basin. Mar. Pet. Geology. 86, 1067–1081. doi:10.1016/j.marpetgeo.2017.07.011
Keywords: bi-fractal analysis, pore structure, tight sandstone, Xujiahe formation, central Sichuan basin
Citation: Song Z, Zhao J, Zhang Y, Yang D, Wang Y, Hu L, Li C and Liu W (2021) Bi-Fractal Characterization of the Pore Network of Tight Sandstone. Front. Earth Sci. 9:751944. doi: 10.3389/feart.2021.751944
Received: 02 August 2021; Accepted: 01 November 2021;
Published: 30 November 2021.
Edited by:
Shang Xu, China University of Petroleum (East China), ChinaReviewed by:
Zhe Cao, SINOPEC Petroleum Exploration and Production Research Institute, ChinaBenben Ma, China University of Geosciences Wuhan, China
Copyright © 2021 Song, Zhao, Zhang, Yang, Wang, Hu, Li and Liu. This is an open-access article distributed under the terms of the Creative Commons Attribution License (CC BY). The use, distribution or reproduction in other forums is permitted, provided the original author(s) and the copyright owner(s) are credited and that the original publication in this journal is cited, in accordance with accepted academic practice. No use, distribution or reproduction is permitted which does not comply with these terms.
*Correspondence: Yuanyin Zhang, eXVhbnlpbnNob3VAMTYzLmNvbQ==