Corrigendum: Strengthened Impacts of November Snow Cover Over Siberia on the Out-of-phase Change in the Siberian High Between December and January Since 2000 and Implication for Intraseasonal Climate Prediction
 Hongqing Yang
 Ke Fan
- School of Atmospheric Sciences, Sun Yat-sen University, and Southern Marine Science and Engineering Guangdong Laboratory (Zhuhai), Zhuhai, China
This study investigates the out-of-phase change in the Siberian High (SH) between December and January (stronger than normal in December and weaker than normal in January, and vice versa). The results show that the monthly reversal frequency of the SH between December and January increases significantly after 2000 from 30% (1981–2000) to 63% (2001-2019). Correspondingly, the influence of November snow cover over Siberia on the phase reversal of the SH has intensified after 2000. The reasons may be as follows. Higher snow depth over Siberia (SSD) in November corresponds to stronger diabatic cooling and increased snow accumulation over Siberia in November and December, which may strengthen the SH in December via the positive feedback of snow albedo. The dynamic mechanisms between the higher SSD in November and weaker SH in January are further investigated from the perspective of troposphere–stratosphere interaction. Such anomalously higher SSD with strong upward heat flux induces the upward-propagating wave activity flux in November and December over the Urals and Siberia, leading to a weaker and warmer stratospheric polar vortex in January. Subsequently, the anomalies of the stratospheric polar vortex signal propagate downwards, giving rise to a negative Arctic Oscillation–like structure in the troposphere and a weakening of the SH in January. This mechanism can be partly reproduced in CMIP6. Additionally, the variability of the September–October Arctic sea ice mainly leads to coherent variations of the SH in December and January via the eddy–mean flow interaction before 2000. Furthermore, the preceding November snow cover over Siberia enhances the intraseasonal prediction skill for the winter SH after 2000. Meanwhile, considering the previous November SSD, the prediction accuracy for the out-of-phase change in the SH between December and January increases from 16% (outputs of the NCEP’s Climate Forecast System, version 2) to 75%.
Introduction
The Siberian high (SH), a center of seasonal activity, is formed in the lower troposphere over Eurasia during the wintertime as a result of surface radiative cooling and large-scale descending motion (Ding and Krishnamurti, 1987; Sahsamanoglou et al., 1991; Xie et al., 1992). As one of the main components of the East Asian winter monsoon (EAWM), the winter SH exerts a significant influence on the variability of Eurasian surface air temperature (SAT) and precipitation during the wintertime (Lu and Chang, 2009; Hasanean et al., 2013; Iqbal et al., 2013; Lei and Wu, 2017; Riaz and Iqbal, 2017). In the context of global warming, extreme climate events occur more frequently in winter over Eurasia. For instance, the SH rapidly strengthened during late January and early February, triggering an extreme cold event in Asia from 17 January to February 1, 2012 (Wu et al., 2017). Hence, improving our understanding of the variability of the winter SH is important for the prediction of Eurasian climate.
Some studies have revealed that the winter SH is affected by the internal variability of the atmosphere and underlying variation. Zeng et al. (2015) revealed that the location of the North Atlantic storm track is strongly related to the winter SH. Besides, the decrease in the Arctic sea-ice concentration (SIC) in the preceding September can strengthen the winter SH via the eddy–mean flow interaction (Wu et al., 2011). Li and Lan (2017) pointed out that a warmer sea surface temperature (SST) in the North Atlantic noticeably intensifies the Ural blocking ridge, resulting in a stronger winter SH. Cohen et al. (2001) investigated the connection between the Eurasian snow-cover extent (SCE) and variabilities of the SH. Based on these significant factors and relatively low prediction skill of the winter SH, a highly efficient prediction model was constructed (Yang and Lu, 2014; Yang and Fan, 2021). Although the wintertime average SH is very important, it is easy for it to mask the characteristics of intraseasonal variation, meaning intraseasonal predictions of the SH are more challenging.
Chang and Lu (2012) indicated that the SH exhibits out-of-phase relationships between November and December–January since 1979. They suggested that this intraseasonal phase reversal may be related to the relatively lower frequency of Pacific and Ural blocking events during a positive Arctic Oscillation (AO) phase. Moreover, Lu et al. (2019) further traced the reversal response of the SH in November and December–January to preceding autumn sea-ice variations. There is a significant positive (negative) correlation between the November (December–January) SH and the previous September Arctic SIC via eddy energy and wave activity flux (WAF). Additionally, the intraseasonal variabilities of the SH in the upper-level troposphere are linked to the blocking ridge with Atlantic-origin and Pacific-origin Rossby waves (Takaya and Nakamura, 2005a; Takaya and Nakamura, 2005b; Lei et al., 2018). Yang et al. (2021) found that a difference exists in the prediction skill for the monthly SH during November–February. The Climate Forecast System, version 2 (CFSv2), can skillfully predict the SH only in November, the reason for which is that CFSv2 can reproduce the connections between the SH and both the regional snow cover and thermodynamic process in November. However, these studies mainly focused on the December–January average SH, paying little attention to monthly reversals of the SH in December and January.
Sahsamanoglou et al. (1991) showed that the intensity and variability of the SH are strongest in December and January. Recent studies have shown that the East Asian winter SAT exhibits variability reversals in December and January–February (Hu et al., 2005; Huang and Hu, 2006; Zuo et al., 2015; Xu et al., 2018). Hu et al. (2005) indicated that the relationship between the polar vortex and extratropical SAT displays near opposite tendencies between early winter (November–December) and late winter (February–March). Another study, meanwhile, indicated that the interannual and decadal trends of the SAT reversal also exist in China (Huang and Hu, 2006). Besides, Zuo et al. (2015) revealed an out-of-phase variation in the relationship between the winter AO and southern China SAT anomalies in December and January–February. For instance, warmer conditions in the prior December and a colder January were accompanied by a reversal in the phase of the AO in 2015 over China (Si et al., 2016). Dai et al. (2019) pointed out that the out-of-phase change between December and January–February over Northeast China may be attributable to the variability of the SIC in the preceding November over the Davis Strait–Baffin Bay and Barents–Kara Sea regions via Arctic-midlatitude tropospheric and stratospheric processes. Besides, when the reversal of the East Asian SAT exhibited relatively colder anomalies in the previous December and warmer anomalies in January–February of 2015, the SH indices in December, January and February were 0.7, −1.3 and −0.6, which demonstrated an out-of-phase SH in December and January in 2015 (Xu et al., 2018). Therefore, the monthly reversal of the SH in December and January is worthy of discussion towards improving the intraseasonal prediction of the Eurasian climate.
The winter SH is a vital characteristic of the EAWM. Some studies have indicated that the intraseasonal variations of the EAWM might be affected by certain atmospheric circulation systems, including geopotential height anomalies related to the AO (Si et al., 2016), blocking high activities over the North Pacific (Si et al., 2014), and the polar vortex of the Northern Hemisphere (Wang et al., 2013). Besides, the connections between El Niño–Southern Oscillation (ENSO) and the EAWM can be found on seasonal and intraseasonal time scales (Li, 1990; Zhang et al., 1996; Webster et al., 1998; Li et al., 2021). Tian and Fan (2020) pointed out that the prediction skill for the EAWM in early winter (November–December) is higher than in late winter (January–February), due to the weakening relationship between ENSO and the EAWM in late winter. As the Arctic warming has reached rates that are double that of the global average, the influence of the Arctic on the mid-to-high latitude climate has been strengthened (Francis and Vavrus, 2012; Kug et al., 2015). Meanwhile, the EAWM serves as a crucial bridge connecting the Arctic sea-ice concentration (ASIC) and intraseasonal SAT over East Asia (Xu et al., 2018; Dai et al., 2019).
Wegmann et al. (2015) revealed that the decline in sea-ice cover over the Barents–Kara Seas serves as a moisture source for the increasing Siberian snow cover. Meanwhile, the Eurasian snow cover is closely associated with the Eurasian climate on different time scales (Gong et al., 2007; Li and Wang, 2014; Ao and Sun, 2016; Li et al., 2020). Snow cover variations over Eurasia impact the atmospheric circulation through thermal and dynamic effects. From the thermal perspective, the simultaneous Eurasian snow cover can directly affect local atmospheric circulations through surface radiative effects (Cohen and Rind, 1991; Chen and Sun, 2003; Jeong et al., 2011). And from the dynamical perspective, as a major source of vertical WAF, the Siberian snow cover during autumn can influence the following-winter AO, East Asian precipitation, and predominate modes of Eurasian SAT via troposphere–stratosphere interaction (Cohen et al., 2001; Cohen et al., 2010; Han and Sun, 2020). The extreme cold events in 2010 had a significant connection with the preceding autumn snowpack and stratospheric polar vortex (Cohen et al., 2010). Furthermore, the November snow cover plays an important role in the intraseasonal climate over Eurasia. Northern Eurasian snow cover in November, linked to stationary planetary waves, demonstrates a significant impact on the warm Arctic–cold Eurasia pattern during the following January (Xu et al., 2017). Meanwhile, November snow depth (SD) plays an important role in intraseasonal precipitation in southern China during 6–15 January (Li et al., 2020).
Due to the frequent occurrence of monthly climate transitions in December and January over East Asia, this study further investigates the intraseasonal reversal of the SH between December and January and its connections with Siberian snow cover. The possible physical mechanisms underlying this link are also revealed from snow-related thermal and dynamical effects to improve the prediction skill for the winter SH and Eurasian SAT on the intraseasonal timescale.
The remainder of the paper is structured as follows. The data and methods used are described in Data and Methods Section 2. Month-To-Month Variability of the Siberian High and Their Imapct on Eurasian Climate reveals the out-of-phase variations of the SH in December and January and their impact on Eurasian SAT and precipitation. In Reversal Response of November Snow Cover over the Siberia to the December and January Siberian High, the explicit linkage and physical mechanisms between the out-of-phase variation of the SH and November snow cover after 2000 are discussed. Meanwhile, results based on CMIP6 are also illustrated in this section, to verify the physical mechanisms. Connection Between Autumn Arctic Sea-Ice Concentration and a Coherent December and January Siberian High demonstrates the relationship between the autumn Arctic SIC and coherent variability of the SH in December and January before 2000. A preliminary application of November SD in the intraseasonal prediction of the SH is presented in Intrarseasonal prediction of the Siberian High in December and January Based on Siberian snow depth and Arctic Sea-Ice Concentration. And finally, a summary and some further discussion are provided in Conclusion and Discussion.
Data and Methods
Data
The atmospheric reanalysis data from National Centers for Environmental Prediction/National Center for Atmospheric Research (NCEP/NCAR) were obtained, including the monthly mean SLP, SAT, geopotential height, zonal and meridional wind, at a resolution of 2.5° × 2.5° (Kalnay et al., 1996). The surface heat flux was also adopted, as the sum of surface sensible and latent heat flux, using the NCEP/NCAR data, compiled on a Gaussian grid. Meanwhile, the daily mean geopotential height with 17 levels was adopted to analyze the vertical propagation of the stratospheric polar vortex signal.
The monthly SD data used in this study were derived from the ECMWF (European Center for Medium-Range Weather Forecasts) interim reanalysis datasets, with a horizontal resolution of 1° × 1°, for the period 1980–2019 (Dee et al., 2011). Meanwhile, the observing SD data were provided by the Canadian Meteorological Centre (CMC), on a 706 × 706 cell grid from 1998 (Brown and Brasnett, 2010, updated anually). To facilitate the analysis, the SD was interpolated onto a 1° ×1 ° regular grid. The SCE data in the Northern Hemisphere, on an 89 × 89 cell grid, were obtained from the Rutgers University Global Snow Lab (Robinson et al., 1993). These data were then interpolated onto a 2.5° × 2.5° regular grid for further analysis. The monthly averaged SIC data were taken from the Met Office Hadley Center for Climate Prediction and Research, at a resolution of 1° × 1° (Rayner, 2003). The monthly averaged precipitation data are provided by GPCP (Huffman et al., 1997). In addition, outputs from the historical-simulation experiments of four models (BCC-CSM2, CanESM5, CESM2 and MIROC-ES2L) from phase 6 of the Coupled Model Intercomparison Project (CMIP6) were employed to test the physical mechanisms between the reversed SH and preceding November Siberian snow cover (Eyring et al., 2016). The selection of the CMIP6 models was primarily driven by their capability of reproducing the increase in the reversal frequency of the SH between December and January after the year 2000. To examine the prediction skill for SH reversal between December and January in November, CFSv2, an atmosphere-ocean-sea ice-land model, is released in November, which means the CFSv2-predicted data are employed at a 1-month lead for the December SH and at a 2-months lead for the January SH (Saha et al., 2014). The CFSv2 data are interpolated from the resolution of 1° × 1° onto a 2.5° × 2.5° grid. The linear trends of all data were removed prior to analysis.
In this study, we focus on the monthly variability of the SH in December and January. The intensity index of the winter SH (SHI) is defined as the normalized regional-averaged SLP (40°–60°N, 70°–120°E) to describe the monthly variability of the SH in midwinter (Gong and Ho, 2002). The midwinter period is defined as December in the previous year and January (DJ) in the current year. In this study, the midwinter seasons of 1981–2019 are used. When the SH in each midwinter (DJ) presents a positive–negative pattern (SH+−, anomalously warmer than normal in December and colder than normal in January), this study records it (SH+−) as the positive phase of this event. Correspondingly, a negative–positive pattern (SH−+) event of the SH in midwinter is recorded as the negative phase of this event.
Methods
Composite difference analysis and one-dimension linear regression were applied to discuss the relationship and its linkage between the November SD and December and January SH. The t-test was used to verify the statistical significance of the linear regression and composite difference analysis results.
The stratosphere–troposphere interaction was diagnosed by the vertical and zonal components of Plumb (1985)’s WAF:
In these equations,
Fourier transformation was also used, to obtain the zonal wavenumber-1 component of variable y, as follows:
where
Results
Month-To-Month Variability of the Siberian High and Their Impact on Eurasian Climate
The monthly SH intensity in midwinter (DJ) during 1980/81–2018/19 is depicted in Figure 1A. There are 18 years in which the SHI demonstrates reverse variations (red bars in Figure 1A) between December and January during the past 39 years. The composite difference in SLP in December and January between eight SH+− years (1981/82, 1993/94, 2001/02, 2002/03, 2003/04, 2012/13, 2014/15, 2018/19) and ten SH−+ years (1982/83, 1989/90, 1992/93, 1997/98, 2006/07, 2007/08, 2008/09, 2009/10, 2010/11, 2015/16) further confirms the transition is significant over the entire SH region (Figures 1B,C). This out-of-phase phenomenon has a pronounced influence on the SAT reversal between December and January over East China and Mongolia (Figures 1D,E). Under the circumstances, while the precipitation over the Urals increases in December, it correspondingly decreases over the Urals in January, and vice versa (Figures 1F,G). Hence, the out-of-phase variation of the SH exerts a noticeable effect on the East Asian climate.
FIGURE 1
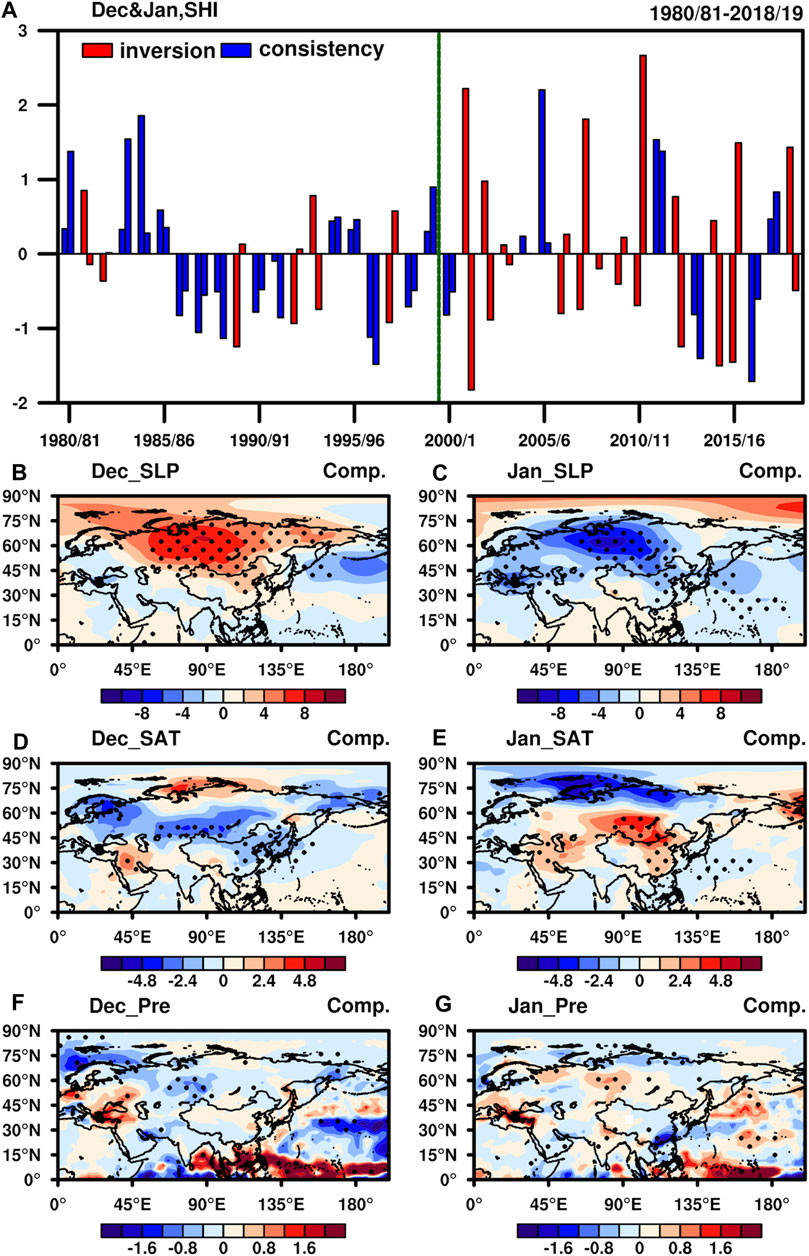
FIGURE 1. (A) Siberian high intensity index (SHI) in each midwinter month (December, January) during 1980/81–2018/19. Composite spatial patterns of variables between SH+− and SH−+ for (B, D, F) December and (C, E, G) January during 1980/81–2018/19: (B, C) sea level pressure (SLP, units: hPa); (D, E) surface air temperature (SAT, units: °C); (F, G) precipitation (units: mm/day). Years of other reversal types of SH are shaded by red bars, and consistent types are shaded by blue bars in (A). Dotted regions in (B–G) are statistically significant at the 90% confidence level, based on the t-test.
We can see that 12 transitions occurred after 2000, whereas only 6 reversals occurred before 2000. Correspondingly, the monthly reversal frequency of the SH significantly increases after 2000 from 30% (1980/81–1999/2000) to 63% (2001–2019). The temporal correlation coefficient (TCC) of the SHI between December and January is −0.30 during 2000/01–2018/19 and 0.39 (significant at the 10% significance level) during 1980/81–1999/2000 (Table 1). In addition, a singular value decomposition (SVD) analysis between the December and January SH was applied to reveal the spatial structure of their coupled relationship (figure not shown). The first SVD mode (SVD1) can explain 90% of the covariance and has an out-of-phase pattern with the maximum amplitudes in the Lake Baikal region during 2000/01–2018/19. However, SVD1 can explain 85% of the covariance and presents a coherent pattern with the different maximum amplitudes in the Lake Baikal (December) and Balkhash (January) regions during 1980/81–1999/2000. Therefore, this study focuses on the out-of-phase variation of the SH after 2000 and reveals its possible causes.
TABLE 1
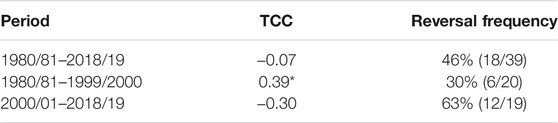
TABLE 1. Temporal correlation coefficient (TCC) and reversal frequency of the Siberian high intensity index between December and January.
Reversal Response of November Snow Cover over the Siberia to the December and January Siberian High
Features and Importance of November Snow Cover Over the Siberia
Jeong et al. (2011) indicated that an increase in Eurasian snow cover in late autumn intensifies the surface radiation cooling, strengthening the winter SH. However, many researchers have presented that the anomalous Eurasian snow cover in autumn can generate variations of AO-like circulation during winter (Saito et al., 2001; Gong et al., 2003; Lu et al., 2020). Hence, autumnal Eurasian snow cover may be connected to SH reversal in December and January after 2000.
Climatologically, the snow cover expands southwards from September to January. The Eurasian SCE (50°–80°N, 30°–150°E) is nearly 90% in the north of 50°N in November, which causes little variability in wintertime (Wu and Kirtman, 2007). Thus, the SD can be used to describe the temporal evolution of snow and the interannual variability from November to the following winter. The composite differences of SD in the preceding November between SH+− years and SH−+ years are examined for the period 2000–2018. The most significant positive SD anomalies over western Siberia and negative SD anomalies over northern Siberia occur in November, based on the CMC dataset (Figure 2A). Meanwhile, the composite difference in the November SD presents similar results from ECMWF (Figure 2B). This means that the November snow cover anomalies over Siberia in the previous November might be attributable to SH+−/SH−+ events after 2000.
FIGURE 2
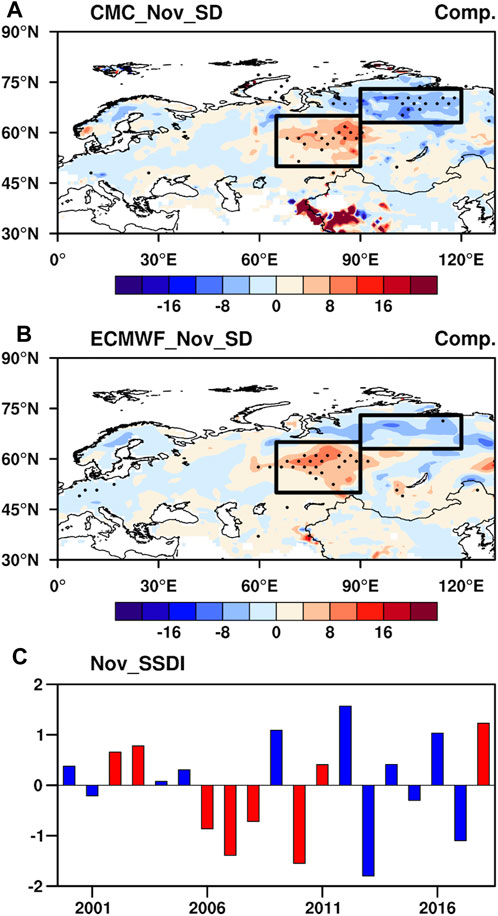
FIGURE 2. Composite spatial patterns of snow depth (SD, units: mm) in the previous November between SH+− and SH−+ for two datasets during 2000/01–2018/9: (A) Canadian Meteorological Centre (CMC) data; (B) ECMWF (European Center for Medium-Range Weather Forecasts) interim reanalysis data. (C) Normalized time-series of Siberian snow depth index (SSDI) based on CMC. Dotted regions in (A, B) are statistically significant at the 90% confidence level, based on the t-test. The black rectangle represents the key area of Siberian snow depth (SSD) [(50°–65°N, 65°–90°E), (63°–73°N, 90°–120°E)] in (A,B). Years of heaviest (lightest) SSD corresponding to SH+− (SH−+) are shaded by red bars in (C).
SVD analysis was performed to examine the main coupled modes of covariability of the November SD between western and northern Siberia. In SVD1, the two regions are in reverse mode, which is also reflected in the composite results (figure not shown). The correlation coefficient of the expansion time-series between the two areas is 0.75 (significant at the 0.1% level). Furthermore, the percentage variance explained by SVD1 is 73.26%, indicating the November SD over western and northern Siberia shows coherent variations. Therefore, the Siberian SD (SSD) index (SSDI) is defined as the normalized and detrended area-averaged SD difference between western Siberia (50°–65°N, 65°–90°E) and northern Siberia (63°–73°N, 90°–120°E).
To further confirm the linkage between anomalous SSD and SH reversal in December and January, the six heaviest (2002/03, 2003/04, 2009/10, 2012/13, 2016/17, 2018/19) and six lightest (2006/07, 2007/08, 2008/09, 2010/11, 2013/14, 2017/18) years of SSD in the previous November were selected based on them exceeding ±0.5 standard deviations (Table 2). Pertinently, the four heaviest (four lightest) SSD years correspond to four SH+− (four SH−+) years. We denote these eight events as SSDH–SHI+− (2002/03, 2003/4, 2012/13, 2018/19) or SSDL–SHI−+ (2006/07, 2007/08, 2008/09, 2010/11) for the following discussion (Table 2). Notably, the previous November SSD is significantly correlated with January SH, with a correlation coefficient of −0.43 (exceeding the 90% confidence level) during 2000/01–2018/19. The TCC between the November SSDI and December SHI is 0.32 which demonstrates a contrary effect compared with the January SH. Thus, we may infer that the out-of-phase change in the SH between December and January increases after 2000, which may be attributable to SSD anomalies.
TABLE 2

TABLE 2. The SH reversal years in December and January and the SSD anomalous years in preceding November during 2000/01 -2018/19.
Mechanisms
To systematically explore the mechanism of the reverse response between December and January from long-term trends and extreme anomalous conditions, linear regression and composite difference results were considered together. Linear regression on the preceding November SSD was employed to investigate the snow cover–related atmospheric circulation. Meanwhile, the connected preceding and current atmospheric circulation of the SH reversal in the context of anomalous snow cover was also used, to investigate the composite difference analysis results between SSDH–SHI+− and SSDL–SHI−+.
December Siberian High
Due to higher albedo and lower thermal conductivity, the snow albedo feedback (SAF) exerts an important impact on global climate change sensitivity and regional climate change over the heavily populated Northern Hemisphere continental regions (Bony et al., 2006; Soden and Held, 2006). Hall and Qu (2006) pointed out that SAF is appropriate to reveal short-term climate change as follows. With the melting of snow, darker ground is exposed, which leads to more absorption of solar radiation. More longwave radiation can alter the warmer regional SAT and the cloudiness, which then results in a warmer condition and strong absorption of shortwave radiation. Thus, the snow cover further decreases.
Based on the theory of SAF, the response November snow cover to the following December SH is discussed. When the November snowpack deepens with high snow albedo over Siberia (figure not shown), the significant radiative cooling strengthens over Northwest Eurasia, extending from west of the Urals to eastern Siberia in November (Figures 3A,B). Land–atmosphere coupling coincides significantly with the SSD variability center over the Siberian region along 40°–70°N, while Siberia is mainly located in the snow transition regions at the southern edge of the snow-covered region along 40°–60°N. Hence, with markedly lower SAT in November, the SCE increases in the west of Siberia and south of Lake Baikal (Figures 3C,D), which leads to a stronger radiative cooling (Figures 3E,F). Correspondingly, the SD increases over Siberia in the following December (Figures 4A,B), leading to a coherently lower soil temperature mode over Siberia from deep to shallow layers, especially in the anomalous SSD–SH years (Figures 4C,D). As the surface soil temperature (0–10 cm) tends to be decreased, the atmospheric absorption of longwave radiation flux weakens. Ding and Krishnamurti (1987) indicated that the effect of adiabatic cooling on the development of high pressure in Siberia. However, there is a balance between adiabatic heating and diabatic heating below 500 hPa, which makes the heat distribution in Siberia mainly is affected by radiative cooling. Therefore, the radiative cooling over Siberia tends to be further intensified (Figures 4E,F). This condition could result in more accumulation of cold air masses over Siberia (Figures 4G,H). Subsequently, the December SH can be strengthened (Figures 4I,J).
FIGURE 3
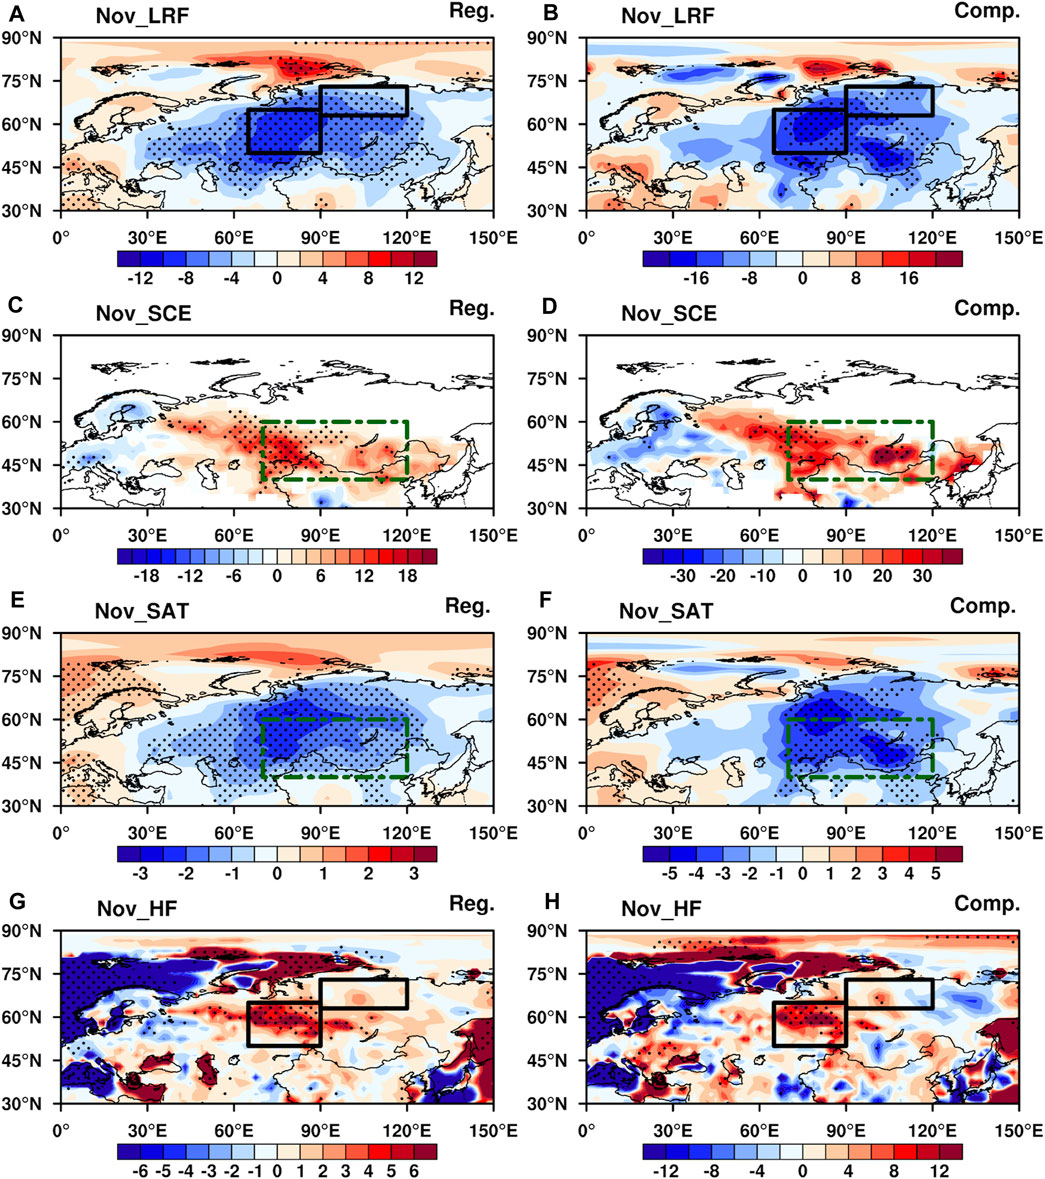
FIGURE 3. (A, C, E, G) Regression of variables on the Siberian snow depth index (SSDI) and (B, D, F, H) results of composite differences in variables between SSDH–SHI+− and SSDL–SHI−+ in November during 2000–2018: (A, B) upward long-wave radiation flux (units: W m−2); (C, D) snow cover extent (SCE; units: %); (E, F) surface air temperature (SAT; units: °C); (G, H) heat flux (units: W m−2). Dotted regions are statistically significant at the 90% confidence level, based on the t-test. The black rectangle represents the key area of Siberian snow depth (SSD) [(50°–65°N, 65°–90°E), (63°–73°N, 90°–120°E)] in (A, B, G, H). The green dotted rectangle represents the key area of the Siberian high (SH) (40°–60°N, 70°–120°E) in (C–F).
FIGURE 4
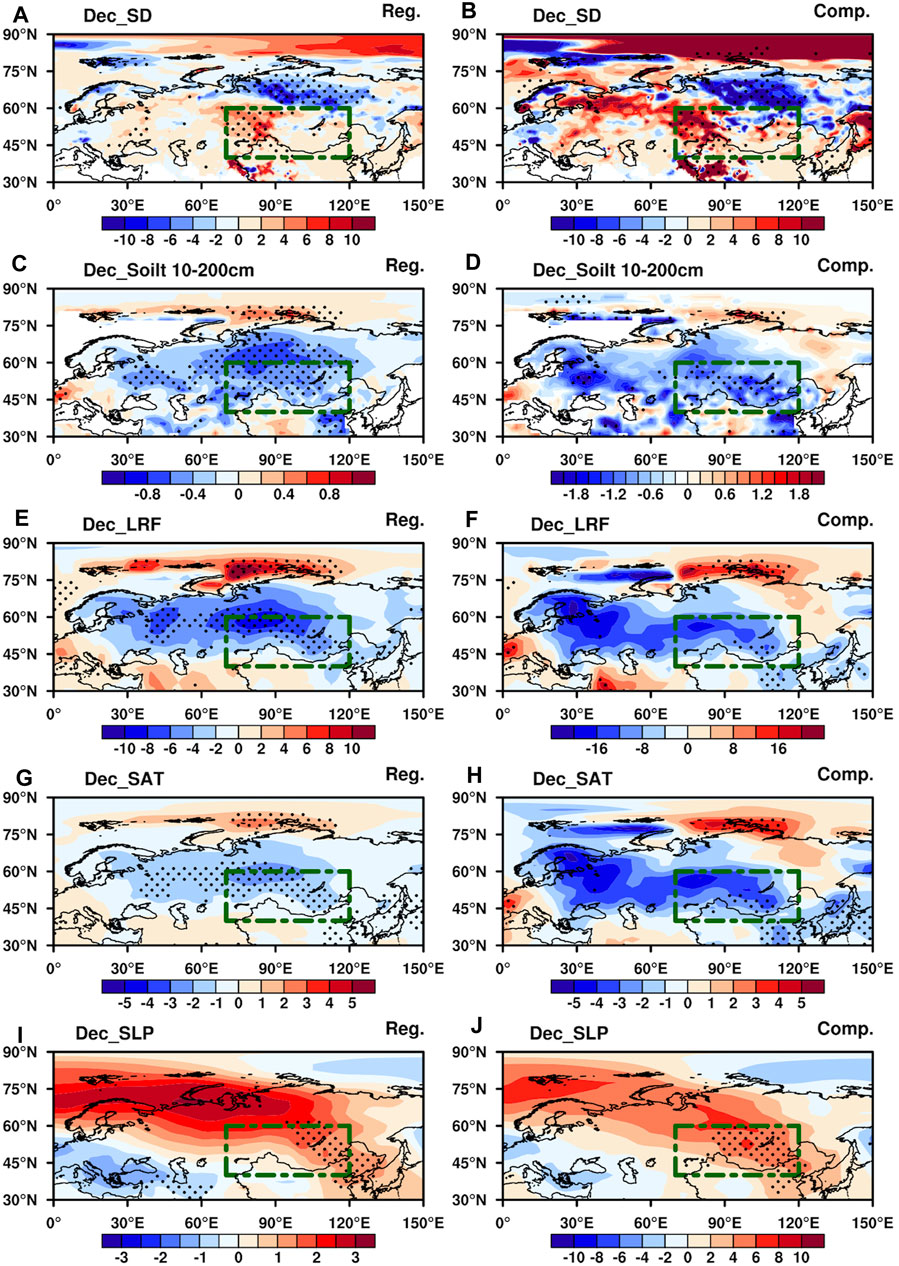
FIGURE 4. (A, C, E, G, I) Regression of variables in December on the November SSDI and (B, D, F, H, J) results of composite differences in variables in December between SSDH–SHI+− and SSDL–SHI−+ in December during 2000–2018: (A, B) SD (units: mm); (C, D) 10-200 cm soil temperature (units: K); (E, F) upward long-wave radiation flux (units: W m−2); (G, H) SAT (units: °C); (I, J) SLP (units: hPa). Dotted regions are statistically significant at the 90% confidence level, based on the t-test. The green dotted rectangle represents the key area of the SH (40°–60°N, 70°–120°E).
January Siberian High
Various studies have indicated the cross-month impact of autumn SCE via the tropospheric and stratospheric response (Wagner, 1973; Cohen and Rind, 1991; Xu et al., 2017; Han and Sun, 2021). Meanwhile, the autumn SCE has also been applied to develop prediction models of the winter SAT of the extratropical Northern Hemisphere (Cohen and Fletcher, 2007). Ringler and Cook (1999) showed that diabatic heating can influence the interannual variations of WAF. With strong surface radiation cooling, the upward WAF enhances (Plumb, 1985). That means the vertical WAF is concentrated on the region where the highest gradient in SAT and heat flux. Besides, the Eurasian continent, especially the area around Siberia, is the major source of vertical WAF. Thus, we further discuss how the November snowpack relates to January atmospheric circulation from the perspective of troposphere–stratosphere interaction.
The planetary wave is a viable physical variable to reveal the response between the stratosphere and troposphere. Research has shown that the climatological-mean Northern Hemispheric stationary waves over the middle latitudes propagate upwards from the lower troposphere. Meanwhile, when planetary waves propagate across the tropopause, they divided into two branches. One continues to propagate upwards along the polar waveguide into the stratosphere, while the other propagates southwards into the troposphere along the low-latitude waveguide (Dickinson, 1968). Xu et al. (2017) found that zonal wavenumber-1 plays a dominant role in connecting the October northern Eurasian SCE and following January Eurasian SAT.
When the SSD deepens in November with high albedo and low heat conductivity, the surface radiation cooling strengthens (Figures 3A,B and Figure 4E,F). This causes the November upward heat flux to increase, especially over western Siberia (Figures 3G,H). Eliassen and Palm (1960) indicated that heat flux can be used not only to describe its poleward transportation but also to represent upwelling tropospheric wave energy into the lower stratosphere. Correspondingly, the upward WAF originates and propagates from the troposphere to the stratosphere in November over western Siberia with the strong temperature gradient in 65°–90°E (Figures 5A,B). With the SD further increasing, the upward propagation is still in December. the monthly increment of Siberian snow cover from November to January is 27.7, 5.5 and 0.2%, which represents the difference of month-to-month variation (defined as the current month of SCE minus that of the previous month). However, the monthly increment of December snow cover is much smaller compared with that in November, resulting in weak surface heat flux anomaly. The upward WAF from the tropopause to the upper stratosphere relatively weakens in that month (Figures 5C,D).
FIGURE 5
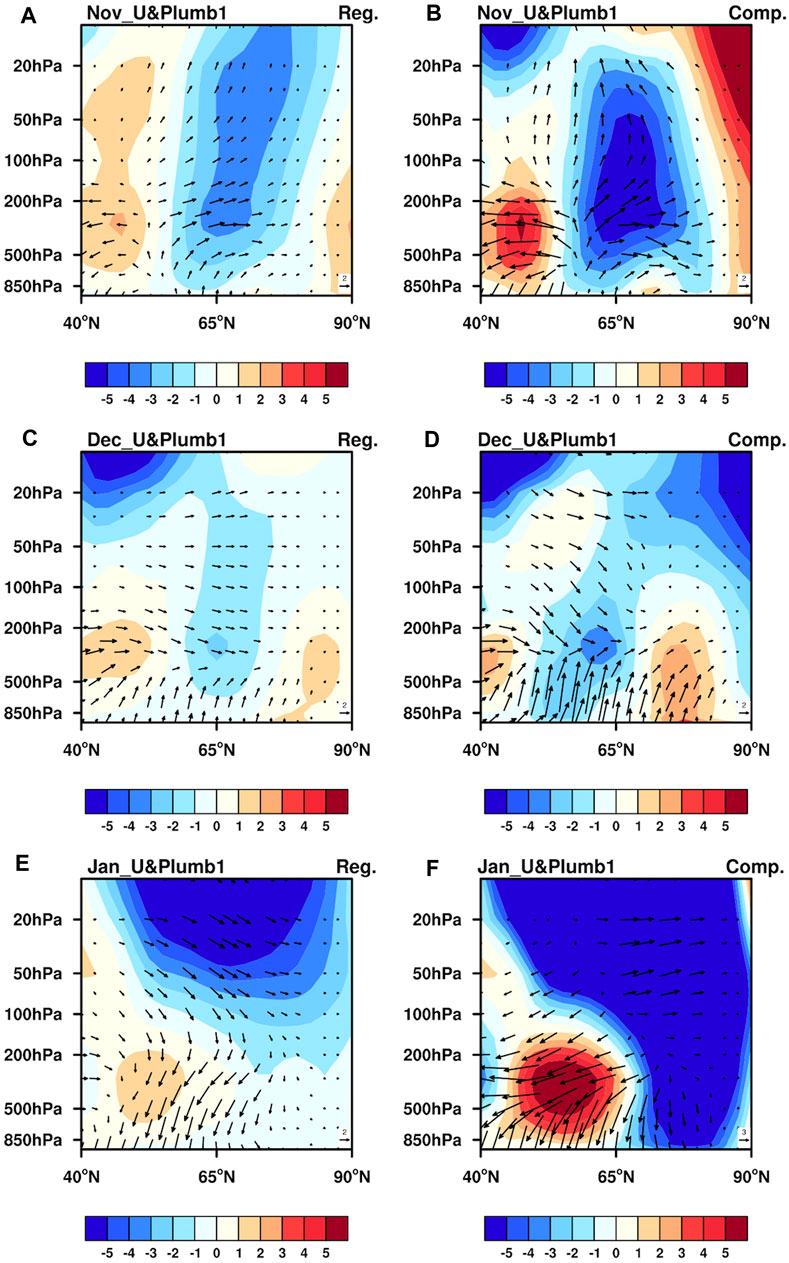
FIGURE 5. (A, C, E) Regressions of zonal wind (shading; units: m s−1) anomalies and the associated wavenumber-1 wave activity flux (WAF; vectors; units: m2 s−2) for November to January on the November SSDI and (B, D, F) results of composite differences between SSDH–SHI+− and SSDL–SHI−+ during 2000/01–2018/19: (A, B) November (averaged between 65°E and 90°E); (C, D) December (averaged between 65°E and 90°E); (E, F) January (averaged between 90°E and 120°E).
Scott and Polvani (2006) indicated that the variability of stratospheric polar vortex is influenced by radiative cooling and wave, like a cycle. With the stratospheric polar vortex becoming warm and weak from December to January (Figures 6A–D), the upward wave propagation is suppressed. The anomalies of the stratospheric polar vortex signal propagate downwards in January (Figures 7E,F). Some research also presented that the influence of anomalous stratospheric signals on tropospheric surface weather via AO anomalies propagation downwards (Baldwin and Dunkerton, 1999; Black, 2002). Large amplitude AO anomaly in the stratosphere affects storm track, tropospheric jet, and then surface weather (Kidston et al., 2015). To further present the downward propagation and influence of the anomalous signal of SSD-related stratospheric polar vortex, Figures 7A,B show the time–pressure cross-section of composite differences of the area-averaged geopotential height anomalies in the region poleward of 70°N and the Northern Annular Mode index [NAM index, defined by the normalized time coefficient of the first EOF mode of zonal-mean (20°–90°N) geopotential height anomaly (Baldwin and Dunkerton, 2001)] on the daily scale. The polar vortex anomalous signal can extend from stratosphere to troposphere (Figure 7A). Meanwhile, the anomalously negative Arctic Oscillation–like pattern of downward propagation may make the easterlies anomaly over polar and the westerlies over Northern Eurasia at 300 hPa, which hinder the cold air masses accumulation over Siberia in January (Figures 6E,F, 7B) (Zeng et al., 2015). Thus, the SH weakens in January (Figures 7F,G).
FIGURE 6
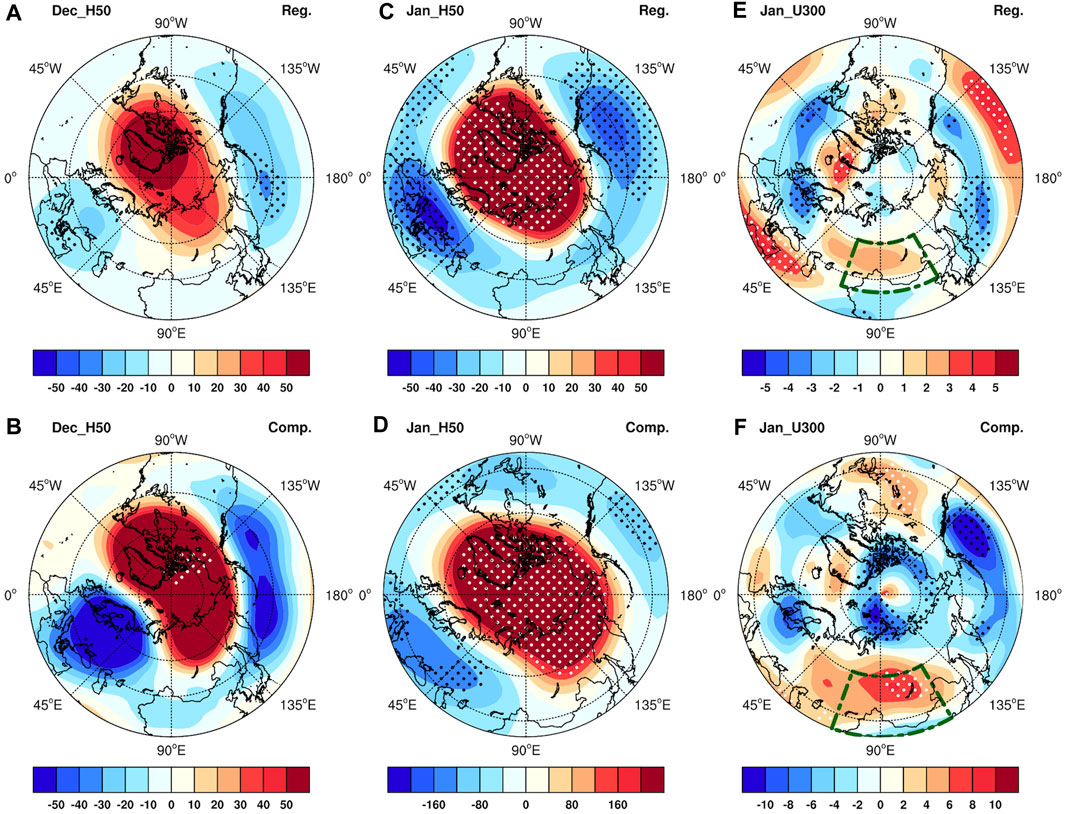
FIGURE 6. (A, C, E) Regressions of variables on the November SSDI and (B, D, F) results of composite differences between SSDH–SHI+− and SSDL–SHI−+ during 2000/01–2018/19: (A, B) December geopotential height at 50 hPa (units: gpm); (C, D) January geopotential height at 50 hPa (units: gpm); (E, F) January zonal wind at 300 hPa (units: gpm). Dotted regions are statistically significant at the 90% confidence level, based on the t-test. The green dotted rectangle represents the key area of the SH (40°–60°N, 70°–120°E) in (E, F).
FIGURE 7
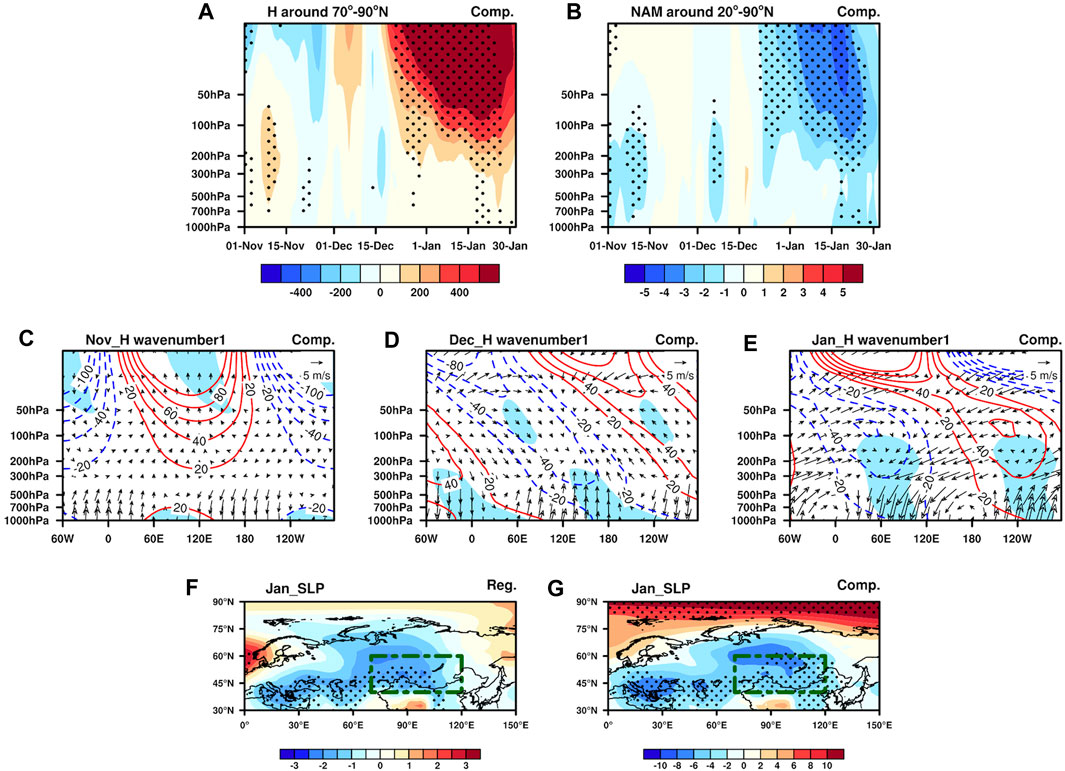
FIGURE 7. Composite spatial patterns of variables between SSDH–SHI+− and SSDL–SHI−+ during 2000/01–2018/19: (A) time–pressure cross-section in the area-averaged geopotential height anomalies (units: gpm) in the region poleward of 70°N; (B) time–latitude cross-sections of the meridional component of Northern Annular Mode index (the normalized time coefficient of the first EOF mode of zonal-mean (20°–90°N) geopotential height anomaly); (C–E) zonal wavenumber-1 distribution of geopotential height (contour, units: gpm) and WAF (vectors, units: m2 s−2) along a section at 50°–70°N in (C) November, (D) December and (E) January.; (F) Regression of variables on the SSDI and (G) results of composite differences in January SLP between SSDH–SHI+− and SSDL–SHI−+; Dotted (A, B, F, G) and shaded (C–E) regions are statistically significant at the 90% confidence level, based on the t-test.
In years of both Siberian reversal and SSD anomalies, the troposphere–stratosphere coupling over Siberia can also be analyzed over Eurasia. The temporal evolution of the zonal wavenumber-1 structure of geopotential height and WAF along the strong heat flux anomalous area at 50°–70°N is presented in Figures 7C–E during November–January. As the SSD is higher, the significantly negative anomalies over the northern Atlantic extend from the upper stratosphere to the surface in November and tilt eastwards with height due to the quasi-geostrophic linear dynamics (Charney and Drazin, 1988). Positive anomalies develop from the Siberian stratosphere to the East Asian and Pacific troposphere. The upward WAF is concentrated over western Siberia with the strong temperature gradient in 65°–90°E (Figure 7C). However, the troposphere–stratosphere interaction is weaker over Siberia (70°–120°E) in December, which may be influenced by the smaller monthly increment of December Siberian snow cover. Meanwhile, the upward WAF concentrates on troposphere and lower stratosphere in December (Figure 7D). In January, a close troposphere–stratosphere connection can be found with a downward propagation of the stratospheric polar vortex signal, which has a weak projection on the weak East Asian trough and Ural high (Figure 7E). The strong troposphere–stratosphere interaction and relatively tropospheric circulation may induce a weak SH in January (Figures 7F,G).
Validation by Model Simulation
To test whether numerical models can reproduce the reverse response of the SH to November snow cover, the historical simulation experiments from CMIP6 were used for the period 1985–2014. Specifically, we selected the first group of historical simulation experiments of 27 models that contain SLP, SD and Hgt50. Based on the limited prediction skill for the SH in wintertime (Yang et al., 2021), there are only four models (BCC-CSM2, CanESM5, CESM2, MIROC-ES2L) that can reproduce the frequency of SH reversal after 2000 being 15% higher than that before 2000.
To further verify the physical mechanisms, we examine the snow cover response in the preceding November between SHI+− and SHI−+ using 3–30 groups of historical simulation experiments from the four models that can reproduce the reversal decadal variations. The results show that the first group of BCC-CSM2 and the thirteenth group of CanESM5 can partly reproduce the November SSD anomalies over Siberia while the SH reversal occurs (Figures 8A,B). Furthermore, the seventh to the ninth group from CESM2 also partly present the SSD anomalies in November. The simple ensemble CESM2 model (averaged seventh to ninth group results) can reproduce significant November SD anomalies over western and eastern Siberia in the reversal years (Figure 8C). The stratospheric polar vortex is relatively warmer and weaker in December and January in the above experiments (figure not shown). Thus, the reversal response of SSD to the SH in December and January can be partly reproduced in some of the simulation experiments, especially in CESM2.
FIGURE 8
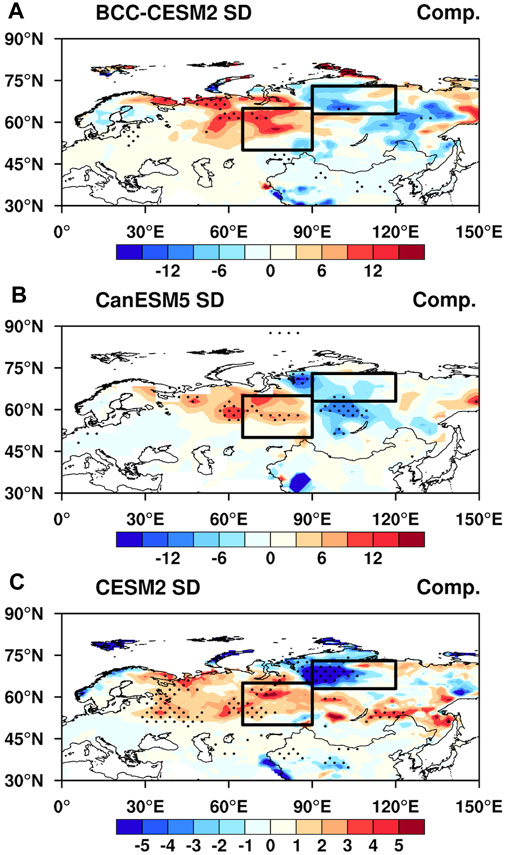
FIGURE 8. Composite spatial patterns of SD (units: mm) in November between SH+− and SH−+ in each model during 2000–2018: (A) first group of BCC-CSM2; (B) thirteenth group of CanESM5; (C) ensemble (seventh to ninth group) of CESM2. Dotted regions are statistically significant at the 90% confidence level, based on the t-test. The black rectangle represents the key area of SSD [(50°–65°N, 65°–90°E), (63°–73°N, 90°–120°E)].
Connection Between Autumn Arctic Sea-Ice Concentration and a Coherent December and January Siberian High
Wu et al. (2011) indicated a relationship between autumn sea ice and the winter SH via changes in the thermal gradient between the Arctic and mid-to-high latitudes. Lu et al. (2019) revealed the impact of September–October ASIC on the intraseasonal reversal of the November and December–January SH during 1979–2015. It is suggested that the reduction in September SIC can persist into November and induce upward surface heat flux anomalies, which can enhance the transportation of eddy energy and WAF to mid-to-high latitudes. This benefits the development of the storm track over northeastern Europe in November. On the contrary, decreased heat flux anomalies and suppressed eddy energy hinder the growth of the storm track in December–January, which weakens storm track activities and Ural blocking. The accelerated westerlies prevent the transportation of cold air masses from the Arctic to Siberia, leading to less accumulation in the region (Chang and Lu, 2012; Zeng et al., 2015). The winter SH tends to be mainly weakened in December–January. The researchers also consider that the SH in December and January exhibits consistent variations.
Based on the connection between SH and SIC, we further explore its relationships between the September–October SIC and SH in December and January respectively during 1981–2000 and 2001–2019. As Figures 9A,B shown, the September–October SIC around the Barents to Laptev Sea has a significantly negative correlation with the SH in December and January during 1981–2000. However, the negative correlation of sea ice around the Barents Sea in the period of 2001–2019 is weak (Figures 9C,D). Meanwhile, we found that the September–October Barents Sea SIC in the north of 80°N has a reverse impact on the SH between December and January. Moreover, the time series of SIC over the Barents to Laptev Sea [BLSIC, (75–85°N, 30–140°E)] demonstrates a decline in recent years (Figure 10A). The 19-years sliding correlation is decreased in the connection between the September–October BLSIC and the out-of-phase variation of the SH in November and December–January after 2004 (Figure 10B). Therefore, the intraseasonal reversal of the SH in midwinter increasing after 2000 may be attributable to the gradually diminishing SIC.
FIGURE 9
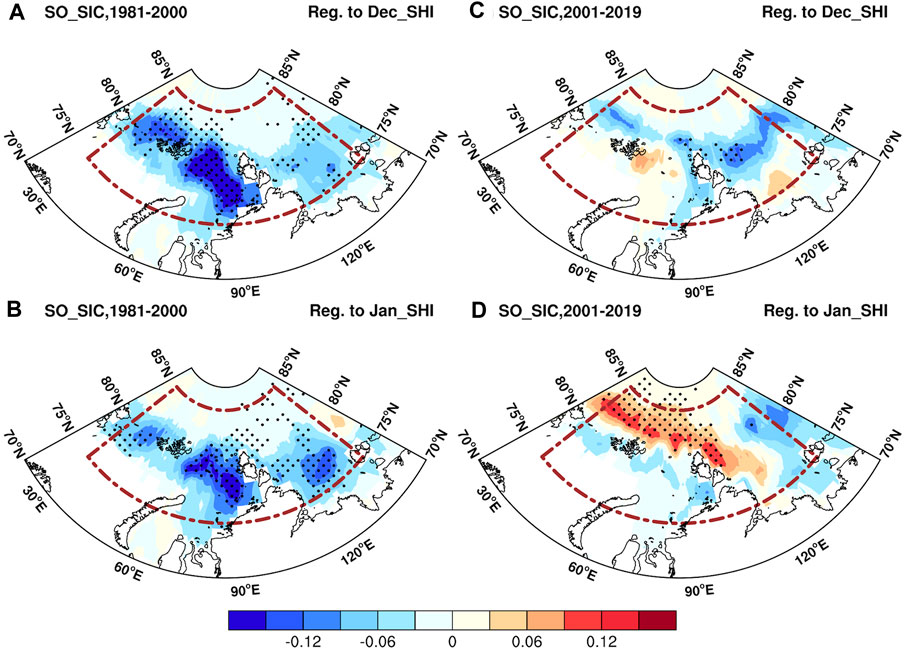
FIGURE 9. Regressions of September–October sea-ice concentration (SIC) on the (A) December and (B) January Siberian high intensity index (SHI), separately, during 1980/81–1999/2000. (C–D) As in (A–B) but during 2000/01–2018/19. Dotted regions are statistically significant at the 90% confidence level, based on the t-test. The brown rectangle represents the key area of SIC over the Barents to Laptev Sea [BLSIC, (75°–85°N, 30°–140°E)].
FIGURE 10
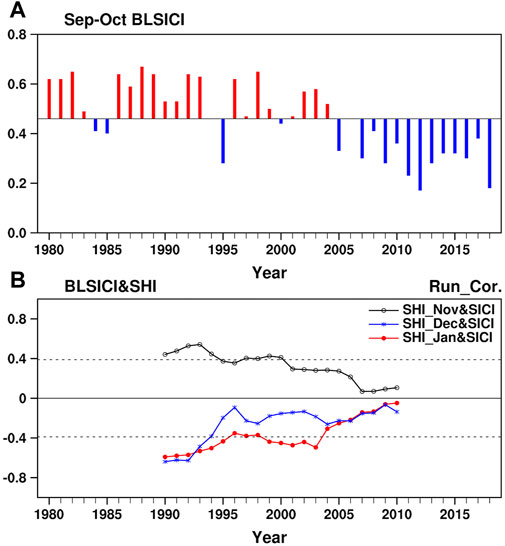
FIGURE 10. (A) Time-series of BLSICI in September–October [area-averaged (75°–85°N, 30°–140°E) Arctic sea-ice concentration] during 1980/81–2018/19. (B) The 19-years sliding correlation coefficients between September–October BLSICI and the SHI in November (black line), December (blue line) and January (red line) separately, during during 1980/81–2018/19. Dotted lines denote correlations above the 90% confidence level.
Intraseasonal Prediction of the Siberian High in December and January Based on Siberian Snow Depth and Arctic Sea-Ice Concentration
The prediction skill for the SH in December and January are evaluated using CFSv2 outputs releasing in November. The TCC of the SHI of the December and January SHI between the observation and CFSv2 outputs is 0.01 and 0.09 (not significant at the 10% level), respectively, during 1983–2019. Meanwhile, the predicted reversal frequency of the SH in December and January is 16% after 2000, which is smaller than observed. The CFSv2 only predicted the reverse phenomenon in 2006/07 and 2012/13 (Table 3). Thus, the prediction skill for the SH in December and January is poor, and the intraseasonal reversal cannot be predicted well. Our analysis indicates that the consistent SH before 2000 and its reversal after 2000 in midwinter are mainly acted on by the September–October ASIC and November SSD, respectively. Hence, we further examine their importance in the intraseasonal prediction of the SH by taking the observed September–October ASIC and November SSD to construct an intraseasonal prediction model.
TABLE 3

TABLE 3. The correctly predicted SH reverse year based on CFSv2 outputs and SSD-scheme.
The linear-regression SIC-scheme shows a high prediction skill for the December and January SH before 2000. The TCC of the SHI between the observation and cross-validation results is 0.58 and 0.51 in December and January before 2000, respectively. Meanwhile, linear-regression SSD-scheme is established using November SSD. The predicted reversal frequency can be promoted from 16% (CFSv2 outputs) to 75% (SSD-scheme) after 2000. Therefore, the snow cover over Siberia in the previous November is an important potential factor for predicting the intraseasonal reversal.
Conclusion and Discussion
The intraseasonal variation of the SH during December–January is documented in this study. It is found that the reversal of the SH+−/SH−+ only exists in 6 years during 1981–2000; nevertheless, the out-of-phase frequency rises rapidly to 12 years during 2001–2019. Therefore, strengthened impacts of November snow cover over Siberia on the out-of-phase change in the SH between December and January since 2000 are discussed, accompanied by the thermal feedback and dynamical coupling of the November SSD.
From the thermal perspective, with the higher SSD, the snow albedo increases over Siberia, which tends to results in strong radiation cooling and a lowering of the SAT over Siberia in the preceding November. Meanwhile, the SCE increases over Siberia in November, which causes deeper snow accumulation in the following December. Thus, the surface cooling anomalies can persist to December and intensify the SH in that month. From the dynamical perspective, the surface heat flux is an important variable to generate and propagate WAF. In the context of higher SSD, the higher heat flux increases over western Siberia in November, which triggers upward propagation of WAF from the troposphere to the stratosphere during November–December. Due to the anomalously upward planetary waves, the stratospheric polar vortex weakens and warms in December–January. The troposphere–stratosphere coupling is closer in January under the SSD anomalies. Hence, the anomalies of the stratospheric polar vortex signal propagate downwards, hindering the development of Ural blockings and the East Asian trough in January. With the anomalously downward negative Arctic Oscillation–like signal, the westerlies correspondingly intensify over Siberia and reduces over polar in January. Therefore, the SH in January weakens relatively. The physical mechanisms also exist in the lower SSD. In addition, some historical simulation experiments of the BCC-CSM2, CanESM5 and CESM2 models from CMIP6 can also partly reproduce the connection between the November SSD and SH reversal in midwinter. Some research has indicated that the autumnal ASIC is significant for the winter SH, which may be a reason behind the SH reversal in November and December–January via eddy–mean flow interaction. Moreover, we found that the linkage becomes weak and insignificant after 2000. The diminishing Arctic sea ice may have induced the coherent variation of the SH in December and January to have decreased after 2000.
Based on the poor prediction skill for the SH in real-time global climate models, the observed SSD in November and the ASIC in September–October were employed to construct intraseasonal prediction models during 2001–2019 and 1981–2000. The prediction accuracy for the out-of-phase change in the SH between December and January increases from 16% (CFSv2 outputs) to 75% (SCE-scheme) after 2000. The TCC of the SHI between the observation and cross-validation results of ASIC-scheme is 0.58 and 0.51 in December and January before 2000, respectively (significant at the 10% level).
This study only demonstrates the role of snow cover for the intraseasonal SH reversal in midwinter. More factors, including the SST over the subtropical Northwest Pacific and the SIC in the Southern Hemisphere, will be further explored and considered in future work. Besides, this study mainly considers the relationship between the SH and SD using observing snow depth from CMC. As ECWMF interim datasets add the assimilation of the satellite-based NOAA/NESDIS daily snow cover to the snow depth after 2003, the sources of snow depth have difference in 2001–2003 and 2003–2018. This difference may make the SD anomalies between SH+− and SH−+ over the Northern Siberia is not significant compared to results from CMC. If more reliable snow depth data before 2000 is available, the relationship between the SH and SD will be further explored before 2000.
In addition, not only does the transition frequency of the SH in December and January after 2000, but reversal of the SH is more evident after 2000. It might be due to the variability of November snow cover and global warming. Firstly, the variability of November snow cover over Eurasia (50°–80°N, 30°–150°E) increases from 3.2 (1980–1999) to 3.9 (2000–2018) over Eurasia, especially over Siberia (40°–60°N, 70°–120°E) from 8.4 to 9.5. These changes may cause more complex land-air feedbacks, making the intraseasonal variabilities of the SH strengthening in following winter. Secondly, the Arctic amplification with global warming has coincided with a period of ostensibly more frequent extreme weather events across the Northern Hemisphere mid-latitudes, including severe winters (Cohen et al., 2014). Thus, as mainly connecting system of East Asian climate, the intraseasonal variabilities of the SH gradually intensify in the context of Global warming and Arctic amplification (Wu et al., 2017). As the location of the Siberian high has an important influence on the Eurasian climate, the intraseasonal variations of the location of the SH need to be investigated in the future work.
Data Availability Statement
We are grateful to the National Centers for Environmental Prediction/National Center for Atmospheric Research for providing the reanalysis data (https://psl.noaa.gov/data/gridded/data.ncep.reanalysis.html) and NCEP Climate Forecast System, version 2 data (http://iridl.ldeo.columbia.edu/SOURCES/. NOAA/.NCEP/.EMC/.CFSv2/), the Met Office Hadley Centre for providing monthly sea-ice cover data (https://www.metoffice.gov.uk/hadobs/hadisst/data/download.html), the Rutgers Global Snow Lab for providing monthly snow cover extent data (https://climate.rutgers.edu/snowcover/), the ECMWF (European Center for Medium-Range Weather Forecasts) interim (https://www.ecmwf.int/en/forecasts/datasets/browse-reanalysis-datasets) and the Canadian Meteorological Centre (CMC) (https://doi.org/10.5067/W9FOYWH0EQZ3) for snow depth, and the phase 6 of the Coupled Model Intercomparison Project (CMIP6) for simulated sea level pressure and snow depth data (https://esgf-node.llnl.gov/search/cmip6/).
Author Contributions
Conceptualization: KF Data curation: HY Formal analysis: HY Funding acquisition: KF Investigation: HY Methodology: KF Project Administration: KF Resources: HY Supervision: KF Validation: KF Writing original draft: HY Writing review and editing: KF.
Funding
This study was supported by National Natural Science Foundation of China (NSFC) (Grants 41730964、42088101) and the Innovation Group Project of Southern Marine Science and Engineering Guangdong Laboratory (Zhuhai) (No 311021001).
Conflict of Interest
The authors declare that the research was conducted in the absence of any commercial or financial relationships that could be construed as a potential conflict of interest.
Publisher’s Note
All claims expressed in this article are solely those of the authors and do not necessarily represent those of their affiliated organizations, or those of the publisher, the editors and the reviewers. Any product that may be evaluated in this article, or claim that may be made by its manufacturer, is not guaranteed or endorsed by the publisher.
References
Ao, J., and Sun, J. (2016). Connection between November Snow Cover over Eastern Europe and winter Precipitation over East Asia. Int. J. Climatol. 36 (5), 2396–2404. doi:10.1002/joc.4484
Baldwin, M. P., and Dunkerton, T. J. (1999). Propagation of the Arctic Oscillation from the Stratosphere to the Troposphere. J. Geophys. Res. 104 (30), 937–946. doi:10.1029/1999jd900445
Baldwin, M. P., and Dunkerton, T. J. (2001). Stratospheric Harbingers of Anomalous Weather Regimes. Science 294 (5542), 581–584. doi:10.1126/science.1063315
Black, R. X. (2002). Stratospheric Forcing of Surface Climate in the Arctic Oscillation. J. Clim. 15 (3), 268–277. doi:10.1175/1520-0442(2002)015<0268:Sfosci>2.0.Co;2
Bony, S., Colman, R., Kattsov, V. M., Allan, R. P., Bretherton, C. S., Dufresne, J.-L., et al. (2006). How Well Do We Understand and Evaluate Climate Change Feedback Processes? J. Clim. 19 (15), 3445–3482. doi:10.1175/jcli3819.1
Brown, R. D., and Brasnett, B. (2010). Canadian Meteorological Centre (CMC) Daily Snow Depth Analysis Data. Version 1. Boulder, Colorado: NASA National Snow and Ice Data Center Distributed Active Archive Center. doi:10.5067/W9FOYWH0EQZ3
Chang, C.-P., and Lu, M.-M. (2012). Intraseasonal Predictability of Siberian High and East Asian Winter Monsoon and its Interdecadal Variability. J. Clim. 25 (5), 1773–1778. doi:10.1175/Jcli-D-11-00500.1
Charney, J. G., and Drazin, P. G. (1961). Propagation of Planetary-Scale Disturbances from the Lower into the Upper Atmosphere. J. Geophys. Res. 66 (3), 83–109. doi:10.1029/JZ066i001p00083
Chen, H., and Sun, Z. (2003). The Effects of Eurasian Snow Cover Anomaly on Winter Atmospheric General Circulation Part I. Observational Studies. Chin. J. Atmos. Sci. 27 (3), 304–316. doi:10.3878/j.issn.1006-9895.2003.03.02
Cohen, J., and Fletcher, C. (2007). Improved Skill of Northern Hemisphere winter Surface Temperature Predictions Based on Land-Atmosphere Fall Anomalies. J. Clim. 20 (16), 4118–4132. doi:10.1175/JCLI4241.1
Cohen, J., Foster, J., Barlow, M., Saito, K., and Jones, J. (2010). Winter 2009-2010: A Case Study of an Extreme Arctic Oscillation Event. Geophys. Res. Lett. 37 (17), a–n. doi:10.1029/2010gl044256
Cohen, J., and Rind, D. (1991). The Effect of Snow Cover on the Climate. J. Clim. 4 (7), 689–706. doi:10.1175/1520-0442(1991)004<0689:Teosco>2.0.Co;2
Cohen, J., Saito, K., and Entekhabi, D. (2001). The Role of the Siberian High in Northern Hemisphere Climate Variability. Geophys. Res. Lett. 28 (2), 299–302. doi:10.1029/2000gl011927
Cohen, J., Screen, J. A., Furtado, J. C., Barlow, M., Whittleston, D., Coumou, D., et al. (2014). Recent Arctic Amplification and Extreme Mid-latitude Weather. Nat. Geosci. 7 (9), 627–637. doi:10.1038/NGEO2234
Dai, H., Fan, K., and Liu, J. (2019). Month-to-Month Variability of Winter Temperature over Northeast China Linked to Sea Ice over the Davis Strait-Baffin Bay and the Barents-Kara Sea. J. Clim. 32 (19), 6365–6384. doi:10.1175/jcli-d-18-0804.1
Dee, D. P., Uppala, S. M., Simmons, A. J., Berrisford, P., Poli, P., Kobayashi, S., et al. (2011). The ERA-Interim Reanalysis: Configuration and Performance of the Data Assimilation System. Q.J.R. Meteorol. Soc. 137 (656), 553–597. doi:10.1002/qj.828
Dickinson, R. E. (1968). Planetary Rossby Waves Propagating Vertically through Weak Westerly Wind Wave Guides. J. Atmos. Sci. 25 (6), 984–1002. doi:10.1175/1520-0469(1968)025<0984:Prwpvt>2.0.Co;2
Ding, Y., and Krishnamurti, T. N. (1987). Heat Budget of the Siberian High and the Winter Monsoon. Mon. Wea. Rev. 115 (10), 2428–2449. doi:10.1175/1520-0493(1987)115<2428:hbotsh>2.0.co;2
Eliassen, A., and Palm, E. (1960). On the Transfer of Energy in Stationary Mountain Waves. Geophy Publ. 22, 1–23.
Eyring, V., Bony, S., Meehl, G. A., Senior, C. A., Stevens, B., Stouffer, R. J., et al. (2016). Overview of the Coupled Model Intercomparison Project Phase 6 (CMIP6) Experimental Design and Organization. Geosci. Model. Dev. 9 (5), 1937–1958. doi:10.5194/gmd-9-1937-2016
Francis, J. A., and Vavrus, S. J. (2012). Evidence Linking Arctic Amplification to Extreme Weather in Mid-latitudes. Geophys. Res. Lett. 39 (6), a–n. doi:10.1029/2012gl051000
Gong, D.-Y., and Ho, C.-H. (2002). The Siberian High and Climate Change over Middle to High Latitude Asia. Theor. Appl. Climatology 72 (1-2), 1–9. doi:10.1007/s007040200008
Gong, G., Cohen, J., Entekhabi, D., and Ge, Y. (2007). Hemispheric-scale Climate Response to Northern Eurasia Land Surface Characteristics and Snow Anomalies. Glob. Planet. Change 56 (3-4), 359–370. doi:10.1016/j.gloplacha.2006.07.025
Gong, G., Entekhabi, D., and Cohen, J. (2003). Modeled Northern Hemisphere winter Climate Response to Realistic Siberian Snow Anomalies. J. Clim. 16 (23), 3917–3931. doi:10.1175/1520-0442(2003)016<3917:Mnhwcr>2.0.Co;2
Hall, A., and Qu, X. (2006). Using the Current Seasonal Cycle to Constrain Snow Albedo Feedback in Future Climate Change. Geophys. Res. Lett. 33 (3), L03502. doi:10.1029/2005gl025127
Han, S., and Sun, J. (2021). Connection between the November Snow Cover over Northeast Asia and the Following January Precipitation in Southern China. Int. J. Climatol 41 (4), 2553–2567. doi:10.1002/joc.6974
Han, S., and Sun, J. (2020). Potential Contribution of winter Dominant Atmospheric Mode over the Mid‐latitude Eurasia to the Prediction of Subsequent spring Arctic Oscillation. Int. J. Climatol 40 (6), 2953–2963. doi:10.1002/joc.6376
Hasanean, H. M., Almazroui, M., Jones, P. D., and Alamoudi, A. A. (2013). Siberian High Variability and its Teleconnections with Tropical Circulations and Surface Air Temperature over Saudi Arabia. Clim. Dyn. 41 (7-8), 2003–2018. doi:10.1007/s00382-012-1657-9
Hu, Y., Tung, K. K., and Liu, J. (2005). A Closer Comparison of Early and Late-winter Atmospheric Trends in the Northern Hemisphere. J. Clim. 18 (16), 3204–3216. doi:10.1175/jcli3468.1
Huang, J., and Hu, Y. (2006). Trennds of winter Temperatures in China. Acta Meteorologica Sinica 64 (5), 614–621. doi:10.3321/j.issn:0577-6619.2006.05.008
Huffman, G. J., Adler, R. F., Arkin, P., Chang, A., Ferraro, R., Gruber, A., et al. (1997). The Global Precipitation Climatology Project (GPCP) Combined Precipitation Dataset. Bull. Amer. Meteorol. Soc. 78 (1), 5–20. doi:10.1175/1520-0477(1997)078<0005:Tgpcpg>2.0.Co;2
Iqbal, M. J., Riaz, S. M. F., and Ghauri, B. M. K. (2013). Impact of Siberian High on Rainfall Variability over Northern Part of Indo-Pak Region. Arab J. Geosci. 6 (8), 3087–3092. doi:10.1007/s12517-012-0598-2
Jeong, J.-H., Ou, T., Linderholm, H. W., Kim, B.-M., Kim, S.-J., Kug, J.-S., et al. (2011). Recent Recovery of the Siberian High Intensity. J. Geophys. Res. 116 (D23), a–n. doi:10.1029/2011jd015904
Kalnay, E., Kanamitsu, M., Kistler, R., Collins, W., Deaven, D., and Gandin, L. (1996). The NCEP/NCAR 40-year Reanalysis Project. Bull. Am. Meteorol. Soc. 77, 437–441. doi:10.1175/1520-0477(1996)077<0437:TNYRP>2.0.CO;2
Kidston, J., Scaife, A. A., Hardiman, S. C., Mitchell, D. M., Butchart, N., Baldwin, M. P., et al. (2015). Stratospheric Influence on Tropospheric Jet Streams, Storm Tracks and Surface Weather. Nat. Geosci. 8 (6), 433–440. doi:10.1038/ngeo2424
Kug, J. S., Jeong, J. H., Jang, Y. S., Kim, B. M., Folland, C. K., Min, S. K., et al. (2015). Two Distinct Influences of Arctic Warming on Cold winters over North America and East Asia. Nat. Geosci. 8 (10), 759–762. doi:10.1038/ngeo2517
Lei, S., and Wu, R. (2017). Processes for Occurrence of strong Cold Events over Eastern China. J. Clim. 30 (22), 9247–9266. doi:10.1175/JCLI-D-16-0857.1
Lei, S., Wu, R., and Yang, J. (2018). Relative Contributions of Synoptic and Intraseasonal Variations to strong Cold Events over Eastern China. Clim. Dyn. 50, 4619–4634. doi:10.1007/s00382-017-3894-4
Li, C. (1990). Interaction between Anomalous winter Monsoon in East Asia and EI Nino Events. Adv. Atmos. Sci. 7 (1), 36–46. doi:10.1007/BF02919166
Li, D., and Lan, L. (2017). Relationship between the Intensity of the Siberian High and the SST Anomaly in the North Atlantic. Trans. Atmos. Sci. 40 (1), 13–24. doi:10.13878/j.cnki.dqkxxb.20151218001
Li, F., and Wang, H. (2014). Autumn Eurasian Snow Depth, Autumn Arctic Sea Ice Cover and East Asian winter Monsoon. Int. J. Climatology 34 (13), 3616–3625. doi:10.1002/joc.3936
Li, H., Fan, K., He, S., Liu, Y., Yuan, X., and Wang, H. (2021). Intensified Impacts of Central Pacific ENSO on the Reversal of December and January Surface Air Temperature Anomaly over China since 1997. J. Clim. 34 (5), 1601–1618. doi:10.1175/jcli-d-20-0048.1
Li, J., Li, F., and Wang, H. (2020). Subseasonal Prediction of winter Precipitation in Southern China Using the Early November Snowpack over the Urals. Atmos. Oceanic Sci. Lett. 13 (6), 534–541. doi:10.1080/16742834.2020.1824547
Lu, M. M., and Chang, C. P. (2009). Unusual Late-Season Cold Surges during the 2005 Asian Winter Monsoon: Roles of Atlantic Blocking and the Central Asian Anticyclone. J. Clim. 22 (19), 5205–5217. doi:10.1175/2009jcli2935.1
Lu, Z., Li, F., Orsolini, Y. J., Gao, Y., and He, S. (2020). Understanding of European Cold Extremes, Sudden Stratospheric Warming, and Siberian Snow Accumulation in the Winter of 2017/18. J. Clim. 33 (2), 527–545. doi:10.1175/jcli-d-18-0861.1
Lu, Z. Z., He, S., Li, F., and Wang, H. J. (2019). Impacts of the Autumn Arctic Sea Ice on the Intraseasonal Reversal of the Winter Siberian High. Adv. Atmos. Sci. 36, 173–188. doi:10.1007/s00376-017-8089-8
Plumb, R. A. (1985). On the 3-dimensional Propagation of Sattionary Waves. J. Atmos. Sci. 42 (3), 217–229. doi:10.1175/1520-0469(1985)042<0217:Ottdpo>2.0.Co;2
Rayner, N. A. (2003). Global Analyses of Sea Surface Temperature, Sea Ice, and Night marine Air Temperature since the Late Nineteenth century. J. Geophys. Res. 108 (D14), 4407. doi:10.1029/2002JD002670
Riaz, S. M. F., and Iqbal, M. J. (2017). Singular Value Decomposition Analysis for Examining the Impact of Siberian High on winter Precipitation Variability over South Asia. Theor. Appl. Climatology 130 (3-4), 1189–1194. doi:10.1007/s00704-016-1948-x
Ringler, T. D., and Cook, K. H. (1999). Understanding the Seasonality of Orographically Forced Stationary Waves: Interaction between Mechanical and thermal Forcing. J. Atmos. Sci. 56 (9), 1154–1174. doi:10.1175/1520-0469(1999)056<1154:Utsoof>2.0.Co;2
Robinson, D. A., Dewey, K. F., and Heim, R. R. (1993). Global Snow Cover Monitoring: an Update. Bull. Am. Meteorol. Soc. 74 (9), 1689–1696. doi:10.1175/1520-0477(1993)074<1689:Gscmau>2.0.Co;2
Saha, S., Moorthi, S., Wu, X. R., Wang, J., Nadiga, S., Tripp, P., et al. (2014). The NCEP Climate Forecast System Version 2. J. Clim. 27 (6), 2185–2208. doi:10.1175/Jcli-D-12-00823.1
Sahsamanoglou, H. S., Makrogiannis, T. J., and Kallimopoulos, P. P. (1991). Some Aspects of the Basic Characteristics of the Siberian Anticyclone. Int. J. Climatology 11 (8), 827–839. doi:10.1002/joc.3370110803
Saito, K., Cohen, J., and Entekhabi, D. (2001). Evolution of Atmospheric Response to Early-Season Eurasian Snow Cover Anomalies. Monthly Weather Rev. 129 (11), 2746–2760. doi:10.1175/1520-0493(2001)129<2746:Eoarte>2.0.Co;2
Scott, R. K., and Polvani, L. M. (2006). Internal Variability of the winter Stratosphere. Part I: Time-independent Forcing. J. Atmos. Sci. 63 (11), 2758–2776. doi:10.1175/jas3797.1
Si, D., Li, Q., Liu, Y., Wang, Z., Yuan, Y., and Wang, D. (2014). Possible Causes for the Anomalous Weak East Asian Winter Monsoon in 2013/2014. Meteorol. Monthly 40 (7), 891–897. doi:10.7519/j.issn.1000-0526.2014.07.014
Si, D., Ma, L., Wang, P., Wang, Y., Nie, Y., and Sun, L. (2016). Anomalous Activity of Arctic Oscillation in winter 2015/16 and its Impact on Temperature in China. Meteorol. Monthly 42 (7), 892–897. doi:10.7519/j.issn.1000-0526.2016.07.013
Soden, B. J., and Held, I. M. (2006). An Assessment of Climate Feedbacks in Coupled Ocean-Atmosphere Models. J. Clim. 19 (14), 3354–3360. doi:10.1175/jcli3799.1
Takaya, K., and Nakamura, H. (2005a). Geographical Dependence of Upper-Level Blocking Formation Associated with Intraseasonal Amplification of the Siberian High. J. Atmos. Sci. 62 (12), 4441–4449. doi:10.1175/jas3628.1
Takaya, K., and Nakamura, H. (2005b). Mechanisms of Intraseasonal Amplification of the Cold Siberian High. J. Atmos. Sci. 62 (12), 4423–4440. doi:10.1175/Jas3629.1
Tian, B., and Fan, K. (2020). Different Prediction Skill for the East Asian winter Monsoon in the Early and Late winter Season. Clim. Dyn. 54 (3-4), 1523–1538. doi:10.1007/s00382-019-05068-6
Wagner, A. J. (1973). The Influence of Average Snow Depth on Monthly Mean Temperature Anomaly. Monthly Weather Rev. 101 (8), 624–626. doi:10.1175/1520-0493(1973)101<0624:tioasd>2.3.co;2
Wang, D., Zhou, B., Sun, C., Yuan, Y., Liu, Y., and Wang, P. (2013). Features and Possible Causes for East Asian Winter Monsoon in 2012/2013. Meteorol. Monthly 39 (7), 930–937. doi:10.7519/j.issn.1000-0526.2013.07.014
Webster, P. J., Magana, V. O., Palmer, T. N., Shukla, J., Tomas, R. A., Yanai, M., et al. (1998). Monsoons: Processes, Predictability, and the Prospects for Prediction. J. Geophys. Research-Oceans 103 (C7), 14451–14510. doi:10.1029/97jc02719
Wegmann, M., Orsolini, Y., Vazquez, M., Gimeno, L., Nieto, R., Bulygina, O., et al. (2015). Arctic Moisture Source for Eurasian Snow Cover Variations in Autumn. Environ. Res. Lett. 10 (5), 054015. doi:10.1088/1748-9326/10/5/054015
Wu, B., Su, J., and Zhang, R. (2011). Effects of Autumn-winter Arctic Sea Ice on winter Siberian High. Chin. Sci. Bull. 56 (30), 3220–3228. doi:10.1007/s11434-011-4696-4
Wu, B. Y., Yang, K., and Francis, J. A. (2017). A Cold Event in Asia during January-February 2012 and its Possible Association with Arctic Sea Ice Loss. J. Clim. 30 (19), 7971–7990. doi:10.1175/Jcli-D-16-0115.1
Wu, R., and Kirtman, B. P. (2007). Observed Relationship of spring and Summer East Asian Rainfall with winter and spring Eurasian Snow. J. Clim. 20 (7), 1285–1304. doi:10.1175/jcli4068.1
Xie, A., Lu, Y., and Chen, S. (1992). The Evolution of Siberian High Prior to the Outbreak of Cold Air. Chin. J. Atmos. Sci. 16 (6), 677–685. doi:10.3878/j.issn.1006-9895.1992.06.05
Xu, X., He, S., Li, F., and Wang, H. (2017). Impact of Northern Eurasian Snow Cover in Autumn on the Warm Arctic–Cold Eurasia Pattern during the Following January and its Linkage to Stationary Planetary Waves. Clim. Dyn. 50 (5-6), 1993–2006. doi:10.1007/s00382-017-3732-8
Xu, X., Li, F., He, S., and Wang, H. (2018). Subseasonal Reversal of East Asian Surface Temperature Variability in Winter 2014/15. Adv. Atmos. Sci. 35 (6), 737–752. doi:10.1007/s00376-017-7059-5
Yang, H., and Fan, K. (2021). A Hybrid Ensemble Canonical Correlation Prediction Model of the Winter Siberian High. J. Geophys. Research-Atmospheres 126 (4), e2020JD033780. doi:10.1029/2020jd033780
Yang, H., Fan, K., Tian, B., and Hua, W. (2021). Why Is the November Siberian High Intensity More Predictable by NCEP-CFSv2 Model?. Chin. J. Atmos. Sci. 45 (4), 697–712. doi:10.3878/j.issn.1006-9895.2009.20106
Yang, S., and Lu, R. (2014). Predictability of the East Asian winter Monsoon Indices by the Coupled Models of ENSEMBLES. Adv. Atmos. Sci. 31 (6), 1279–1292. doi:10.1007/s00376-014-4020-8
Zeng, D., Zhu, W., Ma, X., Gu, P., Liu, M., and Gao, J. (2015). North Atlantic Storm Track and its Infulence on Siberian High in winter. Trans. Atmos. Sci. 38 (2), 232–240. doi:10.13878/j.cnki.dqkxxb.20121003001
Zhang, R. H., Sumi, A., and Kimoto, M. (1996). Impact of El Nino on the East Asian Monsoon: A Diagnostic Study of the 86/87 and 91/92 Events. J. Meteorol. Soc. Jpn. 74 (1), 49–62. doi:10.2151/jmsj1965.74.1_49
Keywords: November snow cover over Siberia, phase reversal, Siberian high, troposphere-stratosphere interaction, intraseasonal climate prediction
Citation: Yang H and Fan K (2021) Strengthened Impacts of November Snow Cover Over Siberia on the Out-of-phase Change in the Siberian High Between December and January Since 2000 and Implication for Intraseasonal Climate Prediction. Front. Earth Sci. 9:748484. doi: 10.3389/feart.2021.748484
Received: 28 July 2021; Accepted: 30 August 2021;
Published: 29 September 2021.
Edited by:
Renguang Wu, Zhejiang University, ChinaReviewed by:
Lei Song, Institute of Atmospheric Physics, (CAS), ChinaRuowen Yang, Yunnan University, China
Copyright © 2021 Yang and Fan. This is an open-access article distributed under the terms of the Creative Commons Attribution License (CC BY). The use, distribution or reproduction in other forums is permitted, provided the original author(s) and the copyright owner(s) are credited and that the original publication in this journal is cited, in accordance with accepted academic practice. No use, distribution or reproduction is permitted which does not comply with these terms.
*Correspondence: Ke Fan, fanke@mail.iap.ac.cn