 Xiaoqi Li
 Jichao Fang
- Research Institute of Petroleum Exploration and Development, SINOPEC, Beijing, China
Phase separation is widely observed in multiphase systems. In this study, it has been investigated using Shan–Chen lattice Boltzmann method. The adhesion parameter in SC model leads to the desired fluid–fluid phenomenon, which was varied to specify the strength of separation between two phases to present emulsified performance in oil production. In order to describe such behaviors quantitatively, graphical distributions were described with time and were corresponded with a statistical index–Fourier structure factor that is able to predict complex phase separation behaviors, thereby providing a measurement for calculating such random distribution during the process of separation as well as evaluating heterogeneous degrees of the entire domain. The repulsive interactions are specified as low, intermediate, and high values. Phase separations with clear boundaries have been observed and each stage of separation evolvement has been discussed in this study. Magnitudes of structure factors are increased with higher degrees of fluctuations.
Introduction
One of phase separation principles is to utilize inherent immersion in an anti-solvent way of separating, for example, emulsification (Mukherjee et al., 2019) (Fournanty et al., 2008), nuclear condensates (Zhang et al., 2019), droplet formation, and movement in microchannels. So, the underlying principle of phase separation involves utilizing the two or more fluids, such that they separate into their respective phases (Dauyeshova et al., 2018). Its fully understanding will serve as the emulsified behavior occurring in heavy oil cold production and other areas.
To understand this mechanism which can be used to manipulate the breakdown or onset of such instability, many studies have been conducted via experimental works (Peters et al., 1990) (Goldburg and Huang, 1975) (Giaconia et al., 2007). Although experiments show that critical parameters of chemical emulsifiers are associated with rheology of the oil–water interface (Moerman et al., 2018) (Wang et al., 2014) (Cui et al., 2021) (Man et al., 2018), the theoretical work for this purpose that has been developed for production scenarios remains problematic (Wu et al., 2021) (Cui et al., 2020).
However, it is impractical to obtain micro systematic and completely separate evolutions using molecular dynamics due to massive computational power, and macroscopic behaviors are not sensitive. The lattice Boltzmann method (LBM) can describe microscopic behaviors of the fluid and represent macro scale behaviors. Such a mesoscopic scheme has become a useful tool to study a variety of industrial processes including the aforementioned processes. Phase separation in lattice Boltzmann evolves from an immiscible fluid with the respective equilibrium state of each component. The Shan–Chen model proposed interaction forces acting on fluid particles, which will be discussed later. Statistical behaviors will also be used to analyze instability due to the tangential velocity difference of the fluids, from initial random distribution to band-like structures and to the growth of droplets over the entire domain.
The structure factor of droplet evolvement via self-assembly in larger droplets is to the degree of spatial heterogeneity. In this study, it was applied to emulsification used in oil recovery engineering. Regarding the binary mixtures, we emphasize the strength of heterogeneity from emulsions inducing phase separation. If the interfacial properties and the pore size are included, we discuss how to control the spatial heterogeneity and phase separation.
Methodology
Shan–Chen Multiphase LBM
The SC LBM has been implemented in two dimensions for the multiphase system. The distribution function is introduced for fluid components. And it satisfies the following lattice Boltzmann equation:
where
The equilibrium distribution function
where
And where
where
where
In Eq. 5,
Fluid–Fluid Cohesion
The cohesive force acting on the fluid component is defined as
where
Results and Discussions
Qualitative Analysis
In this study, the initial density is set to be 1. The periodic boundary conditions are used for all boundaries in the 301 × 301 mesh. Initially, droplets are distributed uniformly in the domain. Small droplets grow up gradually by dispersion leading to a high degree of heterogeneity because larger droplets are able to minimize surface energy. Small droplets became less by coalesce due to dispersion and local flow behaviors. In the entire domain, the interface between two phases was decomposed into several high-density zones and low-density zones. Later, phase zones can further coalesce and grow up resulting minimized total lengths of the interface under surface tension. When the computations reached to the equilibrium state, two phases will separate completely. Small structures tend to have a spherical shape with a smooth surface before evaporating by diffusion (Reis and Phillips, 2007).
Various interactive forces have effects on speeds of phase separations. The density ratio and viscosity radio between two phases are represented as
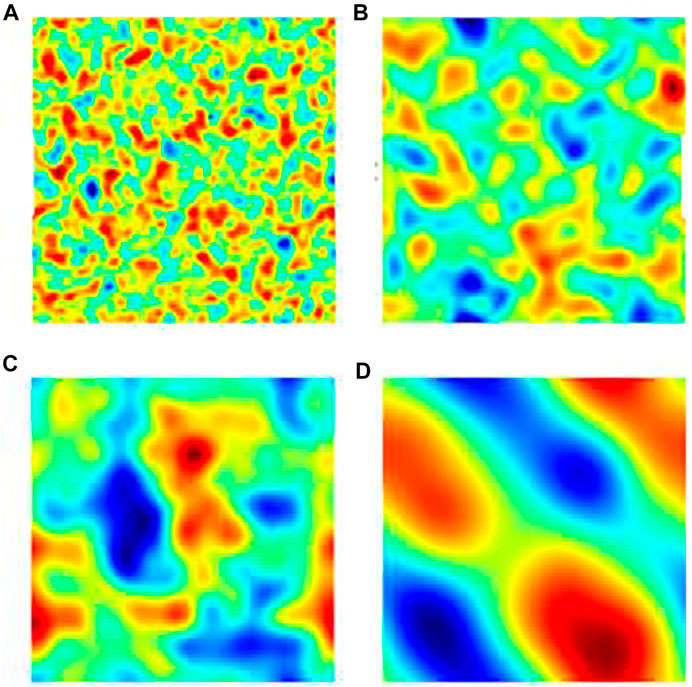
FIGURE 1. Density fields under isothermal conditions for phase separation procedures with
Phase separation happens in a system with an intermediate specified interactive force; see Figure 2. A clearer structure involving separated behaviors can be seen quickly. Distinctive band structures are formed with random swings but are hardly evolved into further structures within the simulation time.
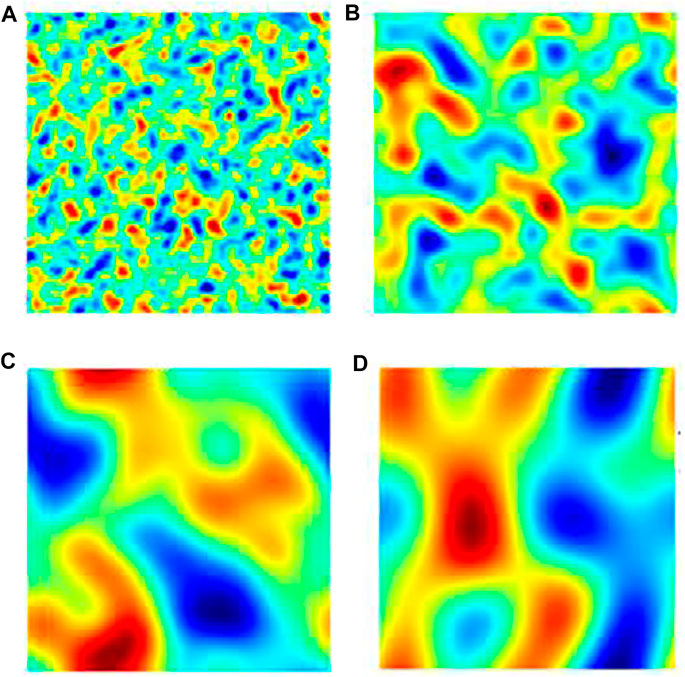
FIGURE 2. Density fields under isothermal conditions for phase separation procedures with
When the interactive strength is risen to a high level with the magnitude of -100 shown in Figure 3, the exceptional separated structures are shown. Many smaller band structures are displayed in the earlier stage (Figure 3B). Subsequently, such “bands” are further combined (Figure 3C) and then reshaped into some round bubbles (Figure 3D).
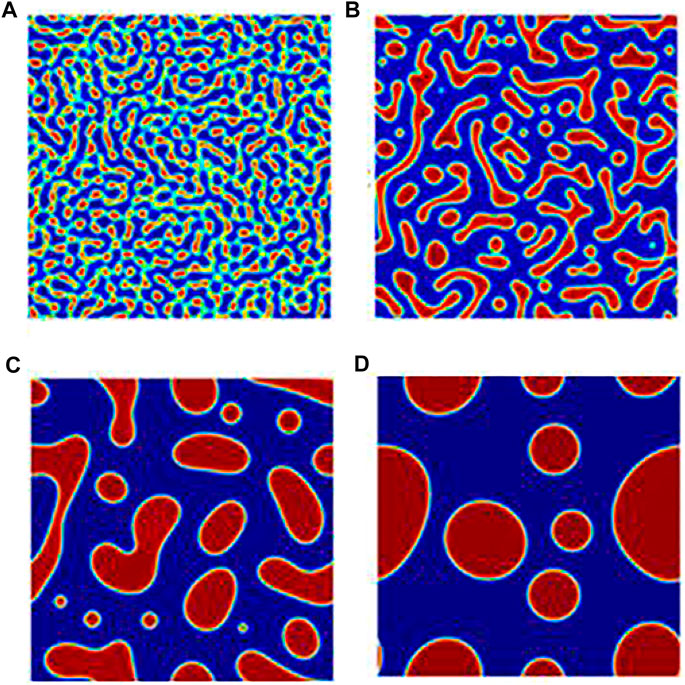
FIGURE 3. Density fields under isothermal conditions for phase separation procedures with
Structure Factor
Structure factor is used by the Fourier transform of spatial distributions of droplets or bubbles to present instabilities observed. Here, the first structure factor evolution will be showed as the function of simulation time. The structure factor shows heterogeneity changes due to phase separation (Zou et al., 1994). The structure factor is defined based on the fluctuation–dissipation theorem within integration of the imaginary part of the density response function. For a discrete system we are studying, it is given by
where
Structure factor is a quantitative measure of the structure along a prescribed direction. A value at a given wave number indicates the presence of heterogeneity in the periodic domain. Here, we present the first structure factors along the x and y directions. These structure factors are associated with heterogeneities developed to the size of the computational domain.
The onset of phase separation is defined as the time when the structure factor is above zero. In order to evaluate fluctuations from phase separation behaviors, graphic distributions are used corresponding to structure factors at selective times. Initially, random uniformed structures are specified in the domain, with a low value of structure factors; see Figure 4A. Then, small droplets start to merge with the neighboring ones, and therefore, relative bigger droplets or chunks were distributed with an increasing fluctuation presenting by higher structure factors, in Figure 4B. In Figure 4C, the structure factor of low interactive strengths is observed to be a peak. As separation continues, some droplets become larger than others, which results in uneven structures in the domain. These larger and more nonuniformed structures were verified by maximum of the mean structure factor value at the approximate 300th step. In Figure 4D, high- and low-density phases at the 1800th step were alternately distributed, and values of mean structure factors in Figure 4 remain.

FIGURE 4. Temporal evolution of mean structure factors over entire domain in the phase separation system with interactive strengths of
Structure factors of the system with medium interactive strengths are shown in Figure 5. Similarly, the initial random uniformed distribution is shown in Figure 5A, which corresponds to low structure factors in Figure 5. And such low-level fluctuations are able to stay longer until approximately 200 steps as shown in Figure 5B due to increasing repulsive interaction compared to the low interactive strength. When large droplets further combine with neighboring same materials, some laminated structures appeared, and mean structure factors reach a peak at the approximate 800th step (Figure 5C). Although similar band structures are seen as those in the system with the low interactive strength, a clearer boundary between two phases is revealed.

FIGURE 5. Temporal evolution of mean structure factors over entire domain in the phase separation system with interactive strengths of
When the interactive strength is increased to 100, quite clear phase separation is observed as shown in Figure 6. Highest values of mean structure factors among three systems are shown. From the beginning, distinct boundaries enclosing large droplets or chunks were taken shape as shown in Figures 6A and B. But, structure factors are low because degree of heterogeneity at these stages is relatively small. At the approximate 300th step (Figure 6C), structure factors are gradually fortified as a variety of sizes of droplets or chunks. Additionally, structure factors in this systems exhibit a smooth profile that is different from previous two systems with curved trends. This suggests that a two-phase system with strong repulsive interaction involves continuous fluctuations rather than abrupt changes.
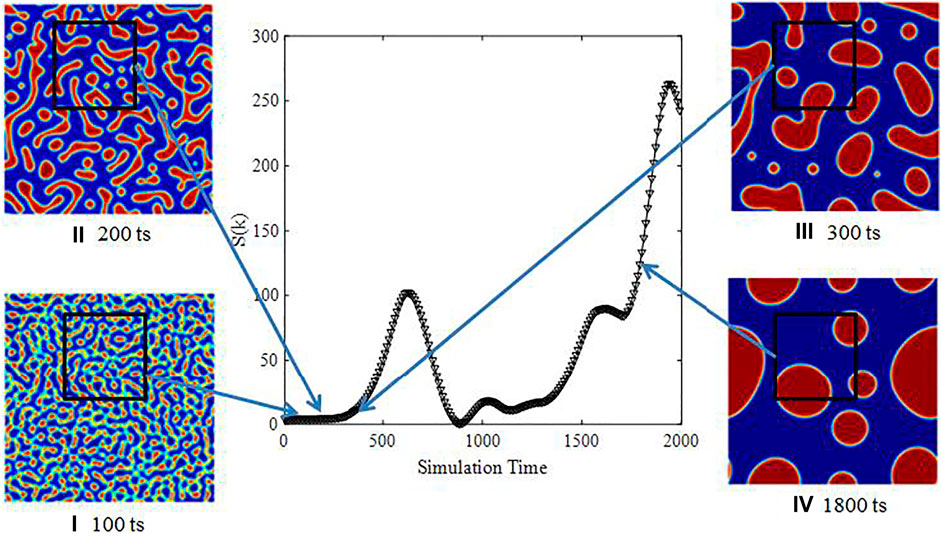
FIGURE 6. Temporal evolution of mean structure factors over entire domain in the phase separation system with interactive strengths of
Conclusion
Phase separation is studied via the LBM-SC model and analyzed quantitatively using structure factors.
• Evolution of phase separation is observed in spatial distribution in four stages within periodic domains.
• Uniformed droplets aggregate into larger ones under interactive forces.
• The structure factors of the binary mixture develop in time that corresponds to changes of fluctuation due to phase separations.
Data Availability Statement
The original contributions presented in the study are included in the article/supplementary material; further inquiries can be directed to the corresponding author.
Author Contributions
XL has worked on simulation and draft development, JF has contributed to double checking data and description, and BJ has funded and guided this research work.
Funding
This work was sponsored by both the National Key Program and Development Program of China (No.SQ2018YFA070028) and SINOPEC Technical Project (No. P21085-18).
Conflicts of Interest
Authors XL, JF, and BJ were employed by SINOPEC
Publisher’s Note
All claims expressed in this article are solely those of the authors and do not necessarily represent those of their affiliated organizations, or those of the publisher, the editors, and the reviewers. Any product that may be evaluated in this article, or claim that may be made by its manufacturer, is not guaranteed or endorsed by the publisher.
Acknowledgments
This work was financially supported by the Chinese Research and Development of National Key Program (No.SQ2018YFA070028) and SINOPEC Technical Project (No. P21085-18).
References
Cui, G., Pei, S., Rui, Z., Dou, B., Ning, F., and Wang, F. (2021). Whole Process Analysis of Geothermal Exploitation and Power Generation from a Depleted High-Temperature Gas Reservoir by Recycling CO2. Energy 217, 119340. doi:10.1016/j.energy.2020.119340
Cui, G., Ren, S., Dou, B., and Ning, F. (2020). Geothermal Energy Exploitation from Depleted High-Temperature Gas Reservoirs by Recycling CO2: The Superiority and Existing Problems. Geosci. Front., 101078. in press. doi:10.1016/j.gsf.2020.08.014
Dauyeshova, B., Rojas-Solórzano, L. R., and Monaco, E. (2018). Numerical Simulation of Diffusion Process in T-Shaped Micromixer Using Shan-Chen Lattice Boltzmann Method. Comput. Fluids 167, 229–240. doi:10.1016/j.compfluid.2018.03.029
Fournanty, S., Guer, Y. L., Omari, K. E., and Dejean, J.-P. (2008). Laminar Flow Emulsification Process to Control the Viscosity Reduction of Heavy Crude Oils. J. Dispersion Sci. Tech. 29 (10), 1355–1366. doi:10.1080/01932690701782871
Giaconia, A., Caputo, G., Ceroli, A., Diamanti, M., Barbarossa, V., Tarquini, P., et al. (2007). Experimental Study of Two Phase Separation in the Bunsen Section of the Sulfur-Iodine Thermochemical Cycle. Int. J. Hydrogen Energ. 32 (5), 531–536. doi:10.1016/j.ijhydene.2006.08.015
Goldburg, W. I., and Huang, J. S. (1975). “Phase Separation Experiments Near the Critical Point,” in Fluctuations, Instabilities, and Phase Transitions. Editor T. Riste (Springer US), 87–106. doi:10.1007/978-1-4615-8912-9_5
Man, J., Chien, S., Liang, S., Li, J., and Chen, H. (2018). Size-Dependent Phase Separation in Emulsion Droplets. ChemPhysChem 19, 1937. John Wiley & Sons. doi:10.1002/cphc.201800662
Moerman, P. G., Hohenberg, P. C., Vanden-Eijnden, E., and Brujic, J. (2018). Emulsion Patterns in the Wake of a Liquid-Liquid Phase Separation Front. Proc. Natl. Acad. Sci. USA 115, 3599–3604. National Academy of Sciences. doi:10.1073/pnas.1716330115
Mukherjee, S., Berghout, P., and Van den Akker, H. E. A. (2019). A Lattice Boltzmann Approach to Surfactant-Laden Emulsions. Aiche J. 65 (2), 811–828. doi:10.1002/aic.16451
Peters, B., Wingo, D., Bower, M., Amborski, R., Blount, L., Daniel, A., et al. (1990). Fluid Phase Separation (FPS) Experiment for Flight on a Space Shuttle Get Away Special (GAS) Canister. Available at: https://ntrs.nasa.gov/api/citations/19900016845/downloads/19900016845.pdf.
Reis, T., and Phillips, T. N. (2007). Lattice Boltzmann Model for Simulating Immiscible Two-phase Flows. J. Phys. A: Math. Theor. 40 (14), 4033–4053. doi:10.1088/1751-8113/40/14/018
Wang, W.-c., Pan, Y.-x., Shi, K., Peng, C., and Ji, X.-l. (2014). Hierarchical Porous Polymer Beads Prepared by Polymerization-Induced Phase Separation and Emulsion-Template in a Microfluidic Device. Chin. J. Polym. Sci. 32 (12), 1646–1654. doi:10.1007/s10118-014-1547-1
Wu, Y., Cheng, L., Huang, S., Fang, S., Killough, J., Jia, P., et al. (2021). A Transient Two-phase Flow Model for Production Prediction of Tight Gas Wells with Fracturing Fluid-Induced Formation Damage. J. Pet. Sci. Eng. 199, 108351. doi:10.1016/j.petrol.2021.108351
Zhang, Y., Bertulat, B., Tencer, A. H., Ren, X., Wright, G. M., Black, J., et al. (2019). MORC3 Forms Nuclear Condensates through Phase Separation. IScience 17, 182–189. Elsevier. doi:10.1016/j.isci.2019.06.030
Keywords: phase Separation, LBM, structure factor, emulsion, oil recovery
Citation: Li X, Fang J and Ji B (2021) Quantitative Analysis of Phase Separation Using the Lattice Boltzmann Method. Front. Earth Sci. 9:748450. doi: 10.3389/feart.2021.748450
Received: 28 July 2021; Accepted: 30 August 2021;
Published: 18 October 2021.
Edited by:
Zheng Sun, China University of Mining and Technology, ChinaReviewed by:
Lei Wang, Nazarbayev University, KazakhstanXin LI, Research Institute of Petroleum Exploration and Development (RIPED), China
Guodong Cui, China University of Geosciences Wuhan, China
Copyright © 2021 Li, Fang and Ji. This is an open-access article distributed under the terms of the Creative Commons Attribution License (CC BY). The use, distribution or reproduction in other forums is permitted, provided the original author(s) and the copyright owner(s) are credited and that the original publication in this journal is cited, in accordance with accepted academic practice. No use, distribution or reproduction is permitted which does not comply with these terms.
*Correspondence: Bingyu Ji, amlieS5zeWt5QHNpbm9wZWMuY29t