 Sofia Pechlivanidou1*
 Anneleen H. Geurts1Guillaume Duclaux2Robert L. Gawthorpe1
 Christos Pennos1,4Emma Finch3
- 1Department of Earth Science, University of Bergen, Bergen, Norway
- 2Université Côte d'Azur, CNRS, Observatoire de la Côte d'Azur, IRD, Géoazur, Valbonne, France
- 3Department of Earth and Environmental Sciences, University of Manchester, Manchester, United Kingdom
- 4Emil Racoviţă Institute of Speleology, Romanian Academy, Cluj-Napoca, Romania
Understanding the impact of tectonics on surface processes and the resultant stratigraphic evolution in multi-phase rifts is challenging, as patterns of erosion and deposition related to older phases of extension are overprinted by the subsequent extensional phases. In this study, we use a one-way coupled numerical modelling approach between a tectonic and a surface processes model to investigate topographic evolution, erosion and basin stratigraphy during single and multi-phase rifting. We compare the results from the single and the multi-phase rift experiments for a 5 Myr period during which they experience equal amounts of extension, but with the multi-phase experiment experiencing fault topography inherited from a previous phase of extension. Our results demonstrate a very dynamic evolution of the drainage network that occurs in response to fault growth and linkage and to depocentre overfilling and overspilling. We observe profound differences between topographic and depocenter development during single and multi-phase rifting with implications for sedimentary facies architecture. Our quantitative approach, enables us to better understand the impact of changing extension direction on the distribution of sediment source areas and the syn-rift stratigraphic development through time and space.
Introduction
Unravelling the long-term interactions between surface processes and tectonics is key to understanding basin evolution; yet it remains challenging, especially for rift basins that are characterized by complex multiple phases of extensional histories. Insights into how normal fault arrays behave during multi-phase extension have been derived from numerous studies of seismic reflection, well and outcrop data (e.g., North Sea Rift: Whipp et al., 2014, Bell et al., 2014; East African Rift System: Korme et al., 2004; Barmer Basin rift, India: Bladon et al., 2015; Gulf of Thailand: Morley, 2007; North West Shelf, Australia: Frankowicz and McClay, 2010). Also, scaled physical model experiments demonstrate the impact of pre-existing faults on the development of newly formed faults (e.g., Bellahsen and Daniel, 2005; Henza et al., 2010, 2011; Chattopadhyay and Chakra, 2013; Henstra et al., 2015; Zwaan and Schreurs, 2017; Molnar et al., 2019; Maestrelli et al., 2020; Wang et al., 2021). Other papers however, indicate that fault reactivation may not depend only on multi-phase extension but on mantle and crustal weaknesses among other factors (e.g., Zwaan et al., 2021; Samsu et al., 2021). Nonetheless, resolving surface processes evolution in time and space and their response to fault network growth during multi-phase rifting remains unclear. Our lack of understanding of how erosional-depositional patterns evolve under multi-phase extension is largely due to the fact that the topography and the stratigraphic patterns associated with the older phase of extension are overprinted by the subsequent extensional phase. For example, in the active Mygdonia Rift in northern Greece (Figure 1B) understanding the interplay between tectonics and surface processes is ambiguous since patterns of erosion-deposition related to the older NE-SW extensional phase (Psilovikos, 1977; Dinter and Royden, 1993) are overprinted by the subsequent N-S extensional phase (Chatzipetros and Pavlides, 1998).
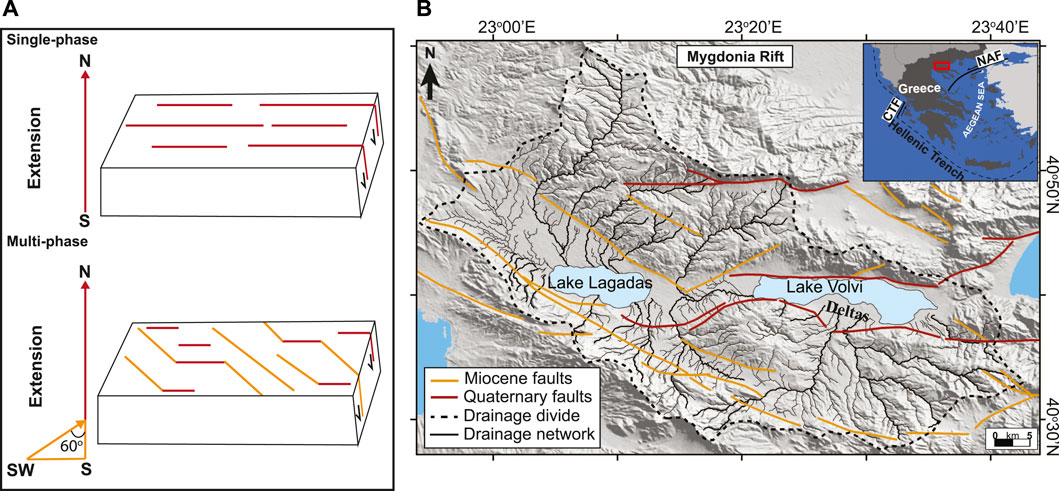
FIGURE 1. (A) Block diagrams showing the structural set-up used in this study to simulate the evolution of rift basins under single and multi-phase rifting. Orange arrow corresponds to the 1st phase of extension and red arrow to the 2nd phase of extension in the multi-phase setting. (B) Hillshade map of the Mygdonia Rift (northern Greece) that has experienced two phases of extension; a NE-SW extension during the Miocene and a N-S extension during the Quaternary. CTF, Cephalonia Transform Fault; NAF, North Anatolian Fault.
Conceptual models for the large-scale rift evolution are based on observations from simple rifts, i.e., rift basins that have evolved in response to a single-phase of extension. For marine/coastal environments, these evolutionary models suggest a long-term transition from overfilled basins during the early stages of rifting to underfilled basins during the later stages of rifting (Leeder and Gawthorpe, 1987; Prosser, 1993; Ravnas and Steel, 1998; Gawthorpe and Leeder, 2000). This pattern has been associated with an increase in fault displacement and localization of deformation from the “rift initiation stage” to the “rift climax” stage, as faults grow and gradually link (Cowie, 1998; Gupta et al., 1998). Nevertheless, the role of surface processes and their interaction with normal fault growth has not been considered in the above evolutionary pattern. Cowie et al. (2006) show how normal fault growth, interaction and linkage affects drainage network evolution and sediment dispersal in rift basins using a tectonic model that is coupled to a landscape evolution model. They describe the development of a major linked structure from a diffuse array of active fault segments that results in a simple rift-related topography. Here we elaborate on Cowie et al. (2006) by investigating the geomorphic and stratigraphic evolution of rift basins subjected to either simple and or multi-phase extensional histories, following a similar one-way coupled numerical modelling approach. We use rift-related topographies derived from the tectonic model of Finch and Gawthorpe (2017) that simulates the development of both single and multi-phase rift basins in three dimensions to drive the surface process model pyBadlands (Salles et al., 2018). We evaluate and compare landscape evolution and basin stratigraphy between single-phase rifts and multi-phase rifts that form in response to two phases of extension, with an angle between the two extension directions of 60° (Figure 1A), similar to what observed in several natural rifts such as in the Mygdonia Rift, Greece (Figure 1B).
Our modelling study develops understanding of surface processes and tectonic interactions during multi-phase rifting by quantifying the magnitude and distribution of erosional and depositional processes, and by making a direct comparison to single-phase rifting. We address specific questions that concern: 1) drainage network evolution and the location of drainage divides across the developing rift, 2) spatial and temporal variations in sediment supply and the implications for syn-rift stratigraphy, and 3) shifts between erosional and depositional processes during fault array development in both single and multi-phase rifts. Our quantitative approach allows us to investigate the impact of normal fault growth on the distribution of sediment source areas and the stratigraphic development through time and space during single and multi-phase rifting.
Materials and Methods
We combine surface deformation maps produced in a self-consistent tectonic code with a surface processes modelling code in order to explore the geomorphic and stratigraphic evolution of single and multi-phase rifts. Rift-related topographies resulting from sequential steps of vertical displacements are generated using a 3D discrete element model that is based on the modelling method of Finch and Gawthorpe (2017). In the tectonic model dynamic normal fault development occurs in response to either a single-phase of extension (single-phase experiment) or two non-colinear phases of extension (multi-phase experiment) (Figure 2B, Supplementary Figures S1, S2). These vertical displacements, adjusted to maintain the tectonic models’ surface at a constant mean elevation of 0 m, are read as input files into the surface process model pyBadlands (Salles et al., 2018).
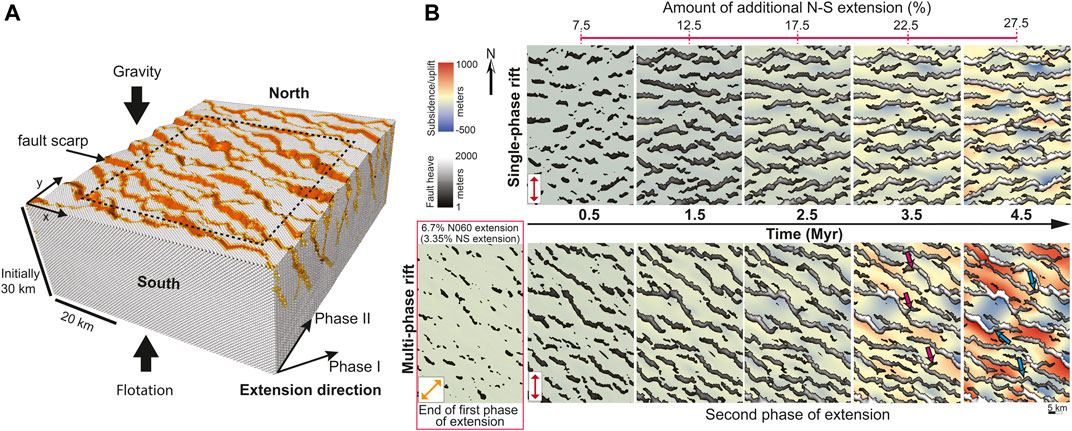
FIGURE 2. (A) Three-dimensional view of the multi-phase discrete element model after 4.5 Myr of the second extensional phase. Orange colors show fault location. (B) Fault heave evolution (grey colors) at 1 Myr time intervals for the single-phase and multi-phase rift experiments, overlain on maps of tectonic subsidence and uplift shown with cold and warm colors, respectively. These experiments were run using the modelling method of Finch and Gawthorpe (2017) for single-phase rifting models. The percentage of additional N-S extension at each time slice is shown at the top of the figure and it is the same for both experiments. Red double arrows on left panels show the direction of N-S extension. Inset illustrates fault pattern at the end of the first extensional phase (i.e., N060 extension direction shown with orange double arrow). Pink arrows at 3.5 Myr time slice show examples of new faults developed during N-S extension that initiate at first phase faults and propagate away from them. Blue arrows at 4.5 Myr time slice show examples of zig-zag fault geometries.
Tectonic Model
The 3D discrete element model of Finch and Gawthorpe (2017) simulates the nucleation, propagation and linkage of normal faults in response to imposed far-field extension (Figure 2A). Faults develop spontaneously in the crust and are defined as pairs of broken bonds between juxtaposed discrete elements (Finch et al., 2004). Once a bond breaks it is not allowed to heal. The continental crust consists of spherical elements and acts as an elastic–brittle–plastic plate floating hydrostatically on a dense and inviscid mantle held in equilibrium around a specified depth (cf. King et al., 1988; Finch and Gawthorpe, 2017). Elements within the upper crust interact through linear elastic repulsive–attractive forces whereas elements of the lower crust interact through linear viscous (Newtonian fluid) forces (Figure 2A and Supplementary Figure S1). The model domain extends 60 km NS and 40 km EW and has a spatial resolution of about 50 m in both directions. The focus of this study is an evaluation of the geomorphic and stratigraphic response to topographic changes in an evolving rift, therefore an outline of the tectonic model methodology and the parameters used are presented in the Supplementary Materials (see “Tectonic model” and Supplementary Table S1), while a full description and the constitutive equations can be found in Finch and Gawthorpe (2017).
In the single-phase experiment, fault development occurs during a 5 Myr period in response to N-S extension (Figure 2B). In the multi-phase experiment, there is first a 2 Myr period of N060 extension and then a second 5 Myr phase of N-S extension (Figure 2B and Supplementary Figure S2). At the end of the first phase of extension there is 6.7% N060 extension that corresponds to an initial 3.35% N-S extension (see inset in Figure 2B). However, and in order to provide a framework for comparing between the models we have intentionally set the reference frame for extension parallel to the single rift case, i.e., N-S extension. This means we are comparing the geomorphic-stratigraphic evolution of two rift systems after equal amounts of N-S extension, however, in which the evolution of the multi-phase rift system is affected by tectonic structures inherited from an earlier phase of extension. The extension rate during both phases is 3.0 mm/yr and the angle between the two extensional phases is 60° (Supplementary Figure S1).
Rift topographies are produced by the tectonic model at 0.5 Myr intervals for both experiments (Supplementary Figure S2). The tectonic model area is increasing as rifting progresses (Supplementary Figure S2), hence generating surfaces from increasing areas with time makes it difficult to understand the drainage network evolution and sedimentation. Using elements that exist within an identical area in the two models at the end of the experiment and mapping their elevations through time, allows to address surface processes response to fault growth (see also Supplementary Materials). This approach preserves changes in the throw on faults within the region and replicates interpretations that are based on using current topographies to infer past rifting, erosion and sedimentation. The generated topographies, adjusted to a mean elevation providing a sea level at 0 m at each time interval, are used to construct maps of incremental surface subsidence and uplift (following Cowie et al., 2006), which are then passed as input parameters to the surface processes model.
Surface Processes Model
We use the surface processes model pyBadlands (Salles and Hardiman, 2016; Salles et al., 2018) to calculate erosion, sediment dispersal and deposition during single and multi-phase rift development. The amount of N-S extension is the same for both experiments (Figure 2B), which allows us to compare the surface processes model results. pyBadlands uses a mass balance approach to allow sediment transport and deposition under varying tectonic and climatic forcing. It integrates hillslope diffusion and river incision by means of the stream power law given by:
where
Climatic variability is not considered in our model and we assume a constant precipitation rate of 1 m/yr. We also assume a spatially uniform bedrock erodibility. Bedrock erodibility coefficient, kd, is set to 2 × 10e−6 which has been previously used to simulate landscape development in rift settings composed of a mixture of carbonate and clastic sedimentary rocks (e.g., Pechlivanidou et al., 2018; Pechlivanidou et al., 2019). Moreover, we have not allowed ultimate base level to fluctuate over time and kept it constant at 0 m elevation. We acknowledge the fact that temporal and spatial variations in precipitation and bedrock erodibility would impact the overall erosion rates and sediment volumes produced in the models. However, having uniform precipitation rate and bedrock erodibility and also keeping base level constant allows us to focus on the impact of tectonics on surface processes during single and multi-phase rifting. Also, by performing a series of sensitivity tests using reduced and increased bedrock erodibility (kd = 1 × 10e−6 and kd = 4 × 10e−6, respectively; see Supplementary Materials), we show that such changes do not impact our overall results concerning surface processes behavior in single versus multi-phase rifts. The model set-up represents a one-way coupling such that sediment erosion, transport and deposition do not affect the tectonic evolution of the rift systems (Cowie et al., 2006). Although feedbacks between surface mass transfer and fault evolution have been demonstrated in extensional settings (e.g., Maniatis et al., 2009; Olive et al., 2014), the impact of surface processes on normal faulting in our models is considered to be minimal since there is no sufficient space created to accommodate large sediment loads (sensu Zwaan et al., 2018).
To simulate rift evolution during the single-phase rifting we use an initial surface topography with a random roughness (Supplementary Figure S3A) that is produced by the tectonic model. For the multi-phase rift experiment, we use the topography and the drainage network configuration that develops from this initial stage at the end of the first phase of extension as the initial surface topography (Supplementary Figure S3B). A summary of the input parameters that we used in pyBadlands are shown in Supplementary Table S2.
Results
Single-Phase Rift
Structural and Topographic Evolution
At the start of the single-phase rift experiment, a large number of isolated E-W trending fault segments nucleate across the model domain (Figure 2B). These initial segments grow by means of tip propagation allowing many of them to have link already by ca. 1 Myr (Figure 2B). However, extension remains distributed among the faults until ca. 2 Myr, and as a result most of the model domain remains submerged below ultimate base level during this first phase of the experiment (first panel; Figure 3A). From ∼2 Myr onwards, fault interaction and linkage progressively localize deformation onto a smaller number of linked fault systems, the total lengths of which varying between 10 and 40 km, limiting small grabens or half-grabens (Figure 2B). These major fault systems rapidly mature and accumulate topographic relief as observed from 2 to 2.5 Myr where most of the hanging wall basin area rises above ultimate base level (Figure 3A). After 5 Myr, maximum elevation in the single-phase rift experiment is approximately 800 m (Figure 4A).
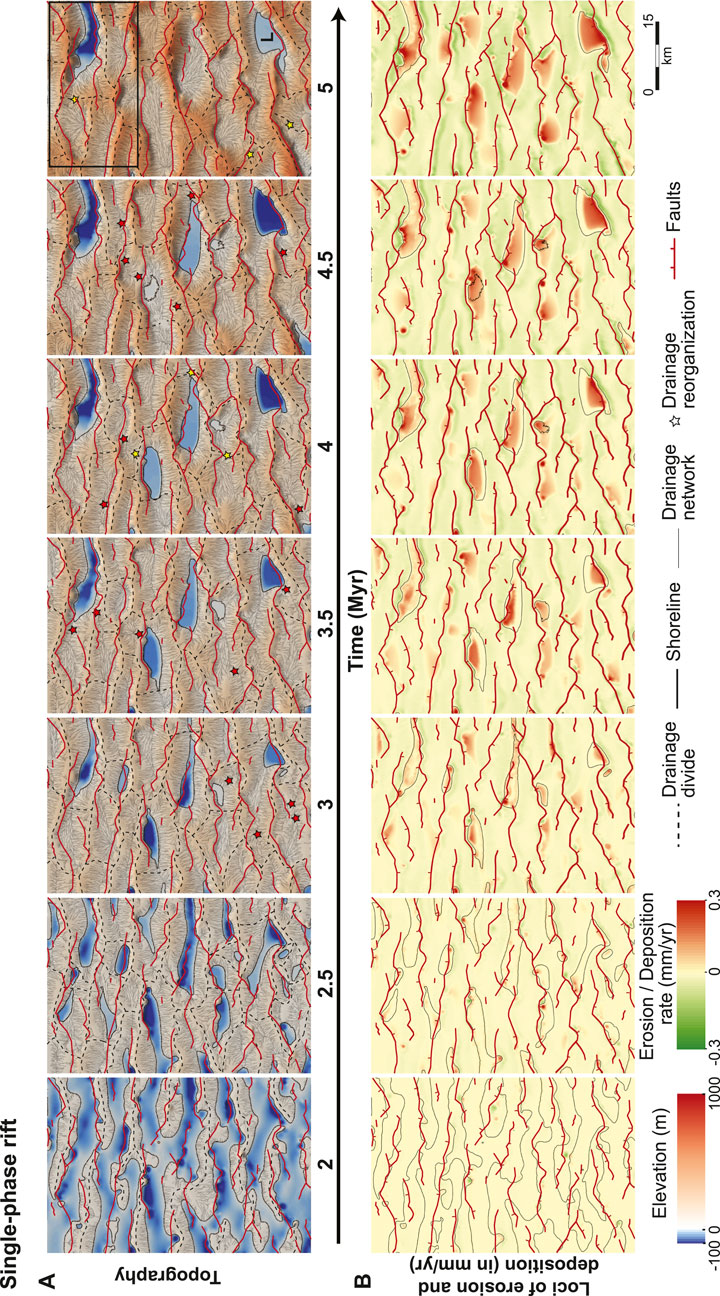
FIGURE 3. Modelling results showing (A) topographic evolution and (B) loci of erosion and deposition from 2 to 5 Myr, at 0.5 Myr intervals, for the single-phase rift experiment. In (A), red stars depict drainage integration events and yellow stars depict drainage isolation. Black box at 5 Myr shows a part of the model area that is illustrated in 3D in Figure 5 and capital letter “L” marks the depocentre shown in inset in Figure 10B.
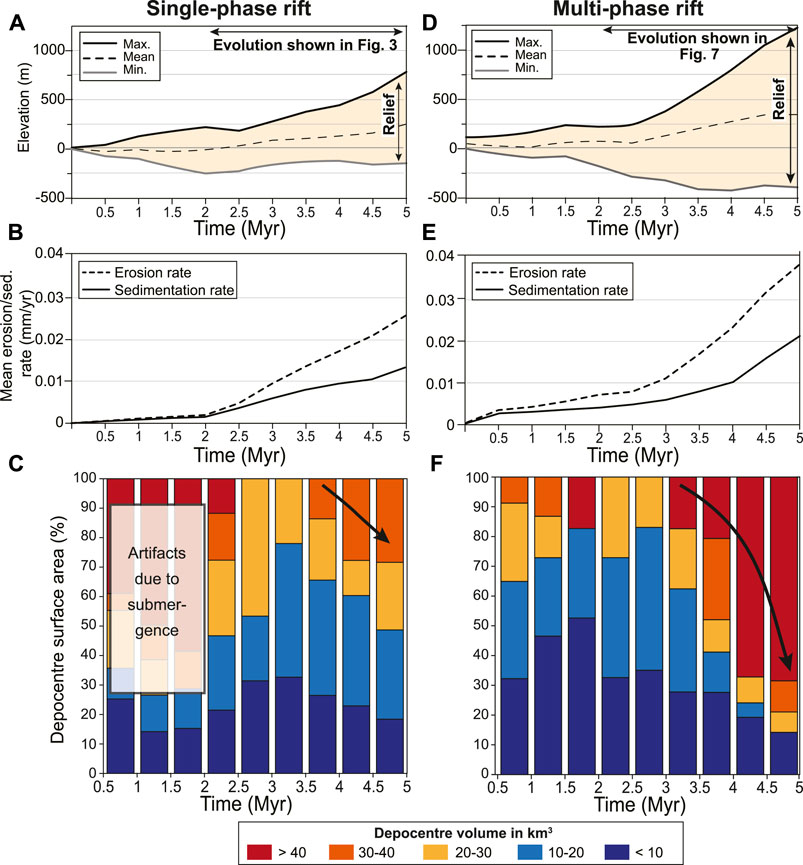
FIGURE 4. Time evolution plots showing maximum, minimum and mean elevations (in m) in (A) and (D), and mean erosion and sedimentation rates (in mm/yr) in (B) and (E), at 0.5 Myr intervals for the single-phase and the multi-phase rift experiments, respectively. Percentage of depocentre surface area (%) over the total model domain is shown for different sized depocenters (in km3) in (C) for the single-phase experiment and in (F) for the multi-phase experiment.
Overall, topographic relief development drives higher erosion, and sedimentation rates that increase by an order of magnitude from 2 to 5 Myr (averaged over 0.5 Myr time intervals; Figures 3B, Figures 4A,B). Relatively small depocentres with volumes <20 km3 merge into larger depocentres in response to fault linkage from 2.5 Myr onwards (Figures 3B, 4C), resulting in the rapid increase of the total surface area of the larger basins (∼30–40 km3) from 3.5 Myr onwards (Figure 4C). While most of these large depocentres continue to evolve above ultimate base level, two major depocentres remain submerged until the end of the experiment (Figure 3A). We have calculated sediment supply, Qs, for one of the major depocentres that remains submerged (see depocentre marked with letter “L” in Figure 3A) and compare it against fault-driven accommodation space, Qacc, and upstream drainage area (see inset in Figure 10B). Our results show that Qs almost equals Qacc after 5 Myr, allowing this depocentre to become nearly filled with sediment (see also the Discussion).
Drainage Network Evolution
In the single-phase rift experiment, drainage network develops from a state in which the subsiding hanging wall areas were submerged below ultimate base level (see first panel in Figure 3A). The geometry of the river network that arises around 2–2.5 Myr is strongly controlled by the fault pattern as the main rivers preferentially flow parallel to fault strike and the divides of the numerous drainage basins largely follow the crests of the major footwall blocks (Figure 3A).
Although, the drainage divides are mostly fault-controlled and therefore more or less fixed, we observe a dynamic evolution of the drainage network as the hydrological connectivity between adjacent drainage basins changes over time. Some initially isolated drainage basins become hydrologically connected with their neighbors (red stars in Figure 3A), which is explained by two different mechanisms: fault linkage and basin overspilling. Linkage of adjacent fault segments and their associated depocentres, results in drainage integration events as illustrated in the example shown in Figure 5. Due to subsidence of an initial segment boundary topographic high, two submerged and initially isolated depocentres are integrated around 2.5–3 Myr (Figures 5A,B). In other cases, the infilling and subsequent overspilling of a basin drives drainage integration. The most upstream basins shown in Figure 5, become overfilled with sediment around 3–3.5 Myr, as evidenced by the flat basin sedimentary surface with equal height as their basin spill-points (Figure 5B).
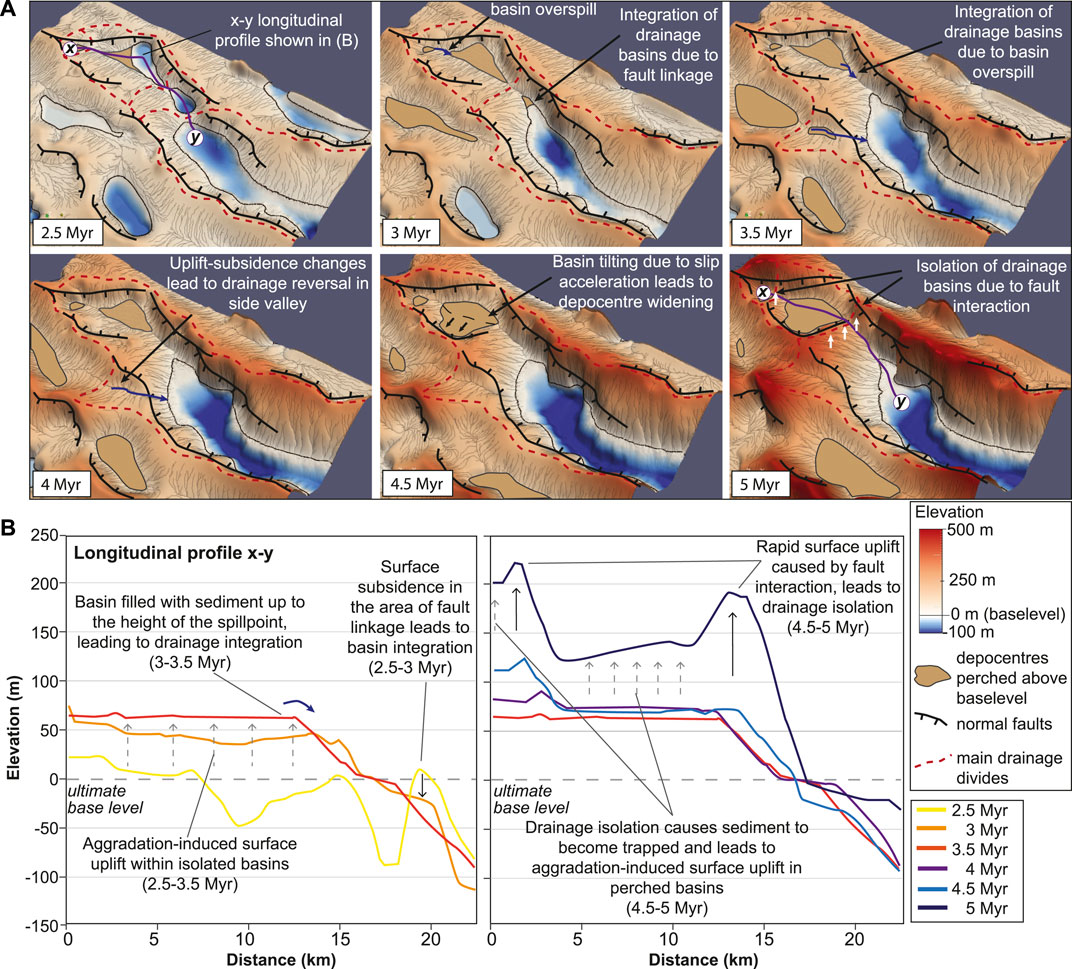
FIGURE 5. (A) Topographic evolution in 3D from 2.5 to 5 Myr for part of the single-phase rift experiment (for location see Figure 3A) showing examples of drainage integration due to basin overspill and fault linkage and examples of drainage isolation in response to fault interaction. (B) x-y longitudinal profile crossing through the basins shown in (A) for the same time period.
Drainage network isolation and the development of internally-drained (endorheic) basins also occurs during the single-phase rift evolution (yellow stars in Figure 3A). Fluvial connections become interrupted by fault interactions, as for example shown in Figure 5, where endorheic conditions are re-established in two depocentres around 4.5–5 Myr. Even though both drainage integration and isolation events occur during the evolution of the single-phase rift experiment, there is an overall long-term trend of increasing drainage network connectivity.
Sediment Dispersal and Basin Stratigraphy
In order to understand stratigraphic evolution during the single-phase rifting, we extracted three N-S orientated stratigraphic profiles that cross the full model domain and the major depocentres (Figure 6). Whereas some depocentres are controlled by two fault systems with opposing dip, the majority of the depocentres are asymmetric and characterized by a half-graben geometry. These cross-sections also show that some faults become dominant at the expense of others that results in significant spatial variability in fault-related relief and the depth and elevation of the individual depocenters (Figure 6).
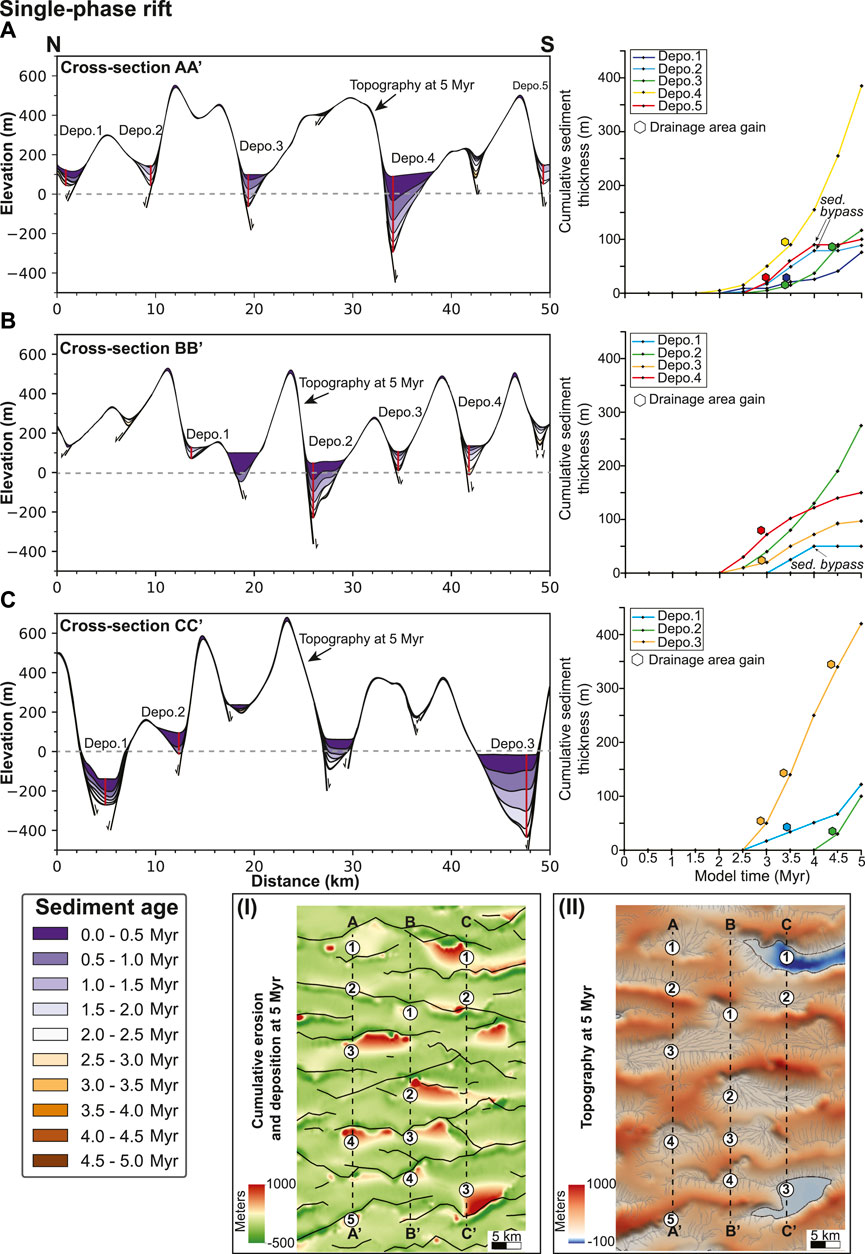
FIGURE 6. Cross sections (A) AA′, (B) BB′, and (C) CC′ in N-S direction showing stratigraphic development with time within rift depocentres for the single-phase rift experiment. Sediment age is illustrated with warm to cold colors at 0.5 Myr intervals. Grey dashed lines in (A), (B), and (C) show the ultimate base level. Plots next to each stratigraphic profile show the cumulative sediment thickness with time calculated within each depocentre at its deepest location (see red solid lines in cross-sections in (A), (B), and (C)). Insets (I) and (II) depict the location of the cross-sections with dashed lines onto the map showing the loci of cumulative erosion and deposition and the topographic map at 5 Myr, respectively, and numbers 1–5 depict the location of the depocentres shown in (A), (B) and (C).
Due to submergence of most of the model domain below ultimate base level during the first ca. 2 Myr, mean erosion and sedimentation rates (averaged over 0.5 Myr time intervals) remain very low during this initial stage of the single-phase rift experiment (<0.005 mm/yr; Figure 4B). From 2 Myr onwards, however, emergence of most parts of the model domain produces a marked increase in erosion and sedimentation rates (Figure 4B). In turn, this results in a transition from marine/lacustrine to fluvial deposition.
Stratigraphy varies significantly between the different hangingwall depocentres during the single-phase rifting (Figure 6). There is a large variability in total sediment thickness among the depocentres, fluctuating between ∼50 m and ∼500 m, and as the majority of deposition occurs during the last 3 Myr of the experiment this implies long-term average sedimentation rates in the order of ∼0.015–0.15 mm/yr. Time plots of cumulative sediment thickness show a pronounced temporal variability in sedimentation rates within the deepest parts of each of the developing depocentres (see panels on the right-hand side in Figure 6). Although most of the basins show a gradual increase in sedimentation rates as the accumulation of fault-related relief drives higher erosion rates along the basin margins, there are some depocentres where sediment accumulation rates become constant (e.g., Depo. 2 and 5; Figure 6A and Depo. 1; Figure 6B). The observed temporal variability within individual depocentres also relates to drainage reorganization events that cause marked changes in the upstream drainage area and therefore, have an impact on the amount of sediment supply. For example, the cumulative sediment thickness in depocentre 3 in cross-section CC’ (Figures 3A, 6C) increases rapidly after 3 Myr due to increased drainage area driven by multiple drainage reorganization events.
Multi-Phase Rift
Structural and Topographic Evolution
In the multi-phase rift experiment, the second phase of extension commences from a state with fault structures (left most panel in Figure 2B) and associated topographic relief (mean elevation ∼50 m, Supplementary Figure S3) inherited from the first 2 Myr phase of extension. From the beginning of the second phase of extension, strain becomes distributed on both the pre-existing faults oriented oblique to the second phase of extension direction as well as a growing number of newly developing faults striking perpendicular to the extension direction (Figure 2B). These two groups of faults link and develop characteristic zig-zag planform pattern of faulting, and both groups of faults remain active during the full experiment (see blue arrows in Figure 2B). So, despite the change in extension direction, the inherited structures continue to accommodate part of the deformation during the second phase of rifting and strongly influence the geometry of resulting basins.
Even though there is inheritance of topography in the second rift phase, maximum faulting-induced elevations remain low, < 250 m, during the first ∼2.5 Myr of the second rift phase (Figure 4D). From ∼2.5 Myr onwards, however, there is a rapid increase in maximum elevations up to ca. 1,600 m (Figures 4D, 7A). Mean erosion and sedimentation rates follow similar trends, with low values, < 0.01 mm/yr, during the first ∼2.5 Myr, followed by a rapid increase up to 0.04 mm/yr and 0.02 mm/yr respectively, after 5 Myr (Figures 4E, 7B). A key observation during the second rift phase is the development of a small number of very large depocentres limited by the interacting pre-existing and neo-formed faults from ∼3.5 Myr onwards, which become submerged below ultimate base level (Figure 7A). The total surface area of these what we call “mega-depocentres” with depocenter volumes >40 km3, reaches up to ca. 70% of the total depocenter surface area after 5 Myr (Figure 4F). These mega-depocentres remain underfilled at the end of simulation, despite the pronounced increase in the average sedimentation rates after 2.5 Myr (Figure 4E). For example, mega-depocentre marked with “L” in Figure 7A remains underfilled after 5 Myr as sediment supply, Qs, cannot outpace fault-controlled accommodation space, Qacc (see inset in Figure 10D in the Discussion).
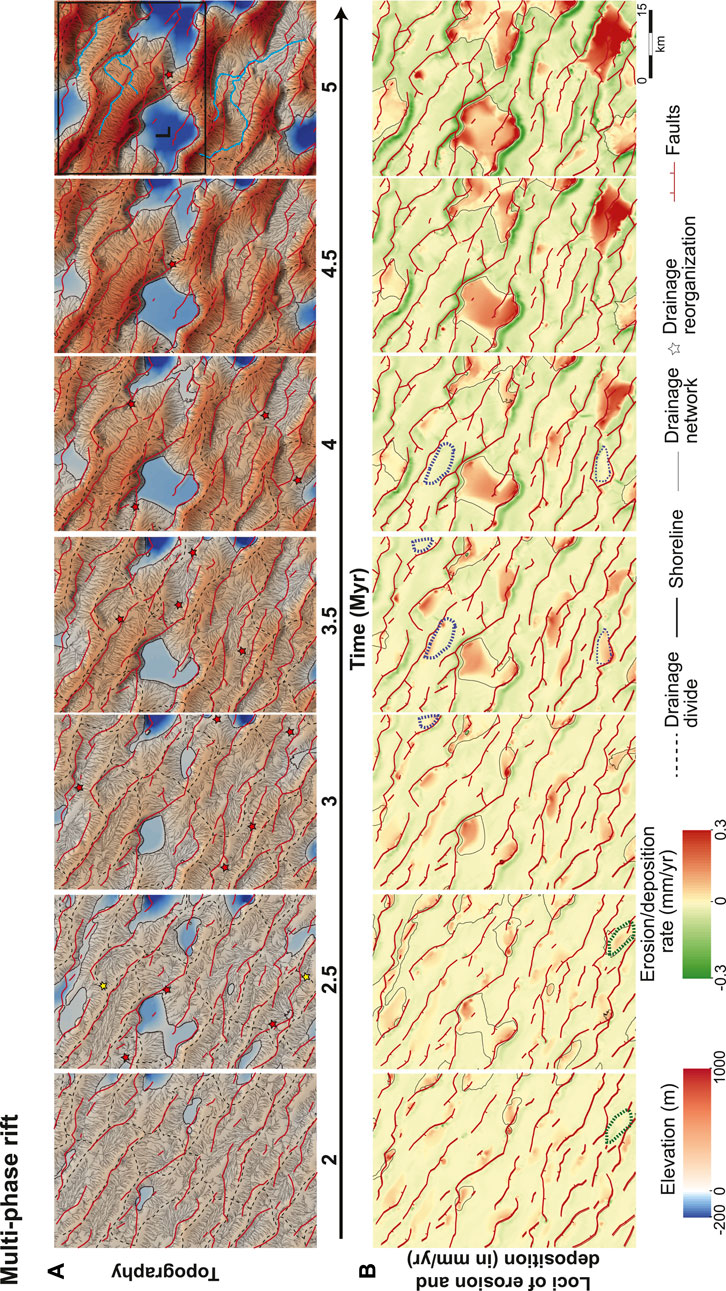
FIGURE 7. Modelling results showing (A) topographic evolution and (B) loci of erosion and deposition from 2 to 5 Myr, at 0.5 Myr intervals, for the multi-phase rift experiment. In (A), red stars depict drainage integration events and yellow stars depict drainage isolation. Black box at 5 Myr shows a part of the model area that is illustrated in 3D in Figure 8 and capital letter “L” marks the basin shown in inset in Figure 10D. Blue lines depict the major rivers at 5 Myr. In (B), green and blue dashed lines show examples of areas that evolved from erosional to depositional and vice versa.
Drainage Network Evolution
In the multi-phase rift experiment, the drainage network configuration is inherited from the first phase of extension (Supplementary Figure S3B). During the second phase of extension, this inherited drainage network progressively adjusts to the new structures developed as a result of the evolving fault network. The resultant drainage network is relative complicated with streams in some parts oriented parallel to the first rift phase faults, whereas in other parts streams are parallel to the newly formed second phase faults, resulting in characteristic hook-shaped rivers (e.g., blue major rivers at 5 Myr; Figure 7A).
Dynamic drainage reorganization in the multi-phase rift experiment is expressed by both drainage integration (red stars) and isolation (yellow stars) events between adjacent basins. For example, the depocentres shown in Figure 8 become fluvially integrated with one another between 3 and 4 Myr due to a combination of basin overfilling and structural linkage of depocentres. Both the drainage integration and isolation events modify the hydrological connectivity of the drainage network and produce large shifts in the dimensions of the main drainage basins. However, over the long-term there is clearly a progressive increase in the hydrological connectivity of the drainage network, leading to the formation of a smaller number of large catchments (Figure 7A).
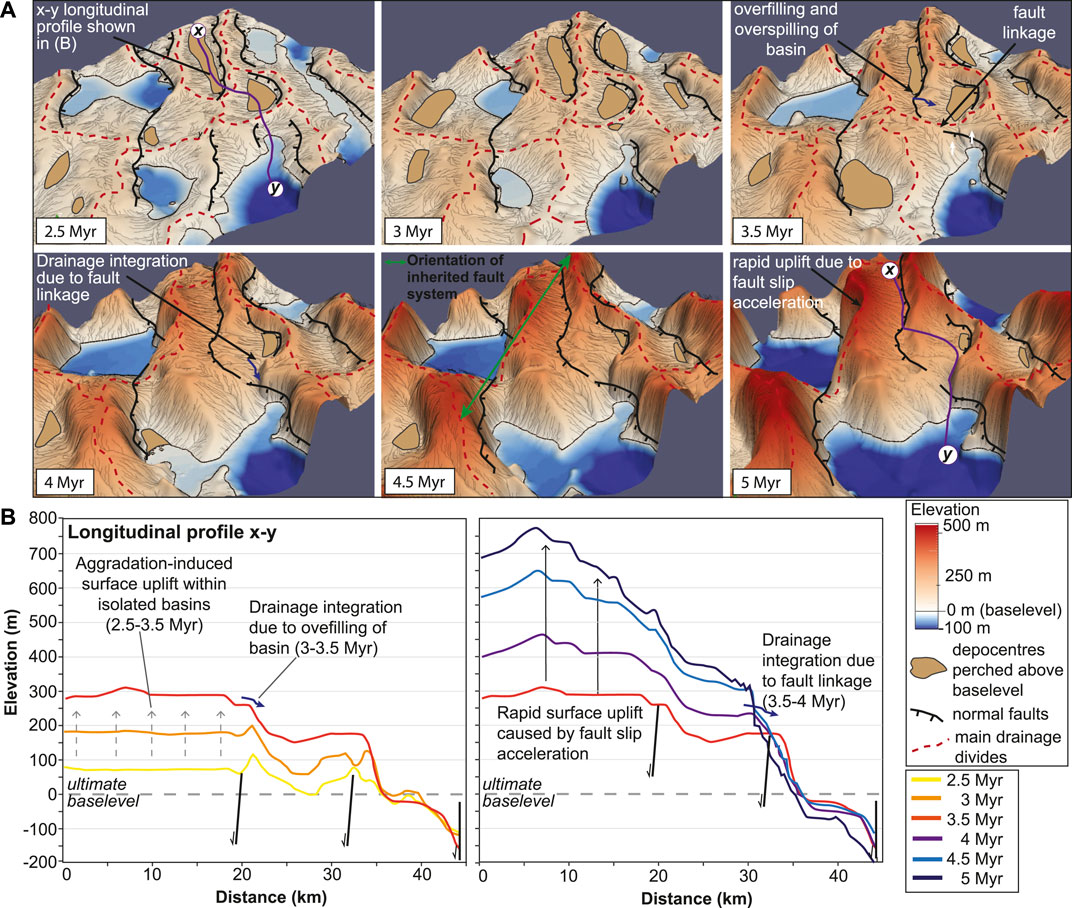
FIGURE 8. (A) Topographic evolution in 3D from 2.5 to 5 Myr for part of the multi-phase rift experiment (for location see Figure 7A) showing examples of drainage integration due to basin overspill and fault linkage and examples of drainage isolation in response to fault interaction. (B) x-y longitudinal profile crossing through the basins shown in (A) for the same time period.
Sediment Dispersal and Basin Stratigraphy
While there is a large number of relative small depocentres (<20 km3) around 2 Myr (Figures 4F, 7B), only some of them develop into very large depocentres that are located in the hangingwalls of the most active faults (Figure 7B). The formation of the very large mega-depocentres (>40 km3) results from some depocentres merging with their adjacent ones located across-strike. The stratigraphic profiles in Figure 9 for example show that after 5 Myr, some of the largest depocentres of the multi-phase rift experiment, e.g., depocentre 2 in cross-section AA′, depocentre 3 in cross-section BB′, and depocentre 1 in cross-section CC’ (Figure 9) formed by gradual across-strike linkage of initially individual depocentres. We also observe that some depocentres are transformed into areas of erosion from 3.5 Myr onwards (see areas marked with blue dashed lines in Figure 7B). For example, the depocentres shown in the x-y profile in Figure 8 develop above ultimate base level until ca 3.5 Myr in the immediate hanging wall of first phase faults, however, they are transformed into areas of erosion after ca. 4 Myr in response to fault linkage and rapid surface uplift. These shifts from deposition to erosion are easily observed in the stratigraphic record, where sediment accumulation terminates and is replaced by sediment bypass and erosion (Figure 9). The inverse may also occur where an area changes from erosional to depositional processes. In this experiment, an early area of erosion is transformed into an area of deposition once it subsides onto the hanging wall of a reactivated first phase fault that is linked to a second phase fault (see area marked with green dashed line at 2–2.5 Myr in Figure 7B). Furthermore, we observe cases where the locus of sediment accumulation changes over time, for example, relict deposits within depocentre 4 (Figure 9A) indicate a shift in the location of sediment accumulation after ca 2.5 Myr.
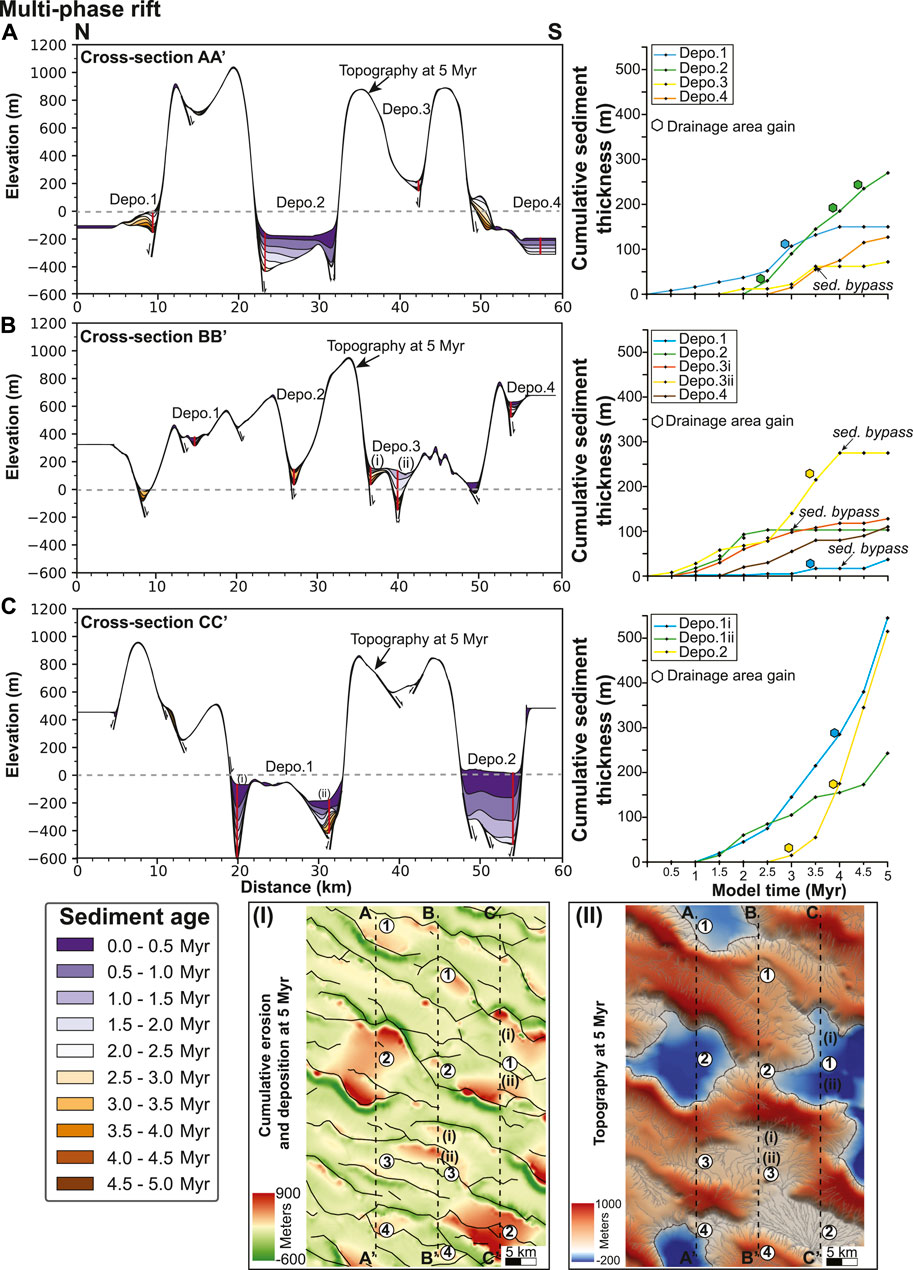
FIGURE 9. Cross sections (A) AA′, (B) BB′ and (C) CC′ in N-S direction showing stratigraphic development with time within rift depocentres for the multi-phase rift experiment. Sediment age is illustrated with warm to cold colors at 0.5 Myr intervals. Grey dashed lines in (A), (B), and (C) show the ultimate base level. Plots next to each stratigraphic profile show the cumulative sediment thickness with time calculated within each depocentre at its deepest location (see red solid lines in cross-sections in (A), (B), and (C)). Insets (I) and (II) depict the location of the cross-sections with dashed lines onto the map showing the loci of cumulative erosion and deposition and the topographic map at 5 Myr, respectively, and numbers 1–4 depict the location of the depocentres shown in (A), (B), and (C).
There is significant variability between depocentres in terms of total sediment thickness (varying between 40 and 550 m for the depocentres shown in Figure 9) and, therefore, in long-term average sedimentation rates. A key observation is the low sedimentation rates for most depocentres until approximately 2–2.5 Myr (see plots of cumulative sediment thickness with time in Figure 9). For the major depocentres, these relatively low sedimentation rates are followed by a pronounced increase associated with the growth of topographic relief and the increase in average erosion rates. The increase in sedimentation rates is also associated with long-term increase in fluvial connectivity of the drainage network. For instance, depocentre 1i in cross section CC’ shows a marked increase in sedimentation rates from 3.5 Myr in response to an upstream drainage area increase (of the order of 200 km2) as a consequence of drainage integration (Figures 7A, 9C). For many of the smaller depocentres, on the other hand, sedimentation slows down over time (e.g., depocentres 1 and 3; Figure 9A and depocentre 2; Figure 9B).
Discussion
Most studies on multi-phase rifts focus on structural inheritance and controls on the structural style and evolution and not on the effects of multiple phases of extension on erosion-deposition and the resultant syn-rift stratigraphic evolution. The motivation of this study is to investigate the differences in topographic evolution, erosion and basin stratigraphy between single and multi-phase rifting, following a numerical modelling approach. We compare the results from two experiments for a 5 Myr period during which they experience equal amounts of N-S extension, but with one experiment (i.e., the multi-phase experiment) characterized by fault structures inherited from a previous, 2 Myr phase of extension (Figure 2B and Supplementary Figure S2). In the multi-phase rift experiment the overall fault growth mimics the multi-phase analogue experiments of Henza et al. (2010), Henza et al. (2011) and Wang et al. (2021) where two phases of non-colinear extension are involved. In their studies, the second-phase normal faults link with reactivated first-phase faults leading to the development of zig-zag fault patterns, similar to the results from the fault growth model that we use here. Moreover, in our fault growth model the second phase faults are significantly shorter than the first phase faults (see pink arrows in Figure 2B), which also matches multi-phase analogue model results (e.g., Henza et al., 2011). In the tectonic model that we use in this study, a readjustment period early in the second phase of extension is observed. First phase faults still have a component of growth oriented to the first extensional phase that is stored within them which does not instantaneously switch off when rift orientation changes. Hence, “hybrid” fault growth (cf. Rotevatn et al., 2018, 2019) exists early in the second extensional phase with first phase faults propagating perpendicular to the first extensional phase and at the same time are growing through tip propagation in the second extensional phase. This readjustment phase can last ∼1–2 Myr in our tectonic model and it may not be observed in analogue models due to the fact that occurs relatively quickly by comparison. A schematic summary of the topographic, drainage network and stratigraphy evolution at early and later stages of rifting for the single and the multi-phase rift experiments are shown in Figure 10.
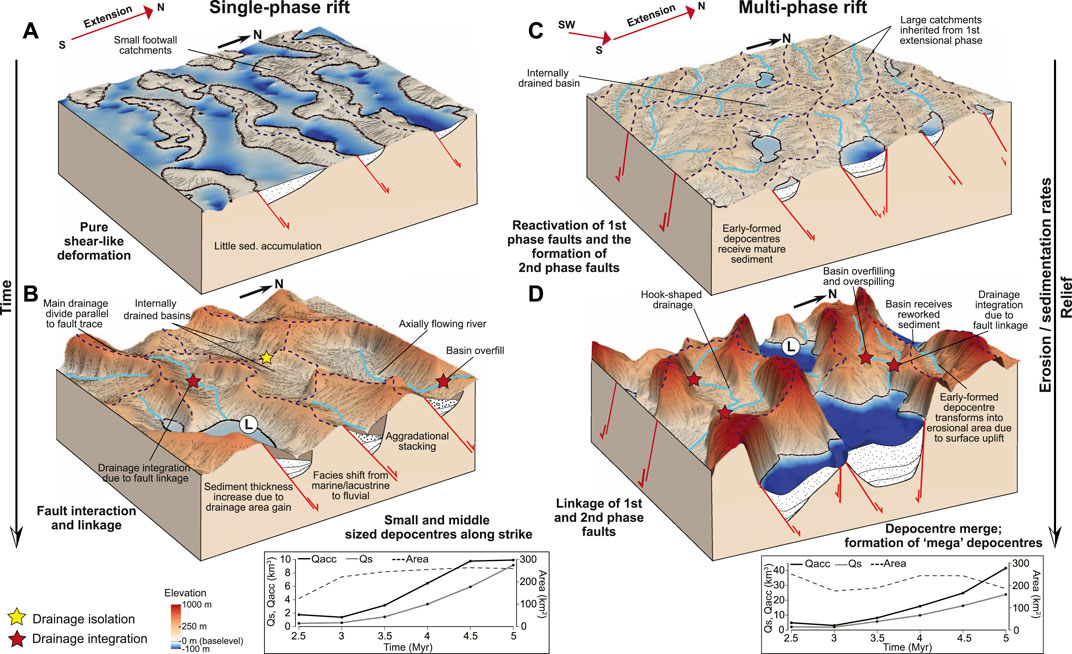
FIGURE 10. Block diagrams illustrating the evolution of topography, drainage network and stratigraphy at an early stage of rifting in (A) and (C), and at a later stage of rifting in (B) and (D), for the single-phase and the multi-phase rift experiments, respectively. Insets in (B) and (D) show time evolution plots from 2.5 to 5 Myr of sediment supply, Qs (in km3), fault-controlled accommodation creation, Qacc (in km3), and upstream drainage area (in km2) for two basins formed during the single and multi-phase rifting, respectively (for location see Figures 3A, 7A). Note that the upstream drainage area remains fairly constant and variations in sediment production are due to topographic relief development that leads to increase in catchment average erosion rates over time.
Topographic Evolution
During the early stages of rift evolution (i.e., 2 Myr), topographic relief remains very low in both experiments (Figures 4A,D), however, maximum elevations are slightly higher during multi-phase rifting (Figure 4D). This is due to inherited structures from the first phase of extension contributing to the second phase of extension (i.e., from ∼0.5 Myr, see Figure 2B) forming longer faults segments with larger throw compared to the single-phase rift. Even though this difference is subtle, it results in more than three times higher average erosion rates and, therefore, higher sediment flux in the multi-phase rift compared to the single-phase rift (i.e., 0.002 mm/yr and 0.007 mm/yr after 2 Myr, respectively; see dashed lines in Figures 4B,E). Overall, average sedimentation rates are three times higher during the early stages of multi-phase rifting compared to the single-phase rifting (i.e., 0.001 mm/yr and 0.004 mm/yr, respectively; see solid lines in Figures 4B,E).
Furthermore, inheritance of structures from the first extensional phase allows the accumulation of fault offsets and associated relief to accelerate faster during the later stages of multi-phase rifting (i.e., ∼1,250 m and ∼750 m after 5 Myr, respectively; Figures 4A,D), and consequently, results in higher mean erosion and sedimentation rates compared to the single-phase rifting (i.e., mean erosion rates 0.025 and 0.04 mm/yr, mean sedimentation rates 0.013 and 0.02 mm/yr at 5 Myr, respectively; Figures 4B,E).
Drainage Network Reorganization
A key characteristic of the single and multi-phase rifts is the strong structural control on drainage network. During the early stages of the single-phase extension (i.e., ∼2 Myr), drainage network development is limited to small, low relief catchments draining transversely fault controlled footwalls (Figure 3A). In contrast, the multi-phase drainage network over the same time interval is characterized by larger catchments that drain relatively high pre-existing relief (Figure 7A). The pattern of this well-developed drainage network shows a general direction that is parallel to the first phase faults. This is partially due to the small number of newly second phase faults that have formed by this time (see Figure 2B). However, given that the duration of the first extensional phase in our experiment is 2 Myr, this also suggests that more time is needed for the drainage network to readjust to the new state once the sediment routes have been established.
After 5 Myr, large axial river systems dominate the single-phase rift topography with relatively small transverse catchments draining the uplifting footwalls (Figures 3A, 10B). Gawthorpe and Leeder (2000) show that during the linkage and through-going fault stage the drainage network is characterized by major axial drainages as well as by transverse catchments that mark breached fault segments, an observation that agrees with our model results for the single-phase rift. In the multi-phase rift experiment, on the other hand, fault interactions between first phase and second phase faults lead to the development of more complex drainage network patterns, such as characteristic hook-shaped patterns (Figures 7A, 10D). Excellent examples of such drainage network patterns are found in the multi-phase Mygdonia Rift, where rivers are in some parts oriented parallel to the first phase, NW-SE faults, whereas in other parts are parallel to the second phase, E-W, faults (Figure 1B). Although such patterns are a common feature of active, single-phase rifts that result from across-strike fault interactions (e.g., Eliet and Gawthorpe, 1995; Cowie et al., 2006), our modelling results show that the development of these drainage network patterns also emerges from fault interactions between first and second phase faults during multi-phase rifting.
An important outcome of this study is the very dynamic evolution of the drainage network (Figures 3A, 7A). In both rift experiments, fluvial connections between adjacent basins can, first of all, develop as a consequence of faults interaction that causes the basins to integrate. Faults propagation and linkage lead topographic ridges that initially separate adjacent basins to subside, and, therefore, fluvial connections are being established (Figures 5B, 8B). A second mechanism leading to drainage integration between adjacent basins is the overfilling of the upstream basin with sediment, allowing it to overspill and establish a fluvial connection with its downstream neighbor (Figures 5B, 8B). The importance of basin overfill for drainage integration has been inferred for natural extensional systems, for example the central Italian Apennines (Geurts et al., 2018, 2020) and various valley systems in the Basin and Range (e.g., Hilgendorf et al., 2020). The opposite trend towards isolation of basins also occurs in both rift topographies. In all the cases observed, drainage isolation is caused by fault interaction and linkage and uplift of new footwall topography across an initially ongoing river system. Interestingly, both drainage integration and isolation can occur at the same locality during the ongoing development of the fault network (e.g., Figure 5B). Overall, there is a gradual increase in the hydrologic connectivity of the drainage network in both experiments as faults become progressively linked. From 4 Myr onwards, however, the multi-phase drainage network remains fairly stable. Cowie et al. (2006) show that drainage stabilization marks the phase when fault arrays become fully linked and slip rates are higher and more uniform. Our results suggest that this phase is reached ∼1 Myr earlier during the multi-phase rift evolution, as pre-existing structures facilitate fault linkage.
Drainage reorganization has a direct impact on sediment flux and accumulation rates. Temporal variability in sediment accumulation rates reflects changes in the upstream area that occur in response to drainage reorganization events (Figures 6, 9). However, a profound difference between the single and multi-phase rift experiments resulting from drainage reorganization is the formation of larger drainage catchments, and thus higher sediment supply into the basins formed during multi-phase rifting (Figures 3A, 7A, 10B,D).
Depocentre Evolution and Implications for Sedimentary Facies Development
An important difference between single and multi-phase rift experiments is the development of significantly larger syn-rift depocentres during multi-phase rifting (Figures 4C,F, 10B,D). The surface area of depocentres larger than >40 km3 increases significantly in the multi-phase rift experiment from ca. 3 Myr onwards, reaching up to 70% of the total surface area (Figure 4F). These “mega-depocentres” are not developing during the single-phase rift experiment, where there is a relatively equal contribution of depocentres with volumes <40 km3 after 5 Myr (Figure 4C).
Syn-rift stratigraphy also shows significant differences between single and multi-phase rift experiments. Our results show that sediment accumulates within syn-rift depocentres from the early stages of the second phase of multi-phase rifting, whereas sediment accumulation is limited during the single-phase rifting (Figures 6, 9, 10). Sediment that is deposited in the multi-phase rift during this stage is likely to be mature, as it is being transported over relative long distances from the well-developed drainage system inherited from the first stage of rifting (see 2 Myr in Figure 7A). During the later stages of rifting, sedimentary successions with variable thicknesses accumulate in both rift settings (i.e., 2–5 Myr, Figures 6, 9, 10B,D). However, in the single-phase rift experiment, the majority of depocentres that develop below ultimate base level become filled to spill-point or overfilled by 5 Myr (Figure 3A, 10B). In contrast, despite higher average sedimentation rates and significant increase in sediment accumulation over time in the multi-phase rift experiment, depocentres that develop below ultimate base level remain underfilled (Figures 7, 10D). This difference between the two rift settings highlights competing roles of sediment supply and fault-controlled subsidence in controlling syn-rift stratigraphic evolution. Our analysis shows that rift basins do not necessarily grow into underfilled basins as generic models suggest (c.f., Gawthorpe and Leeder, 2000), if sediment supply keeps pace with the formation of fault-controlled accommodation during a simple, single-phase rift evolution. Inset in Figure 10B shows an example of temporal evolution of sediment supply, Qs (in km3), and fault-driven accommodation space, Qacc (in km3), for one representative basin from the single-phase rift experiment (for location see Figure 3A). Qs increases as higher topographic relief drives higher erosion rates from ca. 3 Myr onwards. Fault-controlled accommodation space Qacc also increases over time, however, it remains approximately constant from 4.5 Myr onwards. This allows Qs to almost equal Qacc after 5 Myr, in turn allowing the basin to become nearly filled with sediment. In more complex rift settings, such as the multi-phase rift experiment in this study, basins likely develop under sediment-starved conditions. For example, Qacc for the basin shown in inset in Figure 10D (for location see Figure 7A) increases significantly from 3 Myr as first phase faults link to second phase faults. The result is the development of a large “mega-depocentre” (Qacc > 40 km3), where sediment supply cannot outpace accommodation space and thus, the basin remains underfilled.
The profound differences in depocentre development between the single and multi-phase rift experiments have implications for syn-rift stratigraphic evolution. In the single-phase rift experiment, stratigraphic patterns are characterized by aggradational stacking and most depocentres are filled with sediment (Figure 6). In depocentres which initially develop below ultimate base level and emerge later, sedimentary facies shift from marine/lacustrine to fluvial. These stratigraphic patterns have also been observed in natural extensional settings, such as the central Apennines, where the transition from lacustrine to fluvial sedimentation is commonly observed in basin stratigraphy (e.g., Geurts et al., 2020). In contrast, the development of mainly large depocentres (>40 km3) during multi-phase rifting that gradually subside below ultimate base level, imply a shift in sedimentary facies from alluvial to lacustrine/marine. Sedimentary infill within these basins likely consists of reworked material as pre-existing topography is eroded during the subsequent extensional phase and areas of deposition change into areas of erosion (Figure 10D). For example, sedimentary fill in the multi-phase Mygdonia Rift shows a transition from fluvial sediments (e.g., conglomerates, sandstones and red-beds) that were deposited at the hanging wall of first phase faults to deltaic/lacustrine sediments mainly deposited at the hanging wall of second phase faults (Psilovikos, 1977). At the southern margins of this rift, deposits of the first extensional phase are incising during the second phase of extension leading to the formation of large fan deltas in Lake Volvi (Figure 1B).
Conclusion
This numerical modelling study investigates the geomorphic and stratigraphic evolution of rift basins that develop in response to single (single-phase rift experiment) and two phases of extension (multi-phase rift experiment). We compare the results from the single and multi-phase rift experiments which experience similar amounts of extension during a 5 Myr period, with the multi-phase rift experiment characterized by structures inherited from a previous, 2 Myr phase of extension. We conclude that:
1) Dynamic drainage network characterizes single and multi-phase rift evolution. Drainage integration events occur when adjacent depocentres combine in response to fault growth and linkage, or when depocentres become overfilled with sediment and overspill. Fluvial isolation and the formation of endorheic basins also occurs, however, in the long-term there is a progressive increase in hydrologic connectivity as faults link.
2) Inherited structures from the preceding extensional phase accelerate the accumulation of topographic relief and promote the development of large depocentres that become underfilled with sediment as fault-controlled accommodation outpaces sediment supply during multi-phase rifting. Conversely, lower relief and small to medium-sized depocentres that grow into overfilled basins dominate the single-rift topography.
3) Temporal variability in sedimentation rates in single and multi-phase rifts reflects changes in upstream drainage area that occur in response to drainage reorganization events. However, during multi-phase rifting areas can experience shifts from erosion to deposition and vice-versa, which results in incomplete stratigraphic records and the reworking of sediments.
4) Syn-rift stratigraphic development show reverse trends during single and multi-phase rifting, with sedimentary facies changing from marine/lacustrine to fluvial in the single-phase rift and from fluvial to marine/lacustrine in the multi-phase rift.
Data Availability Statement
The original contributions presented in the study are included in the article/Supplementary Material, further inquiries can be directed to the corresponding author.
Author Contributions
SP designed the study, performed the experiments and wrote the article. AG designed the study and wrote the article GD helped in performing the experiments RG wrote the article CP designed the study and wrote the article EF provided the data to perform the experiments.
Funding
This study received funding from the MultiRift project founded through the PETROMAKS 2 program of the Research Council of Norway (Project number: 215591).
Conflict of Interest
The authors declare that the research was conducted in the absence of any commercial or financial relationships that could be construed as a potential conflict of interest.
Publisher’s Note
All claims expressed in this article are solely those of the authors and do not necessarily represent those of their affiliated organizations, or those of the publisher, the editors and the reviewers. Any product that may be evaluated in this article, or claim that may be made by its manufacturer, is not guaranteed or endorsed by the publisher.
Acknowledgments
We thank guest Associate Editor Frank Zwaan and two reviewers for their very constructive comments on an earlier draft. The University of Bergen is acknowledged for supporting Open Access publication. This study was designed by Patience Cowie, who although no longer with us continues to inspire us with her outstanding work.
Supplementary Material
The Supplementary Material for this article can be found online at: https://www.frontiersin.org/articles/10.3389/feart.2021.748276/full#supplementary-material
References
Bell, R. E., Jackson, C. A. L., Whipp, P. S., and Clements, B. (2014). Strain Migration during Multiphase Extension: Observations from the Northern North Sea. Tectonics 33 (10), 1936–1963. doi:10.1002/2014tc003551
Bellahsen, N., and Daniel, J. M. (2005). Fault Reactivation Control on normal Fault Growth: an Experimental Study. J. Struct. Geology 27 (4), 769–780. doi:10.1016/j.jsg.2004.12.003
Bladon, A. J., Clarke, S. M., and Burley, S. D. (2015). Complex Rift Geometries Resulting from Inheritance of Pre-existing Structures: Insights and Regional Implications from the Barmer Basin Rift. J. Struct. Geology 71, 136–154. doi:10.1016/j.jsg.2014.09.017
Chattopadhyay, A., and Chakra, M. (2013). Influence of Pre-existing Pervasive Fabrics on Fault Patterns during Orthogonal and Oblique Rifting: An Experimental Approach. Mar. Pet. Geology 39 (1), 74–91. doi:10.1016/j.marpetgeo.2012.09.009
Chatzipetros, A. A., and Pavlides, S. B. (1998). A Quantitative Morphotectonic Approach to the Study of Active Faults; Mygdonia basin, Northern Greece. Bull. Geol. Soc. Greece XXXII/1, 155–164.
Cowie, P. A. (1998). A Healing-Reloading Feedback Control on the Growth Rate of Seismogenic Faults. J. Struct. Geology 20 (8), 1075–1087. doi:10.1016/s0191-8141(98)00034-0
Cowie, P. A., Attal, M., Tucker, G. E., Whittaker, A. C., Naylor, M., Ganas, A., et al. (2006). Investigating the Surface Process Response to Fault Interaction and Linkage Using a Numerical Modelling Approach. Basin Res. 18 (3), 231–266. doi:10.1111/j.1365-2117.2006.00298.x
Dinter, D. A., and Royden, L. (1993). Late Cenozoic Extension in Northeastern Greece: Strymon Valley Detachment System and Rhodope Metamorphic Core Complex. Geology 21 (1), 45. doi:10.1130/0091-7613(1993)021<0045:lceing>2.3.co;2
Eliet, P. P., and Gawthorpe, R. L. (1995). Drainage Development and Sediment Supply within Rifts, Examples from the Sperchios Basin, Central Greece. J. Geol. Soc. 152, 883–893. doi:10.1144/gsjgs.152.5.0883
Finch, E., and Gawthorpe, R. (2017). Growth and Interaction of normal Faults and Fault Network Evolution in Rifts: Insights from Three-Dimensional Discrete Element Modelling. Geol. Soc. Lond. Spec. Publications 439 (1), 219–248. doi:10.1144/sp439.23
Finch, E., Hardy, S., and Gawthorpe, R. (2004). Discrete-element Modelling of Extensional Fault-Propagation Folding above Rigid Basement Fault Blocks. Basin Res. 16 (4), 467–488. doi:10.1111/j.1365-2117.2004.00241.x
Frankowicz, E., and McClay, K. R. (2010). Extensional Fault Segmentation and Linkages, Bonaparte Basin, Outer North West Shelf, Australia. Bulletin 94 (7), 977–1010. doi:10.1306/01051009120
Gawthorpe, R. L., and Leeder, M. R. (2000). Tectono-sedimentary Evolution of Active Extensional Basins. Basin Res. 12 (3-4), 195–218. doi:10.1046/j.1365-2117.2000.00121.x
Geurts, A. H., Cowie, P. A., Duclaux, G., Gawthorpe, R. L., Huismans, R. S., Pedersen, V. K., et al. (2018). Drainage Integration and Sediment Dispersal in Active continental Rifts: A Numerical Modelling Study of the central Italian Apennines. Basin Res. 30 (5), 965–989. doi:10.1111/bre.12289
Geurts, A. H., Whittaker, A. C., Gawthorpe, R. L., and Cowie, P. A. (2020). Transient Landscape and Stratigraphic Responses to Drainage Integration in the Actively Extending central Italian Apennines. Geomorphology 353, 107013. doi:10.1016/j.geomorph.2019.107013
Gupta, S., Cowie, P. A., Dawers, N. H., and Underhill, J. R. (1998). A Mechanism to Explain Rift-basin Subsidence and Stratigraphic Patterns through Fault-Array Evolution. Geology 26 (7), 595. doi:10.1130/0091-7613(1998)026<0595:amterb>2.3.co;2
Henstra, G. A., Rotevatn, A., Gawthorpe, R. L., and Ravnås, R. (2015). Evolution of a Major Segmented normal Fault during Multiphase Rifting: The Origin of Plan-View Zigzag Geometry. J. Struct. Geology 74, 45–63. doi:10.1016/j.jsg.2015.02.005
Henza, A. A., Withjack, M. O., and Schlische, R. W. (2011). How Do the Properties of a Pre-existing normal-fault Population Influence Fault Development during a Subsequent Phase of Extension? J. Struct. Geology 33 (9), 1312–1324. doi:10.1016/j.jsg.2011.06.010
Henza, A. A., Withjack, M. O., and Schlische, R. W. (2010). Normal-fault Development during Two Phases of Non-coaxial Extension: An Experimental Study. J. Struct. Geology 32 (11), 1656–1667. doi:10.1016/j.jsg.2009.07.007
Hilgendorf, Z., Wells, G., Larson, P. H., Millett, J., and Kohout, M. (2020). From Basins to Rivers: Understanding the Revitalization and Significance of Top-Down Drainage Integration Mechanisms in Drainage basin Evolution. Geomorphology 352, 107020. doi:10.1016/j.geomorph.2019.107020
King, G. C. P., Stein, R. S., and Rundle, J. B. (1988). The Growth of Geological Structures by Repeated Earthquakes 1. Conceptual Framework. J. Geophys. Res. 93 (B11), 13307–13318. doi:10.1029/JB093iB11p13307
Korme, T., Acocella, V., and Abebe, B. (2004). The Role of Pre-existing Structures in the Origin, Propagation and Architecture of Faults in the Main Ethiopian Rift. Gondwana Res. 7 (2), 467–479. doi:10.1016/s1342-937x(05)70798-x
Leeder, M. R., and Gawthorpe, R. L. (1987). Sedimentary Models for Extensional Tilt-Block/half-Graben Basins. Geol. Soc. Lond. Spec. Publications 28 (1), 139–152. doi:10.1144/gsl.Sp.1987.028.01.11
Maestrelli, D., Montanari, D., Corti, G., Del Ventisette, C., Moratti, G., and Bonini, M. (2020). Exploring the Interactions between Rift Propagation and Inherited Crustal Fabrics through Experimental Modeling. Tectonics 39, 6211. doi:10.1029/2020TC006211
Maniatis, G., Kurfeß, D., Hampel, A., and Heidbach, O. (2009). Slip Acceleration on normal Faults Due to Erosion and Sedimentation - Results from a New Three-Dimensional Numerical Model Coupling Tectonics and Landscape Evolution. Earth Planet. Sci. Lett. 284 (3-4), 570–582. doi:10.1016/j.epsl.2009.05.024
Molnar, N. E., Cruden, A. R., and Betts, P. G. (2019). Interactions between Propagating Rifts and Linear Weaknesses in the Lower Crust. Geosphere 15, 1617–1640. doi:10.1130/GES02119.1
Morley, C. K. (2007). Variations in Late Cenozoic-Recent Strike-Slip and Oblique-Extensional Geometries, within Indochina: The Influence of Pre-existing Fabrics. J. Struct. Geology 29 (1), 36–58. doi:10.1016/j.jsg.2006.07.003
Olive, J.-A., Behn, M. D., and Malatesta, L. C. (2014). Modes of Extensional Faulting Controlled by Surface Processes. Geophys. Res. Lett. 41 (19), 6725–6733. doi:10.1002/2014gl061507
Pechlivanidou, S., Cowie, P. A., Duclaux, G., Nixon, C. W., Gawthorpe, R. L., and Salles, T. (2019). Tipping the Balance: Shifts in Sediment Production in an Active Rift Setting. Geology 47 (3), 259–262. doi:10.1130/g45589.1
Pechlivanidou, S., Cowie, P. A., Hannisdal, B., Whittaker, A. C., Gawthorpe, R. L., Pennos, C., et al. (2018). Source-to-sink Analysis in an Active Extensional Setting: Holocene Erosion and Deposition in the Sperchios Rift, central Greece. Basin Res. 30 (3), 522–543. doi:10.1111/bre.12263
Planchon, O., and Darboux, F. (2002). A Fast, Simple and Versatile Algorithm to Fill the Depressions of Digital Elevation Models. Catena 46 (2-3), 159–176. doi:10.1016/s0341-8162(01)00164-3
Prosser, S. (1993). Rift-related Linked Depositional Systems and Their Seismic Expression. Geol. Soc. Lond. Spec. Publications 71 (1), 35–66. doi:10.1144/gsl.Sp.1993.071.01.03
Psilovikos, A. (1977). “Paleogeographic Development of the basin and the lake of Mygdonia,” (Lagada-Volvi area, Greece: Aristotle University of Thessaloniki). Ph.D Thesis.
Ravnås, R., and Steel, R. J. (1998). Architecture of Marine Rift-Basin Successions. Bulletin 82, 110. doi:10.1306/1d9bc3a9-172d-11d7-8645000102c1865d
Rotevatn, A., Jackson, C. A.-L., Tvedt, A. B. M., Bell, R. E., and Blækkan, I. (2019). How Do normal Faults Grow? J. Struct. Geology 125, 174–184. doi:10.1016/j.jsg.2018.08.005
Rotevatn, A., Kristensen, T. B., Ksienzyk, A. K., Wemmer, K., Henstra, G. A., Midtkandal, I., et al. (2018). Structural Inheritance and Rapid Rift-Length Establishment in a Multiphase Rift: The East Greenland Rift System and its Caledonian Orogenic Ancestry. Tectonics 37 (6), 1858–1875. doi:10.1029/2018tc005018
Salles, T., Ding, X., and Brocard, G. (2018). pyBadlands: A Framework to Simulate Sediment Transport, Landscape Dynamics and basin Stratigraphic Evolution through Space and Time. PLoS One 13 (4), e0195557. doi:10.1371/journal.pone.0195557
Salles, T., and Hardiman, L. (2016). Badlands: An Open-Source, Flexible and Parallel Framework to Study Landscape Dynamics. Comput. Geosciences 91, 77–89. doi:10.1016/j.cageo.2016.03.011
Samsu, A., Cruden, A. R., Molnar, N. E., and Weinberg, R. F. (2021). Inheritance of Penetrative Basement Anisotropies by Extension‐Oblique Faults: Insights from Analogue Experiments. Tectonics 40, 6596. doi:10.1029/2020TC006596
Wang, L., Maestrelli, D., Corti, G., Zou, Y., and Shen, C. (2021). Normal Fault Reactivation during Multiphase Extension: Analogue Models and Application to the Turkana Depression, East Africa. Tectonophysics 811, 228870. doi:10.1016/j.tecto.2021.228870
Whipp, P. S., Jackson, C. A.-L., Gawthorpe, R. L., Dreyer, T., and Quinn, D. (2014). Normal Fault Array Evolution above a Reactivated Rift Fabric; a Subsurface Example from the Northern Horda Platform, Norwegian North Sea. Basin Res. 26 (4), 523–549. doi:10.1111/bre.12050
Zwaan, F., Chenin, P., Erratt, D., Manatschal, G., and Schreurs, G. (2021). Complex Rift Patterns, a Result of Interacting Crustal and Mantle Weaknesses, or Multiphase Rifting? Insights from Analogue Models. Solid Earth 12, 1473–1495. doi:10.5194/se-12-1473-2021
Zwaan, F., Schreurs, G., and Adam, J. (2018). Effects of Sedimentation on Rift Segment Evolution and Rift Interaction in Orthogonal and Oblique Extensional Settings: Insights from Analogue Models Analysed with 4D X-ray Computed Tomography and Digital Volume Correlation Techniques. Glob. Planet. Change 171, 110–133. doi:10.1016/j.gloplacha.2017.11.002
Keywords: multi-phase rifting, surface processes, numerical modeling, syn-rift stratigraphy, drainage network reorganization
Citation: Pechlivanidou S, Geurts AH, Duclaux G, Gawthorpe RL, Pennos C and Finch E (2022) Contrasting Geomorphic and Stratigraphic Responses to Normal Fault Development During Single and Multi-Phase Rifting. Front. Earth Sci. 9:748276. doi: 10.3389/feart.2021.748276
Received: 27 July 2021; Accepted: 10 November 2021;
Published: 10 January 2022.
Edited by:
Frank Zwaan, University of Bern, SwitzerlandReviewed by:
Daniele Maestrelli, National Research Council, ItalyAlex Hughes, University of London, United Kingdom
Copyright © 2022 Pechlivanidou, Geurts, Duclaux, Gawthorpe, Pennos and Finch. This is an open-access article distributed under the terms of the Creative Commons Attribution License (CC BY). The use, distribution or reproduction in other forums is permitted, provided the original author(s) and the copyright owner(s) are credited and that the original publication in this journal is cited, in accordance with accepted academic practice. No use, distribution or reproduction is permitted which does not comply with these terms.
*Correspondence: Sofia Pechlivanidou, c29maWEucGVjaGxpdmFuaWRvdUB1aWIubm8=