- 1International Pacific Research Center and Department of Atmospheric Sciences, University of Hawaii at Manoa, Honolulu, HI, United States
- 2Shanghai Typhoon Institute, and Key Laboratory of Numerical Modeling for Tropical Cyclone of China Meteorological Administration, Shanghai, China
- 3Fujian Key Laboratory of Severe Weather of China Meteorological Administration, Fuzhou, China
The rainfall in landfalling TC is not always correlated with the storm intensity. Some weak landfalling TCs could bring extremely heavy rainfall during and after landfall. Such extreme events are very challenging to operational forecasts and often lead to disasters in the affected regions. Tropical storm Rumbia (2018) made its landfall in Shanghai with weak intensity but led to long-lasting and increasing rainfall to East China. The asymmetric rainfall evolution of Rumbia during and after its landfall was diagnosed based on the fifth generation European Centre for Medium-Range Weather Forecasting (ECMWF) reanalysis (ERA5) data, the tropical cyclone (TC) best-track data, and rainfall observations from China Meteorological Administration (CMA). Results showed that Rumbia was embedded in an environment with a deep-layer (300–850 hPa) southwesterly vertical wind shear (VWS). The maximum rainfall mostly occurred downshear-left in its inner-core region and downshear-right in the outer-core region. The translation of Rumbia also contributed to the rainfall distribution to some extent, especially prior to and just after its landfall. The strong southwesterly-southeasterly summer monsoon flow transported water vapor from the tropical ocean and the East China Sea to the TC core region, providing moisture and convective instability conditions in the mid-lower troposphere for the sustained rainfall even after Rumbia moved well inland. The results also showed that the low-level convective instability and the deep-layer environmental VWS played an important role in deepening the inflow boundary layer and the redevelopment of the secondary circulation, thus contributing to the heavy rainfall in the northeast quadrant of Rumbia after its landfall. However, further in-depth studies are recommended in regard of the rainfall evolution in the weak TCs. This study further calls for a continuous understanding of the involved physical processes/mechanisms that are responsible for the extreme rainfall induced by landfalling TCs, which can help improve the rainfall forecast skills and support damage mitigation in the future.
Introduction
Tropical cyclones (TCs) are synoptic systems that form over the tropical oceans by the energy supply from the underlying warm ocean. They display cyclonic circulations with low central pressure. TCs are one of the most destructive weather systems and often produce storm surge, strong winds, heavy rainfall, and severe flooding, inducing tremendous economic loss and deaths each year during and after landfall (Chen and Ding, 1979). According to Zhang et al. (2009), landfalling TCs in China always brought torrential rainfall to most coastal provinces and imposed great economic losses every year. Zhejiang Province got the most direct economic loss on average at 6960 million RMB Yuans per year, and Guangdong Province had the most significant number of landfalling TCs at 2.9 TCs per year on average. Therefore, it is important for China to accurately forecast rainfall induced by landfalling TCs. However, even though the TC track forecast has been improved continuously in the past decades, the skill in TC precipitation forecast is still low and far behind the track forecast (Yu et al., 2020). Wang et al. (2012) showed that the threat score (TS) of a 24-h forecast for 25 mm-rainfall in landfalling TCs over China was only 0.2. Hence, TC rainfall forecasts remain challenging because precipitation processes associated with landfalling TCs are complicated and involve multi-scale interactions (Yu and Wang 2018).
The regions suffering from TC rainfall are largely determined by the rainfall distribution in the TC circulation. The spatial distribution of rainfall in TCs is particularly important for rainfall forecast (Yu et al., 2015). The rainfall distribution in a TC can be decomposed into a wavenumber-0 component or the axisymmetric component and a series of lower-wavenumber components (Lonfat et al., 2004). Many efforts have been devoted to revealing the mechanisms of the asymmetric rainfall distribution (Rogers et al., 2003; Lonfat et al., 2004; Chen et al., 2006; Lonfat et al., 2007; Wingo and Cecil 2010; Reasor et al., 2013; Jiang and Ramirez 2013). Environmental vertical wind shear (VWS) is widely known as one of the important factors affecting TC rainfall asymmetric distribution, which is defined as the vector difference of the horizontal winds averaged within a radius such as 500 km between 200 and 850 hPa. Results from statistical and composite analyses indicate that heavy rainfall is mainly located downshear-left in the inner-core region and downshear-right in the outer-core region in a TC (Chen et al., 2006; Reasor et al., 2013). The TC translation is another important factor affecting TC rainfall distribution. Chen et al. (2006) found that heavy rainfall often occurs in the front quadrants of the storm center in the low shear environment, and when the direction of VWS is the same as that of TC translation, the TC would have the largest rainfall asymmetry. Previous studies also found that interactions between a TC and its other surrounding environments, such as an upper-level jet, monsoon flow, and a mid-latitude trough, may impose significant impacts on rainfall intensity and distribution in TCs as well (Atallah et al., 2007; Deng and Ritchie, 2020; Meng and Wang 2016a; Meng and Wang 2016b).
Most of the previous studies mentioned above have mainly focused on TC rainfall distribution over open oceans. The complex underlying surface forcing and interactions, such as inland water surface, terrain, and mesoscale convective activities, may play significant roles in shaping rainfall distribution in a landfalling TC (Yu J. et al., 2010; Yu et al., 2017). The asymmetric rainfall distribution in landfalling TC is closely related to the asymmetric convergence and vertical motion associated with the surface friction, forcing due to environmental VWS, and the asymmetric distribution and transport of environmental water vapor, or the embedded convective system (Shapiro 1983; Chen and Yau 2001; Yu et al., 2015, 2017). For example, Yu et al. (2017) examined the relationship between TC intensity and rainfall distribution in landfalling TCs over China. They found that the rainfall axisymmetry is closely related to the landfalling TC intensity. Stronger TCs have higher rain rates and higher amplitude of axisymmetric rainfall in general, while rapid decaying TCs show the most rapid decrease in total rainfall and axisymmetric rainfall relative to the total rain. Nevertheless, it is not the case for the maximum rain rate. Feng and Shu (2018) reported no significant relationship between TC intensity and rainfall frequency in the outer-core region, and heavy rainfall may also result from weak TCs due to the influence of VWS.
Some studies have been devoted to understanding torrential rainfall processes induced by individual landfalling TCs. For example, Tropical Storm Bilis (2006) made landfall in Zhejiang Province of China, and remained inland for days and produced excessively heavy rainfall, causing at least 843 deaths and a direct economic loss of up to five billion U.S. dollars (Deng et al., 2017). The heavy rainfall commenced after about 7 h after landfall and occurred about 400 km southwest of the circulation center. The southwesterly monsoon flow was the major carrier of water vapor and energy. The cold air intrusion from the northwest in the lower troposphere helped release the potential instability energy, triggered convective activities and substantially enhanced the rainstorm intensity (Kang et al., 2008). Yu Z. et al. (2010) demonstrated that the environmental VWS largely triggered the rainfall asymmetries in Bilis. Jiang et al. (2008) compared the rainfall resulting from Tropical Storm Isidore (2002) and Category-1 Hurricane Lili (2002) based on satellite observations and found that Isidore produced a much larger total volumetric rainfall in the same area both over the open gulf and during landfall. Tropical Storm Swan (2009) is another weak landfalling TC making landfall in Guangdong Province of China and producing extremely heavy rainfall. Huang et al. (2010) claimed that the torrential rainfall associated with Swan was mainly due to strong convergence and water vapor transport from the Bay of Bengal. Tropical Strom Goni (2015) and Super Typhoon Shanshan (2006) shared similar tracks, but Goni brought more than 100 mm rainfall from southern Jiangsu Province to northern Zhejiang Province of China while rainfall from Shanshan was below 30 mm. That was because Goni had a more stable upper-level trough and continuous water vapor supply (Cao et al., 2018).
Rumbia (2018) was another weak TC, which made its landfall in Shanghai, China at 2004 UTC on August 16, 2018. This is a case worthy of being studied because only a very small part of TC cases made their landfalls north of Zhejiang Province, China, in the past 3 decades. Besides, the rainfall kept increasing after landfall while the TC was continuously weakening. After landfall, Rumbia moved inland and induced heavy rainfall and severe flooding along its track in East China. At about 1800 UTC on 18 August, Rumbia tracked northeastward and transited into an extratropical cyclone at about 0000 UTC on 20 August. The rainfall brought by Rumbia kept increasing while Rumbia was weakening. The heavy rainfall in Rumbia was mostly located on the right of its track, causing a great loss of human lives and property.
The primary goal of this study is to reveal the physical process of asymmetric precipitation evolution in Rumbia (2018) during and after its landfall. The study focuses on the rainfall evolution right after Rumbia just made landfall but before it turned to its northeastward movement. The rest of the paper is organized as follows. The data used are described in Data and Methods. Main results are discussed in Results, including an overview of Rumbia’s rainfall and the synoptic evolution and the diagnostic analysis of the related dynamic and thermodynamic processes. Conclusions are summarized in the last section.
Data and Methods
The hourly gauge-radar-satellite merged precipitation data from China Meteorological Administration (CMA) with a spatial resolution of 0.05° × 0.05° were used to give an overview of observed rainfall evolution of Rumbia. The three-hourly TC best-track data, which include the intensity and central location (longitude and latitude) of the TC, were obtained from the Shanghai Typhoon Institute of CMA (STI/CMA).
The fifth generation European Centre for Medium-range Weather Forecasting (ECMWF) global reanalysis (ERA5, 0.25°, 1-hourly, Hersbach et al., 2020) dataset. ERA5 is based on the Integrated Forecasting System (IFS) Cy41r2 (which was operational in 2016) and benefits from a decade of developments in model physics, core dynamics and data assimilation. Since this study focuses on the rainfall evolution in Rumbia, we compared the precipitation from ERA5 with observations. Results showed that although ERA5 shows considerable discrepancies in precipitation over ocean prior to landfall of Rumbia, it captures well the temporal evolution and spatial distribution of precipitation over land in observations (Figure ignored). This indicates that ERA5 can be used to examine the synoptic evolution associated with the precipitation process in Rumbia after landfall. The ERA5 data used here has the horizontal resolution of 0.25° × 0.25° with 1-h intervals at 23 pressure levels (1,000, 975, 950, 925, 900, 875, 850, 825, 800, 775, 750, 700, 650, 600, 550, 500, 450, 400, 350, 300, 250, 225, and 200 hPa), which includes geopotential height, zonal and meridional components of horizontal winds, vertical motion, temperature, relative humidity, potential vorticity, and boundary layer height.
Results
An Overview of Rumbia (2018)
Rainfall Evolution
Figure 1A shows the observed rainfall distribution of Rumbia accumulated from 0600 UTC 14 to 1800 UTC 20 August in 2018. Rumbia intensified prior to its landfall, with the central pressure reaching the minimum of about 982 hPa and the maximum sustained 10-m wind speed of 25
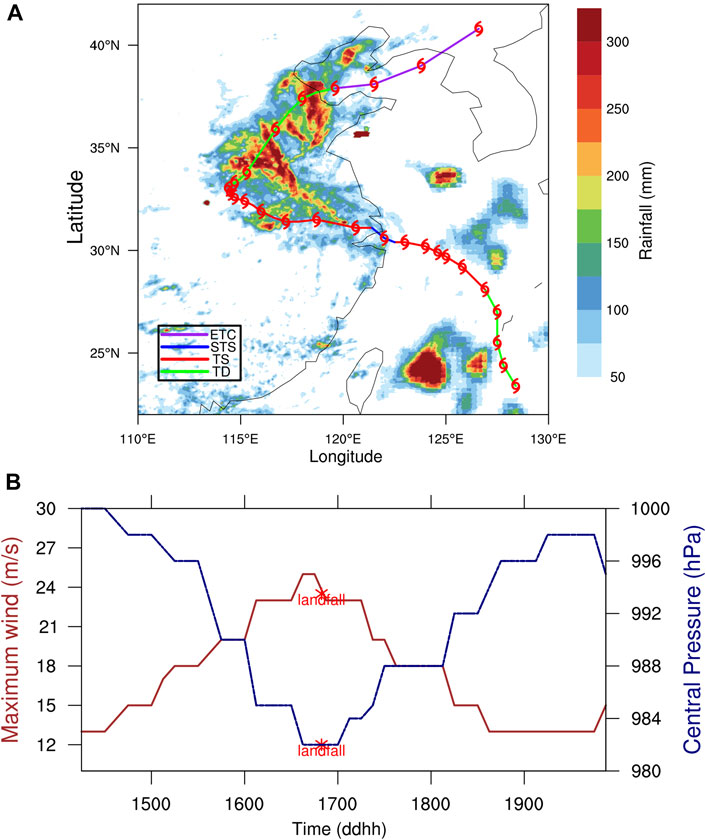
FIGURE 1. (A) Observed storm track (solid line) and accumulated total rainfall (shading, mm). (B) Observed evolution of the central pressure (blue polyline, hPa) and maximum 10-m height wind speed (red polyline, m/s) from 0600 UTC 14 (1406, in the form of ddhh on the x-axis) August to 1800 UTC 20 (2018, in the form of ddhh on the x-axis) August 2018.
Figure 2 shows the observed 6-hourly total rainfall evolution during and after landfall of Rumbia. Before Rumbia made landfall in Shanghai, only scattered rainfall appeared over the East China Sea or even near the TC center (Figure 2A). At 2000 UTC on 16 August, when Rumbia made landfall, the rainfall strengthened compared to that 6 h ago but was still distributed discretely (Figure 2B). The rainfall area quickly enlarged from 0200 to 1400 UTC on 17 August (Figures 2C–I). At 0800 UTC on 17 August, the heavy rainfall mainly occurred in the northeast quadrant of Rumbia and kept increasing and became more concentrated afterward. The rainfall showed an obvious wavenumber-1 asymmetric distribution after landfall, particularly from 0800 UTC on 17 August (Figure 2D), which will be the focus of this study. This might be due to the influence of change in the environmental VWS as discussed extensively in many previous studies (e.g., Lonfat et al., 2004; Chen et al., 2006). The detailed analyses will be discussed below.
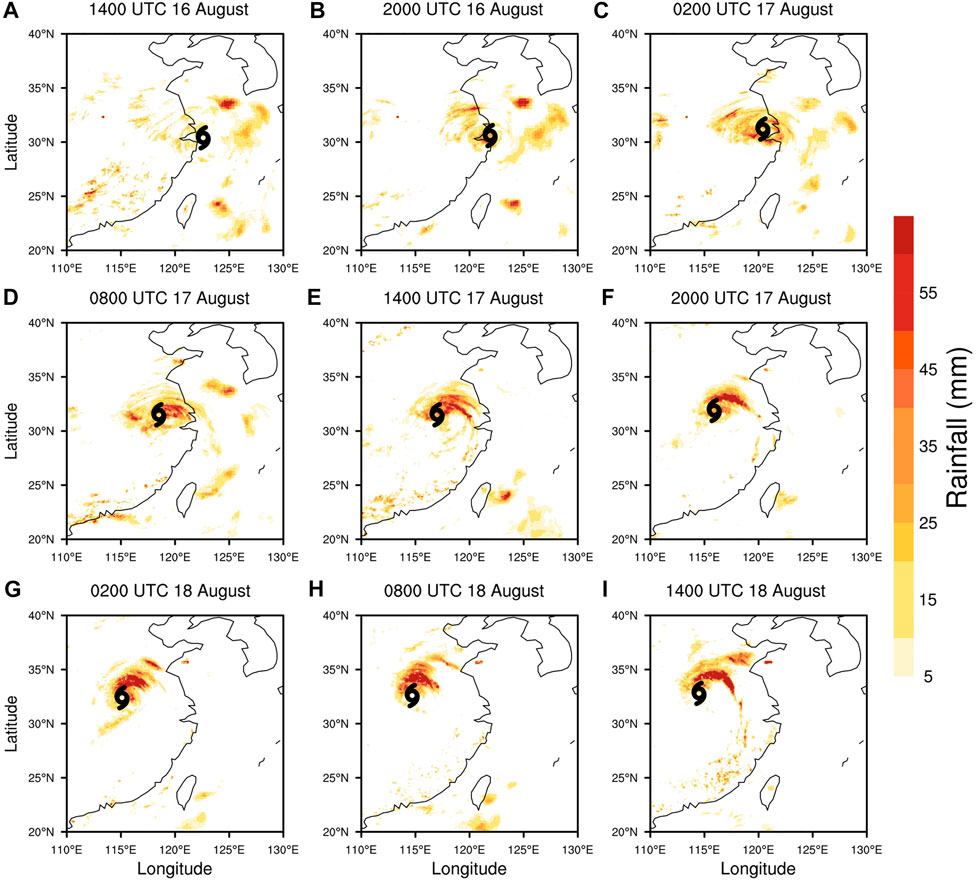
FIGURE 2. Evolution of the observed 6-hourly rainfall distribution (mm) at (A) 1,400, (B) 2000 UTC 16 August, (C) 0200, (D) 0800, (E) 1,400, (F) 2000 UTC 17 August, (G) 0200, (H) 0800, (I) 1400 UTC August 18, 2018.
Synoptic Evolution
The rainfall distribution and intensity in a TC is often largely affected by the large-scale environment the TC is embedded. Therefore, to understand the mechanism behind the heavy rainfall in Rumbia, we briefly discuss the synoptic evolution based on the ERA5 reanalysis. Figures 3A–F illustrate the evolutions of the 200-hPa geopotential height and wind fields after landfall of Rumbia. It can be seen that an upper-level jet appeared near 45°N to the north of Rumbia at 2000 UTC 16 August, which was far away from Rumbia, and thus its influence on the rainfall of Rumbia should be very limited. There was a weak divergent anticyclonic circulation at 200 hPa over Rumbia, which strengthened as the rainfall increased after the landfall of Rumbia.
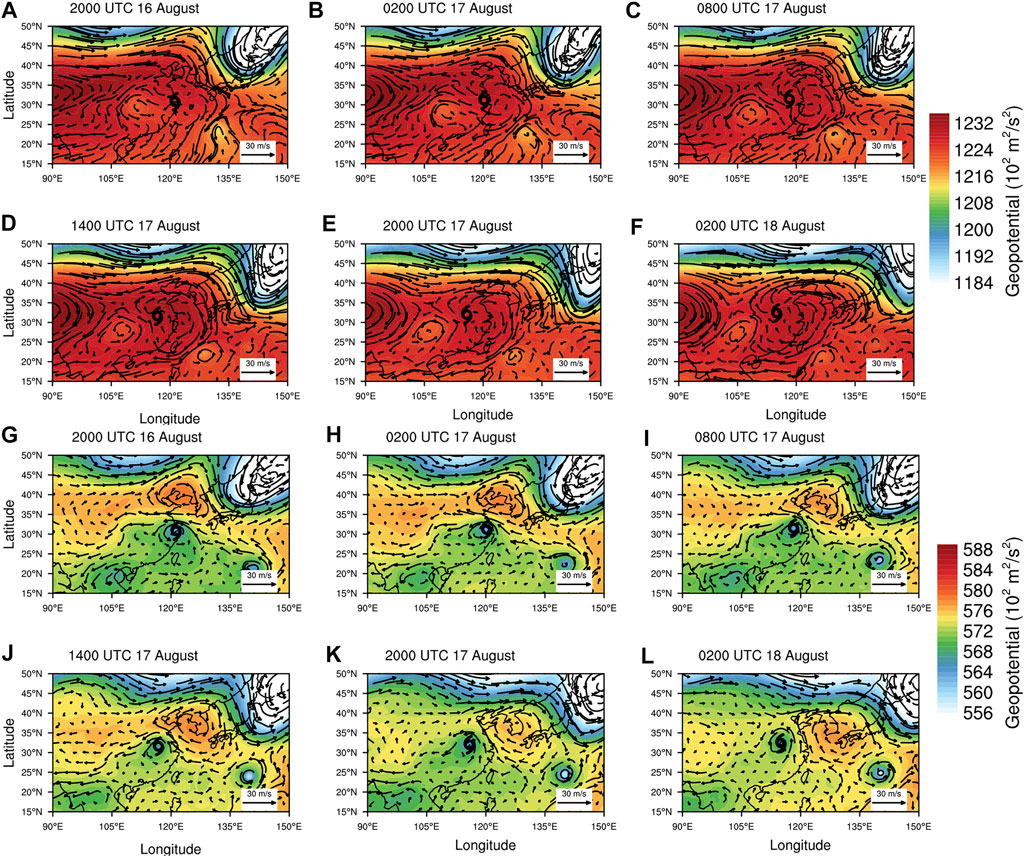
FIGURE 3. Geopotential height (shading, 10 geopotential meters) and wind vectors (m s−1) at 200 hPa: (A) 2000 UTC 16 August, (B) 0200, (C) 0800, (D) 1,400, (E) 2000 UTC 17 August, (F) 0200 UTC August 18, 2018, and at 500 hPa: (G) 2000 UTC 16 August, (H) 0200, (I) 0800, (J) 1,400, (K) 2000 UTC 17 August, (L) 0200 UTC August 18, 2018.
An outflow jet to the northeast of Rumbia showed a strengthening after 0800 UTC on August 17. This outflow jet may reflect the enhanced convective heating related to the enhanced rainfall on one hand and increased the upper-level divergence and thus favorable for the rainfall enhancement on the other hand. Besides, a cyclonic circulation occurred near 30°N to the west of the outflow of Rumbia. The southwesterly flow to the southeast of the cyclonic circulation, together with the northeasterly outflow jet to the northeast of Rumbia in the upper troposphere, contributed to the establishment of a large-scale moderate southwesterly VWS over Rumbia. As we will discuss in the next subsection. And it was this VWS that was largely responsible for the observed rainfall asymmetry in Rumbia after its landfall.
Figures 3G–L display the evolution of the 500-hPa geopotential height and wind fields. On 2000 UTC 16 August, there was a weak western North Pacific subtropical high (WNPSH) to the north of Rumbia (Figure 3G). Rumbia moved northwestward inland along the southwestern edge of the WNPSH from 2000 UTC 16 to 0200 UTC 18 August. As a result of the existence of the WNPSH, the winds in the northeast quadrant of Rumbia were much larger than in the southwest quadrant, leading to a wavenumber-1 asymmetric structure in the wind fields in the mid-lower troposphere. Note that there was a new TC formed far away to the southeast over the western North Pacific, which seemed not to play any role in affecting the rainfall of Rumbia. As we mentioned earlier, the upper-level westerly jet in the midlatitude might not interact directly with Rumbia and thus should not affect the rainfall distribution of Rumbia. This is mainly because the jet seemed to be far away from the outflow of Rumbia (Figures 3A–F).
The possible interaction between a TC and the midlatitude system is often examined by the potential vorticity (PV) distribution (e.g., Wang et al., 2009; Meng and Wang 2016a,b). Here we also checked the evolution of the meridional and vertical cross-section of PV through the center of Rumbia corresponding to the synoptic evolution with the results shown in Figure 4. We can see that Rumbia was characterized by a high PV column up to 200–300 hPa from the lower troposphere. The downward dip contours of potential temperature in the high PV column indicates the warm core structure of Rumbia. This seems to suggest that although Rumbia was a strong tropical storm at landfall and weakened to a tropical storm in the study period, it showed the feature of a typical TC. The high PV in the upper troposphere far to the north was associated with the mid-latitude westerly trough, which was well isolated from the high PV of Rumbia, further suggesting that the mid-latitude interaction might be secondary to the heavy rainfall of Rumbia at least before August 18. At the same time, from Figures 4G–L, we can prove that the high PV was also far from the TC center and did not have a noticeable contribution to the storm’s heavy rainfall.
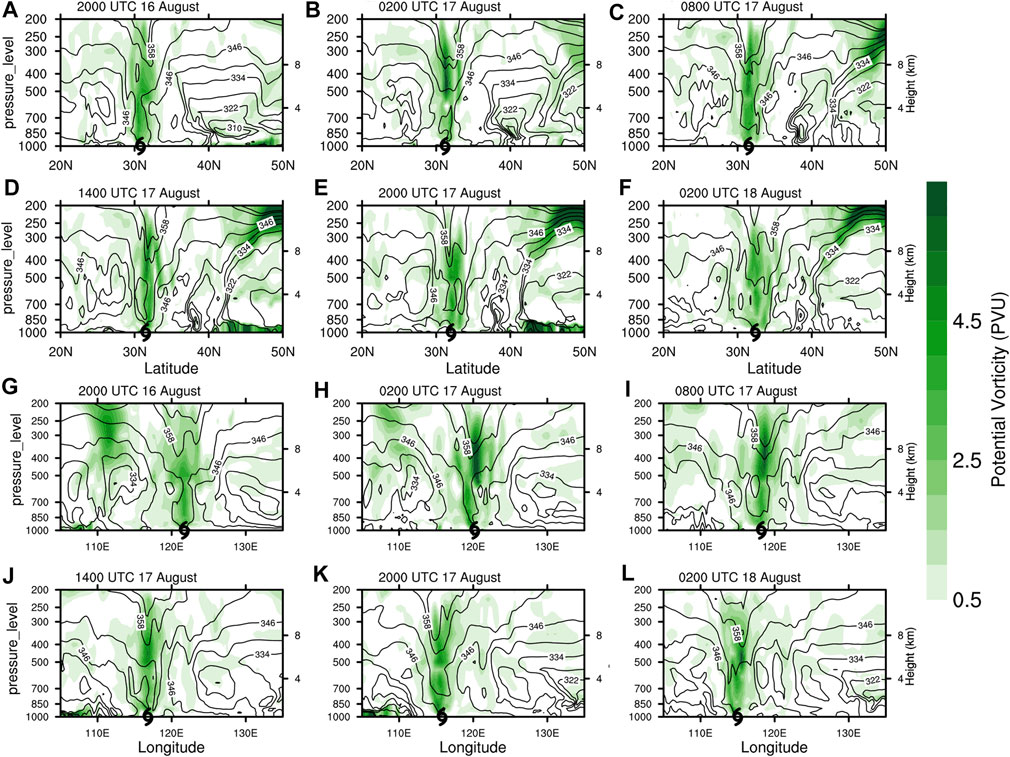
FIGURE 4. South-north (A–F) and west-east (G–L) vertical cross-sections of potential vorticity (shading, PVU) and potential temperature (contours, K) across the center of Rumbia: (A, G) 2000 UTC 16 August, (B, H) 0200, (C, I) 0800, (D, J) 1,400, (E, K) 2000 UTC 17 August, (F, L) 0200 UTC August 18, 2018.
Effects of Vertical Wind Shear and Storm Motion
As mentioned earlier, rainfall in Rumbia after landfall shows an asymmetric distribution, which was dominated by the wavenumber-1 structure. Similar wavenumber-1 rainfall distribution in landfalling TCs over China has been extensively studied in previous studies (Yu J. et al., 2010; Yu et al., 2015; Meng and Wang 2016a). Several factors responsible for the observed rainfall asymmetries have been identified, including the land-sea contrast, translation of the TC, and environmental VWS. In the Rumbia case, the rainfall near the landfall did not show a systematic rainfall asymmetric distribution. This seems to suggest that the land-sea contrast is secondary to the observed rainfall asymmetric distribution in Rumbia, in particularly after its core moved inland. Therefore, we will focus on the analysis of the effects of environmental VWS and the translation on the rainfall asymmetry in Rumbia first.
Figure 5 shows the hourly environmental VWS evolution in three different vertical layers, that is 200–850 hPa, 300–850 hPa, and 500–950 hPa VWSs. The environmental VWS was defined as the difference of wind vectors averaged within a radius of 500 km from the TC center between two given levels (e.g., 300—850 hPa VWS is defined as the difference of wind vectors averaged within a radius of 500 km from the TC center between 300 hPa and 850 hPa). In previous studies, 200–850 hPa VWS is always used to diagnose rainfall distribution, and heavy rainfall often occurs downshear-left in the inner-core region and downshear-right in the outer-core region (e.g., Chen et al., 2006). Because Rumbia was a relatively weak TC with shallower convection than an intense TC, 300–850 hPa VWS is given here as well as 200–850 hPa VWS. In addition, a weak TC is often shallower with a weaker and lower warm core, and the lower-layer shear (e.g., 1.3–5.8 km) might be more likely to affect the TC intensity (Finocchio et al., 2016; Fu et al., 2019). Therefore, we also examined the lower-level VWS between 500–950 hPa.
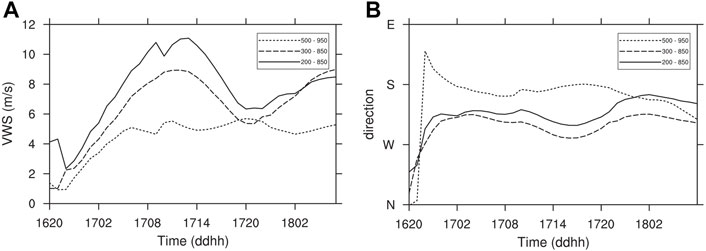
FIGURE 5. Time evolution of environmental VWS magnitude (A) and direction (B) in different vertical layers over Rumbia. Here the VWS is defined as the difference between the horizontal mean wind vector averaged within a radius of 500 km from the storm center at two given pressure levels.
We can find in Figure 5A that after 0600 UTC 17 August, the 500–950 hPa VWS was relatively stable while the rainfall distribution varies greatly, suggesting that the lower-level VWS had very limited influence on the rainfall evolution in Rumbia. The 300–850 hPa and 200–850 hPa VWS shared a similar tendency, and the deeper VWS was 3 m s−1 larger at most. As we can see from Figure 5B, although the shear magnitude varied with time during the study period, the shear direction was very stable. The deep-layer environmental VWS was northeasterly between 300–850 hPa and 200–850 hPa. Since the rainfall in Rumbia was scattered in the early stage after landfall and then concentrated in the northeast quadrant in the inner-core region, the southwesterly VWS must have contributed the most to the rainfall distribution, consistent with the conclusion of Chen et al. (2006).
To further examine the relationship between the TC rainfall and the environmental VWS, we analyzed the hourly rainfall distribution, storm motion vector, and 300–850 hPa VWS. Figure 6 gives the hourly rainfall evolution from 1400 UTC 16 to 0100 UTC 17 August. As we can see, the environmental VWS was small (less than 5 m s−1), and the TC translational speed showed an apparent acceleration as Rumbia was approaching the coast. By 1900 UTC 16 August, the rainfall occurred mainly to the north of Rumbia along the coastline, and scattered over the sea, suggesting that the land-sea contrast dominated the rainfall distribution when Rumbia moved toward the land. Many previous studies indicate that some intense outer convective spiral bands may form ahead of the TC center when it approaches the land (e.g., Parrish et al., 1982). When interacting with the inner core, such enhanced convective bands may interact with the inner core and accelerate the TC motion (Willoughby 1992). In the Rumbia case, we can find that as Rumbia moved across the coastline, the translational speed increased to reach 11.8 m s−1 at 2100 UTC 16 August after landfall. This is consistent with the finding in Chen and Yau (2001) and Willoughby (1992).
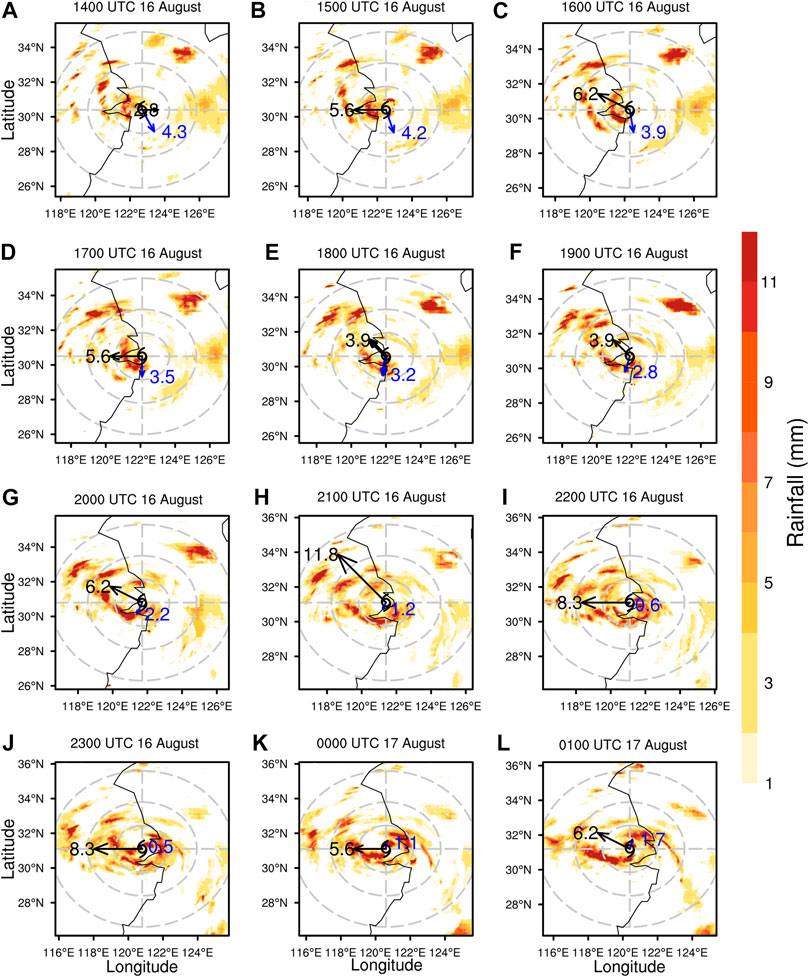
FIGURE 6. Hourly rainfall evolution (shading, mm) at (A) 1,400, (B) 1,500, (C) 1,600, (D) 1700, (E) 1800, (F) 1900, (G) 2000, (H) 2,100, (I) 2,200, (J) 2300 UTC 16 August, (K) 0000 (L) 0100 UTC 17 August. Grey dashed concentric circles are 150, 300, and 500 km from the storm center. Black arrows and numbers denote the storm motion vectors and speeds (m s−1). Blue arrows and numbers refer to the directions and magnitudes (m s−1) of the deep layer VWS between 300 and 850 hPa. The cyclone symbol indicates the storm center at the given time.
Figure 7 shows the temporal evolution of the variables mentioned above from 0200 to 0700 UTC 17 August. The environmental VWS increased during this period while the TC translational speed decreased to some extent. By 0400 UTC 17 August, rainfall occurred not only downshear-left, but also downshear right in the inner-core region, and rainfall even occurred in the upshear-left quadrant in the outer-core region. From 0500 UTC on 17 August, the downshear-right rainfall in the inner-core region gradually weakened and eventually disappeared. The rainfall distribution began to display an obvious wavenumber-1 asymmetric structure in the inner-core region, with the heavy rainfall occurring downshear-left in the inner-core region while downshear-right in the outer-core region in terms of the deep-layer environmental VWS. This seems to suggest that from 0500 UTC on 17 August, the 300–850 hPa VWS dominated the rainfall asymmetric distribution in Rumbia after its landfall (Figure 5), consistent with many previous studies as mentioned earlier.
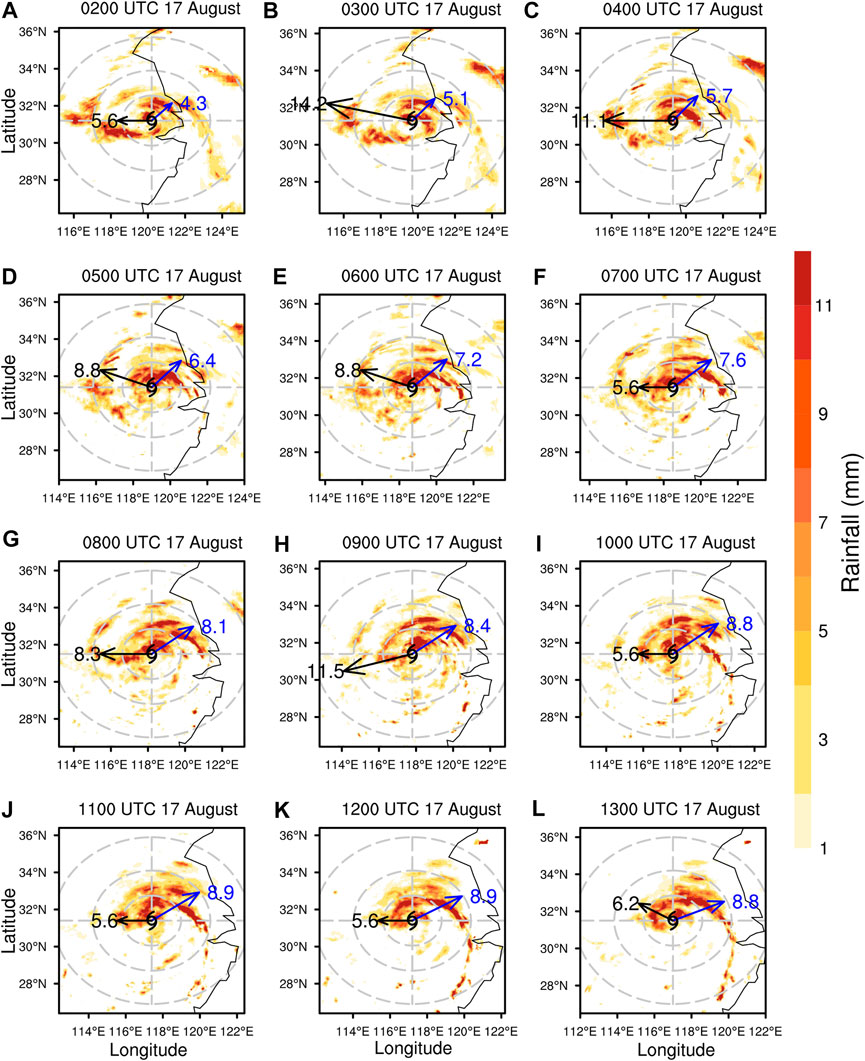
FIGURE 7. Same as Figure 6, but at (A) 0200, (B) 0300, (C) 0400, (D) 0500, (E) 0600, (F) 0700, (G) 0800, (H) 0900, (I) 1,000, (J) 1,100, (K) 1,200, (L) 1300 UTC 17 August.
During the 6 h period from 0900 to 1,400 August 17 (Figures 7H, 8A), a rainband developed in the southeast quadrant in the outer-core region and spiraled cyclonically inward and connected to the heavy rainfall in the inner core. The rainband possessed a quite stable pattern and intensified and elongated further outward in the upwind section. The stable evolution of the rainband was consistent with the quasi-steady evolution of the environmental VWS. The spiral rainband featured the quasi-stationary primary rainband in a TC embedded in a sheared environment, as discussed in Willoughby et al. (1984) and Li et al. (2017). Note that the TC translational speed was relatively large at 0800 UTC on 17 August, but decreased and almost remained unchanged at the speed of about 5.6–6.2 m s−1 during this period. This suggests that although the translation of the storm might also contribute to the rainfall asymmetry, the environmental VWS dominantly controlled the asymmetric rainfall distribution, in particular the development of the quasi-steady primary rainband in the Rumbia case.
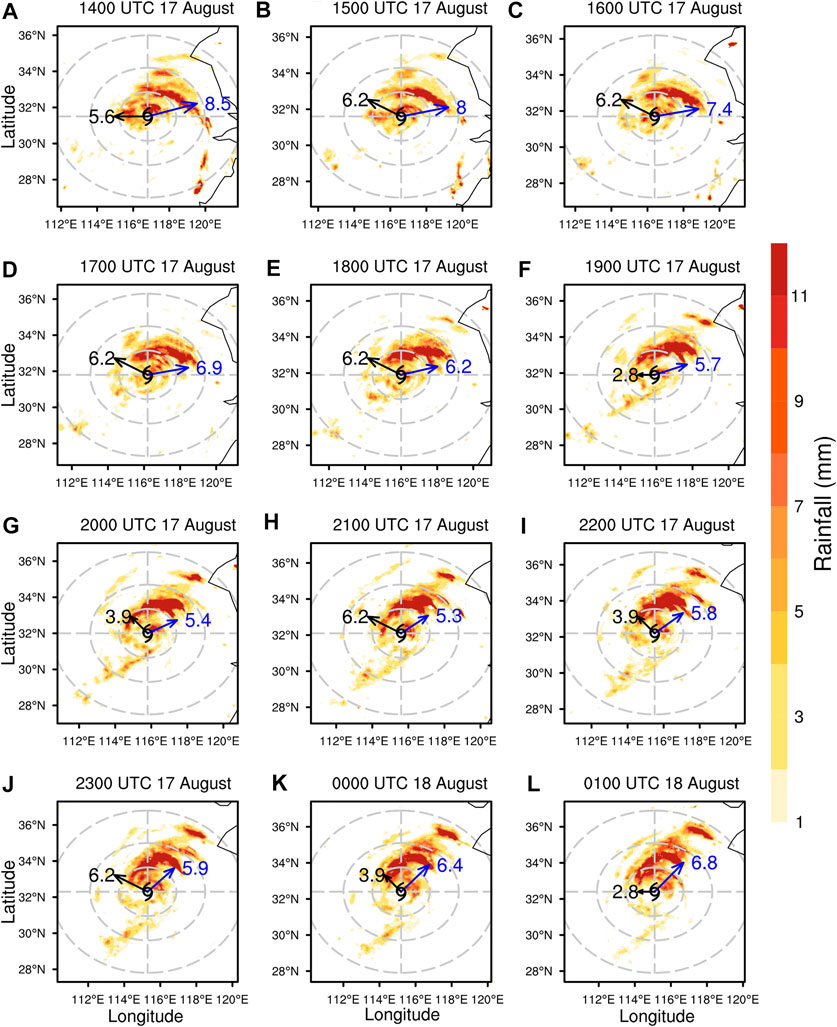
FIGURE 8. Same as Figure 6, but at (A) 1,400, (B) 1,500, (C) 1,600, (D) 1700, (E) 1800, (F) 1900, (G) 2000, (H) 2,100, (I) 2,200, (J) 2300 UTC 17 August, (K) 0000, (L) 0100 UTC August 18.
The deep-layer environmental VWS experienced a considerable weakening from 1,400 to 1900 UTC on 17 August, although the low-level shear showed little change (Figure 5A). As the deep-layer VWS was gradually weakening, the spiral rainband outside of 300 km radius from the storm center also experienced a drastic weakening and faded away quickly in an hour or so (Figures 8A–F). The rainfall mainly occurred to the north of the storm center and was still located to the right of the storm track and downshear-left of the environmental VWS. Note that the rainfall was distributed in an arc-shaped band mainly between radii of 150–300 km. In the meantime, some rainfall appeared near the storm center but became less organized after 1,600 August 17.
From 2100 UTC 17 August to 0100 UTC 18 August, the deep-layer VWS showed a slight increase with time, and the rainfall extended a little bit more northeastward with several rainband segments developed in parallel (Figures 8H–L). With the increasing deep-layer VWS and the slowing down of the storm motion, relatively strong rainfall appeared in the inner-core region downshear-left again, indicating that the deep-layer VWS played a critical role in shaping the rainfall pattern during this period. The persistent downshear-left rainfall pattern with heavy rainfall further away from the storm center resulted in the accumulated heavy rainfall region some distance from the storm track, as we can see from Figure 1A. After the storm further slowed down and turned northeastward, strong rainfall remained to the northeast quadrant, or downshear-left and right-front of the storm motion (Figure 1A).
Water Vapor Supply
One of the necessary conditions for heavy rainfall induced by landfalling TCs (and also any other weather systems) is the water vapor supply. Therefore, it is important to examine the water vapor transport following the storm. Here, we analyzed the moisture conditions first and then the water vapor flux and water vapor flux divergence in the Rumbia case. This may help identify the water vapor sourses of heavy rainfall induced by Rumbia. Figures 9A–F show the relative humidity and horizontal wind fields, both averaged in the lower troposphere between 700 and 1,000 hPa. The lower tropospheric relative humidity in the inner-core region of Rumbia was very high, mostly over 95% or even nearly saturated near the storm center, in particular in the region with heavy rainfall. An interesting feature is the strong southwesterly-southeasterly monsoon flow with relatively high relative humidity to the southeast and northeast of the storm center, which can be traced upstream to the tropical western Pacific and South China Sea. This indicates that moisture transport by the monsoon flow is key to the water vapor supply to the rainfall of Rumbia.
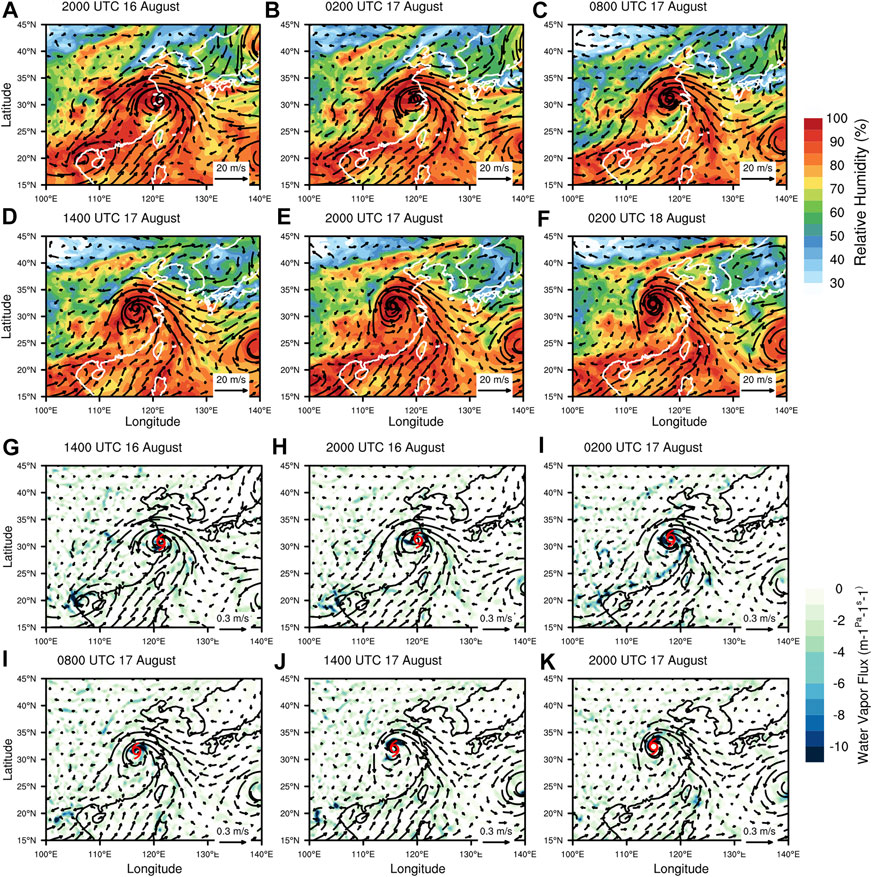
FIGURE 9. The evolution of the lower tropospheric relative humidity (shading, %) and wind vectors (m s−1), both averaged between 700 and 1,000 hPa: (A) 2000 UTC 16 August, (B) 0200, (C) 0800, (D) 1,400, (E) 2000 UTC 17 August, (F) 0200 UTC August 18, 2018. The lower tropospheric water vapor flux (arrows, m−1 Pa−1 s−1) and vapor flux divergence (shading, m −2Pa−1), both averaged between 700 and 1,000 hPa: (G) 2000 UTC 16 August, (H) 0200, (I) 0800, (J) 1,400, (K) 2000 UTC 17 August, (L) 0200 UTC August 18, 2018. The cyclone symbol indicates the storm center at the given time.
To illustrate the water vapor transport more explicitly, we show the water vapor flux and vapor flux divergence, both were averaged between 700 and 1,000 hPa in Figures 9G–L. Consistent with the evolution of the layer averaged relative humidity and wind distributions in the lower troposphere, the water vapor flux and the vapor flux divergence fields show the major water vapor transport channel toward the storm’s inner-core region with vapor flux convergence in the areas with high relative humidity. Particularly, the large vapor flux convergence is consistent with the large rainfall to the northeast quadrant of the storm or downshear-left (Figures 7, 8). Note that as the storm moved inland, the main water vapor transport channel was always strong in the southeast and northeast quadrants of the storm. In addition, a narrow vapor flux convergence zone corresponds to the primary spiral rainband discussed earlier in the 6 h from 0800 UTC August 17 (Figures 9I,J). In addition to the effect of the environmental VWS, the formation of the rainband seemed also to substantially contributed by the topographic effect since the spiral rainband was close to the terrain along the southeastern coastal region of China. After Rumbia moved further inland, the water vapor supply to the rainband was cut off and the rainband weakened (Figure 9J). Nevertheless, the result suggests that the transport of water vapor by the southwesterly and southeasterly monsoon flow provided the necessary moisture conditions not only to the heavy rainfall downshear-left but also to the rainfall in the primary spiral rainband associated with Rumbia. The latter was obviously forced by not only the environmental VWS but also the orographic effect in Southeast China.
Convective Instability
Convective instability is key to convection and convective rainfall. Several measures are often used to imply the convective instability, including the convective available potential energy (CAPE), minimum in equivalent potential temperature in the mid-troposphere. We first examined the evolution of CAPE distribution in Figure 10. In general, high CAPE was located over the tropical ocean and in the coastal region along Southeast China. Although the CAPE was not high in the inner-core region of Rumbia, the CAPE was relatively high to the southeast of the storm center, namely upstream of the rainfall region or in the downshear-right quadrant. This strongly suggests that high CAPE air with high moisture content was transported to the rainfall region, where the CAPE was quickly consumed by deep convection. Figure 11 gives the vertical cross-section of equivalent potential temperature averaged in an annulus between the radii of 150 and 300 km from the storm center. This annulus mean was chosen to illustrate the difference in the vertical structure of convective stability in different quadrants of the storm. At the time of landfall and shortly after landfall of Rumbia, the equivalent potential temperature was relatively low in the lower troposphere in both the northwest and southwest quadrants while relatively high in both the southeast and northeast quadrants (Figures 11A–D). As Rumbia moved further inland, the equivalent potential temperature became much lower to the west of the storm, mainly because of the dry air intrusion from the north (Figures 11E,F). To the northeast-east of the storm center, the lower troposphere in which the equivalent potential temperature decreased with increasing height shows weak convective instability (Figures 11D–F). The evolution of equivalent potential temperature is generally consistent with the horizontal distribution in CAPE shown in Figure 10.
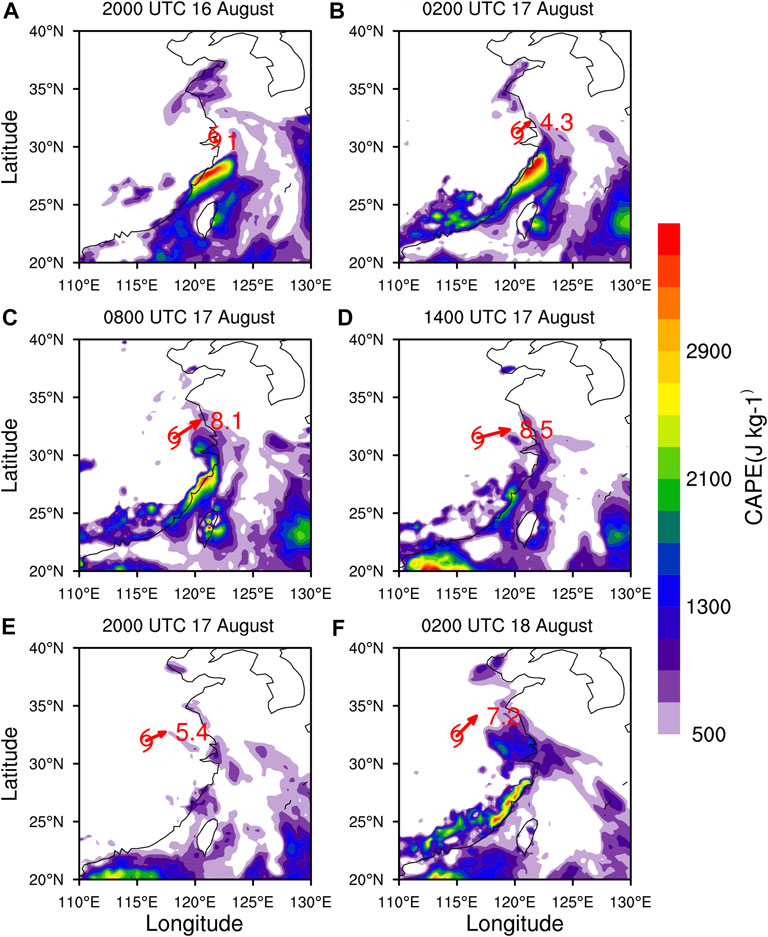
FIGURE 10. Convective Available Potential Energy (CAPE, shading, J kg−1) with the deep layer VWS vectors given at the storm center (red arrows): (A) 2000 UTC 16 August, (B) 0200, (C) 0800, (D) 1,400, (E) 2000 UTC 17 August, (F) 0200 UTC August 18, 2018. The cyclone symbol indicates the storm center at the given time. The red arrows and numbers show the 300–850 hPa VWS directions and magnitudes (m s−1).
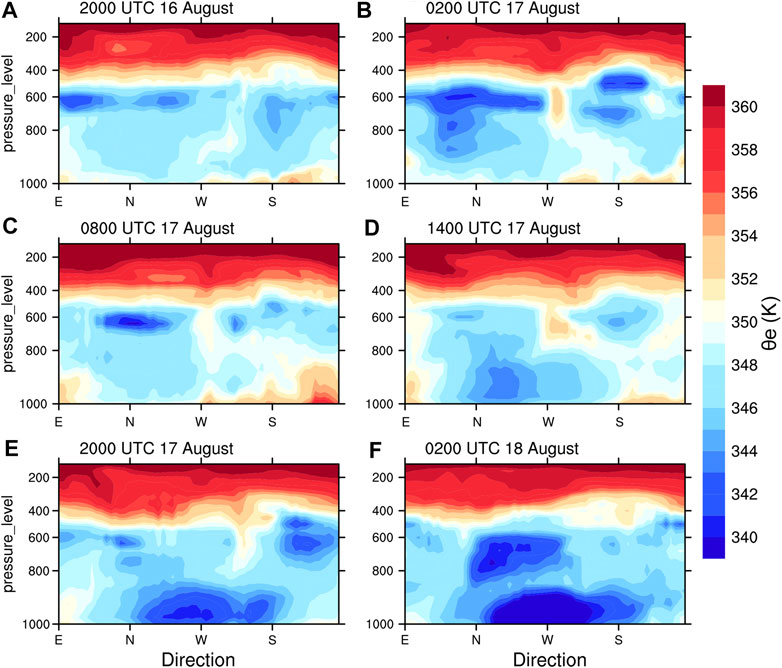
FIGURE 11. The vertical cross-section of equivalent potential temperature (shading, K) averaged in an annulus between the radii of 150 and 300 km from the storm center: (A) 2000 UTC 16 August, (B) 0200, (C) 0800, (D) 1,400, (E) 2000 UTC 17 August, (F) 0200 UTC August 18, 2018.
Since the convective instability occurred mainly in the northeast quadrant of the storm, it is our interest to see the radial variation of convective instability in the northeast quadrant. Figure 12 shows the evolutions of the quandrant-mean equivalent potential temperature and its vertical gradient (
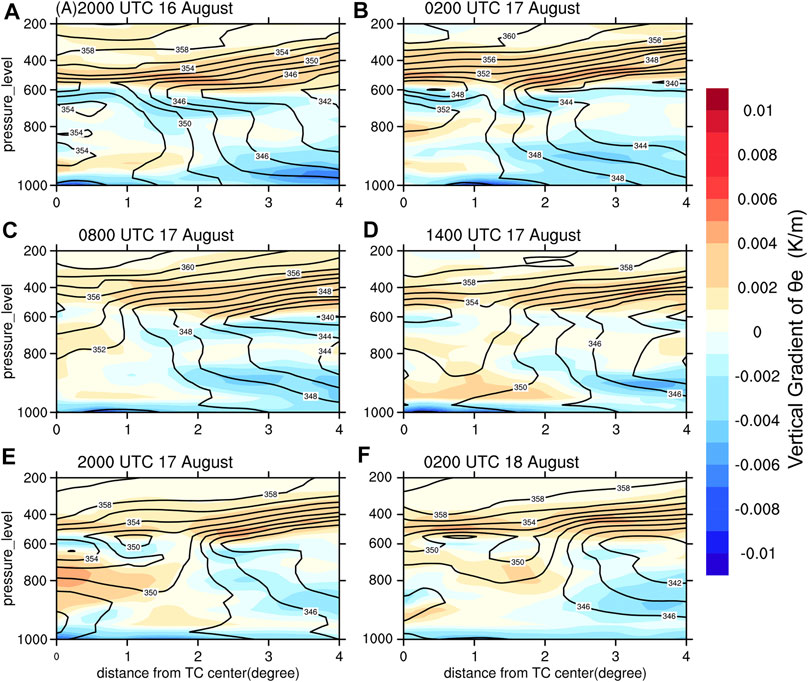
FIGURE 12. Vertical-radius cross section of equivalent potential temperature (contours, K) and its vertical gradient (∂ϑe/∂z) (shading, K/m). Both averaged in the northeast quadrant of the storm: (A) 2000 UTC 16 August, (B) 0200, (C) 0800, (D) 1,400, (E) 2000 UTC 17 August, (F) 0200 UTC August 18, 2018.
The Secondary Circulation
The secondary circulation is key to both the intensity and heavy rainfall in a TC. Although being main driven by both boundary layer dynamics and diabatic heating in the eyewall for a well-developed TC, the secondary circulation in a weak and landfalling TC often does not develop well (e.g., Yu Z. et al., 2010). We have already discussed the evolution of environmental VWS and convective instability during and after the landfall of Rumbia above. We found that the northeast quadrant was convectively unstable in the mid-lower troposphere and Rumbia was mostly embedded in a deep-layer southwesterly VWS after its landfall. It is our interest to further examine the evolution of the secondary circulation in the northeast quadrant and its connection to the rainfall. Note that the resolution of the reanalysis data was not high enough to fully resolve the secondary circulation in a TC. However, Rumbia did not develop a compact inner-core structure and kept a tropical storm intensity at its landfall. Therefore, we examined the secondary circulation in the northeast quadrant of Rumbia based on the ERA5 reanalysis.
Figure 13 shows the radial wind and vertical motion averaged in the northeast quadrant, where the heavy rainfall occurred after Rumbia made landfall over East China. At the time of landfall, the secondary circulation in the northeast quadrant of Rumbia shows a deep inflow layer through the troposphere, but the upward motion was broad and quite weak. The maximum inflow occurred in the boundary layer between 200 and 300 km radii from the storm center with the maximum upward motion in the upper troposphere (Figure 13A). Note that the deep-layer environmental VWS between 300 and 850 hPa was quite weak at the time when Rumba made its landfall but substantially increased thereafter as it moved inland shortly after landfall (Figure 5). The secondary circulation in the northeast quadrant shows an inward shift of the maximum inflow in the boundary layer with substantially enhanced upward motion (Figures 13B–D). This suggests that the environmental VWS played a critical role in forcing the secondary circulation in the downshear quadrant of Rumbia during this time period when environmental VWS increased. Note that although the rainfall distribution shows two separate rainfall regions: one near the storm center and one near the radius of 200 km from the storm center in the northeast quadrant (Figure 8A), the secondary circulation based on the coarse resolution reanalysis data could not reflect the separate vertical motion center associated with the two separate rainfall regions (Figures 13C,D).
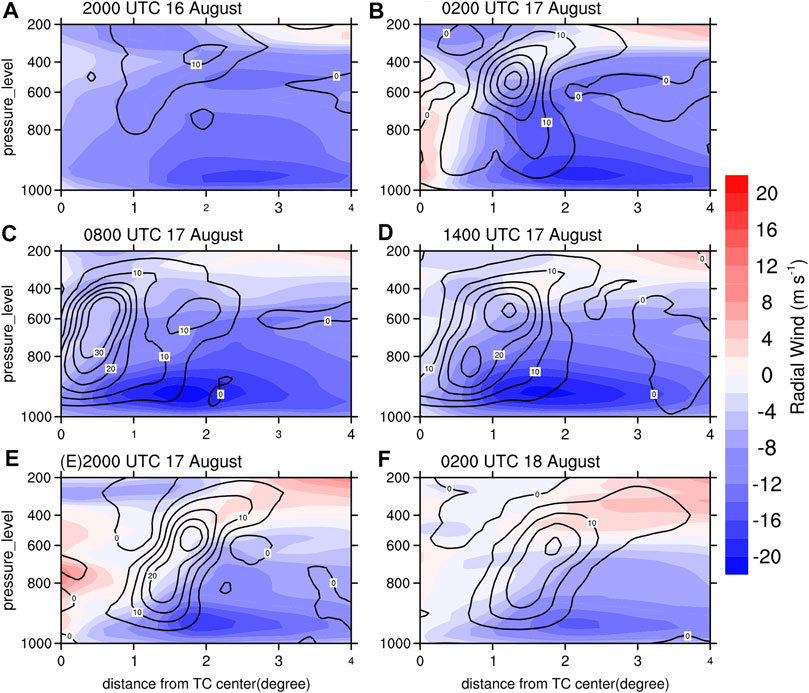
FIGURE 13. Northeast quadrant mean radial wind (shading, m s−1) and vertical motion (contours, m s−1): (A) 2000 UTC 16 August, (B) 0200, (C) 0800, (D) 1,400, (E) 2000 UTC 17 August, (F) 0200 UTC August 18, 2018.
From 1400 UTC 17 August, the secondary circulation in the northeast quadrant shows some weakening with the maximum inflow and upward motion shifting radially outward compared with the previous 12 h. The inflow layer also became shallower compared with that of the previous 6 h (Figures 13E,F). This change is roughly consistent with the weakening of rainfall near the storm center and the slightly outward shift of the rainband near the radius of 200 km mentioned above (Figure 8). During this time period, the deep-layer environmental VWS experienced some weakening (Figure 5) but remained still relatively strong, indicating that the environmental VWS still dominantly controlled the asymmetric structure of vertical motion and rainfall of Rumbia.
Zhang et al. (2013) found that the boundary layer is higher in the downshear side for a TC embedded in deep-layer environmental VWS. Ren et al. (2019) pointed out a front-rear asymmetric distribution of the TC boundary layer height. Since the depth of the inflow layer varied greatly in Rumbia after landfall (Figure 13), partially due to the variation of environmental VWS, we also looked at the evolution of the boundary layer height during the same time period. Figure 14 presents the distribution and evolution of the boundary layer height. At the time of landfall, the deep-layer environmental VWS was very weak while the storm moved northwestward, and the boundary layer was high to the right of the storm track, mainly over the ocean (Figure 14A). With the rainfall increasing, the boundary layer showed to the right front of the storm motion, now mainly over the land (Figure 14B). As the deep-layer VWS increased and the storm turned to the west-southwest, the area with a relatively high boundary layer increased and appeared still to the right of the storm track and also to the downshear and downshear left (Figure 14C). Finally, as the storm moved further inland and the decrease in the deep-layer VWS, the boundary layer became shallower to the right of the storm track and downshear-left while some increases appeared to the front and front-left of the storm motion (Figures 14E,F). The shallowing of the boundary layer seems to be consistent with the shallowing of the inflow boundary layer in the northeast quadrant as shown in Figures 13E,F. The above results are consistent with the finding of Reasor et al. (2013), who found that the boundary layer depth is higher where strong convection occurs. Therefore, it seems that the asymmetric distribution of the boundary layer height could be associated with the asymmetric distribution of convection.
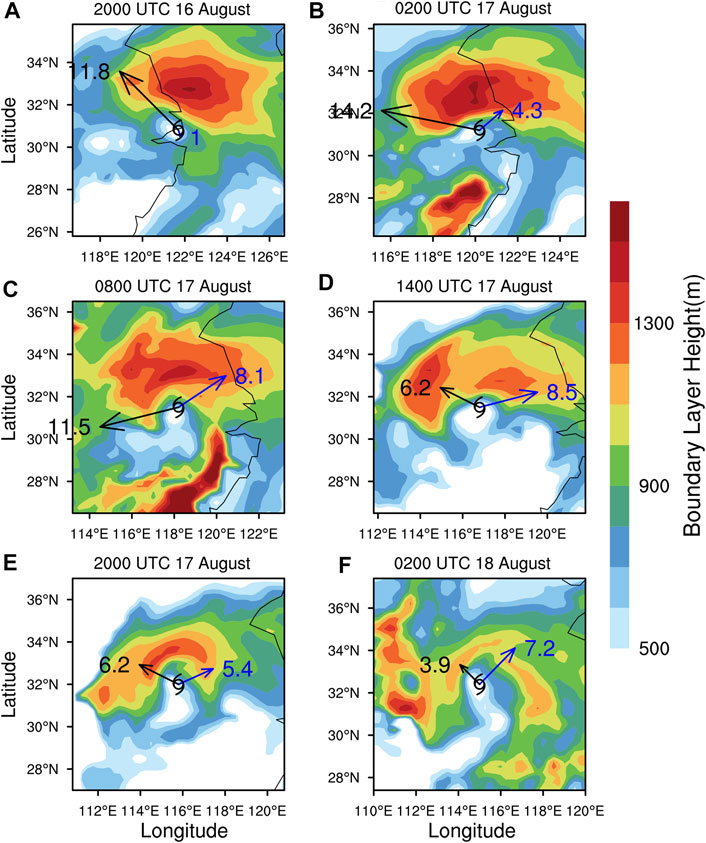
FIGURE 14. Boundary layer height (shading, m): (A) 2000 UTC 16 August, (B) 0200, (C) 0800, (D) 1,400, (E) 2000 UTC 17 August, (F) 0200 UTC 18 August. Black arrows and numbers denote the storm motion vectors and speeds. Blue arrows and numbers refer to the directions and magnitudes of the deep layer VWS between 300 and 850 hPa.
Discussion
Tropical Storm Rumbia (2018) resulted in long-lasting, heavy rainfall to East China after its landfall in Shanghai on August 16, 2018, although it had a weak intensity at its landfall. In this study, the ERA5 reanalysis data, the best-track TC data of STI/CMA, and rainfall observations from CMA were used to examine the rainfall evolution of Rumbia after its landfall. The ERA5 reanalysis was chosen because it captures the observed hourly rainfall evolution over land.
This study mainly analyzed the rainfall induced by Rumbia qualitatively. As illustrated in a schematic Figure 15, Rumbia was embedded in an environment with a deep-layer (300–850 hPa) southwesterly vertical wind shear. The translation of Rumbia also contributed to the inner-core rainfall distribution to some extent. The strong southwesterly-southeasterly summer monsoon flow (Figures 10–12) provided moisture, convective instability conditions, and some dynamical effect partially by modifying the VWS. The low-level convective instability and the deep-layer environmental VWS were important to the asymmetric rainfall evolution after landfall.
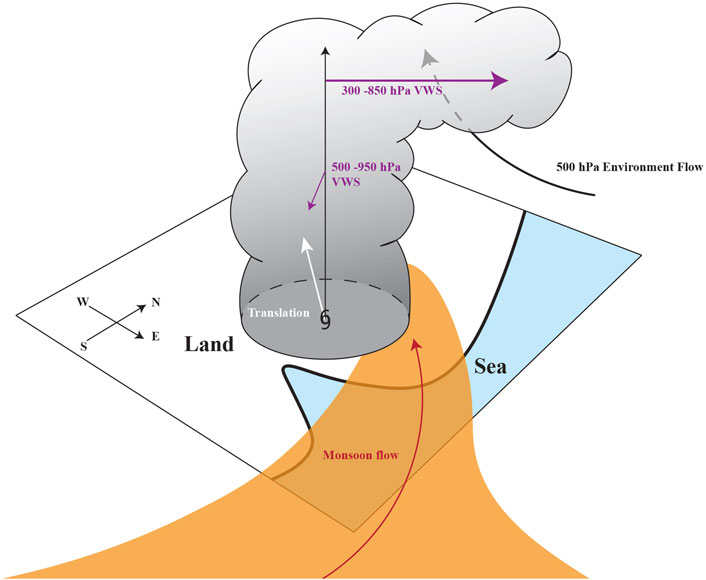
FIGURE 15. Schematic illustration of asymmetric rainfall evolution in Rumbia. The purple arrows indicate the 300–850 hPa VWS and 500–950 hPa VWS. The white arrow shows the TC translation direction. The black and red streamlines represent the 500 hPa environmental flow and the 850 hPa monsoon flow, respectively. The yellow area indicates the high energy air mass transported into the heavy rainfall region from the South China Sea and the western North Pacific by the low-level monsoon flow.
The use of relatively coarse resolution reanalysis data did not allow for a detailed quantitative budget analysis to understand the relative importance of various processes in controlling the observed rainfall distribution and evolution. In a future study, high-resolution numerical experiments can be conducted to simulate the rainfall of Rumbia and help quantify contributions of various physical and dynamical processes to the asymmetric rainfall distribution and understand the involved dynamical mechanisms. In particular, the short-lived primary rainband in the observation is another topic that could be further investigated. It is unclear whether the orographic effect or the land-sea contrast played any important roles in initiating and shaping the rainband. Also, we have only analyzed the possible rainfall processes before Rumbia turned northeastward. Observations showed that another period of heavy rainfall occurred after Rumbia turned northeastward. Therefore, future studies may also extend the analysis to the second rainfall period because the heavy rainfall also induced great economic loss in China.
Conclusion
Rumbia was embedded in an environment with a substantially increasing deep-layer southwesterly VWS during landfall. Compared to the VWSs in the layers of 200–850 hPa and 500–950 hPa, heavy rainfall occurred mostly downshear-left in its inner-core region and downshear-right in the outer-core region, relative to the 300–850 hPa VWS. In the study period, the heavy rainfall in the inner-core region was also located mainly to the right of the storm track, suggesting that the storm motion might also have contributed partly to the asymmetric rainfall distribution in Rumbia, especially when the VWS was very weak (<5 m/s) before its landfall.
The strong southwesterly-southeasterly summer monsoon flow over the western North Pacific transported warm and moist air from the tropical ocean and the East China Sea to the core region of Rumbia, providing moisture and convective instability conditions for the sustained rainfall even after Rumbia moved well inland. This low-level moist monsoon flow also caused VWS change and thus imposed an impact on TC precipitation, in addition to increasing convection instability in the TC rain area. Both the convective instability in the mid-lower troposphere and the deep-layer environmental VWS played important roles in deepening the inflow boundary layer and the development of the secondary circulation and the heavy rainfall in the northeast quadrant of Rumbia.
Such extreme events as in this study are very challenging to operational forecasts and often lead to disasters in the affected regions. Further in-depth studies are recommended in regard of the rainfall evolution in the weak TCs. This study further calls for an understanding of the involved physical processes/mechanisms that are responsible for the extreme rainfall induced by landfalling TCs, which can help improve the rainfall forecast skills and support damage mitigation in the future.
Data Availability Statement
The original contributions presented in the study are included in the article/Supplementary Material, further inquiries can be directed to the corresponding author.
Author Contributions
LT and ZY conceived the study and wrote the article. YW provided critical feedback and helped shape the research and article. LW helped the data analysis. All authors contributed to the article and approved the submitted version.
Funding
The work was supported in part by Key Program for International S&T Cooperation Projects of China (No. 2017YFE0107700), the National Natural Science Foundation of China (41875080), Scientific Research Program of Shanghai Science and Technology Commission (19dz1200101), and in part by Shanghai Talent Development Fund, Program of Shanghai Academic/Technology Research Leader (21XD1404500), Fujian Key Laboratory of Severe Weather Open Foundation (2020TFS01), and Typhoon Scientific and Technological Innovation group of Shanghai Meteorological Service.
Conflict of Interest
The authors declare that the research was conducted in the absence of any commercial or financial relationships that could be construed as a potential conflict of interest.
Publisher’s Note
All claims expressed in this article are solely those of the authors and do not necessarily represent those of their affiliated organizations, or those of the publisher, the editors and the reviewers. Any product that may be evaluated in this article, or claim that may be made by its manufacturer, is not guaranteed or endorsed by the publisher.
References
Atallah, E., Bosart, L. F., and Aiyyer, A. R. (2007). Precipitation Distribution Associated with Landfalling Tropical Cyclones over the Eastern United States. Mon. Weather Rev. 135 (6), 2185–2206. doi:10.1175/mwr3382.1
Cao, L., Qiao, D., Chen, X., and Dai, W. (2018). Laplace ℓ1 Huber Based Cubature Kalman Filter for Attitude Estimation of Small Satellite. Acta Astronaut. 148, 48–56. doi:10.1016/j.actaastro.2018.04.020
Chen, L. S., and Ding, Y. H. (1979). An Introduction to Typhoons in West Pacific. Beijing: Science Press.
Chen, Y., and Yau, M. K. (2001). Spiral Bands in a Simulated hurricane. Part I: Vortex Rossby Wave Verification. J. Atmos. Sci. 58 (15), 2128–2145. doi:10.1175/1520-0469(2001)058<2128:sbiash>2.0.co;2
Chen, S. S., Knaff, J. A., and Marks, F. D. (2006). Effects of Vertical Wind Shear and Storm Motion on Tropical Cyclone Rainfall Asymmetries Deduced from TRMM. Mon. Weather Rev. 134 (11), 3190–3208. doi:10.1175/mwr3245.1
Deng, D., and Ritchie, E. A. (2020). Rainfall Mechanisms for One of the Wettest Tropical Cyclones on Record in Australia-Oswald (2013). Mon. Weather Rev. 148 (6), 2503–2525. doi:10.1175/mwr-d-19-0168.1
Deng, D., Davidson, N. E., Hu, L., Tory, K. J., Hankinson, M. C. N., and Gao, S. (2017). Potential Vorticity Perspective of Vortex Structure Changes of Tropical Cyclone Bilis (2006) during a Heavy Rain Event Following Landfall. Mon. Weather Rev. 145 (5), 1875–1895. doi:10.1175/mwr-d-16-0276.1
Feng, X., and Shu, S. (2018). How Do Weak Tropical Cyclones Produce Heavy Rainfall when Making Landfall over China. J. Geophys. Res. Atmos. 123 (21), 11–830. doi:10.1029/2018jd029228
Finocchio, P. M., Majumdar, S. J., Nolan, D. S., and Iskandarani, M. (2016). Idealized Tropical Cyclone Responses to the Height and Depth of Environmental Vertical Wind Shear. Mon. Weather Rev. 144 (6), 2155–2175. doi:10.1175/mwr-d-15-0320.1
Fu, H., Wang, Y., Riemer, M., and Li, Q. (2019). Effect of Unidirectional Vertical Wind Shear on Tropical Cyclone Intensity Change-Lower‐Layer Shear versus Upper‐Layer Shear. J. Geophys. Res. Atmos. 124 (12), 6265–6282. doi:10.1029/2019jd030586
Hersbach, H., Bell, B., Berrisford, P., Hirahara, S., Horányi, A., Muñoz‐Sabater, J., et al. (2020). The ERA5 Global Reanalysis. Q.J.R. Meteorol. Soc. 146 (730), 1999–2049. doi:10.1002/qj.3803
Huang, P., Huang, H. P., Chen, H. J., and Zheng, Y. (2010). Analysis on Moving Path of Tropical Storm “SWAN”(No. 0907) and its Torrential Rain. J. Meteorol. Res. Appl. 31, 5–8. doi:10.1002/chin.200034171
Jiang, H., and Ramirez, E. M. (2013). Necessary Conditions for Tropical Cyclone Rapid Intensification as Derived from 11 Years of TRMM Data. J. Clim. 26 (17), 6459–6470. doi:10.1175/jcli-d-12-00432.1
Jiang, H., Halverson, J. B., and Simpson, J. (2008). On the Differences in Storm Rainfall from Hurricanes Isidore and Lili. Part I: Satellite Observations and Rain Potential. Weather Forecast. 23 (1), 29–43. doi:10.1175/2007waf2005096.1
Kang, Z. M., Chen, T., Qian, C. H., and Yang, K. M. (2008). Diagnostic Analysis on Torrential Rain Caused by the Tropical Storm Bilis (0604). Plateau Meteorol. 27 (3), 596–607.
Li, Q., Wang, Y., and Duan, Y. (2017). A Numerical Study of Outer Rainband Formation in a Sheared Tropical Cyclone. J. Atmos. Sci. 74 (1), 203–227. doi:10.1175/jas-d-16-0123.1
Lonfat, M., Marks, F. D., and Chen, S. S. (2004). Precipitation Distribution in Tropical Cyclones Using the Tropical Rainfall Measuring Mission (TRMM) Microwave Imager: A Global Perspective. Mon. Weather Rev. 132 (7), 1645–1660. doi:10.1175/1520-0493(2004)132<1645:pditcu>2.0.co;2
Lonfat, M., Rogers, R., Marchok, T., and Marks, F. D. (2007). A Parametric Model for Predicting hurricane Rainfall. Mon. Weather Rev. 135 (9), 3086–3097. doi:10.1175/mwr3433.1
Meng, W., and Wang, Y. (2016a). A Diagnostic Study on Heavy Rainfall Induced by Typhoon Utor (2013) in South China: 1. Rainfall Asymmetry at Landfall. J. Geophys. Res. Atmos. 121 (21), 12–781. doi:10.1002/2015jd024646
Meng, W., and Wang, Y. (2016b). A Diagnostic Study on Heavy Rainfall Induced by Landfalling Typhoon Utor (2013) in South China: 2. Postlandfall Rainfall. J. Geophys. Res. Atmos. 121 (21), 12–803. doi:10.1002/2015jd024647
Parrish, J. R., Burpee, R. W., Marks, F. D., and Grebe, R. (1982). Rainfall Patterns Observed by Digitized Radar during the Landfall of Hurricane Frederic (1979). Mon. Wea. Rev. 110 (12), 1933–1944. doi:10.1175/1520-0493(1982)110<1933:rpobdr>2.0.co;2
Reasor, P. D., Rogers, R., and Lorsolo, S. (2013). Environmental Flow Impacts on Tropical Cyclone Structure Diagnosed from Airborne Doppler Radar Composites. Mon. Weather Rev. 141 (9), 2949–2969. doi:10.1175/mwr-d-12-00334.1
Ren, Y., Zhang, J. A., Guimond, S. R., and Wang, X. (2019). Hurricane Boundary Layer Height Relative to Storm Motion from GPS Dropsonde Composites. Atmosphere 10 (6), 339. doi:10.3390/atmos10060339
Rogers, R., Chen, S., Tenerelli, J., and Willoughby, H. (2003). A Numerical Study of the Impact of Vertical Shear on the Distribution of Rainfall in Hurricane Bonnie (1998). Mon. Weather Rev. 131 (8), 1577–1599. doi:10.1175//2546.1
Shapiro, L. J. (1983). The Asymmetric Boundary Layer Flow under a Translating hurricane. J. Atmos. Sci. 40 (8), 1984–1998. doi:10.1175/1520-0469(1983)040<1984:tablfu>2.0.co;2
Wang, Y., Wang, Y., and Fudeyasu, H. (2009). The Role of Typhoon Songda (2004) in Producing Distantly Located Heavy Rainfall in Japan*. Mon. Weather Rev. 137 (11), 3699–3716. doi:10.1175/2009mwr2933.1
Wang, Y., Shen, X., and Chen, D. (2012). Verification of Tropical Cyclone Rainfall Predictions from CMA and JMA Global Models. J. Trop. Meteorol. 18, 537–542. doi:10.16555/j.1006-8775.2012.04.014
Willoughby, H. E., Marks, F. D., and Feinberg, R. J. (1984). Stationary and Moving Convective Bands in Hurricanes. J. Atmos. Sci. 41 (22), 3189–3211. doi:10.1175/1520-0469(1984)041<3189:samcbi>2.0.co;2
Willoughby, H. E. (1992). Linear Motion of a Shallow-Water Barotropic Vortex as an Initial-Value Problem. J. Atmos. Sci. 49 (21), 2015–2031.
Wingo, M. T., and Cecil, D. J. (2010). Effects of Vertical Wind Shear on Tropical Cyclone Precipitation. Mon. Weather Rev. 138 (3), 645–662. doi:10.1175/2009mwr2921.1
Yu, Z., and Wang, Y. (2018). “Rainfall Distribution in Landfalling Tropical Cyclones,” in Extreme Weather. Editors P. J Sallis (IntechOpen). doi:10.5772/intechopen.75910
Yu, J., Tan, Z., and Wang, Y. (2010a). Effects of Vertical Wind Shear on Intensity and Rainfall Asymmetries of strong Tropical Storm Bilis (2006). Adv. Atmos. Sci. 27 (3), 552–561. doi:10.1007/s00376-009-9030-6
Yu, Z., Liang, X., Yu, H., and Chan, J. C. L. (2010b). Mesoscale Vortex Generation and Merging Process: A Case Study Associated with a post-landfall Tropical Depression. Adv. Atmos. Sci. 27 (2), 356–370. doi:10.1007/s00376-009-8091-x
Yu, Z., Wang, Y., and Xu, H. (2015). Observed Rainfall Asymmetry in Tropical Cyclones Making Landfall over China. J. Appl. Meteorol. Climatol. 54 (1), 117–136. doi:10.1175/jamc-d-13-0359.1
Yu, Z., Wang, Y., Xu, H., Davidson, N., Chen, Y., Chen, Y., et al. (2017). On the Relationship between Intensity and Rainfall Distribution in Tropical Cyclones Making Landfall over China. J. Appl. Meteorol. Climatol. 56 (10), 2883–2901. doi:10.1175/jamc-d-16-0334.1
Yu, Z., Chen, Y. J., Ebert, B., Davidson, N. E., Xiao, Y., Yu, H., et al. (2020). Benchmark Rainfall Verification of Landfall Tropical Cyclone Forecasts by Operational ACCESS‐TC over China. Meteorol. Appl. 27 (1), e1842. doi:10.1002/met.1842
Zhang, Q., Wu, L., and Liu, Q. (2009). Tropical Cyclone Damages in China 1983-2006. Bull. Amer. Meteorol. Soc. 90 (4), 489–496. doi:10.1175/2008bams2631.1
Keywords: landfalling tropical cyclone, vertical wind shear, boundary layer, secondary circulation, heavy rainfall, asymmetric structure, instability
Citation: Tang L, Wang Y, Yu Z and Wang L (2021) The Asymmetric Precipitation Evolution in Weak Landfalling Tropical Cyclone Rumbia (2018) Over East China. Front. Earth Sci. 9:747271. doi: 10.3389/feart.2021.747271
Received: 26 July 2021; Accepted: 08 October 2021;
Published: 09 November 2021.
Edited by:
Kun Zhao, Nanjing University, ChinaReviewed by:
Li Tao, Nanjing University of Information Science and Technology, ChinaBo-Wen Shen, San Diego State University, United States
Copyright © 2021 Tang, Wang, Yu and Wang. This is an open-access article distributed under the terms of the Creative Commons Attribution License (CC BY). The use, distribution or reproduction in other forums is permitted, provided the original author(s) and the copyright owner(s) are credited and that the original publication in this journal is cited, in accordance with accepted academic practice. No use, distribution or reproduction is permitted which does not comply with these terms.
*Correspondence: Zifeng Yu, eXV6ZkB0eXBob29uLm9yZy5jbg==
 Lichun Tang
 Yuqing Wang
 Zifeng Yu
 Lan Wang