 Jiangfa Wu1
 Yunting Di
- 1Petrochina Southwest Oil & Gasfield Company, Chengdu, China
- 2Sinopec Southwest Petroleum and Natural Gas Company, Chengdu, China
The horizontal well multistage hydraulic fracturing technology is the most effective way to exploit shale gas resources. Compared with conventional reservoir fracturing, the flowback rate of a fracturing fluid in a shale reservoir is extremely low, and a large amount of fracturing fluid remains in the formation. Therefore, the research on the mechanism of shale reservoir fracturing fluid flowback process will contribute to laying a theoretical foundation for improving the effect of the innovation for increasing output of shale gas wells. Based on the shale in the Sichuan Basin, this study first describes basic experiments on physical properties such as the porosity, permeability, mineral composition, wettability, and microstructure. The physical properties of shale reservoirs were also analyzed, which laid the foundation for subsequent modeling. Second, CMG software is used to establish a numerical model that fits the characteristics of the flowback process. The effect of reservoir properties, fracturing parameters, drainage–production system, chemical permeability on gas and water production in the flowback process and their mechanisms are also analyzed. According to most numerical simulation results, the lower cumulative gas production will be with the higher cumulative water production which means the higher flowback rate. The pursuit of only a high flowback rate is not advisable, and the development of the drainage–production system requires reasonable control of the fracturing fluid flowback rate. This study provides a theoretical basis for the optimization of shale gas drainage–production system after hydraulic fracturing.
Introduction
As a clean, efficient, and unconventional resource with great potential, shale gas has been commercially developed in many countries around the world. Large-scale volume fracturing of a shale gas reservoir is required for realizing the value of industrial exploitation. During the hydraulic fracturing process of a shale gas reservoir, 2 × 10⁴–5 × 10⁴ m3 of fracturing fluid will be injected into the reservoir. According to the statistical data of shale gas fields, the flowback rate of fracturing fluids in most shale reservoirs is lower than 50%, even less than 5% in some reservoirs. After fracturing, a large amount of fracturing fluid will be retained in fractures and matrix (Zhang, Li, Yang), which directly affects the damage degree of fracturing fluid to the formation and the fracture conductivity, and then affects the development effect of the reservoir. Therefore, it is of great significance to study the distribution characteristics, flowback mechanism, and influencing factors of fracturing fluid in the reservoir after fracturing.
The research on the self-suction process of shale gas well mainly adopts the laboratory experiment method. The study on the self-absorption mechanism of the filtration process is helpful to deepen the understanding of flowback mechanism. Some scholars have studied the role of clay minerals in the shale self-absorption process by laboratory experiments. They believe that the clay minerals in shale have strong self-absorption ability and a semipermeable membrane effect, and water absorption volume can be larger than the measured pore volume. The water absorption expansion of clay minerals can induce a large number of microfractures in the shale reservoir (Dehghanpour et al., 2013; Fakcharoenphol et al., 2014; Zhou et al., 2014). Other scholars have studied the influence of physical properties such as wettability of shale on the self-absorption process. The main driving forces of spontaneous imbibition of fracturing fluid in the shale are capillary pressure and clay osmotic pressure. Adding a surfactant to fracturing fluid can change the wettability of shale surface and then affect the capillary pressure, spontaneous imbibition rate, and self-imbibition ability of shale (Engelder et al., 2014; Roychaudhuri et al., 2011). Understanding the physical properties of the shale reservoir, such as mineral composition and wettability, is the basis of studying the flowback mechanism of fracturing fluid in shale gas wells. However, the composition, content, and physical properties of clay minerals are different in different regions. There is a lack of measurement and analysis on the content of clay minerals and physical properties of shale, such as permeability, porosity, TOC content, and wettability at present.
The study of the large-scale flowback stage after fracturing is completed by numerical simulation, rather than a laboratory experiment. Most scholars used single-phase flow simulation to study the fracturing fluid flowback process after fracturing (Wu et al., 2003; Crafton and Gunderson, 2006). However, according to the analysis of production data of shale gas field, the early flowback process is mainly gas–aqueous two-phase flow. Therefore, a gas–aqueous two-phase flow model is needed for the analysis of fracturing fluid flowback after fracturing. In the study of the pressure of gas–aqueous two-phase flowback, some scholars only consider the influence of capillary pressure. When a gas–aqueous two-phase fluid exists, capillary force will be produced due to the difference of interfacial tension between the two phases in the pore. The matrix pores of shale are mainly nanoscale pore, and the capillary can even exceed 50 MPa. The capillary pressure produced by secondary fractures of shale is between 10 and 20 MPa. Therefore, it is difficult to return fracturing fluid in the matrix and secondary fractures due to capillary pressure (Guo et al., 2016; Wang and Rahman, 2015; Chen et al., 2016). Recently, some scholars have begun to study the role of chemical potential difference in the flowback process. The scholars believe that there is a semipermeable membrane effect on the contact surface between the injected fluid and the shale. The salinity of the fracturing fluid is about 1–5 kppm, while the salinity of the shale reservoir can be as high as 280 kppm, and the chemical potential difference will inhibit the flowback (Wang et al., 2016; Singh, 2016; Yang et al., 2016). Capillary pressure and chemical osmotic pressure are important factors affecting the flowback process of fracturing fluid after fracturing. At present, there is no study on these two factors together.
The obvious feature of fracturing fluid flowback is that most of the remaining fracturing fluid cannot be discharged, which leads to the fact that the flowback rate of the fracturing fluid is not high. It is necessary to study the factors affecting the flowback flow of fracturing fluid and clarify the rules of fracturing fluid flowback. The sensitivity analysis of shale gas well factors by various scholars shows that the factors influencing the flowback mainly include reservoir properties such as water saturation and wettability of reservoir (Zhang et al., 2017); fracture parameters such as fracture half-length, shape, conductivity, and cluster number (Liu et al., 2015; Bian et al., 2016; Guo et al., 2016); and the drainage–production system such as shut-in time and production pressure difference (Jiang et al., 2013; Zhang et al., 2017). The results of the present research show that the study on the factors affecting the flowback is lack of combination with the physical properties of shale reservoir. The laboratory experiment of describing the physical characteristics of the shale reservoir should be carried out before numerical simulation. At present, most scholars study the influence of single property on the flowback process, and there is a lack of sensitivity analysis that comprehensively considers the factors involved in the flowback process, including reservoir properties, fracturing parameters, production system, and chemical permeability.
Therefore, the overburden pressure porosity measurement and the SEM scanning experiment are used to analyze the pore permeability parameters, mineral composition, wettability, TOC content, and microstructure of shale in the Sichuan Basin and evaluate the physical properties of shale reservoir. On the basis of the aforementioned research, the gas–aqueous two-phase flow mechanism model of the early flowback process of shale gas wells is established by using commercial numerical simulation software and then initialized the formation pressure and water saturation after fracturing. According to the model, the effects of shale reservoir properties, fracturing parameters, and flowback system on the flowback rate and productivity can be studied quantitatively.
Tests of Physical Properties for the Shale Reservoir
Compared with conventional reservoirs, the shale reservoir is characterized by low porosity and low permeability, which leads to different laws of oil and gas flow in the reservoir. The physical properties such as pore throat structure and mineral composition of the shale reservoir are very different from those of conventional reservoirs. Therefore, it is necessary to conduct laboratory experiments on the physical properties of shale reservoirs, which will be helpful to understand the shale reservoir from a microscopic perspective and lay a foundation for the subsequent numerical simulation. The core samples of the shale reservoirs in the Sichuan Basin are taken for the study of this article. A total of 214 columnar samples and 109 crushed samples are taken from 16 wells, which lays the foundation for clarifying the differences between each layer (Figure 1).
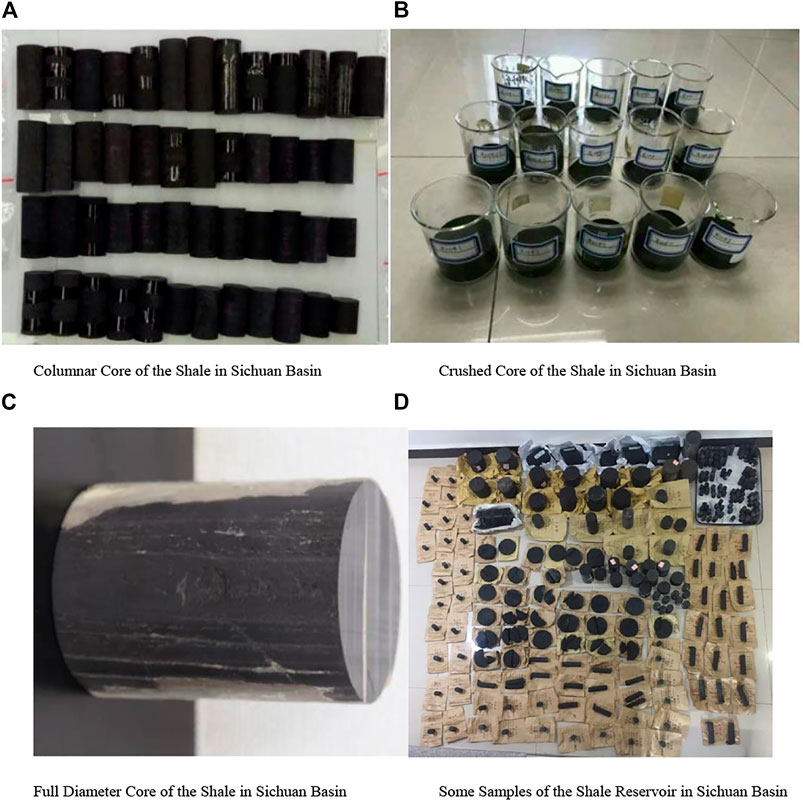
FIGURE 1. Core samples of the shale reservoir in the Sichuan Basin.
Porosity Measurement
According to the measurement results, it is found that the porosity of the 179 rock samples ranges from 0.39 to 9.729%, with an average of 3.834%. The shale porosity is measured with Poropem-200 type porosimeter at overburden pressure. Nitrogen with a purity of 99.99% is used as the medium, and a high-precision pressure sensor is used. The samples are prepared as cylinders with a diameter of 1.5 cm and a length of 2–3 cm. The particle volume is measured through pressurizing nitrogen from a pre-pressurization chamber of known volume into a sample chamber with rock samples on the basis of the helium expansion principle.
Permeability Measurement
The measurement results show that the shale core permeability is extremely low, and the shale permeability is about 10−4∼10−3 μm2. A variety of permeability testing methods are used in this study, including pulse permeability testing and steady-state permeability testing. The permeability of a total of 147 rock samples is measured by pulse tests. Their permeability ranges from 0.00008 to 0.011 mD, with an average of 0.0691 mD. The permeability of a total of 114 rock samples is measured by steady-state tests, and the average of different horizons ranges from 0.00016 to 0.002 mD.
Mineral Composition and TOC Content Measurement
The mineral composition of the shale is one of the important indicators for understanding the reservoir, and the analysis on the mineral composition is helpful for studying the flow characteristics and retention reasons of fracturing fluid in the reservoir. In this study, Xan -ray diffractometer is used to conduct the full-mineral analysis of the target core. According to the X-ray diffraction analysis data of the core, the main mineral components of shale include quartz, feldspar, calcite, dolomite, clay, and pyrite; the clay minerals include mainly illite, illite/smectite formation, and chlorite.
It can be seen from the core analysis data that the rock minerals are mainly quartz, feldspar, carbonate rock, clay, and pyrite; the content of brittle minerals (quartz, feldspar, carbonate rock) is generally greater than 65%, while the content of expansive minerals is small. The clay minerals such as illite, chlorite, and illite/smectite formation are developed mainly, while illite is the most important mineral component with the content (mass fraction) of 77–83%, followed by kaolinite with the content of 4–17%, and the chlorite content is small.
The illite/smectite formation has a relatively large specific surface area and can absorb a large amount of water, which will cause easily spontaneous imbibition and retention of fracturing fluid. Since illite is a speed-sensitive mineral which will easily cause particle migration and reservoir choke, attention shall be paid to controlling the flowback speed during the flowback process. The low chlorite content indicates that the shale in this block is not an acid-sensitive mineral. When there are a large number of natural fractures filled with brittle minerals in the shale, volume fracturing will be easier for the shale reservoir; on the contrary, when the clay content in the shale reservoir is higher, the development of fractures will be difficult in the reservoir. The content of brittle minerals and clay largely determines whether shale reservoirs are compressible.
According to the TOC content analysis results (Figure 2), it can be seen that the TOC content of the LongYi 11 layer and LongYi 12 layer is distributed between 6.32 and 4.32%, which are much higher than the values of other layers; the Wufeng Formation has the lowest TOC content (1.53%).
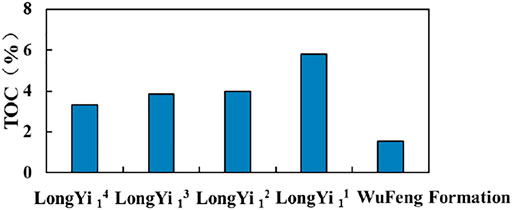
FIGURE 2. Average TOC content of each layer.
Wettability Measurement
The rock wettability is the result of the interaction between rock minerals and fluid. It has significant influence on capillary pressure and relative permeability. In the shale wettability experiment, the core of ChangNing Block is used to measure the wetting angle and analyze the changing rule of wettability at different soaking times. On-site fracturing fluid is used to measure the two-phase wetting angle of the tested core after soaking for 0, 1, 5, 10, 15, 20, and 30 days. The results (Figure 3) show that as the soaking time increases, the measured wetting angle gradually decreases and the rock hydrophilicity increases. The changing degrees of the measured wetting angle are different for the same batch of rock samples soaked in different fracturing fluids, but the influence of different fracturing fluids on the wettability of rocks is small (Figure 3).
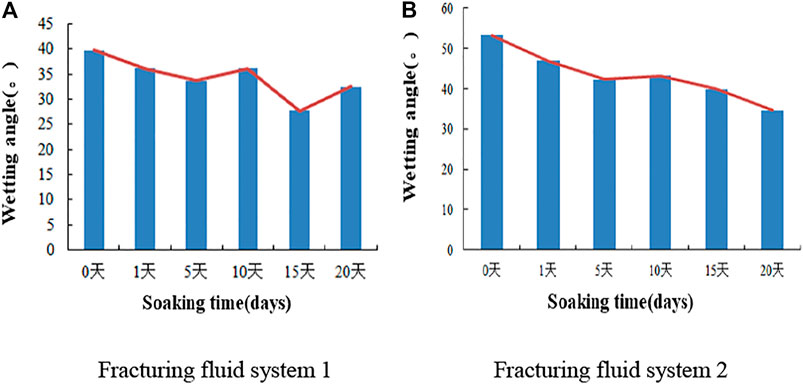
FIGURE 3. Changes of the wetting angle with the soaking time.
Scanning Electron Microscope Experiments
In this study, the environmental scanning electron microscope (ESEM) is used to characterize the micropore structure and micromorphology of shale under high- or low-vacuum conditions. The ESEM has a magnification of 6x-100000x and is equipped with accessories such as X-ray energy-dispersive spectroscopy (EDS) and cryogenic freezing table. It can be used for qualitative and quantitative analyses of micro-area elementary composition from points, lines, and planes based on morphology or observing samples directly.
The outcrop of the ChangNing Block is selected and soaked in the slick water fracturing fluid system (slick water fracturing fluid formula: 0.1% resistance reducing agent, 0.1% anti-swelling agent, 1% discharge aiding agent) for 0, 1, 5, 10, 15, and 20 days, respectively, for SEM experiments (Figure 4). The properties of the pore structure, the microfracture development, and the change of shale micropore structure after soaking are observed in the experiments.
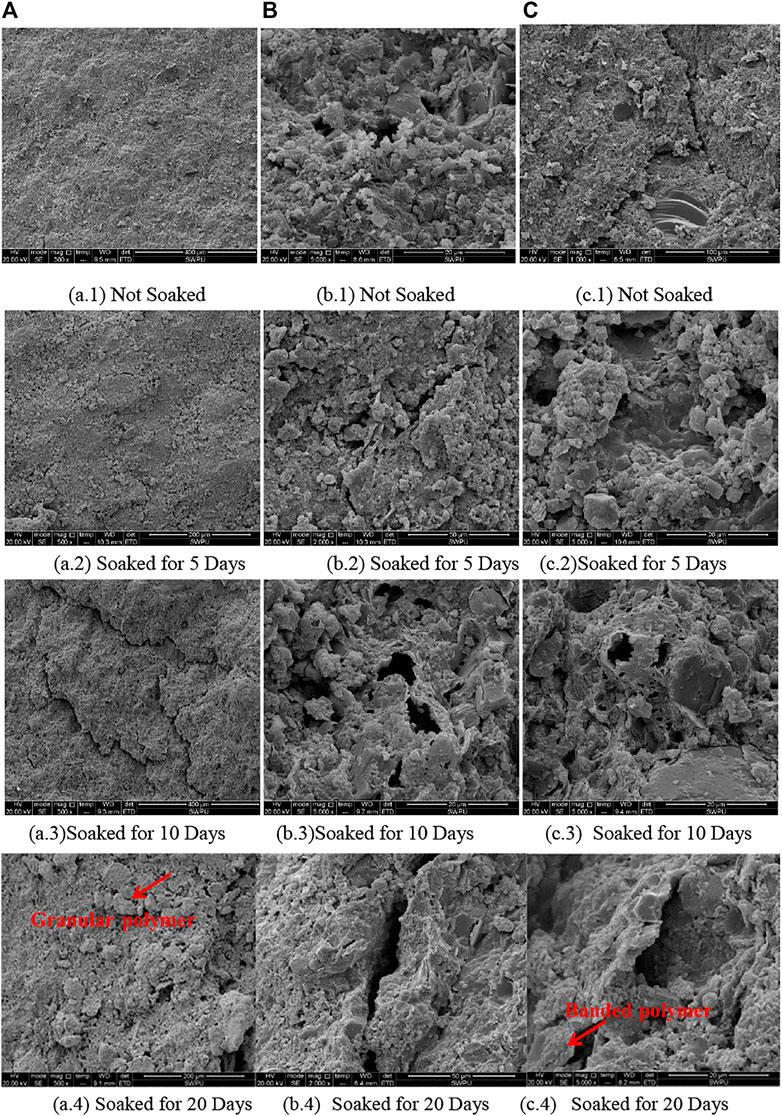
FIGURE 4. The outcrop of the ChangNing Block soaked in the slick water fracturing fluid system for 0, 1, 5, 10, 15, and 20 days, respectively, for SEM experiments; (A–C) show how the three outcrop change after soaked.
According to the experimental results, the shale outcrop in the ChangNing Block has a dense rock structure, and some of the rocks have microfractures and corrosion pores, with locally distributed calcite and a few intergranular pores filled with clay minerals; cracks and karst caves are developed; after soaking, a large number of granular or stripped polymers adhere to the rock surface as the number of soaking days increases possibly because clay in the rock expands and then migrates to the rock surface through microfractures as the number of soaking days increases. This shows that the intrusion of fracturing fluid will change the pore structure of shale, which lays a theoretical foundation for the subsequent mechanism analysis of factors influencing the flowback process.
Simulation of Factors Influencing the Flowback Process After Shale Gas Well Fracturing
A dual-porosity/dual-permeability model is used in the research of this study: The matrix is the gas storage space, and the fractures are the main gas seepage channels. The Langmuir isothermal adsorption model is used to describe the desorption process of the gas in the matrix pores. The desorbed gas enters the fractures by diffusion; there is flow between matrixes and between the matrix and the fracture; the gas flow in the fracture system follows Darcy’s law.
CMG numerical simulation software is used to establish a shale gas reservoir mechanism model (Figure 5), with the dimensions of 1200 m (length) × 600 m (width) × 45 m (height). This gas reservoir model includes a production well with a length of 1000 m, an injection well with a length of 1000 m, and a main fracture through the thickness of the gas reservoir along the horizontal well. The injection well is used to simulate the invasion process of fracturing fluid and assign a value to the initial saturation field in the flowback process after fracturing. The parameters of the reservoir properties are obtained through experiments, and the details are listed in Table 1.
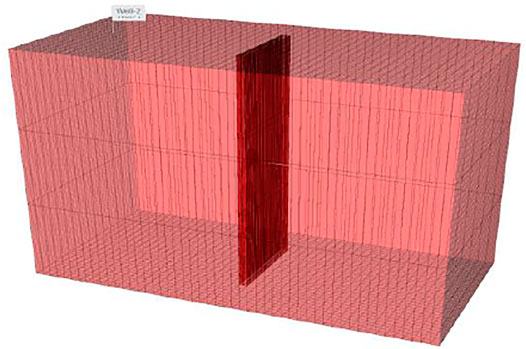
FIGURE 5. Diagram of the shale gas reservoir mechanism model.
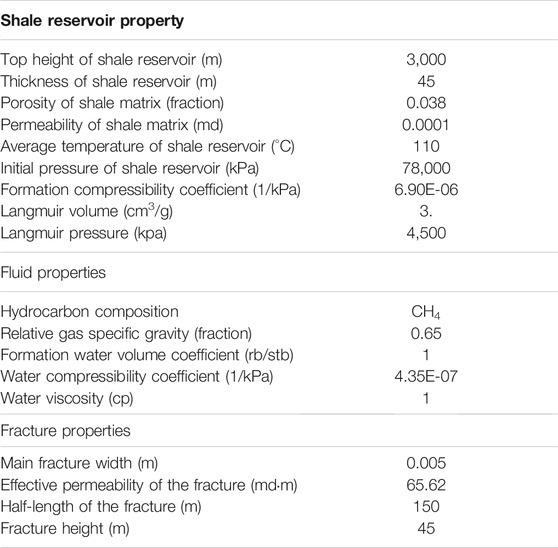
TABLE 1. Full-scale simulation model description.
Reservoir Properties
(1) Ultralow water saturation
During the reservoir-forming process, there are two ways to form water saturation (Roychaudhuri et al., 2011): displacement of liquid-phase water by the gas phase and liquid-phase water evaporation. In shale gas reservoirs, a phenomenon of “ultralow water saturation” exists; the main reason is that initial water saturation is lower than bound water saturation formed by displacement (Fakcharoenphol et al., 2014). Relevant studies have shown that the evaporation of liquid water during the reservoir-forming process and the natural gas’s carrying effect on water vapor (gas-carrying liquid) are the main reasons for this phenomenon (Singh, 2016). The water saturation of the shale in the Sichuan Basin ranges from 30 to 60%; the bound water saturation is approximately 70%; ultralow water saturation exists. However, since the gas–aqueous two-phase relative permeability curve of the shale with a bound water saturation of 70% is difficult to obtain at present, actual values are not used in this article to study the effect of “ultralow water saturation” on the flowback rate and productivity. This study simulates five schemes with the initial reservoir water saturation of 5, 10, 20, 30, and 50% under the condition that the bound water saturation is 40%. The following production system is developed for simulation: 10 days of well shut-in after injection of fracturing fluid and production for 3 years.
It can be seen from the simulation results that as the initial water saturation of the reservoir decreases, that is, the “ultralow water saturation” phenomenon becomes more serious; the higher the cumulative gas production is, the lower the cumulative water production will be. The reason is that the more severe the ultralow water saturation phenomenon is, the larger the fracturing fluid imbibition volume will be, which results in a higher increment of water saturation in the reservoir, larger amount of gas displacement into fractures during imbibition, and higher cumulative gas production (Figure 6). For example, for the reservoir with the most severe ultralow water saturation phenomenon (the initial water saturation is 5%), the daily gas production is around 50000 m3/d; however, for the reservoir without ultralow water saturation (the initial water saturation is 50%), the daily gas production is about 10000 m3/d. After the reservoir with high initial water saturation is shut in for 10 days, the average water saturation will be higher. The fracturing fluid will hinder the deep gas seepage from the reservoir to the wellbore, reducing long-term gas production. Therefore, the lower the initial water saturation is, that is, the more severe the ultralow water saturation phenomenon is, the higher the cumulative gas production of the reservoir will be. However, since the more severe the ultralow water saturation phenomenon is, the larger the imbibition volume of the reservoir will be, and the flowback of the fracturing fluid entering the matrix with extremely low conductivity through imbibition will be very difficult, and the flowback rate (cumulative water production) will be even lower (Figure 7).
(2) Influence of Wettability
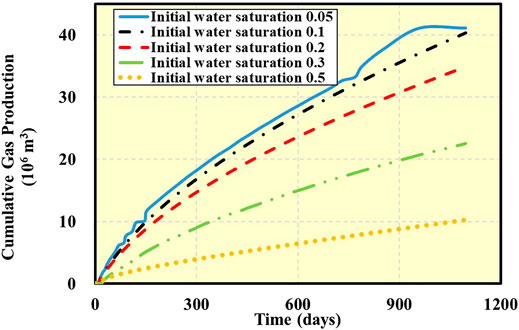
FIGURE 6. Changing curves of the cumulative gas production after 10-day shut-in and 3-year production for different initial water saturation degrees.
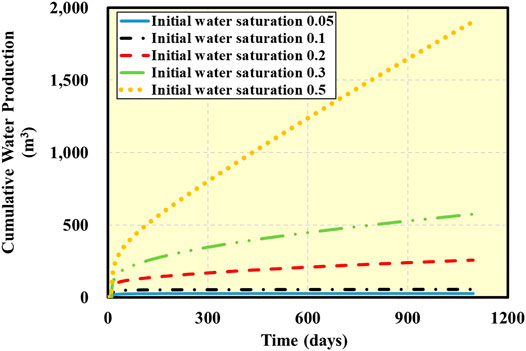
FIGURE 7. Changing curves of the cumulative water production after 10-day shut-in and 3-year production for different initial water saturation degrees.
There are many different views on the wettability of shale reservoirs. It is generally believed that shale wettability is closely related to TOC and clay content. Organic matters in kerogen are lipophilic, while inorganic matters such as clay, quartz, feldspar, and other minerals are hydrophilic. Most scholars studied the wettability of shale through imbibition experiments and wetting angle tests and believed that the wettability of the shale matrix is oily wettability or mixed wettability. The unclear understanding of wettability will directly affect the construction of capillary pressure and relative permeability curves that can represent real condition, which will further affect the prediction on the fracturing fluid flowback rate and productivity of the shale gas reservoir.
In order to study the influence of wettability, Fakcharonphol (Wang et al., 2016) constructed the relative permeability curves and capillary pressure curves of the reservoirs with high wettability, medium wettability, and low wettability (Figure 8 and Figure 9).
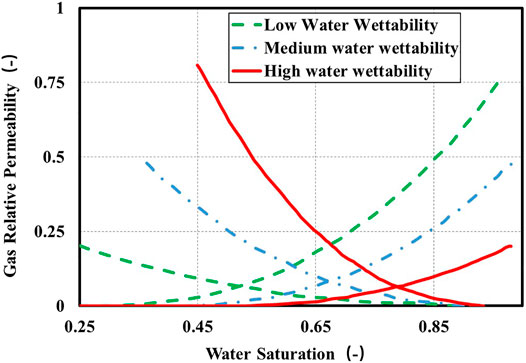
FIGURE 8. Relative permeability curves for different wettability degrees.
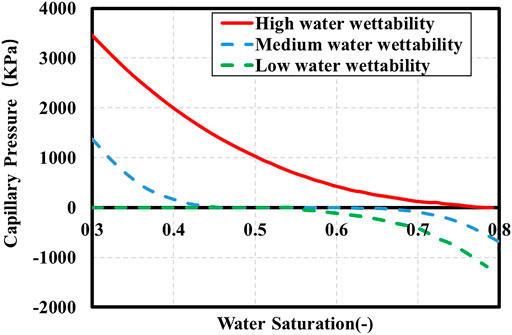
FIGURE 9. Capillary pressure curves for different wettability degrees.
It can be seen from the simulation results that as the degree of wettability decreases, the cumulative gas production decreases, and the cumulative water production gradually increases. The gas production for 3 years under high wettability is much larger than that under low wettability. On the contrary, for cumulative water production, the higher the wettability is, the lower the water production will be. It is generally believed that if the wettability of the reservoir is high, the liquid phase will form capillary water in the small wet pores after entering the reservoir, blocking the small pores, making it difficult for the gas to break through the high capillary pressure of the pores, which causes serious water blocking (Bimal and Sharma, 2004). However, the simulation results in this study show that the higher the wettability is, the better the gas production will be. According to the analysis, for reservoirs with high wettability, the fracturing fluid near the fracture wall will be quickly adsorbed into the reservoir under the action of strong capillary pressure after the well is shut in (Cheng, 2012), so that the water saturation near the fracture surface decreases, and the damage of water blocking can be reduced. At the same time, the effect of imbibition and displacement is also increased in this process, which improves the gas saturation in the fracture and leads to higher gas production and lower flowback rate (Figure 10 and Figure 11). For reservoirs with low wettability, although the fracturing fluid can enter the reservoir under the pressure difference between the well bottom and the reservoir after high-pressure fracturing, the reservoir will show oil-wet after its saturation is increased to be higher than 50%. The resistance of capillary pressure will be reflected: the water intrusion ability will be reduced; the displaced gas will be decreased; the flowback of the fracturing fluid will be increased. For the reservoir with medium wet, the gas and water production changing curves are between those of reservoirs with high and low wettability.
(3) Influence of Capillary Pressure of Reservoir Matrix
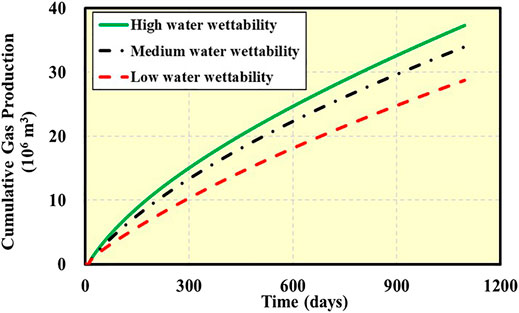
FIGURE 10. Changing curves of the cumulative gas production after 10-day shut-in and 3-year production for different reservoir wettability degrees.
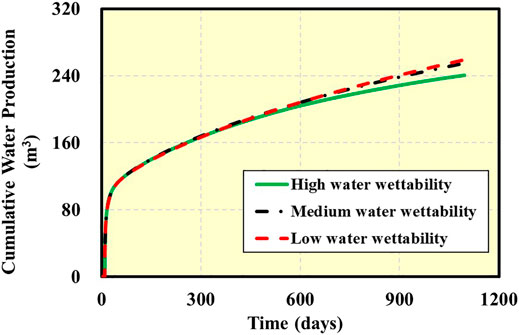
FIGURE 11. Changing curves of the cumulative water production after 10-day shut-in and 3-year production for different reservoir wettability degrees.
The pore throat radius of shale reservoirs is on the micro/nano scale, the capillary pressure generated by the gas–water contact is huge, and some of them even exceed 50 Mpa. The capillary pressure of the shale matrix determines the capability of fracturing fluid imbibition deep into the reservoir during the shut-in process and also determines the resistance of the same matrix water saturation to gas flow during the production process. In order to study the influence of matrix capillary pressure on the flowback rate and productivity, on the premise that all matrix capillary pressure is positive, three different capillary pressure curves (Figure 12) are constructed using the formula behind.
where PcD is the displacement capillary pressure (MPa); σ is the tension of gas–water contact, taken as 72 dynes/cm; Sw is the water saturation; φ is the porosity; k is the absolute permeability, ×10−3 μm2; and a1, a2, and a3 are constants, with values of 1.86, 6.42, and 0.5.
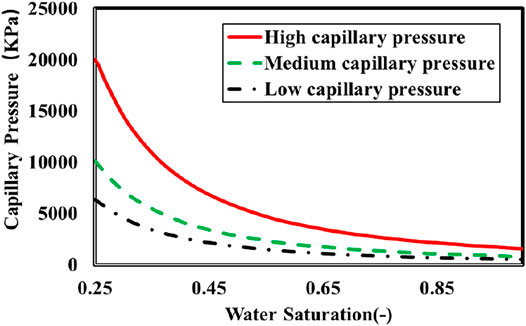
FIGURE 12. Capillary pressure curves of the matrix.
The simulation results show that as the matrix capillary pressure increases, the cumulative gas production increases, but the cumulative water production decreases. This is because the reservoirs with high capillary pressure have a strong imbibition effect; more free gas is displaced and enters the fractures, resulting in a high cumulative gas production in the reservoirs with high capillary pressure. Because of the strong imbibition effect of reservoirs with high capillary pressure, the flowback of the fracturing fluid entering the matrix through imbibition will be very difficult, and the flowback rate of the fracturing fluid will inevitably be lower. The pattern in reservoirs with low capillary pressure is completely opposite. For its weak imbibition effect, phenomena of low cumulative gas production and high flowback rate will occur in reservoirs with low capillary pressure .
Fracturing Parameters
(1) Influence of Fracture Half-Length
The cumulative gas production and cumulative water production curves after 3 years when the half-length of the simulated fractures ranges from 100 to 400 m are shown in the following figure. From the simulation results, the higher the cumulative gas production, the lower the cumulative water production will be if the fracture half-length is longer. The fracture half-length of 200 m is the inflection point of the changes of cumulative gas production and cumulative water production. The cumulative gas production increases with the increase in the fracture half-length, but its growth rate gradually slows down. This indicates that the half-length of the fracture network area will be larger than 200 m, and the larger the half-length is, the more beneficial it will be to production.
(2) Influence of Fracture Shape
The influence of three different fracture shapes (including simple, complex, and network fracture shapes) on the production is simulated. In the complex fracture system, two primary fractures are connected by a secondary fracture; in the network fracture system, all primary and secondary fractures are connected with each other (Figure 13).
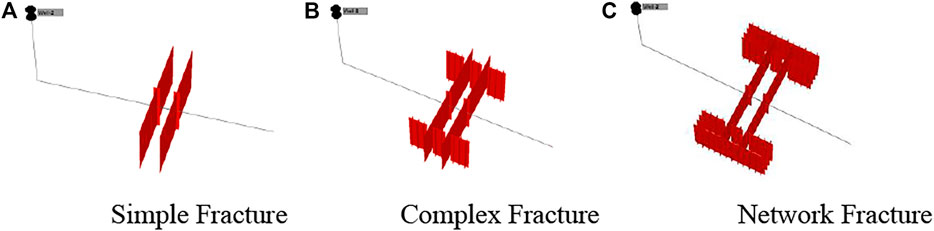
FIGURE 13. Simulated diagrams of different fracture shapes. (Red areas in the figure (A–C) denote for the fracture systems.)
The cumulative gas production and cumulative water production curves for 3 years corresponding to three fracture shapes are as shown in the following figures. It can be seen that the more complex the fracture shape is, the higher the cumulative gas production will be, but with the lower the flowback rate. In the network fracture system, for example, due to the low flow conductivity of the secondary fractures, a large amount of fracturing fluid will be retained in these fractures, resulting in a low flowback rate. Second, the more complicated the fracture network is, the more the fracturing fluid entering into the matrix through filtration will be and the more the liquid that is difficult to return; however, in this case, more gas will be replaced and the flow connectivity of fractures will become higher, which can improve the gas production significantly but make flowback more difficult.
(3) Influence of the Fracture Conductivity
When the fracture conductivity is 40 μm2 cm during fracturing, it will be beneficial to production. It can be seen from the simulation results that when the fracture conductivity is lower than 40 μm2 cm, with the increase in the fracture conductivity, the cumulative gas production gradually increases, and the water production increases first and then decreases. However, when the fracture conductivity is higher than 40μm2 cm, with the increase in the fracture conductivity, the cumulative gas production does not change much and the water production gradually decreases. The reason is that when the conductivity is less than 40 μm2 cm, with the increase in the fracture conductivity, the flowing capacity of the gas and liquid phases increases, and the water production and gas production become higher; with the further increase in the fracture conductivity, the fracturing fluid entering the formation through filtration increases, more gas is displaced, and the cumulative gas production increases. The effect of fracture conductivity becomes weak after the fracturing fluid enters the matrix through filtration, which makes flowback difficult. Therefore, the cumulative water production is reduced. When the fracture conductivity is higher than 40 μm2 cm, the fracturing fluid which enters the matrix through filtration is difficult to flowback, and more gas can be displaced. However, since the fracturing fluid entering deep into the reservoir causes water blocking, the influence of the fracture conductivity on the change of gas production will be small.
(4) Influence of the Number of Fracture Clusters
It can be seen from the simulation results about the effect of the number of fracture clusters on the production that the larger the number of fracture clusters is, the higher the initial gas production and cumulative gas production will be and the lower the flowback rate will be. The reason is that the larger the number of fracture clusters is, the fracture network becomes more developed. The fracturing fluid entering the secondary fractures and the matrix with weak flowing capacity through filtration becomes easier. In this case, the flowback will be more difficult, the cumulative water production will decrease, but the amount of the displaced gas will increase and the gas production will become high.
Drainage–Production System
(1) Shut-In Duration
Simulated the flowback conditions under the difference production conditions immediately produce or shut in for 3, 6, 9, and 12 months after fracturing. The simulation results show that with the increase in the shut-in duration, the initial gas production gradually increases, the later gas production does not change much, and the cumulative water production gradually decreases. The reason is that the longer the shut-in duration is, the stronger the imbibition effect of the micropores will be. The fracturing fluid in the primary fractures will further enter the matrix and secondary fractures through filtration which cause the fluid return difficult, resulting in a lower cumulative water production. The fracturing fluid that enters deep into the matrix will change the pore structure of the reservoir through spontaneous imbibition and hydration to displace more gas, so the initial gas production will be larger. However, since the fracturing fluid deep into the reservoir will cause water blocking due to the increase in water saturation, and the gas production in the later period will not change much.
(2) Influence of the Differential Pressure of Production
It simulated the influence on the production under the differential pressure ranging from 4 to 20 MPa (with 4 MPa interval). It can be seen from the simulation results that the differential pressure of production is the driving force for fluid seepage. The higher the differential pressure is, the higher the cumulative gas production and the flowback rate will be. If the fractures are stable and do not cause the propane flowback, a higher differential pressure shall be adopted for drainage and production. It can be seen from the figure that when the differential pressure of production is higher than 12 MPa, the increase in 3-year cumulative gas production is slightly slowed down. Therefore, the optimal differential pressure of production in this block shall be higher than 12 MPa.
Influence of the Osmotic Pressure
The microscopic mechanism of semipermeable membrane effect of the shale is explained in this section. The shale has a semipermeable membrane effect. Only water molecules are allowed to pass, but saline ions or some saline ions are not allowed to pass. The semipermeable membrane effect is a key factor causing the osmotic pressure, and the microscopic mechanism of the semipermeable membrane effect can be explained by the theory of clay diffuse double layer (DDL). Clay particles are negatively charged, and in order to maintain electrical neutrality, a large amount of positive ions must be adsorbed on the surface. Since the adsorbed positive ions aggregate on the surface of the clay particles, the concentration of positive ions around the particles is higher than that of the bulk solution. Under the effect of concentration difference and thermal motion of molecules, the positive ions tend to diffuse into the solution (Figure 14). The clay DDL is the result of the combined action of surface adsorption and diffusion.
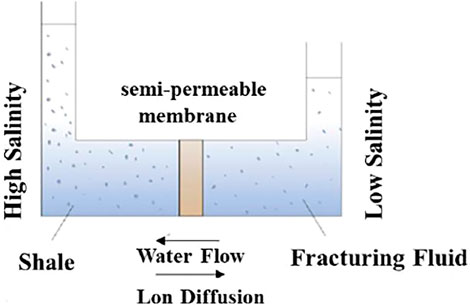
FIGURE 14. Diagram of the osmosis process.
Osmosis refers to the phenomenon that water molecules pass through a semipermeable membrane from the low-salinity solution side to the high-salinity solution side to maintain the salinity balance. The pressure of the high-salinity solution is increased during the osmosis process. This pressure is called osmotic pressure. Kurtoglu (2013) believes that the contact surface between the fracturing fluid and shale has a semipermeable membrane effect. The salinity of the slick water fracturing fluid is about 1–5 kppm, while the salinity of the shale reservoir can be as high as 280 kppm. After a large amount of low-salinity slick water fracturing fluid is injected into the formation, under the action of the osmotic pressure, the water enters the reservoir matrix through the semipermeable membrane effect of the shale. Under the action of an ideal semipermeable membrane, only water molecules can pass through the semipermeable membrane, while the ions in the solution could not pass through the semipermeable membrane. Therefore, a high pressure difference will be generated between both sides of the semipermeable membrane. The shale has a nonideal semipermeable membrane effect, which means water molecules can freely pass through the semipermeable membrane, but the saline ions in the fracturing fluid could not pass through or could only partially pass through the semipermeable membrane.
The influence on the production is simulated in the following situations: the salinity of the formation water and injected fracturing fluid is not taken into consideration. The formation water salinity is 280,000 ppm, and the salinity of the injected fracturing fluid is 100,000 ppm, 10,000 ppm, and 1,000 ppm. It can be seen from the simulation results that the chemical potential difference has a significant influence on both gas production and water production. As the salinity of the injected fracturing fluid gradually decreases, that is, the chemical potential difference gradually increases, the cumulative gas production increases, while the cumulative water production decreases. The reason is that as the chemical potential difference increases, more fracturing fluid enters the formation matrix through osmosis and the flowback will be difficult. After entering the matrix, the fracturing fluid will induce the formation of more microfractures under the effect of spontaneous imbibition and hydration, or make the originally closed natural fractures reopen, so as to displace more gas and improve production.
Conclusion
The physical properties of shale reservoirs in the Sichuan Basin are studied and analyzed through the combination of experiments method and numerical simulation method. On this basis, the factors influencing the gas production and water production in the fracturing fluid flowback process after hydraulic fracturing are studied, and the following conclusions are reached:
(1) The porosity of the core samples from the Sichuan Basin ranges from 0.39 to 9.729%, with an average of 3.834%; the permeability of the shale matrix is about 10−4 × 10⁻³μm2; main mineral components include quartz, feldspar, calcite, dolomite, clay, and pyrite. The results of the wettability test show that as the soaking time increases, the measured wetting angle gradually decreases and the rock hydrophilicity increases.
(2) The shale outcrop in the Sichuan Basin has a dense rock structure, and some of the rocks have microfractures and corrosion pores, with locally distributed calcite and a few intergranular pores filled with clay minerals; cracks and karst caves are developed. A large number of granular or stripped polymers adhere to the rock surface as the number of soaking days increases. This indicates that the intrusion of fracturing fluid will change the pore structure of shale, which lays a theoretical foundation for the subsequent mechanism analysis of factors influencing the flowback process.
(3) According to the numerical simulation based on the flowback process mechanism model established for the fractured shale gas well, factors such as reservoir properties, fracturing parameters, drainage–production system, and chemical osmosis all have an impact on water production and gas production in the flowback process. With the analysis of the influencing mechanism of various sensitive factors on water and gas production, it is concluded that if various influencing factors can contribute to the further filtration of the injected fracturing fluid into the shale reservoir, the flowback of the fracturing fluid in the matrix and secondary fractures will be difficult due to their weak conductivity, so the cumulative water production will also become lower. However, the fracturing fluid that enters the reservoir through filtration will change the pore structure of the shale through spontaneous imbibition and hydration or osmosis, which can provide more gas flow channels to displace more gas and increase the cumulative gas production. The influence of most influencing factors on gas and water production shows that the higher the cumulative water production of shale gas well is, the lower the corresponding cumulative gas production will be. The influencing mechanisms of various factors should be taken into comprehensive consideration in the development of a reasonable drainage–production system, to optimize various control parameters and achieve the purpose of improving gas well productivity. This study can lay a theoretical foundation for the development of the drainage–production system.
Data Availability Statement
The original contributions presented in the study are included in the article/supplementary material; further inquiries can be directed to the corresponding author.
Author Contributions
JW: Overall article structure planning and technical check YD: This paper mainly studies people and writers JZ: Geological content researcher PL: Article layout correction and translation DZ: Numerical simulation study YW: Experimental data processing HZ: Summary of current situation at home and abroad.
Funding
This work was financially supported by the Research on Improvements ff the Producing Degree in Shale (kt 2021-11-02), the Major Technical Field Test Project of PetroChina (2019F-31-02), the National Key Research and Development Program (2018YFF0213802-02), and the Science and Technology Cooperation Project of the CNPC-SWPU Innovation Alliance (2020CX020202).
Conflict of Interest
All authors are employed by the company Petrochina Southwest Oil & Gasfield Company.
Publisher’s Note
All claims expressed in this article are solely those of the authors and do not necessarily represent those of their affiliated organizations, or those of the publisher, the editors, and the reviewers. Any product that may be evaluated in this article, or claim that may be made by its manufacturer, is not guaranteed or endorsed by the publisher.
References
Bian, X., Jiang, T., and Ran, W. (2016). Optimization of the Controlling Parameters of the Post-frac Flowback and Production for Normal-Pressure Shale-Gas Horizontal Wells [J]. Pet. Geology. Oilfield Dev. Daqing 35 (5), 170–174. doi:10.3969/J.ISSN.1000-3754.2016.05.034
Bimal, P., and Sharma, M. (2004). “Cleanup of Water Blocks in Depleted Low Permeability Reservoirs[C,” in SPE Annual Technical Conference and Exhibition (Houston, Texas, USA: Society of Petroleum Engineers).
Chen, Shouyu., Shuzhi, Xiu., and Song, Bo. (2016). Research on Dynamic Simulation of Fracturing Fluid Flowback in Shale Gas Wells [J]. Sino-Global Energy 21 (7), 43–50.
Cheng, Y. (2012). Impact of Water Dynamics in Fractures on the Performance of Hydraulically Fractured wells in Gas-Shale Reservoirs [J]. J. Can. Pet. Tech. 51 (2), 143–151. doi:10.2118/127863-pa
Crafton, J. W., and Gunderson, D. W. (2006). Use of Extremely High Time-Resolution Production Data to Characterize Hydraulic Fracture Properties [J].
Dehghanpour, H., Lan, Q., Saeed, Y., Fei, H., and Qi, Z. (2013). Spontaneous Imbibition of Brine and Oil in Gas Shales: Effect of Water Adsorption and Resulting Microfractures. Energy Fuels 27 (6), 3039–3049. doi:10.1021/ef4002814
Engelder, T., Cathles, L. M., and Bryndzia, L. T. (2014). The Fate of Residual Treatment Water in Gas Shale. J. Unconventional Oil Gas Resour. 7, 33–48. doi:10.1016/j.juogr.2014.03.002
Fakcharoenphol, P., Kazemi, H., and Charoenwongsa, S. (2014). The Effect of Osmotic Pressure on Improve Oil Recovery from Fractured Shale Formations [C]//Spe Unconventional Resource Conference.
Guo, X., Wang, J., and Liu, X. (2016). Gas-Water Two Phase Porous Flow Model of Fractured Horizontal Well in Shale Gas Reservoir [J]. Acta Petrolei Sinica 37 (9), 1165–1170. doi:10.7623/syxb201609011
Jiang, T., Bian, X., and Wang, H. (2013). Flow Back Mechanism Study of Multi-Stage Fracturing of Shale Gas Horizontal Wells [J]. Pet. Drilling Tech. (5), 21–25. doi:10.3969/j.issn.1001-0890.2013.05.004
Kurtoglu, B. (2013). Integrated Reservoir Characterization and Modeling in Support of Enhanced Oil Recovery for Bakken [J]. Dissertations & Theses - Gradworks 8, 1505–1508.
Li, Y., Chen, X., and Jiang, Y. (2019). Gas-water Two-phase Productivity Analysis for the Fractured Horizontal Well in Shale Reservoirs [J]. Pet. Geology. Recovery Efficiency 026 (003), 117–122. doi:10.13673/j.cnki.cn37-1359/te.2019.03.016
Liu, N., Liu, M., and Zhang, S. (2015). Flowback Patterns of Fractured Shale Gas Wells [J]. Nat. Gas Industry 35 (3), 50–54. doi:10.3787/j.issn.1000-0976.2015.03.007
Ll, A., Yw, B., and Saaa, C. (2021). Insights into Scale Translation of Methane Transport in Nanopores[J]. J. Nat. Gas Sci. Eng 96, 104220. doi:10.1016/j.jngse.2021.104220
Roychaudhuri, B., Tsotsis, T., and Jessen, K. (2011). An Experimental and Numerical Investigation of Spontaneous Imbibition in Gas Shales [J]. J. Pet. Sci. Eng. 111 (11), 87–97. doi:10.2118/147652-ms
Singh, H. (2016). A Critical Review of Water Uptake by Shales. J. Nat. Gas Sci. Eng. 34, 751–766. doi:10.1016/j.jngse.2016.07.003
Wang, F., Pan, Z., and Zhang, S. (2016). Modeling Fracturing-Fluid Flowback Behavior in Hydraulically Fractured Shale Gas under Chemical Potential Dominated Conditions. Appl. Geochem. 74, 194–202. doi:10.1016/j.apgeochem.2016.10.008
Wang, J., and Rahman, S. S. (2015). An Investigation of Fluid Leak-Off Due to Osmotic and Capillary Effects and its Impact on Micro-fracture Generation during Hydraulic Fracturing Stimulation of Gas Shale[C]//Europec.
Williams-Kovacs, J. D., Clarkson, C. R., and Zanganeh, B. (2015). Case Studies in Quantitative Flowback Analysis[C]//SPE/CSUR Unconventional Resources Conference.
Wu, J. D., Huang, C. Y., and Liao, C. C. (2003). Fracture Strength Characterization and Failure Analysis of Silicon Dies. Microelectronics Reliability 43 (2), 269–277. doi:10.1016/s0026-2714(02)00314-1
Zhang, L., Kang, Q., and Yao, J. (2014). The Explanation of Low Recovery of Fracturing Fluid in Shale Hydraulic Fracturing by Pore-Scale Simulation [J]. Chin. Sci. Bull. (32), 3197–3203. doi:10.1360/N972014-00461
Zhang, T., Li, X., and Yang, L. 2017, Effects of Shut-In Timing on Flowback Rate and Productivity of Shale Gas Wells [J]. Nat. Gas Industry 037 (8), 48–60. doi:10.3787/j.issn.1000-0976.2017.08.006
Keywords: shale, properties analysis, numerical simulation, chemical osmotic pressure, flowback pattern
Citation: Wu J, Di Y, Zhang J, Li P, Zhang D, Wang Y and Zhou H (2021) Numerical Simulation Research on Influencing Factors of Post-Fracturing Flowback of Shale Gas Wells in the Sichuan Basin. Front. Earth Sci. 9:745393. doi: 10.3389/feart.2021.745393
Received: 22 July 2021; Accepted: 24 November 2021;
Published: 23 December 2021.
Edited by:
Yulong Zhao, Southwest Petroleum University, ChinaReviewed by:
Lingfu Liu, University of Wyoming, United StatesRuihan Zhang, Southwest Petroleum University, China
Copyright © 2021 Wu, Di, Zhang, Li, Zhang, Wang and Zhou. This is an open-access article distributed under the terms of the Creative Commons Attribution License (CC BY). The use, distribution or reproduction in other forums is permitted, provided the original author(s) and the copyright owner(s) are credited and that the original publication in this journal is cited, in accordance with accepted academic practice. No use, distribution or reproduction is permitted which does not comply with these terms.
*Correspondence: Yunting Di, ZHl0ODc3OTdAcGV0cm9jaGluYS5jb20uY24=