 Miguel M. Lima
 Alexandra Hurduc
 Alexandre M. Ramos
 Ricardo M. Trigo
- 1Faculdade de Ciências, Instituto Dom Luiz (IDL), Universidade de Lisboa, Lisbon, Portugal
- 2Departamento de Meteorologia, Universidade Federal Do Rio de Janeiro, Rio de Janeiro, Brazil
North Atlantic Tropical Cyclones (TCs) are major atmospheric hazards that can cause large disruptions to coastal and near-coastal societies. Although most studies focus on those areas with highest impact (e.g., Caribbean Islands, the Gulf and western coast of United States), there is an increasing interest in characterizing changes in occurrence and impacts in areas usually less affected by TCs, particularly in the framework of a changing climate. Here we provide a long-term context evaluating changes in the frequency of TC in the Northeast Atlantic (NEA) basin during the 1978–2019 period. In the last decades, scattered information has shown an impact both from TCs and Post-Tropical Cyclones (PTC) in the NEA. We compute several complementary linear trends and show a significant (p ≤ 0.1) increase in the number of stronger storms in the entire North Atlantic basin, and the amount of TCs and PTCs that reach the NEA, in agreement with previous works. A highly significant relation (p ≤ 0.05) is found between the Atlantic Multidecadal Oscillation (AMO) index and TC activity in both the entire North Atlantic and the NEA basin. Sea surface temperature anomaly maps are produced to better encapsulate the annual variability without the multidecadal oscillation effects and, important cold (warm) pools in cyclogenesis and development zones are found in years with low (high) TC activity. It is also found that the sea surface temperature field plays a minor role in the guiding of storms into the NEA sector. Long-term trends as well as high/low seasonal activity analysis suggest that atmospheric circulation (vertical wind shear, lapse rate, mean sea level pressure and upper-level steering) is more relevant than sea surface temperature in the NEA region.
Introduction
Tropical cyclones (TC) are subject of intense research due to being one of the most destructive weather systems on Earth. There has been increased interest in the occurrence of these systems in the eastern north Atlantic basin, particularly considering the effect that anthropogenic climate change may have on the occurrence and intensity of TCs at higher latitudes (Baatsen et al., 2015; Knutson et al., 2019). Hurricanes are severe tropical cyclones that occur in the North Atlantic Ocean basin, which are characterized by strong winds (>33 ms−1), rain spells, major ocean waves and coastal surges associated with low atmospheric pressure regions (NWS, Tropical Definitions).
For the TC cyclogenesis process to occur several conditions need to be verified (Holton and Hakim, 2012). The most widely referred one is the sea surface temperature (SST), that should be higher than a certain threshold, usually accepted as 26°C (Emanuel, 2003). Furthermore, TCs usually develop from pre-existing atmospheric disturbances such as the African easterly waves (Burpee, 1972), or convection within the intertropical convergence zone (Hsieh and Cook, 2005). Small values of vertical wind shear (VWS), typically less than 10 ms−1 difference between the surface and the troposphere, are also favourable to the intensification of the storm (Paterson et al., 2005). High VWS values generally inhibits organized tropical convection and thus prevents storm intensification (Finocchio et al., 2016). Another high-impact variable regarding TCs is the atmospheric lapse rate (LR), or a measure of temperature change with height. The LR is, therefore, a measure of atmospheric static stability. Typical LR values of a stable atmosphere are ∼6–7 K·km−1, and high values of LR are generally indicative of regions of deep mixing and therefore favourable for deep convection (Takemi and Yamasaki, 2020). Finally, the necessary increase in the vorticity of the storm can only take place if the Coriolis parameter is not negligible, i.e., if there is a sufficient latitudinal displacement from the equator (Emanuel, 2003).
It is expected that, in a warmer climate, TCs frequency, intensity and location may change significantly. These differences can be induced by changes in the spatial distribution of SSTs in a future with warmer seas (Haarsma et al., 2013) but also as a consequence of different atmospheric circulation patterns (Kossin et al., 2014). Additionally, future changes in TCs characteristics may occur through a combination of responses to anthropogenic climate change, such as a general increase in the wind intensity, slower propagation speed, higher precipitation rates, among others (Briggs, 2008; Knutson et al., 2019; Knutson et al., 2020).
The amount and intensity of TC activity varies considerably at intra and inter annual time scales, presenting a wide range of values throughout the years (Briggs, 2008; Ramsay, 2017). There is a growing body of work focused on quantifying global changes in intensity and number of tropical storms (Briggs, 2008; Emanuel, 2008; Knutson et al., 2019). In recent years it was confirmed that between 1979 and 2017 the proportion of major hurricanes to all hurricanes is increasing in all ocean basins (except for the northern part of the Indian Ocean); with a 6% increase per decade at the global scale (Kossin et al., 2020). Particularly in the north Atlantic, Briggs (2008) states that the evolution of TC numbers is not linear, and highly dependent on the length of the time series, pointing to a significant association with the Atlantic Multidecadal Oscillation (AMO), a link also confirmed by other authors (Emanuel, 2008; Knutson et al., 2019). For this basin, the proportion of major hurricanes was found to be increasing by 49% per decade in the period of 1979–2017 (Kossin et al., 2020).
At mid-latitudes, TCs often lose their tropical features, in a process called post-tropical transition (Haarsma et al., 2013; Baatsen et al., 2015). This usually results because the cyclone crosses colder waters, evolving towards a cold core structure. These are named extratropical cyclones (ETC) and their primary energy source is provided by the contrast between warm and cold air masses, i.e., of a baroclinic nature. Nevertheless, if this transition takes place near the continental coast, making landfall, their impacts can be like those of a TC, including strong winds, heavy precipitation, and in some cases storm surges (Eiras-Barca et al., 2018; NWS, Tropical Definitions).
Located at mid-latitudes, Western Europe is usually considered to be unaffected by TCs, however there is growing evidence of being increasingly prone to nearby post-tropical transitions, and therefore a higher number of Post-Tropical Cyclones (PTCs) reaching land (Sainsbury et al., 2020). This means that Europe—and the eastern region of the North Atlantic—despite not experiencing much TC activity, might become an area that not only will see sporadic intense phenomena but will overtake a lot of post-tropical transitions and very intense ETC. Although powerful, it is worth noting that TCs that impact Western Europe are the exception and not the rule over the entire hurricane season. For this reason, it is important to take into consideration the potential change that both TC and PTC will over go in a warming climate. Some authors have used Global Circulation Models to show that relevant changes in cyclonic and post-cyclonic activity might impact this region in the near future, with more storms reaching Western Europe (Haarsma et al., 2013; Baatsen et al., 2015).
Within the context of possible changes in the occurrence of TCs, three recent case studies in the north-eastern part of the north Atlantic basin have been studied in further detail (Lima et al., 2020). All three events had significant impacts in continental Portugal (Ophelia in 2017 and Leslie in 2018), and in the archipelago of Azores (Lorenzo in 2019), after briefly reaching category 5 a few days before, a primer for the North-eastern Atlantic region. From the three case studies, Hurricane Ophelia (2017) has been a focus of study in recent years due to its unusual occurrence (Hafez and Labban, 2018; Stewart, 2018; Rantanen et al., 2020). Ophelia was a powerful hurricane which originated—in the first half of October 2017—in southwest of Azores and intensified into a category three storm just south of the archipelago, north of the 30°N parallel, corresponding to the most north-western category three hurricane ever observed in the NA basin.
While not making direct landfall in the Iberian Peninsula, Ophelia caused widespread impacts in the region, being one of the catalysers of the October 2017 Iberian wildfires that caused the loss of life of 49 people and close to a hundred injured people (Hatton, 2017; Castellnou et al., 2018; Pinto et al., 2018). It is, however, important to stress the compound nature of this event (Zscheischler et al., 2020). The preconditioning record-breaking drought that had been affecting western and central Europe since July 2016 (García-Herrera et al., 2019) was another significant driver that contributed to this outcome due to vegetation water stress. This storm, although the exception and not the rule, represents an excellent example of the unexpected damage phenomena that an intense event, such as Ophelia, might impinge onto regions that are not as used to deal with TCs. This consideration is relevant not just regarding the unusual southern winds over western Iberia, but equally the later precipitation and storm surge, recorded in Ireland, where it has been considered the worst storm that affected the island in 50 years, causing three direct casualties after its extratropical transition, totalling a loss of around 100 million euros (Stewart, 2018).
It is important to stress that both TC and ETC activity at post-tropical and mid-latitudes appear to play a major role in the development and/or maintenance of Atmospheric Rivers (AR), namely in North-Western Europe (Baatsen et al., 2015; Ferreira et al., 2016; Eiras-Barca et al., 2018). ARs are responsible for a large fraction of water vapour transport in the troposphere and are directly linked to extreme rain and flood events, particularly in western Iberia (Ramos et al., 2015) but also in the remaining western Europe (Lavers and Villarini, 2013; Eiras-Barca et al., 2021). TCs are convective storms and as such, their potential to create massive water transports in the troposphere is considerable, which could contribute to AR formation (Stohl et al., 2008; Ciric et al., 2017; Keller et al., 2019). Both Stohl et al. (2008) and Ciric et al. (2017) showed, in the Atlantic, AR formation due to TC activity, which impacted the Norwegian southwestern coast and the Danube River Basin region, respectively. In short, it is reasonable to consider that intense TC activity combined (or not) with AR activity could contribute to extreme rain and flood events in western Europe.
The main goal of this study is to evaluate the significance of changes in the occurrence and intensity of TCs, including the relationship between the occurrence of tropical cyclones in the entire North Atlantic and the North-eastern Atlantic sector. In addition, the role played by several relevant fields including SST, LR and VWS will be analysed in detail in order to understand the variability of TC activity in the region. In Data and Methodology sections we introduce the data and a description of the methods, respectively. Long-term assessment of changes in the occurrence of TCs are analysed and discussed in Results and Discussion section. Finally, conclusions are drawn in Final Remarks section.
Data
The International Best Track Archive for Climate Stewardship Project version 4 (IBTrACS v4) free access dataset (Knapp et al., 2009) was used for the TC analysis. This dataset contains global information regarding TC activity since 1851, aggregating variables such as geographical location at 6-h intervals (original dataset interpolates for increased resolution, at 3-h rates, however these observations were not used in the present study), maximum wind speed and minimum sea level pressure. Each 6-h interval time-step (observation) will herein be mentioned as 6-h observations. Single observations regard the maximum intensity observation of each TC.
A topic of discussion when studying TCs, is the fact that best-track datasets, namely the most widely used IBTrACS, presents heterogeneities in space, time, and TC specificities since it is a compilation of several agency records that often possess different technologies to identify and record storms in different basins (Knapp et al., 2009; Kossin et al., 2013). Previous studies have contributed to mitigate this caveat, namely by developing an additional method that homogenizes the worldwide TC data (Kossin et al., 2013). Although this issue is highly relevant at the global level and for longer time series, in the NA basin alone, there have been consistent data acquisition since the late 1970s [NCEP, NOAA, ISCCP B1 Satellite Information (NOAA National Centers for Environmental Information, 2021)]. As such, this study will cover only the higher confidence 42-year period spanning from 1978 to 2019.
The temporal series of the Atlantic multidecadal Oscillation (AMO) index dataset was retrieved from the Physical Sciences Laboratory (PSL), presenting a monthly sampling from 1856 to the present (Enfield et al., 2001). The El Niño Southern Oscillation (ENSO) 3.4 (Rayner et al., 2003) and North Atlantic Oscillation (NAO) (Jones et al., 1997) indexes were also retrieved from the PSL datastore, presenting monthly samplings from 1870 and 1821, respectively, to the present. However, to ensure temporal compatibility with the IBTrACS dataset, only the period of 1978–2019 was used in this study for all the indexes.
Sea Surface Temperature was retrieved from the NOAA OI SST V2 High Resolution Dataset, provided by the PSL (NOAA National Weather Service, 2021). Data is available from September 1981, on a daily sampling interval, with a spatial resolution of 0.25° × 0.25° (Reynolds et al., 2007).
Zonal and meridional wind components, at 200- and 850-hPa, temperature, at 500-hPa and 1,000 hPa, and Mean Sea Level Pressure (MSLP) reanalysis data was retrieved from the fifth generation of the European Centre for Medium Range Weather Forecasts (ECMWF) global reanalysis (ERA5), with 0.25° × 0.25° spatial resolution and hourly temporal resolution available from 1979 to the present (Hersbach et al., 2020).
Methodology
Two areas of focus were considered in this study: the North Atlantic (NA) basin, and a sub-region of NA, the North-eastern Atlantic (NEA) sector. The NA spans zonally from 0 to 60°N and is meridionally enclosed on the west by the African continent and Southwestern Europe and by the American continent to the East. The northern and eastern boundaries of NEA coincide with the larger NA boundaries. In the south, the NEA is limited at 25°N, just slightly north of the tropic of Cancer and in the west at 40 W, approximately in the middle of the NA basin.
The NA basin was chosen for encompassing all TC activity from cyclogenesis to cyclosis. In the NEA, the cyclonic activity is less frequent, with relatively more TC decreasing their intensity and even dissipating. Despite the low frequency of cyclonic activity in the NEA, the storms in this region have the potential of reaching the European continent and present a considerable risk to the populations and socio-economic activities in these coastal countries (Ramsay, 2017).
The spatial distribution of occurrence of TC and cyclogenesis was evaluated using the Kernel Density Estimation (KDE) method that smooths a 2D histogram over a geographical region of choice, using a Gaussian kernel, producing a continuous distribution of probabilities over the area of analysis (Fotheringham et al., 2000).
To more quantitatively compare both regions in the study, NA, and NEA, two types of measure of TC activity were used to evaluate the time series in both regions: 1) the number of TC observations and 2) the Accumulated Cyclone Energy (ACE), that is, the sum of the squares of wind velocity, measured in knots. These activity metrics allowed us to perform different assessments of the inter-annual variability of TCs activity in both NA and NEA, assuring that the data relative to the NEA region was excluded from the total NA, to avoid co-variability that would result from doubled data. In the first assessment, we produced a quantitative comparison between the full time series and three indices relative to major large-scale climate patterns, namely the AMO, ENSO 3.4 and NAO, using Pearson correlation (Wilks, 2011). For the second evaluation approach, both series were halved, and then compared the quantile distributions of each half.
To extend on the temporal evolution of TC occurrence across both regions considered in this study, an analysis was conducted that evaluated different TC intensities: tropical storm with maximum wind speeds under 33 ms−1; hurricane with maximum wind speed between 33 and 49 ms−1; major hurricanes with maximum wind speed above 49 ms−1 (Kossin et al., 2020).
We employed an approach like that of Kossin et al. (2020), in which the authors examined the proportion of major hurricane observations over time. Here we extend this analysis to three other proportions, namely: major hurricanes vs. tropical cyclones; hurricanes vs. tropical cyclones; major hurricanes vs. hurricanes; tropical cyclones in NEA vs. tropical cyclones in NA. This analysis was performed using two metrics, on the one hand it was carried out for the highest intensity observation per event (single observation), on the other hand it was performed for all observations of each storm through its lifetime (6-h time steps). This differentiation aims to both study if there are more intense phenomena occurring and to evaluate if on average, each TC is maintaining these higher intensities for longer periods of time (Briggs, 2008; Emanuel, 2008; Knutson et al., 2019; Kossin et al., 2020). Another hypothesis is that we are seeing faster intensification of TCs in the NA basin (Balaguru et al., 2018), given that most of the lower intensity observations are either representative of TC in the cyclogenesis phase or less intense phenomena in general. To attest the trend in these proportions, we used the Mann-Kendall monotonic trend test, a non-parametric robust statistical test to verify if a given series presents significant monotonic trends (Hussain and Mahmud, 2019).
Due to the possible correlation between the AMO and TCs occurrence, the AMO signal was removed from the TCs timeseries. This was done by applying the congruence analysis, initially developed by Thompson et al. (2000) and more recently applied by Jones et al. (2019) to evaluate the role of large-scale atmospheric dynamics in Antarctic temperature trends. This methodology assumes a linear relation between the AMO and the different TC occurrences which allows us to linearly regress the detrended timeseries, multiplying each regression coefficient with the AMO trend, this results in a congruent trend of the AMO in relation to each TC timeseries that can then be removed from the original timeseries, resulting in TC data that can be considered uncorrelated with the AMO. From previous analysis, it is possible to identify some years that had either higher or lower TC activity. Resorting to ACE and regarding both regions (NA and NEA), we chose the years that either surpassed the 90th percentile (high activity) and the years that fell below the 10th percentile (low activity) and produced tendency-removed average SST anomaly (SSTA) fields for the chosen years’ hurricane seasons (from June to November), to identify differences in the spatial distribution of SSTA in each of these circumstances. Similar averaged fields were produced for VWS and LR fields as well as for fields indicative of large circulation patterns at the surface (MSLP), and in the upper levels of the troposphere (meridional and zonal wind fields at 200 hPa), although the averages presented are for the absolute fields themselves, with no tendency removed and no anomalies considered since these variables present a much larger intra-seasonal variability than the SST (Holton and Hakim, 2012). Based on Kossin et al. (2014) and Holton and Hakim (2012), the VWS was calculated in the 850–200-hPa layer, according to the expression:
where u and v represent the zonal and meridional winds, respectively, with the according level subscript. The LR was calculated in the 500–1,000-hPa layer, according to the expression:
where Pavg is the average pressure of the layer, considered between the 500 and 1,000-hPa levels, g is the gravitational acceleration, R is the ideal gas constant, Tavg is the layer average temperature and
Additionally for the NA basin, the 1982–2019 trends were calculated for SSTs, VWS, and LR, using a monotonic seasonal Mann-Kendall trend test, a non-parametric trend test similar to the one described before but which takes into account the data’s seasonality for improved results (Hirsch et al., 1982; Hussain and Mahmud, 2019).
Results and Discussion
Here we evaluate the changes in the occurrence and intensity of TC in the NA and the NAE sector. From 1978 to 2019, the NA basin has experienced 664 TCs and, as expected only a relatively small fraction of these events were registered in the NEA. Table 1 summarizes the number of TC along with the proportion that reached higher intensities.
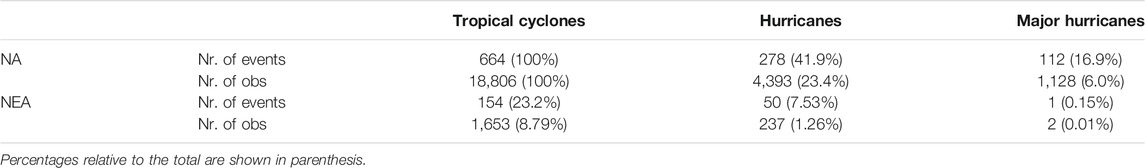
TABLE 1. Number of events and total 6-h observations of tropical cyclones, hurricanes and major hurricanes for both the NA and those that occurred inside the NEA region, from 1978 through 2019.
As expected, the number of TC in the NA is considerably higher than in the NEA, translating into 664 and 154 events, respectively. Of these, circa 42% reached hurricane intensity in the NA, in contrast to just 8% inside the NEA. Concerning major hurricanes, while the whole NA basin experienced 17% of its TC with major hurricane intensity, only 7% of TC affecting the NEA reached major hurricane intensity (not necessarily inside the NEA). Regarding the number of observations of each intensity within the two regions, the few observations for hurricanes and major hurricanes in the NEA, stand out. For the latter, only two observations were recorded, both corresponding to the previously mentioned hurricane Ophelia. The considerable differences between these two regions indicate that the nature and life cycle of cyclonic events reaching the NEA may be different from the whole NA basin, with the former being a zone of colder water and increased wind shear. This assessment is evidenced by the small number (19) of TC cyclogeneses that occurred inside this region, compared with 664 total in the NA for the 1978 to 2019 period. The NEA is, therefore, a zone where an important fraction of all TCs transition into ETCs or have their cyclosis.
For the 1978–2019 period, the distribution of all TC observations in the NA basin shows a higher density of occurrence in the tropical belt, between 5 and 20°N and spanning between the west coast of Africa and the Lesser Antilles Islands (Figure 1A), and the 10–30°N band on the Gulf of Mexico and the Caribbean Sea, with TCs occurring as high as 40°N. In this period, the inland areas with higher occurrence of TC activity were the south-eastern part of the United States and the Caribbean Islands (near the head of the bottom black arrow, Figure 1A).
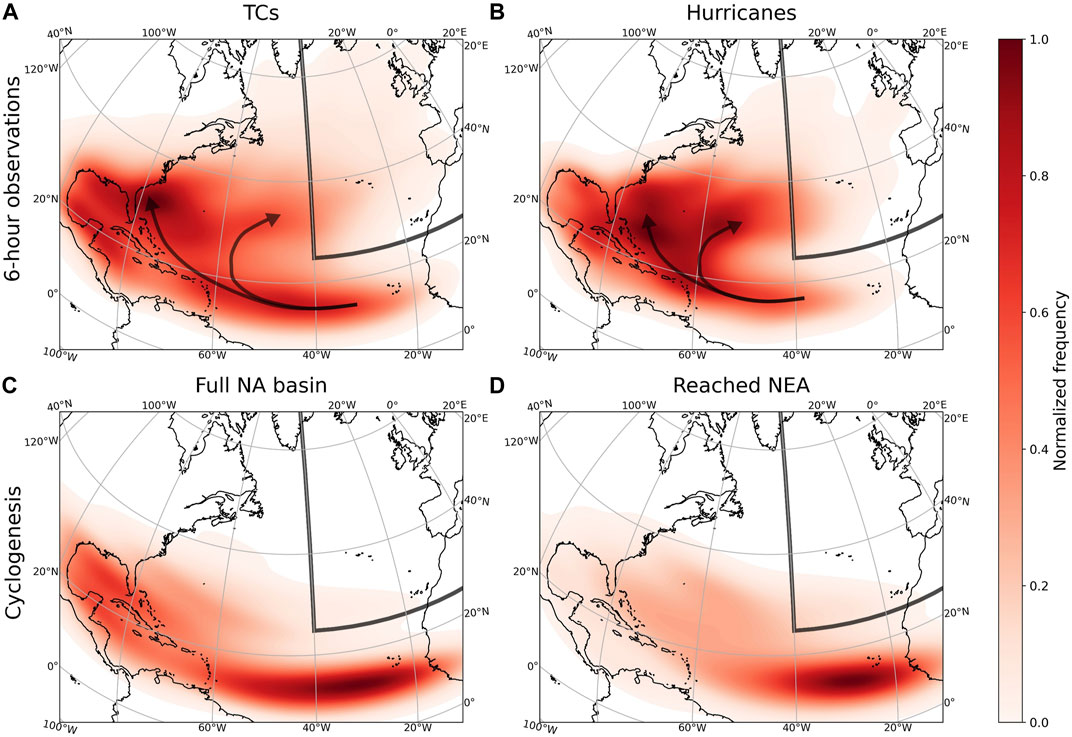
FIGURE 1. Normalized kernel density estimation plots for (A) all TC observations; (B) all hurricane observations; (C) cyclogenesis points for all TCs in the NA basin; (D) cyclogenesis points for all TCs that reached the NEA. Grey box delimits the NEA. Black arrows in (A,B) are referred to in the text.
Hurricane occurrence is higher on the western side of the NA basin (Figure 1B). In this period, the region with more hurricane observations was located between Bermuda and the Bahamas (head of bottom black arrow, Figure 1B). The distribution of hurricane observations is more concentrated than that of TC observations (Figures 1A,B, respectively), presenting a higher probability of occurrence northeast of the Caribbean Sea. These results also confirm the higher intensity over the western side of the basin, as shown by Ramsay (2017). Another major structural pattern to stress is represented by the upper curve, initially oriented from southeast to northwest and then, from southwest to northeast, in the middle of the basin (top black arrows on Figures 1A,B). It is worth mentioning that these arrows reflect the role that both the beta-effect and the westerlies have on TC tracks (Emanuel, 2003; Ramsay, 2017).
Major hurricanes (not shown) are mainly seen in the Caribbean region and with a stronger presence just northeast of the Greater Antilles. It is very rare to observe TCs of this strength in the NEA sector, having occurred only once (i.e., two observations for the same event) during the entire 42-years period, precisely during hurricane Ophelia in 2017 (Stewart, 2018).
Overall, these results confirm that the NEA experiences a much lower density of TC activity and that most of the events that reach this sector do so with a western origin rather than from the south, which can be seen from the upper arrows on Figures 1A,B.
For the same period, the distribution of TC genesis across the whole NA basin (Figure 1C) follows what is expected, with a higher probability density in the tropical band between 5 and 20°N near the west coast of Africa, and a secondary high probability region located in the Caribbean Sea and the Gulf of Mexico. The location of cyclogenesis for TC that reached the NEA is considerably more confined to the tropical eastern sector (Figure 1D).
Analysing the annual 6-h TC observations and cumulative ACE values (Figures 2A,B, respectively) we are able to identify a large interannual variability, with extreme years being marked for the sake of clarity. Moreover, both metrics obtained for our region of interest (NEA) and the NA sector (note that NEA events are excluded from the NA data in this figure) reveal significant correlation with values higher than 0.4. However, it is important to notice the difference in magnitude between both regions, with the NEA region presenting values for both metrics roughly an order of magnitude lower than those for the entire NA basin.
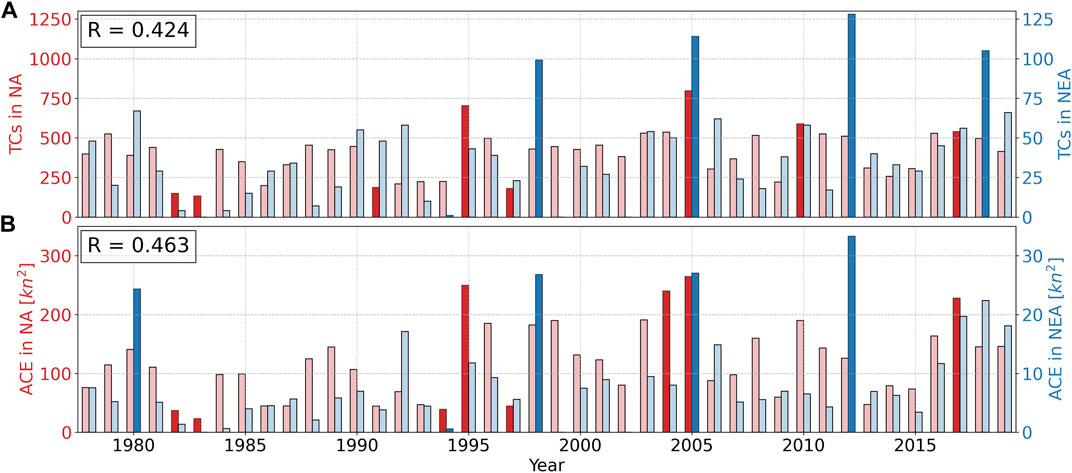
FIGURE 2. Yearly values for (A) 6-h TC observations and (B) ACE, for the 1978–2019 period, with NA (red) NEA (blue). Stronger colours indicate extreme values exceeding the 90th and below the 10th percentile. The associated Pearson’s R between both series, significant at the 95% statistical level is also shown. Note that the axis values relative to the NEA are one order of magnitude smaller than the values relative to NA, with the NEA data removed from the NA dataset.
Considering the ACE as the preferred metric for cyclonic activity (Figure 2B), it is possible to state that the years 1995, 2004, 2005, and 2017 showed extraordinary activity in the entire basin, while the years 1980, 1998, 2005, and 2012 showed particularly high TC activity in the NEA sector. Interestingly the recent three seasons (2017, 2018, and 2019) correspond to years with higher-than-normal TC activity in the NEA (all three above the 80th percentile). On the other hand, the years 1982, 1983, 1991, and 1994 are characterised by hurricane seasons presenting the lowest TC activity in the NA. For the restricted NEA sector, there have been three seasons with 0 TC activity: 1983, 1999, and 2002, while 1994 also presented low activity.
Several authors have noted that the interannual variability of TC activity in the NA basin is dependent on the phase and amplitude of large-scale modes of circulation, such as the El Niño Southern Oscillation (ENSO), the North Atlantic Oscillation (NAO) or the AMO (Briggs, 2008; Emanuel, 2008; Knutson et al., 2019). Using the AMO, as well as ENSO and NAO index data and correlating these with time series of TCs and ACE (Figure 2), in both regions (Table 2), shows that the AMO index is more strongly correlated to the cyclonic activity both when compared to the other indexes but also showing more prominence in the whole basin than in the NEA where only the AMO correlation is significant.
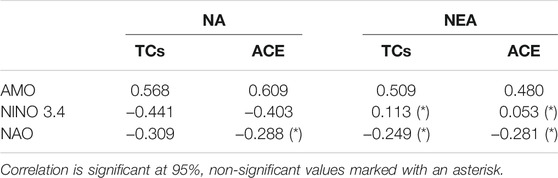
TABLE 2. Pearson’s R between each series in Figure 2 and the AMO, NINO 3.4 and NAO indexes.
For the NA basin the AMO is strongly correlated with both the ACE and the TCs frequency, although slightly more with the former. In the case of the NEA sector, the AMO correlation is weaker, with values below 0.51. This may indicate that, although SST is a relevant mechanism controlling the genesis of TCs, it may not have a crucial role in guiding them to the easternmost side of the basin.
Previous works have stated that the AMO presents a significant relation with TC occurrence (Briggs, 2008). It is known that the NA had a period of lower SSTs extending from the late 1960s to the late 1990s, followed by a warmer period starting in the late 1990s (Alexander et al., 2014). This evolution is reflected in the AMO index, presenting negative values in the beginning of the present study’s TC dataset and positive values during the period of higher SSTs. The time series of both ACE and 6-h TC observations (shown in Figure 2) was divided in two periods of equal length (1978–1998 and 1999–2019, 21 years each), allowing a more objective comparison between the distributions of both variables for the two consecutive halves (Figure 3). It is possible to observe an upward trend for both variables and regions when comparing the first and the second halves of the 1978–2019 period. Moreover, ACE shows a decrease in variability for the NA basin, while an increase in variability can be observed for the NEA (Figure 3A). Regarding all TC observations a decrease in variability occurs for both regions (Figure 3B).
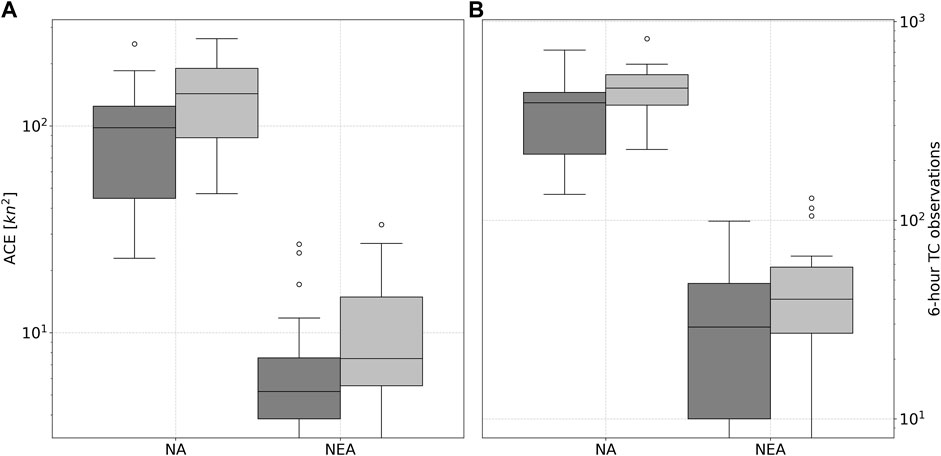
FIGURE 3. Boxplots for (A) ACE and (B) 6-h TC observations for both the NA and the NEA, with NEA data removed from the total NA dataset; Each time series is divided into two periods: 1978–1998 (dark grey) and 1999–2019 (light grey).
Despite these results, several authors have shown that the absolute frequency of TCs appears not to be changing significantly (Briggs, 2008; Knutson et al., 2019). However, some studies indicate the likelihood of a recent increment in the frequency of intense storms (Briggs, 2008; Emanuel, 2008; Knutson et al., 2019; Kossin et al., 2020). Nevertheless, it is worth stressing that even in the absence of significant changes on the frequency of TCs it is possible that there have been changes in some of their characteristics, namely in terms of intensity or of preferred geographical location, with a likely poleward migration across all basins (Kossin et al., 2014).
In order to evaluate relative changes in the frequency of occurrence of the most intense hurricanes compared with all TCs we used a methodology similar to that employed by Kossin et al. (2020). Additionally, we have removed the more influential effect of the AMO from the datasets using congruence analysis, initially introduced by Thompson et al. (2000), since the long-term variability associated with the oscillation could be dominating the positive trend observed in Figure 3. Thus, we examined the temporal changes in the proportion of different categories of TCs using a Mann-Kendall monotonic trend test (Figure 4). Most regression lines are statistically significant—at the 10% level—i.e., present a strong positive relation with time (apart from those depicted in Figures 4C,E,F). This reinforces the idea that, even though the absolute frequency of TC activity might not be significantly changing, it is in relative terms particularly in what concerns their intensity.
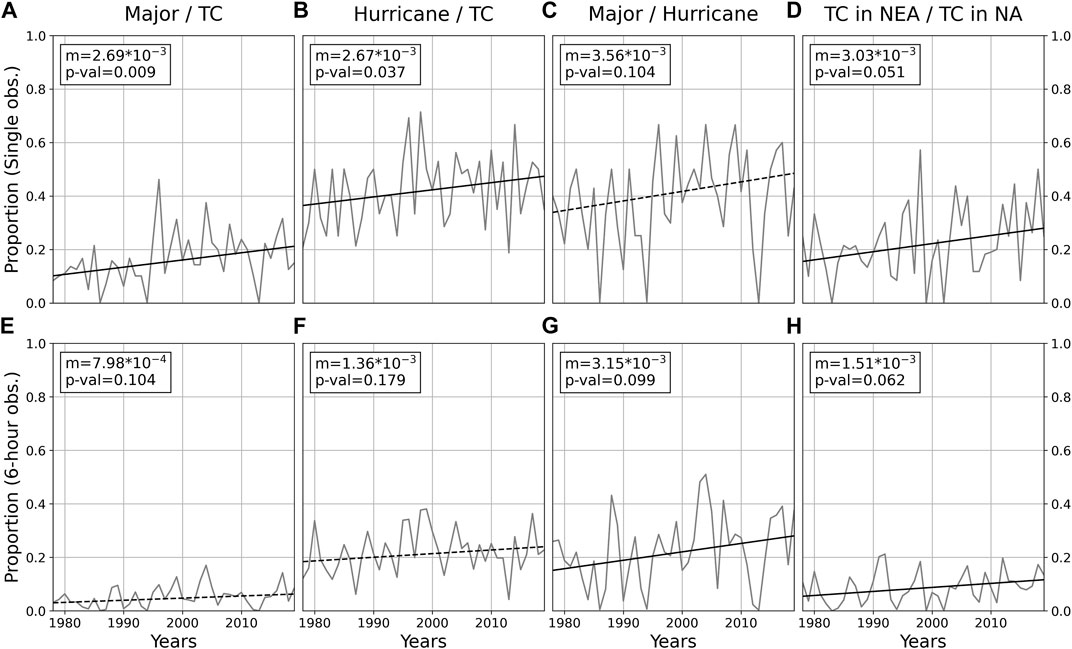
FIGURE 4. Proportion of different category groups considering single observations (A–D) and 6-h observations (E–H). First three panels refer to the NA basin while the fourth one compares the NEA to the NA region. Each subplot includes the slope (m) and the p-value. The regression line indicates significance: dashed line is non-significant to 90%. For more information regarding the methodology, the reader is referred to Methodology section.
Both major and hurricane intensity cyclones are increasing in relation to the total number of storms (Figures 4A,B). For the same ratio but now considering all 6-h observations (Figures 4E,F), the increase is however, smaller, not being significant in both cases.
The ratio between major hurricanes and hurricanes is not significant when considering individual storms, as a consequence of the large interannual variability (Figure 4C). However, considering all observations (Figure 4G) this ratio presents the highest increase of all proportions studied. This appears to support the increase in fast intensification events and the possibility that TCs hold stronger intensities for larger amounts of time, as stated previously by Knutson et al. (2019), Knutson et al. (2020) and Balaguru et al. (2018). Both Figures 4D,H show that, despite the NEA being a region that presents a much lower frequency of TC activity, their occurrence has been increasing in the past 42 years, when compared to the frequency of TCs in the wider NA basin. The overall increase in intensity is, therefore, evident, even after removing the AMO’s effect from the timeseries. Additionally, as we can see from Figure 2, that the annual variability of TC activity (either ACE or TC observations) exceeds the multidecadal one.
We have considered the 90th and the 10th percentile of annual cumulative ACE for high and low activity (Figure 2B) and access its differences for the physical variables (SST, VWS and LR) that can modulate tropical cyclone frequency and intensity. As previously stated in the introduction, high SST values is the most widely referred condition for TC development and, in the NA basin, the hurricane season from June to November is the most ideal time-period for cyclonic activity. During this time, small changes or anomalies in SST values can lead to more or less relevant hurricane seasons (Emanuel, 2003). Other important variables, tied to the state of the atmosphere, are the VWS and the LR, that dictate the storm’s structure and are therefore strongly linked to its development. To foster cyclonic activity and to facilitate its development into stronger TC the ideal VWS (LR) values should be lower (higher) than average, respectively (Paterson et al., 2005; Finocchio et al., 2016; Takemi and Yamasaki, 2020).
First of all, we evaluate the detrended average SSTA in Figure 5. From the SSTA fields corresponding to higher and lower than normal TC activity in the NA basin (Figures 5A,B) we can observe a distinct horseshoe pattern. In years with high TC activity in the NA (Figure 5A) the tropical area from 0 to 20°N, the Caribbean Sea and the western part of the Gulf of Mexico, main areas of cyclogenesis as shown in Figure 1C, along with the eastern side of the basin, present positive SSTA. Note that the years with high TC activity shown in Figure 5A, correspond to the positive AMO phase, corroborating the correlation shown in Table 2. Also, the SST spatial pattern seen in this figure coincides with the SST pattern for positive AMO years. In years of lower TC activity (Figure 5B) the pattern is inverted, with the aforementioned areas showing negative SSTA values, with exception for the Gulf of Mexico.
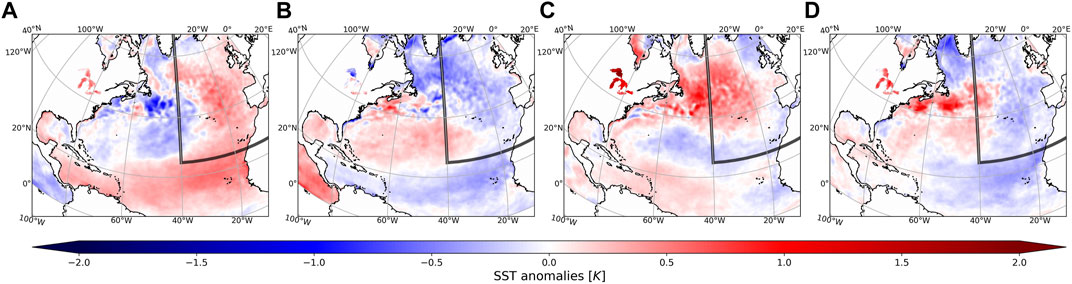
FIGURE 5. Detrended average SST anomaly (SSTA) for hurricane season years of (A) high ACE in NA (1995, 2004, 2005, 2017), (B) low ACE in NA (1982, 1983, 1991, 1994), (C) high ACE in NEA (1980, 1998, 2005, 2012) and (D) low ACE in NEA (1983, 1994, 1999, 2002), within the 1978–2019 period. High or low ACE years were defined as those years that exceeded the 90th percentile or inferior to the 10th percentile, respectively.
With respect to the NEA sector, in years with high activity in this region (Figure 5C), it is possible to identify the existence of two warm pools mostly on the western side of the Atlantic basin: a tropical band westwards of 40 W (and less intense than what was obtained for the entire NA) including the Caribbean Sea and Gulf of Mexico; and another even warmer pool northward of 35°N, extending from Newfoundland to the eastern part of the basin (Figure 5C). Counterintuitively, the region of genesis for TCs that arrive at the NEA (see Figure 1D) presents negative SSTA values in the tropical band, near the African coast. This, however, is a region that, during the summer seasons, always presents SSTs sufficiently high for the occurrence of TCs and therefore the presence of a cool pool of anomalies might not be as important, given that higher occurrences of TCs further north eastwards in the NEA could be propelled by atmospheric circulation or atmospheric ideal conditions rather than optimum oceanic conditions (McTaggart-Cowan et al., 2015). Considering the years with lower TC activity in the NEA sector, Figure 5D shows a colder tropical region, located over the area that more frequently experiences cyclogenesis of TCs that reach the region, as well as the eastern side of the basin, inside the limits of our region of interest. The rest of the tropical band, westward of 60°W, and the Gulf of Mexico as well as the sub-tropical band between 25 and 50°N and the western side of the NA basin show positive SSTAs.
The colder pool over the genesis area in Figure 5D resembles the one in Figure 5B, showing that colder SSTs contribute to lower cyclonic activity. On the other hand, from Figure 5C, warmer SSTs alone are not a predictor for cyclonic activity inside the NEA. The latter conclusion may be in agreement with the mentioned TC movement being mainly driven by atmospheric circulation. Adding to this, literature shows other atmospheric predictors that help TC maintenance are also changing in this region of the Atlantic, such as vertical wind shear or tropical moisture (Haarsma et al., 2013; Tang et al., 2020). These conclusions are coherent with previous key references (Emanuel, 2003), as it is known that ocean conditions play a major role in the genesis and intensification and not so much in guiding the translation of the TC.
Apart from SST, other atmospheric fields related with the 3-D dynamic (VWS) and vertical stability (LR) of the atmosphere may assist when comparing TC activity in the two focused regions. Figure 6 shows the VWS and LR hurricane season averaged field’s difference between high and low activity years used in Figure 5. Regarding the entirety of the NA basin (Figures 6A,C), we can observe clear patterns that support what has been discussed in the introduction. Figure 6A reveals a well-defined area in the tropical band of much lower VWS in years of high TC activity, which is known to be ideal for TC development (Paterson et al., 2005). Regarding the LR (Figure 6C), we see a distinct meridional pattern, with higher values in the main development region, near the African continent, while near North America the values are slightly lower than in lower activity hurricane years. It is, however, important to note that the changes in the absolute LR values are much lower than those seen in VWS (not shown). LR values present in the NA basin during the hurricane season are generally prone to TC development. Further north in the basin, at post-tropical latitudes, conditions are generally worse for the maintenance of a tropical system, with lower SSTs, higher VWS and lower LR (not shown).
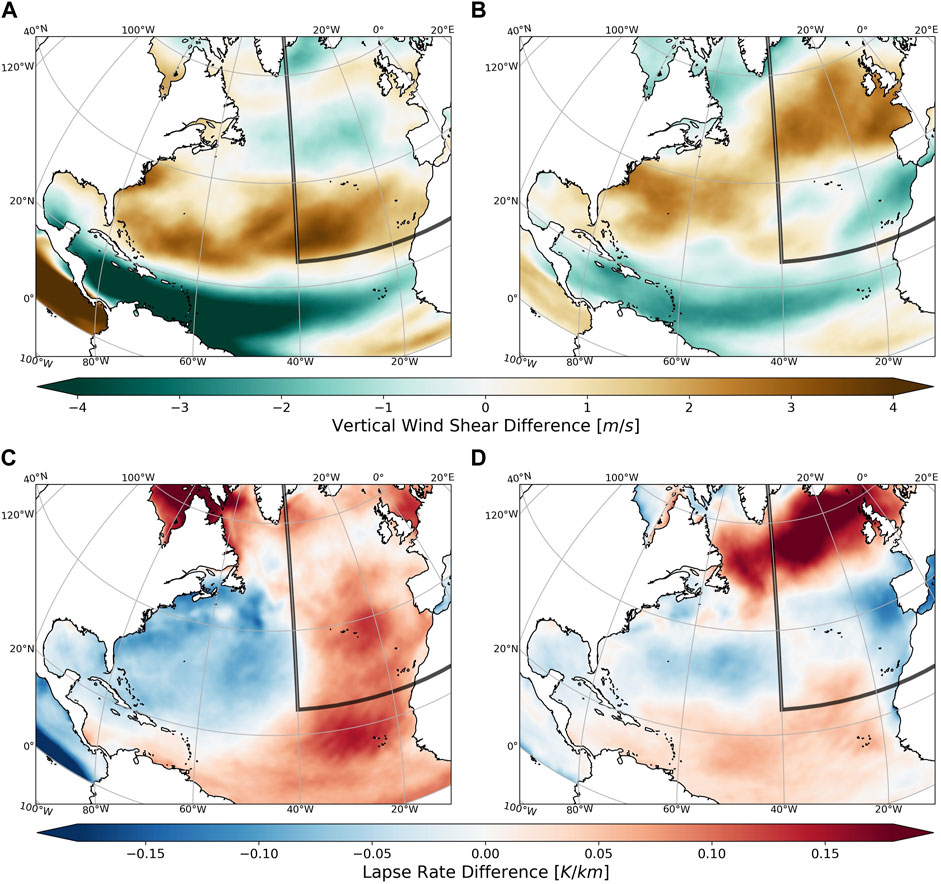
FIGURE 6. Average difference between high and low activity hurricane seasons for the (A) VWS relative to the NA basin, (B) VWS relative to the NEA sector, (C) LR relative to the NA basin, (D) LR relative to the NEA sector. The years considered for the analysis are the same as in Figure 5.
Comparing now the difference in the fields regarding the NEA sector (Figures 6B,D) similar pattern regarding the VWS can be observed, albeit much less intense, and with the region of higher VWS near Europe pushed further north. Figure 6D shows a much different pattern compared with Figure 6C, with low differences throughout the basin, and a large pool of positive values in years of high TC activity in the NEA further north. It is worth remembering that high values of LR are favourable for convective development, and higher values in a region that usually does not provide the necessary conditions for TC activity are a good indicator that the atmospheric conditions might have an important role in permitting the passage of TCs further northeast in these years.
The evolution of these variables during the present study’s period is also of prime importance since they may reveal some patterns around TC genesis and development in the NA basin. With this in mind, and to complement the previous analysis, Figure 7 shows the long-term trend (1982–2019) for the SST, VWS, and LR, with the grey shaded regions corresponding to regions outside the statistically significant level of 5%. The SST trend (Figure 7A) shows that the NA basin had a significant increase of the SSTs during the past four decades, this increase is more noticeable in the north-western part of the basin. As for the VWS, the trends observed are more spatially diverse, with the main development region in the tropical band showing a significant decrease, which facilitates TC development (Figure 7B). Further north it is possible to observe a large grey area with no significant changes that includes the mid-Atlantic border where TCs often enter the NEA sector. Closer to the Iberian Peninsula there has been an increase which would make it more difficult for TC maintenance in this area, although we have seen in Figure 6B that an area of increased VWS is pushed north during seasons of high activity in the NEA. Lastly, the LR trends (Figure 7C) show three main areas of interest regarding TC and ETC occurrence. First, it is possible to observe an increase near the Caribbean Sea and Gulf of Mexico, which favours TC development. On the other hand, the central and eastern sectors have witnessed an overall decrease of LR values. At subpolar latitudes, there has been a large and significant increase of the LR.
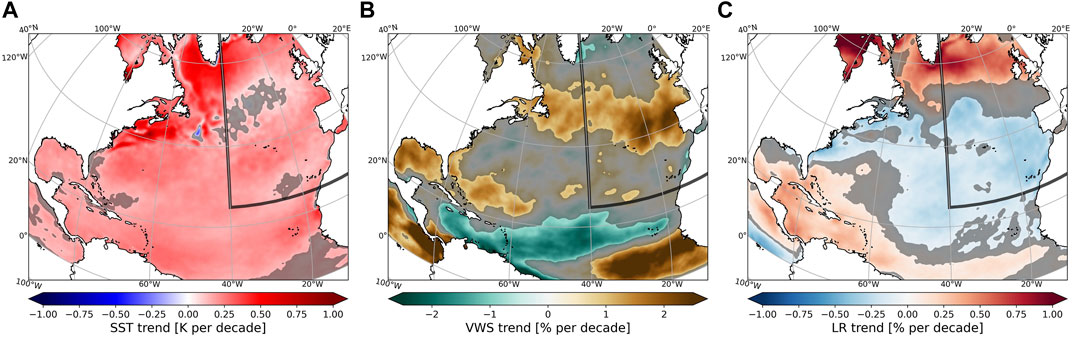
FIGURE 7. Long-term trend for (A) SST, (B) VWS, and (C) LR, for the 1982–2019 period, calculated from monotonic seasonal Mann-Kendall trend test. Grey shaded areas show regions where the trend is not significant at the 5% statistically significant level. Do note the different trends: SST is shown as K per decade while VWS and LR are shown as % per decade to ease comparison.
It is important to stress that the magnitude of these trends (as measured in percentage change per decade) can be very different. The SST show trends of 1K or higher (considering the four decades) in both the NA and NEA sectors. The LR shows considerably smaller % trends (around ∼1% for the whole study period in the middle and tropical Atlantic) while the VWS easily surpasses these values in the same area (around ∼6%). The combined effect of the observed negative VWS tendency in the tropical area with the smaller increment of LR makes this region more prone to TC cyclogenesis, clearly facilitating the development of a few extra TCs, some of which can move towards the NEA sector. This fact, coupled with the significant SST increase in all the basin is likely more relevant to influence further TCs in the NEA than the increment of VWS close to Iberia, that should hamper their further development.
The importance of possible constrains impose by the general circulation cannot be downplayed, since seasonal patterns do have an impact on TC guidance (Emanuel, 2003). In fact, from the previous analysis alone, the conclusions drawn are very much indicative that the general circulation does have a substantial impact on the guidance of TCs towards the NEA. Using the same group of years of high/low activity for both regions of interest Figure 8 shows two meteorological fields useful to describe the associated large-scale circulation close to the surface and at the upper levels of the troposphere, namely: a) The MSLP (in the form of a coloured map) and b) the U and V components of wind at 200-hPa which is a good proxy regarding the jet stream.
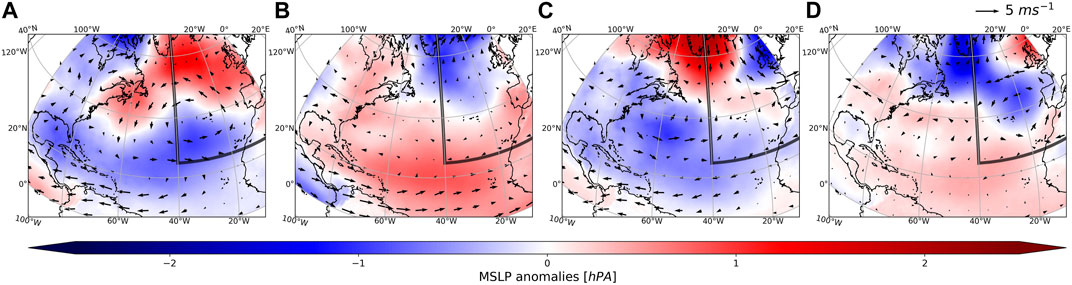
FIGURE 8. Average anomalous wind field (quivers) and anomalous MSLP (colour) for hurricane seasons of (A) high activity in NA, (B) low activity in NA, (C) high activity in NEA, and (D) low activity in NEA. The years considered for the analysis are the same as in Figure 5.
During seasons of high TC activity in the NA basin (Figure 8A), we have a general pattern of lower-than-usual MSLP in the tropical and subtropical regions, this can also be observed in years of high activity in the NEA (Figure 8C). On the other hand, years of lower activity (Figures 8B,D) present positive anomalies in the same area. The anomalous circulation at 200 hPa also shows a clear pattern in the tropics that is reversed between years of high and low activity (Figures 8A,B, respectively). The former shows a more intensive westward direction in the main development area, while the latter reveals an opposite direction of similar intensity (thus inhibiting TCs movement/development). Comparing this circulation to seasons of high activity in the NEA (Figure 8C), we see that the pattern is generally similar to what is seen in active NA years (Figure 8A) regarding the tropical area. However, in the western midlatitudes, the anomalous 200 hPa anomalous wind reveals a reinforced eastward transport and negative MSLP anomalies (Figure 8C), a pattern that is absent in the general case (Figure 8A). Therefore, the high NEA composite shows a general circulation configuration that favours (in relation to the NA composite) the movement of TCs from the Bermuda’s area toward the NEA sector. Finally, the low NEA composite (Figure 8D) shows the same positive MSLP configuration in the tropics to the one obtained for the NA composite (Figure 8B), in both cases inhibiting TCs movement into the NEA sector. However, the NEA pattern exhibits a further blocking configuration closer to Europe with the characteristic positive MSLP (Trigo et al., 2004) located west of the United Kingdom and the negative west of Iberia (Figure 8D), a pattern that is missing for the NA case (Figure 8B).
An important characteristic of the NEA is the existence of a western boundary current in the same latitudinal band, the Gulf Stream, which provides a region of strong SST gradients that might impact the synoptic development of midlatitude storms. A study by Kelly et al. (2010) points out important relations between large-scale ocean-atmosphere interactions that provide the ideal baroclinic scenario for the development of rapidly growing synoptic storms. Although not explicitly studied by these authors, this is a region that also sees large numbers of post-tropical transitions (Haarsma, 2021), therefore, the coupling of the ocean-atmosphere interactions with pre-existing synoptic systems might be very important to their evolution towards east.
Final Remarks
As stated initially the main aim of the present study was to provide a broader analysis of tropical cyclone occurrence in the North Atlantic compared to the smaller North Eastern Atlantic sector, evaluating changes in tropical cyclone activity and associated metrics in these two regions.
To evaluate the TC activity both in the NA and the NEA during the study period, the number of TC observations and the accumulated cyclonic energy (ACE) were analysed. A significant (p ≤ 0.01) correlation was found between regions regarding both the ACE and number of TCs (Figure 2). When comparing these two tropical cyclone activity measures with a proxy of the SST, the Atlantic Multidecadal Oscillation (AMO), higher significant correlations were found in the NA basin, reaching values of 0.6 (Table 2). In the NEA the corresponding correlation value is also statistically significant, although not as pronounced (R ≤ 0.51). The results appear to point to the importance of SST during the genesis process in the NA (cyclogenesis does not usually occur in the NEA), while not being as important in guiding the storms in the NEA.
In order to assess the potential frequency trends of TCs considering different categories, we applied an analysis of the different proportions of TCs over the entire period, 1978–2019, while applying congruence analysis (Thompson et al., 2000) to remove the AMO’s effect from the TC data. Most of the results (Figure 4) are significant (p < 0.1). Ratios between major hurricanes and TCs, hurricanes and TCs and major hurricanes and all hurricanes were found to be increasing both for single observation (most intense observation per storm) and for all observations (6-h time steps). These results indicate that more intense TCs (hurricanes and major hurricanes) are increasing in frequency for both NA and NEA regions. The increment in frequency for the entire NA was also found in previous assessments (e.g., Briggs, 2008; Emanuel, 2008; Kossin et al., 2020). Adding to this change in intensity, the frequency of TCs in NEA compared to the NA was also found to be increasing considering both metrics (single and all observations per storm). This should be considered as an indication of more TCs affecting the NEA and consequently, the European Continent, which is not prepared for the devastating effects of these storms.
Years of high and low TC activity were chosen in order to study the SST anomaly, VWS and LR, the former two in the form of differences between the same years. Additionally, we calculated long-term trends for each of these variables in the NA basin. The general distribution SSTA is found to be more relevant in the NA region with warm/cold pools in areas with higher density of cyclogenesis in years with higher/lower TC activity, while the atmospheric indicators, namely the VWS (Figure 6A) were identified as variables that conducted more intense tropical activity. Regarding solely the NEA, higher TC activity seems to be mainly driven by atmospheric circulation seen in Figures 6B,D, rather than optimum oceanic conditions within the region or in the main cyclogenesis region. The trends (Figure 7), reveal significant changes in all three fields, namely in the main development tropical region, with the combined effect of an increase in both SST and LR, and a decrease in VWS, which maximizes the potential for an increment in tropical cyclogenesis.
To study to potential effect of large-scale circulation and using the same group of hurricane seasons of high/low activity, we produced maps of anomalous MSLP and 200-hPa wind fields (Figure 8). From this analysis, two opposite patterns emerged regarding the whole basin, with MSLP showing negative (positive) anomalies in years of high (low) TC occurrence. This pattern is also verified in the respective years for the NEA area with some smaller changes at higher latitudes, namely an area of lower pressure at midlatitudes just west of the area defined as the NEA, in years of more activity in this region. The anomalous 200-hPa wind fields do also reveal clear patterns that are, again, reversed regarding years of low/high activity, with years of high (low) activity presenting a westward (eastward) anomaly around the tropical area. This pattern is also verified in years of high activity in the NEA, with the added difference of an intense eastward transport in the area of negative MSLP anomalies leading to the NEA.
The present work highlights the importance of TCs in the North-eastern Atlantic and their increasing risk. Although rare, these systems present great danger to coastal and near-coastal societies in western Europe, in regions that are generally less well prepared to deal with such storms. These events have been a source of interest in the past decade, with studies projecting an increase during this century associated with global warming (Haarsma et al., 2013; Baatsen et al., 2015). There is, nonetheless, a necessity to foster further research in the field, namely in the understudied relation that mid latitude atmospheric circulation and its variability have on the end-of-life (i.e., cyclolysis) phase of TCs.
Data Availability Statement
The raw data supporting the conclusions of this article will be made available by the authors, without undue reservation.
Author Contributions
ML produced the figures included in the manuscript. All authors contributed to the research, analysis and writing of the article.
Funding
Research by Miguel M. Lima was supported by the Portuguese Science Foundation (FCT) through the project PTDC/CTAAMB/28511/2017. Alexandre M. Ramos was supported by Fundação para a Ciência e Tecnologia (FCT, Portugal) and FEDER “Weather Extremes in the Euro Atlantic Region: Assessment and Impacts-WEx-Atlantic” (PTDC/CTA-MET/29233/2017, LISBOA-01-0145-FEDER-029233, NORTE-01-0145-FEDER-029233). Alexandre M. Ramos was also supported by the Scientific Employment Stimulus 2017 from Fundação para a Ciência e Tecnologia (FCT, CEECIND/00027/2017). AH was supported by the Portuguese Science Foundation (FCT) through PhD grant DFA/BD/8063/2020.
Conflict of Interest
The authors declare that the research was conducted in the absence of any commercial or financial relationships that could be construed as a potential conflict of interest.
Publisher’s Note
All claims expressed in this article are solely those of the authors and do not necessarily represent those of their affiliated organizations, or those of the publisher, the editors and the reviewers. Any product that may be evaluated in this article, or claim that may be made by its manufacturer, is not guaranteed or endorsed by the publisher.
References
Alexander, M. A., Halimeda Kilbourne, K., and Nye, J. A. (2014). Climate Variability during Warm and Cold Phases of the Atlantic Multidecadal Oscillation (AMO) 1871-2008. J. Mar. Syst. 133, 14–26. doi:10.1016/j.jmarsys.2013.07.017
Baatsen, M., Haarsma, R. J., Van Delden, A. J., and de Vries, H. (2015). Severe Autumn Storms in Future Western Europe with a Warmer Atlantic Ocean. Clim. Dyn. 45 (3‐4), 949–964. doi:10.1007/s00382-014-2329-8
Balaguru, K., Foltz, G. R., and Leung, L. R. (2018). Increasing Magnitude of hurricane Rapid Intensification in the central and Eastern Tropical Atlantic. Geophys. Res. Lett. 45 (9), 4238–4247. doi:10.1029/2018GL077597
Briggs, W. M. (2008). On the Changes in the Number and Intensity of North Atlantic Tropical Cyclones. J. Clim. 21 (6), 1387–1402. doi:10.1175/2007JCLI1871.1
Burpee, R. W. (1972). The Origin and Structure of Easterly Waves in the Lower Troposphere of North Africa. J. Atmos. Sci. 29 (1), 77–90. doi:10.1175/1520-0469(1972)029<0077:toasoe>2.0.co;2
Castellnou, M., Guiomar, N., Rego, F., and Fernandes, P. M. (2018). Fire Growth Patterns in the 2017 Mega Fire Episode of October 15, central Portugal. Adv. For. Fire Res., 447–453. doi:10.14195/978-989-26-16-506_48
Ciric, D., Nieto, R., Ramos, A., Drumond, A., and Gimeno, L. (2017). Wet Spells and Associated Moisture Sources Anomalies across Danube River basin. Water 9 (8), 615. doi:10.3390/w9080615
Eiras-Barca, J., Ramos, A. M., Pinto, J. G., Trigo, R. M., Liberato, M. L. R., and Miguez-Macho, G. (2018). The Concurrence of Atmospheric Rivers and Explosive Cyclogenesis in the North Atlantic and North Pacific Basins. Earth Syst. Dynam. 9 (1), 91–102. doi:10.5194/esd-9-91-2018
Eiras-Barca, J., Ramos, A. M., Algarra, I., Vázquez, M., Dominguez, F., Miguez-Macho, G., et al. (2021). European West Coast Atmospheric Rivers: A Scale to Characterize Strength and Impacts. Weather Clim. Extremes 31, 100305. doi:10.1016/j.wace.2021.100305
Emanuel, K. (2003). Tropical Cyclones. Annu. Rev. Earth Planet. Sci. 31 (1), 75–104. doi:10.1146/annurev.earth.31.100901.141259
Emanuel, K. (2008). The Hurricane-Climate Connection. Bull. Amer. Meteorol. Soc. 89 (5), ES10–ES20. doi:10.1175/BAMS-89-5-Emanuel
Enfield, D. B., Mestas-Nuñez, A. M., and Trimble, P. J. (2001). The Atlantic Multidecadal Oscillation and its Relation to Rainfall and River Flows in the continental U.S. Geophys. Res. Lett. 28, 2077–2080. doi:10.1029/2000GL012745
Ferreira, J. A., Liberato, M. L. R., and Ramos, A. M. (2016). On the Relationship between Atmospheric Water Vapour Transport and Extra-tropical Cyclones Development. Phys. Chem. Earth, Parts A/B/C 94, 56–65. doi:10.1016/j.pce.2016.01.001
Finocchio, P. M., Majumdar, S. J., Nolan, D. S., and Iskandarani, M. (2016). Idealized Tropical Cyclone Responses to the Height and Depth of Environmental Vertical Wind Shear. Monthly Weather Rev. 144 (6), 2155–2175. doi:10.1175/MWR-D-15-0320.1
Fotheringham, A. S., Brunsdon, C., and Charlton, M. (2000). Quantitative Geography: Perspectives on Spatial Data Analysis. London, United Kingdom: Sage.
García-Herrera, R., Garrido-Perez, J. M., Barriopedro, D., Ordóñez, C., Vicente-Serrano, S. M., Nieto, R., et al. (2019). The European 2016/17 Drought. J. Clim. 32 (11), 3169–3187. doi:10.1175/JCLI-D-18-0331.1
Haarsma, R. J., Hazeleger, W., Severijns, C., de Vries, H., Sterl, A., Bintanja, R., et al. (2013). More Hurricanes to Hit Western Europe Due to Global Warming. Geophys. Res. Lett. 40, 1783–1788. doi:10.1002/grl.50360
Haarsma, R. (2021). European Windstorm Risk of Post‐Tropical Cyclones and the Impact of Climate Change. Geophys. Res. Lett. 48 (4), e2020GL091483. doi:10.1029/2020GL091483
Hafez, Y., and Labban, A. (2018). The Role Played by Blocking System over North America on the Development of Hurricane Ophelia over North Atlantic Ocean. Gep. 06 (12), 1–20. doi:10.4236/gep.2018.612001
Hatton, B. (2017). Portugal Wildfires Kill at Least 32; 4 Dead in Spain. Chicago Tribune: Associated Press. Available at: https://www.chicagotribune.com/nation-world/ct-portugal-spain-wildfires-20171016-story.html (Accessed March 3, 2021).
Hersbach, H., Bell, B., Berrisford, P., Hirahara, S., Horányi, A., Muñoz‐Sabater, J., et al. (2020). The ERA5 Global Reanalysis. Q.J.R. Meteorol. Soc. 146 (730), 1999–2049. doi:10.1002/qj.3803
Hirsch, R. M., Slack, J. R., and Smith, R. A. (1982). Techniques of Trend Analysis for Monthly Water Quality Data. Water Resour. Res. 18 (1), 107–121. doi:10.1029/WR018i001p00107
Holton, J. R., and Hakim, G. J. (2012). An Introduction to Dynamic Meteorology. 5th ed., Vol. 88. San Diego, CA: Academic Press, Elsevier. doi:10.1119/1.1987371
Hsieh, J.-S., and Cook, K. H. (2005). Generation of African Easterly Wave Disturbances: Relationship to the African Easterly Jet. Monthly Weather Rev. 133 (5), 1311–1327. doi:10.1175/MWR2916.1
Hussain, M., and Mahmud, I. (2019). pyMannKendall: a python Package for Non Parametric Mann Kendall Family of Trend Tests. Joss 4 (39), 1556. doi:10.21105/joss.01556
Jones, P. D., Jónsson, T., and Wheeler, D. (1997). Extension to the North Atlantic Oscillation Using Early Instrumental Pressure Observations from Gibraltar and South-West Iceland. Int. J. Climatol. 17, 1433–1450. doi:10.1002/(sici)1097-0088(19971115)17:13<1433:aid-joc203>3.0.co;2-p
Jones, M. E., Bromwich, D. H., Nicolas, J. P., Carrasco, J., Plavcová, E., Zou, X., et al. (2019). Sixty Years of Widespread Warming in the Southern Middle and High Latitudes (1957-2016). J. Clim. 32 (20), 6875–6898. doi:10.1175/JCLI-D-18-0565.1
Keller, J. H., Grams, C. M., Riemer, M., Archambault, H. M., Bosart, L., Doyle, J. D., et al. (2019). The Extratropical Transition of Tropical Cyclones. Part II: Interaction with the Midlatitude Flow, Downstream Impacts, and Implications for Predictability. Monthly Weather Rev. 147 (4), 1077–1106. doi:10.1175/MWR-D-17-0329.1
Kelly, K. A., Small, R. J., Samelson, R. M., Qiu, B., Joyce, T. M., Kwon, Y.-O., et al. (2010). Western Boundary Currents and Frontal Air-Sea Interaction: Gulf Stream and Kuroshio Extension. J. Clim. 23 (21), 5644–5667. doi:10.1175/2010JCLI3346.1
Knapp, K. R., Kruk, M. C., Levinson, D. H., Diamond, H. J., and Neumann, C. J. (2010). The International Best Track Archive for Climate Stewardship (IBTrACS). Bull. Amer. Meteorol. Soc. 91 (3), 363–376. doi:10.1175/2009BAMS2755.1
Knutson, T., Camargo, S. J., Chan, J. C. L., Emanuel, K., Ho, C.-H., Kossin, J., et al. (2019). Tropical Cyclones and Climate Change Assessment: Part I: Detection and Attribution. Bull. Am. Meteorol. Soc. 100 (10), 1987–2007. doi:10.1175/BAMS-D-18-0189.1
Knutson, T., Camargo, S. J., Chan, J. C. L., Emanuel, K., Ho, C.-H., Kossin, J., et al. (2020). Tropical Cyclones and Climate Change Assessment: Part II: Projected Response to Anthropogenic Warming. Bull. Am. Meteorol. Soc. 101 (3), E303–E322. doi:10.1175/BAMS-D-18-0194.1
Kossin, J. P., Olander, T. L., and Knapp, K. R. (2013). Trend Analysis with a New Global Record of Tropical Cyclone Intensity. J. Clim. 26 (24), 9960–9976. doi:10.1175/JCLI-D-13-00262.1
Kossin, J. P., Emanuel, K. A., and Vecchi, G. A. (2014). The Poleward Migration of the Location of Tropical Cyclone Maximum Intensity. Nature 509 (7500), 349–352. doi:10.1038/nature13278
Kossin, J. P., Knapp, K. R., Olander, T. L., and Velden, C. S. (2020). Global Increase in Major Tropical Cyclone Exceedance Probability over the Past Four Decades. Proc. Natl. Acad. Sci. USA 117 (22), 11975–11980. doi:10.1073/pnas.1920849117
Lavers, D. A., and Villarini, G. (2013). The Nexus between Atmospheric Rivers and Extreme Precipitation across Europe. Geophys. Res. Lett. 40 (12), 3259–3264. doi:10.1002/grl.50636
Lima, M. M., Hurduc, A., and Trigo, R. M. (2020). Caracterização das trajetórias e da estrutura dos Ciclones Tropicais na região nordeste do Atlântico Norte. Licentiate degree final project. Lisbon, Portugal: Faculdade de Ciências da Universidade de Lisboa.
McTaggart-Cowan, R., Davies, E. L., Fairman, J. G., Galarneau, T. J., and Schultz, D. M. (2015). Revisiting the 26.5°C Sea Surface Temperature Threshold for Tropical Cyclone Development. Bull. Am. Meteorol. Soc. 96 (11), 1929–1943. doi:10.1175/BAMS-D-13-00254.1
NOAA National Centers for Environmental Information (2021). ISCCP B1 Satellite Information. Available at: https://www.ncdc.noaa.gov/gridsat/isccp-b1-info.php (Accessed March 9, 2021).
NOAA National Weather Service (2021). Tropical Definitions. Available at: https://www.weather.gov/mob/tropical_definitions (Accessed March 7, 2021).
Paterson, L. A., Hanstrum, B. N., Davidson, N. E., and Weber, H. C. (2005). Influence of Environmental Vertical Wind Shear on the Intensity of hurricane-strength Tropical Cyclones in the Australian Region. Monthly Weather Rev. 133 (12), 3644–3660. doi:10.1175/MWR3041.1
Pinto, M. M., Hurduc, A., Trigo, R. M., Trigo, I. F., and DaCamara, C. C. (2018). The Extreme Weather Conditions behind the Destructive Fires of June and October 2017 in Portugal. Adv. For. fire Res., 138–145. doi:10.14195/978-989-26-16-506_13
Ramos, A. M., Trigo, R. M., Liberato, M. L. R., and Tomé, R. (2015). Daily Precipitation Extreme Events in the Iberian Peninsula and its Association with Atmospheric Rivers*. J. Hydrometeorol. 16 (2), 579–597. doi:10.1175/JHM-D-14-0103.1
Ramsay, H. (2017). “The Global Climatology of Tropical Cyclones,” in Oxford Research Encyclopedia of Natural Hazard Science. Victoria, Austrália: Oxford University Press. doi:10.1093/acrefore/9780199389407.013.79
Rantanen, M., Räisänen, J., Sinclair, V. A., Lento, J., and Järvinen, H. (2020). The Extratropical Transition of Hurricane Ophelia (2017) as Diagnosed with a Generalized omega Equation and Vorticity Equation. Tellus A: Dyn. Meteorol. Oceanogr. 72 (1), 1–26. doi:10.1080/16000870.2020.1721215
Rayner, N. A., Parker, D. E., Horton, E. B., Folland, C. K., Alexander, L. V., Rowell, D. P., et al. (2003). Global Analyses of Sea Surface Temperature, Sea Ice, and Night Marine Air Temperature Since the Late Nineteenth Century. J. Geophys. Res. 108 (D14), 4407. doi:10.1029/2002JD002670
Reynolds, R. W., Smith, T. M., Liu, C., Chelton, D. B., Casey, K. S., and Schlax, M. G. (2007). Daily High-Resolution-Blended Analyses for Sea Surface Temperature. J. Clim. 20 (22), 5473–5496. doi:10.1175/2007JCLI1824.1
Sainsbury, E. M., Schiemann, R. K. H., Hodges, K. I., Shaffrey, L. C., Baker, A. J., and Bhatia, K. T. (2020). How Important Are Post‐Tropical Cyclones for European Windstorm Risk? Geophys. Res. Lett. 47 (18), e2020GL089853. doi:10.1029/2020GL089853
Stewart, S. R. (2018). National Hurricane Center Tropical Cyclone Report, Hurricane Ophelia. NOAA/NWS/NHC. Available at: https://www.nhc.noaa.gov/data/tcr/AL172017_Ophelia.pdf (Accessed February 21, 2021).
Stohl, A., Forster, C., and Sodemann, H. (2008). Remote Sources of Water Vapor Forming Precipitation on the Norwegian West Coast at 60°N-A Tale of Hurricanes and an Atmospheric River. J. Geophys. Res. 113 (D5), D05102. doi:10.1029/2007JD009006
Takemi, T., and Yamasaki, S. (2020). Sensitivity of the Intensity and Structure of Tropical Cyclones to Tropospheric Stability Conditions. Atmosphere 11 (4), 411. doi:10.3390/atmos11040411
Tang, B. H., Fang, J., Bentley, A., Kilroy, G., Nakano, M., Park, M.-S., et al. (2020). Recent Advances in Research on Tropical Cyclogenesis. Trop. Cyclone Res. Rev. 9 (2), 87–105. doi:10.1016/j.tcrr.2020.04.004
Thompson, D. W. J., Wallace, J. M., and Hegerl, G. C. (2000). Annular Modes in the Extratropical Circulation. Part II: Trends. J. Clim. 13 (5), 1018–1036. doi:10.1175/1520-0442(2000)013<1018:amitec>2.0.co;2
Trigo, R. M., Trigo, I. F., DaCamara, C. C., and Osborn, T. J. (2004). Climate Impact of the European winter Blocking Episodes from the NCEP/NCAR Reanalyses. Clim. Dyn. 23, 17–28. doi:10.1007/s00382-004-0410-4
Wilks, D. S. (2011). Statistical Methods in the Atmospheric Sciences, Vol. 100. San Diego, CA: Academic Press.
Keywords: tropical cyclone, Northeastern Atlantic sector, accumulated cyclone energy (ACE), atlantic multidecadal oscillation (AMO), Western Europe
Citation: Lima MM, Hurduc A, Ramos AM and Trigo RM (2021) The Increasing Frequency of Tropical Cyclones in the Northeastern Atlantic Sector. Front. Earth Sci. 9:745115. doi: 10.3389/feart.2021.745115
Received: 21 July 2021; Accepted: 18 October 2021;
Published: 05 November 2021.
Edited by:
Liguang Wu, Fudan University, ChinaReviewed by:
Haikun Zhao, Nanjing University of Information Science and Technology, ChinaYaping Zhou, University of Maryland, Baltimore, United States
Copyright © 2021 Lima, Hurduc, Ramos and Trigo. This is an open-access article distributed under the terms of the Creative Commons Attribution License (CC BY). The use, distribution or reproduction in other forums is permitted, provided the original author(s) and the copyright owner(s) are credited and that the original publication in this journal is cited, in accordance with accepted academic practice. No use, distribution or reproduction is permitted which does not comply with these terms.
*Correspondence: Alexandre M. Ramos, YW1yYW1vc0BmYy51bC5wdA==