 Wenyuan Yan
 Ming Zha
95% of researchers rate our articles as excellent or good
Learn more about the work of our research integrity team to safeguard the quality of each article we publish.
Find out more
ORIGINAL RESEARCH article
Front. Earth Sci. , 28 September 2021
Sec. Economic Geology
Volume 9 - 2021 | https://doi.org/10.3389/feart.2021.743157
This article is part of the Research Topic Advances in Multi-scale Multi-physics Geophysical Modelling and Fluid Transport in Unconventional Oil and Gas Reservoir View all 15 articles
Deformation bands are widely formed and distributed in Triassic high-porous rocks as a result of multistage tectonic movement. In this research, core observation, the rock thin section (fluorescence and casting thin section), FIB-SEM, X-ray diffraction, Raman laser, and thermometry of fluid inclusions were employed to describe the macro- and micro characteristics of deformation bands and their associated relationship with microfractures. Results indicate that the main types of deformation bands formed in the Lunnan Triassic high-porosity sandstone during the Yanshanian and Himalayan periods under different temperature and pressure conditions are compaction shear bands, and their quantity increases evidently with the distance of thrust faults. The density of deformation bands near the fault is about 15/m; porosity and permeability decrease sharply compared with those of the host rock. Microscopically, two obtained fluid-inclusion planes (FIPs) can be distinguished as 51 samples collected from 12 wells by the cutting relationship and mechanical characteristics. The homogenization temperature of associated aqueous inclusion is generally characterized by two peaks, mainly 70–80°C and 110–120°C, which were formed in the Late Yanshanian and Late Himalayan periods. The formation period of deformation bands induced by the intragranular microfractures improved the reservoir seepage capacity. In the later stage, as the interlayer and barrier with low porosity and low permeability affects the distribution of oil and gas, which is an important factor in this study of the local fluid dynamic field and high-quality reservoir evolution distribution.
In general, fault zone structures with different lithology properties caused by various tectonic movements are significantly different (Fossen et al., 2007; Fossen et al., 2018). High-porous rocks fail to develop fractures during the deformation process; instead, the mineral particles are rolled, rearranged, and even broken by tectonic stress, and then the fault zone was formed (Fossen and Bale, 2007; Schultz and Fossen, 2008; Ballas et al., 2014; Pei et al., 2015; Philit et al., 2018). Deformation band is a kind of brittle-ductile sub-seismic deformation structure that develops particularly in consolidated or semi-consolidated high-porosity rocks, which is the intuitive response of the host rock to the velocities and displacements imposed by tectonic movements, and the direction, distribution, and types of deformation bands developed by specific boundary conditions and tectonic structures have certain regularity (Fossen et al., 2007; Philit et al., 2018). Factors affecting the deformation mechanism and the resulting type of the deformation zone include not only the rock composition, grain size, shape, sorting, and initial porosity of the host rock but also the atmospheric conditions of temperature and pressure. Fossen classified deformation bands into disaggregation band, phyllosilicate band, cataclastic band, and solution-cementation band according to the combining mineralogical characteristics, cementation degree, porosity, and stress state of deformation bands (Exner et al., 2013; Soliva et al., 2013; Pei et al., 2015; Bossennec et al., 2018; Fossen et al., 2018). It can also be divided into dilatation band, shear band, and compaction band according to the type of stress; the most common type is the compaction shear band (CSB) formed by both shear and compaction (Fossen et al., 2018). Deformation band reduces permeability by up to 6 orders of magnitude compared to that of the host rock (Fisher and Knipe, 2001). The deformation band cluster is effective in sealing approximately the 140 m height of the oil column under experimental conditions (Torabi and Fossen, 2009; TorabiBraathen et al., 2013). The variability of its inherent physical properties affects the migration and preservation of hydrocarbons to a certain extent, and its distribution rules and relevant characteristics are influential scientific issues for reservoir inhomogeneity and exploration prediction in petroliferous basins.
The fluid-inclusion plane (FIP) is an assemblage of fluid inclusions capturing paleo-fluids during the healing process which are linearly arranged in the microfractures of mineral grains caused by tectonic movement (Onasch, 1990; Anders and Wiltschko, 1994; Boullier, 1999; Anders et al., 2014). Although the solubility of silica is low, rehearing of microfractures is probably rapid because surface areas for silica dissolution and precipitation are large, and bridging of microfracture walls should occur readily (Parnell et al., 2001; Laubach et al., 2010; Lander and Laubach, 2014). Notably, the mechanical direction and feature of the tectonic motion can be preserved as the quartz grains have anisotropic homogeneous mechanical properties, and the homogeneous temperature of fluid inclusions in the healing microfracture can reflect the formulation time. Thus, FIP can be used as an indicator of paleo stress direction, paleo temperature, and geochemistry in various tectonic contexts, revealing the composition and migration of paleo fluids, which is significantly necessary for the research of tectonic motion (Anders and Wiltschko, 1994; Boullier, 1999; Anders et al., 2013; Hooker et al., 2018; Miao et al., 2020).
The development of deformation bands in the study area has not been reported in previous studies. Mesozoic Triassic located at the Lunnan uplift is an important petroliferous horizon in the northeast of the Tarim Basin, characterized by large burial depths and high-quality reservoir properties, as well as multiple periods of strong tectonic movements controlling the migration and preservation of hydrocarbons. Thus, the Triassic sandstone of the Lunnan uplift provides a typical case for the developmental characteristics of deformation bands in a deep burial environment and investigation of the influence on fluid flow.
The objectives of our study include 1) investigation of the characteristics of different deformation bands formed in deep burial environments through cores 2) and determination of the formation time and geological significance of the FIP characteristics simultaneously formed with different deformation bands.
The Tarim Basin is the largest petroliferous onshore basin in China, with an area of 560,000 km2 (Yang et al., 2007; Miao et al., 2018). The Lunnan uplift is located at the central east of the Tabei uplift in the Tarim Basin, and it belongs to a secondary-order sub-tectonic unit of the Tabei uplift. The northern side is bounded by the Luntai fault, and the southern edges, by the Manjiaer depression, with an area of 4,420 km2 (Figure 1). During the evolution process from marine to onshore facies, the tectonic stress field undergoes multiple tension-extrusion transitions and led to the formation of the present large nose structure of the Lunnan uplift, which is the highest part located at the north side of the Lunan fault horst belt and dips to the southwest (Zhang et al., 2011; Zhang et al., 2012; Su et al., 2013).
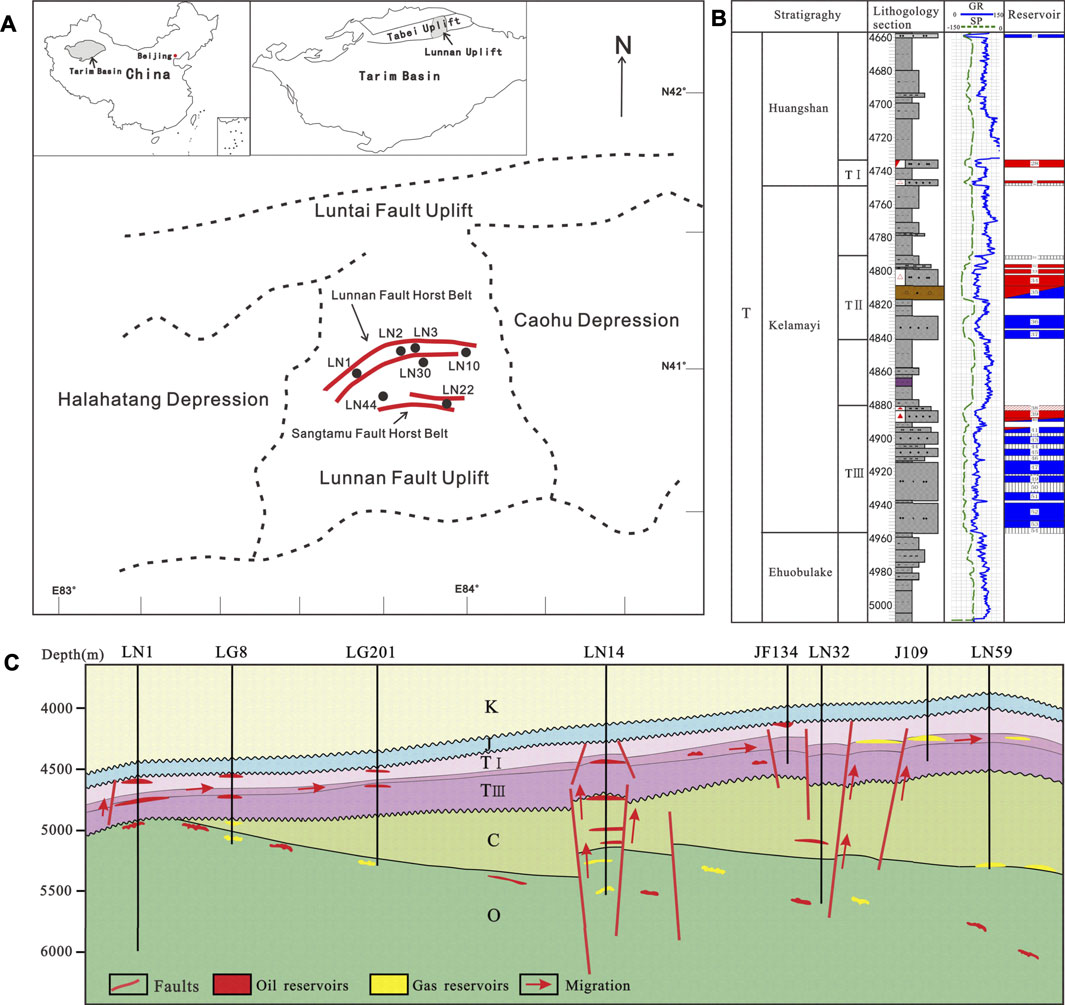
FIGURE 1. (A) Simplified structural map of the Lunnan uplift and the study area. The study area has two fault horst belts and the intermediate areas. The location of the study area is colored in gray. The regional boundary is shown as a dotted line. (B) Stratigraphy and lithology sections of LN3 well located at the Lunnan fault horst belt. (C) The oil and gas accumulation model in the study area from the northeast to southwest (Yang et al., 2007). O, Ordovician; C, Carboniferous; T, Triassic; J, Jurassic; K, Cretaceous.
The evolution of the Lunnan uplift can be divided into the Late Caledonian–Early Hercynian initial formation phase, the Late Hercynian–Indosinian definitive period with strong extrusion and lifting, the tectonic inversion period of the Late Yanshan–Early Himalayan, and the ultimately definitive period of the Himalayan (Yang et al., 2007; Zhang et al., 2011; Zhang et al., 2012).
A total of four major fault systems have developed in the Triassic (Zhang et al., 2011; Zhao et al., 2012; Su et al., 2013): the Late Caledonian NNE–SSW–oriented left strike-slip faults, in which two groups of faults in the east and west of the Lunnan area are formed; the Late Hercynian left-slip shear conjugate faults, which are mainly distributed in the south and east of Lunnan; the Indosinian–Yanshanian growth faults, which are formed in the Lunnan and Sangtamu fault horst belt; and the Late Himalayan left-slip en-echelon faults, which are mainly distributed in the south of the study area (Figure 2).
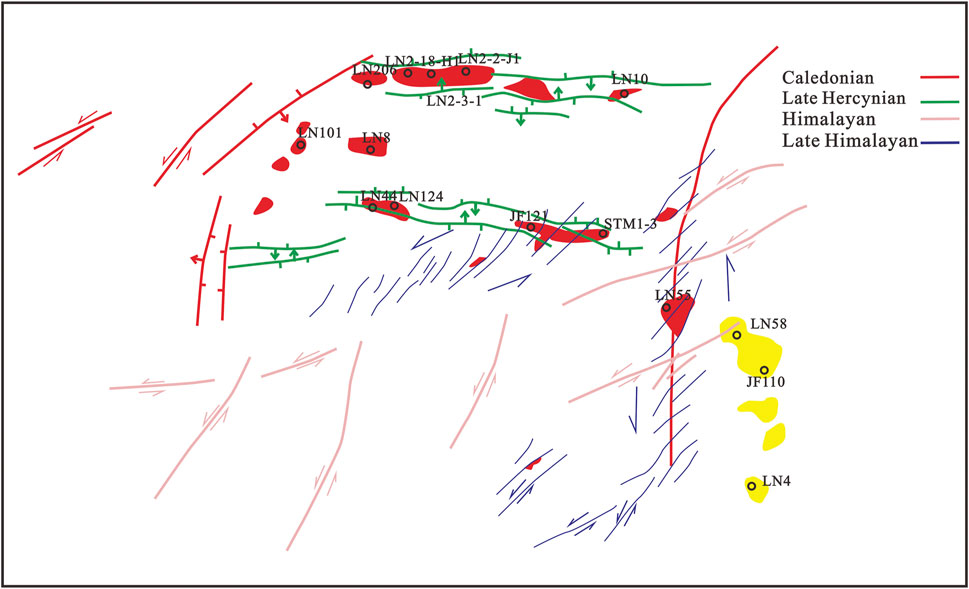
FIGURE 2. Sketch of the fault system of the Triassic strata in the study area. The principal faults formed in different periods are highlighted by different colors. The wells marked in the figure are the selected sampling wells in this research.
The Lunnan uplift of the Triassic is related to Jurassic, Carboniferous, and Ordovician regional unconformity. Sedimentary was affected by the Luntai fault growth due to the large difference of elevation between the hanging wall and the footwall (Yang et al., 2007). Several sets of fan-braided deltaic sandstones are characterized by the decreasing percent of conglomerates and water-flow energy, which are developed from the north to south along the footwall. The profile suggests three sets of fining-upward positive cycles. These sandstones are deeply buried to a depth of 4.2–5.4 km and divided into three oil groups by a development program; total thickness approaches 80∼200 m (Figure 1B). The II oil group is not developed in the southern part of the study area; the planar distribution and vertical variation of the I and III oil groups are stabilized.
The Lunnan Triassic is the most important oil and gas development layer in the Mesozoic. The early formed faults were reactivated by the late tectonic effects, and the Paleozoic oil and gas migrated through the faults and accumulated in the structural culmination of the Lunnan and Sangtamu fault horst belt and formed Mesozoic secondary oil and gas reservoirs subsequently (Sun and Li, 2004; Yang et al., 2007; Zhang et al., 2012; Sun et al., 2018). And most of the traps are anticlines with oil and gas–water boundaries and area controlled by tectonic lines, with typical features of high abundance and wide range (Figure 1C).
A total of 51 samples collected from 15 wells are investigated in this study, which are taken from a depth ranging from 4,369 m to 4,824 m located at different tectonic units and large-scale fault systems. Core physical data and the distribution of the Triassic fault in the Lunnan uplift were obtained from the China National Petroleum Tarim Oilfield E&P Research Institute. All experiments involved in this study were carried out at the Key laboratory of deep oil and gas, China University of Petroleum (East China), China.
A total of 37 samples were prepared and processed as standard 30-μm-thick thin sections filled with blue resin from representative deformation bands and host rocks. With the utilization of the polarizing microscope, textures, rock and mineral composition, diagenesis, pore types, and visual porosity can be analyzed.
X-ray diffraction (XRD) analysis of whole-rock samples and quantitative clay minerals was performed on 45 core samples to identify species and contents of major minerals and relative contents of different clay minerals.
In order to observe the characteristics of grain crushing and authigenic minerals developed in deformation bands, 37 representative core samples (from the main reservoir sandstone of key wells with hydrocarbon) were coated with gold and examined with a Hitachi S-4800 scanning electron microscope (SEM) equipped with a Bruker Quantax 100 energy-dispersive X-ray spectroscope (EDX). Cathodoluminescence (CL) analyses of 20 typical core samples, in which physical properties and oil-bearing properties significantly decreased compared with that of host rocks, were completed using an Olympus microscope equipped with a CL8200-MKS CL instrument.
As for fluid inclusions (FI), 51 core samples were selected to record the petrographic characteristics including distribution, size, shape, phase, number, and color in transmitted and ultraviolet light. Petrographic studies were carried out using a Nikon 80I dual-channel fluorescence microscope equipped with transmitted and reflected light. Fluorescence quantification of hydrocarbon inclusions during UV excitation was performed using a Maya 2000 Pro spectrometer.
The composition of fluid inclusions from 9 samples of deformation bands and host rocks on the perimeter was detected using a Renishaw RM2000 laser Raman spectrometer, and the experimental results were analyzed by Labspec5 software. A source power of 5 mW and an argon ion laser with the wavelength of 514 nm are used for the detection. The charge-coupled device area is 20 μm2, and the accumulation time is 30 s for each scan. The spectral range falls between 100 and 4,000 cm−1 for the analysis of the vapor and liquid phases.
Microthermal measurements of fluid inclusions were performed using a calibrated Linkam THMS600 cooling-heating stage. A thermal cycling method was used to determine the homogenization temperature (Th) of the fluid inclusions (Goldstein and Reynolds, 1994). When the initial heating rate was set as 15°C/min, switching to 5°C/min when the two-phase liquid vapor was homogenized to a single-phase liquid or gas, the measurement accuracy was estimated to be ±0.1°C.
The Triassic reservoirs consist of conglomerates and coarse sandstones in the Lunnan uplift, both are mainly fan-braided deltaic deposits (Figure 3B). Detrital quartz, feldspar with plagioclase, and K-feldspar are the major types of rock grains, clay, and cement in the pores, accounting for 30–45 vol%, 15–29 vol%, 29–42 vol%, less than 5 vol%, and less than 7 vol%, respectively (Figure 3D). Sandstones are of relatively low compositional maturity and low textural maturity, controlled by the provenance and sedimentary facies. The feldspar content shows an increasing trend with the increasing grain size. The grain shape ranges from angular to sub-angular. The primary intragranular pore is the main pore type. The types of grain contacts are dominated by point-contact and line-contact. According to the division standard of the diagenetic phase, the Triassic falls in the B stage of the early phase (Zhang et al., 2012).
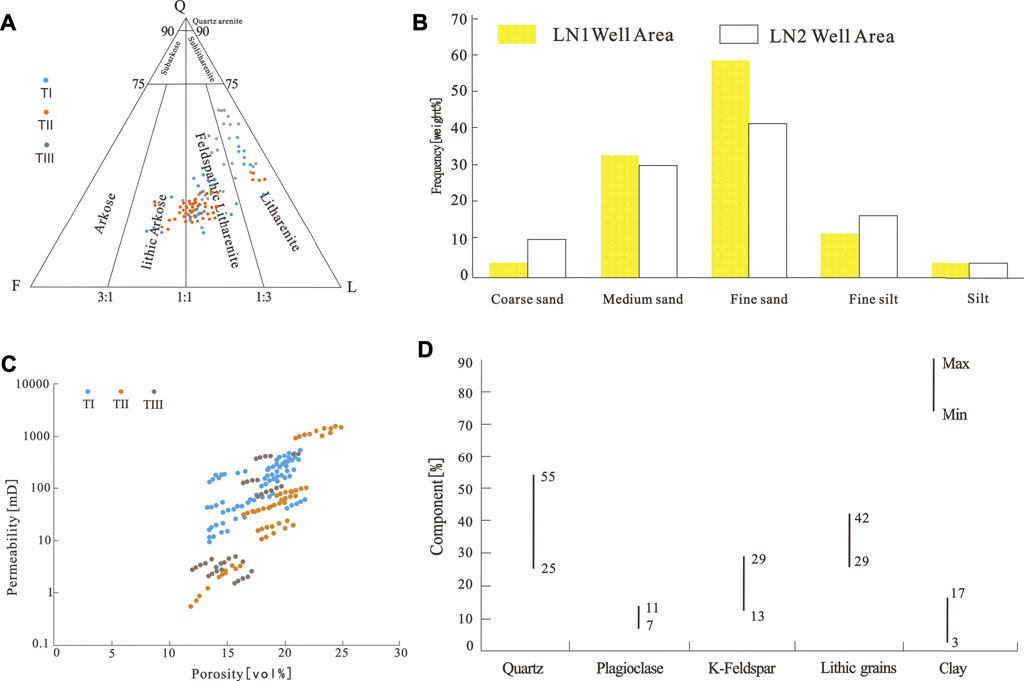
FIGURE 3. (A) Ternary diagram showing the framework grain composition of the study area sandstones, plotted on the Folk (1968) diagram (Folk and Ward, 1957). F, feldspar; L, lithic grains; Q, quartz. (B) Grain size distributions of sandstones in the Lunnan area. (C) Core-measured porosity versus core permeability cross-plots at 56 mPa (8,145 psi) net confining stress for sandstones in the Lunnan area. (D) X-ray diffraction data of sandstones in the Lunnan area.
The rock porosity and permeability under net overburden pressure in line with conventional reservoir conditions indicate that porosity ranges from 12 to 26 vol%, and permeability ranges from 0.6 to 1,000 mD (Figure 3C). The high permeability is mainly attributed to the primary intragranular pore dominating the pore systems, observed by petrography and SEM studies.
The Triassic was continuously subjected to regional intensive compression and associated shearing at different directions during the Late Hercynian, Indosinian–Yanshanian, and Himalayan Periods (Zhang et al., 2011), which acts as a prominent role in controlling the distribution of deformation bands around the tectonic setting and large-scale fault systems. Based on the core observation, deformation bands can be visually recognized in the sandstone cores of several wells, and combination patterns such as parallel and crossover can be identified. And the internal oil content is much lower than that of the host rock on either side, which in some cores shows the bands as an interbedded layer or barrier restricting oil flow and distribution in sandstone reservoirs (Figure 4B). The extension length of the deformation bands is not visible in the core observation. The width of a single band visible to the naked eye is mostly 0.15∼3 cm, and the width of a cluster of deformation bands can reach a maximum of about 5 cm. The dip angle varies from 70° to horizontal, and small faults that are formed by the inherited development of the cluster deformation band can be identified (Figure 4C). The density of the deformation bands in the reservoir near the Himalayan fault is greater than or equal to 30 bands/m, and it gradually decreases and stabilizes as the distance from the fault increases. Moreover, the vertical distribution has the greatest density on both sides of the fault damage zone, which is inversely proportional to the distance of the fault damage zone (Ballas et al., 2013; Schueller et al., 2013).
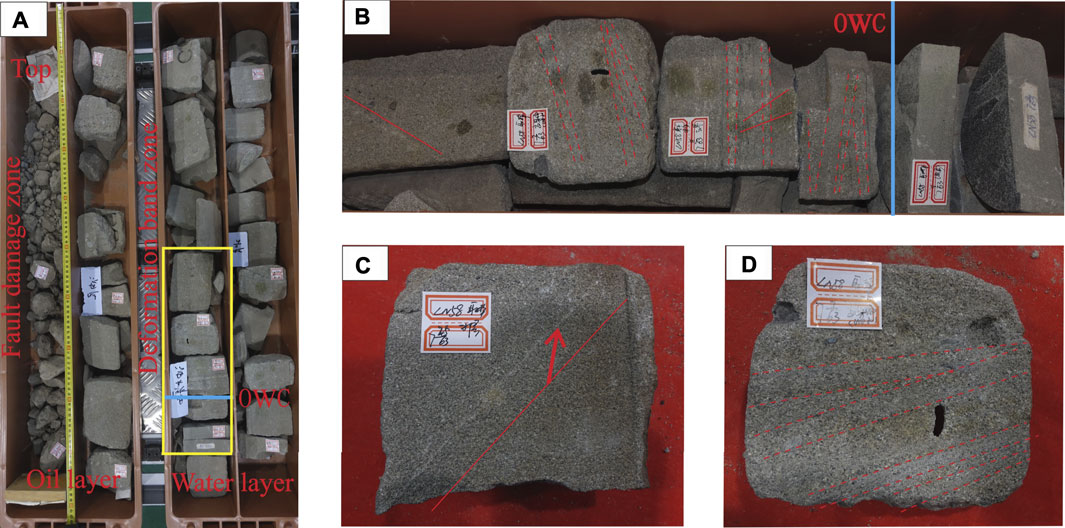
FIGURE 4. (A) Core samples collected from the T2 oil group, LN58 well (depth: 4,369–4,373 m). (B) Abundant deformation bands near the fault zone; its density increases while approaching the fault zone. The single band is indicated using a red line, and the cluster band boundary is indicated using a red dotted line. (C) Characteristic of the single band. (D) Characteristic of the cluster band.
Few disaggregation bands (Figure 5A) formed in the poorly lithified stage can be identified from a small series of thin sections, which were formed in an environment with low stress and temperature conditions, and the dominant deformation mechanism is the granular flow (Fossen et al., 2007). The internal brittle grain rotational displacement compared to the host rock has the characteristic of long axis isotropic arrangement, and the spatial distribution rule fails to be recognized.
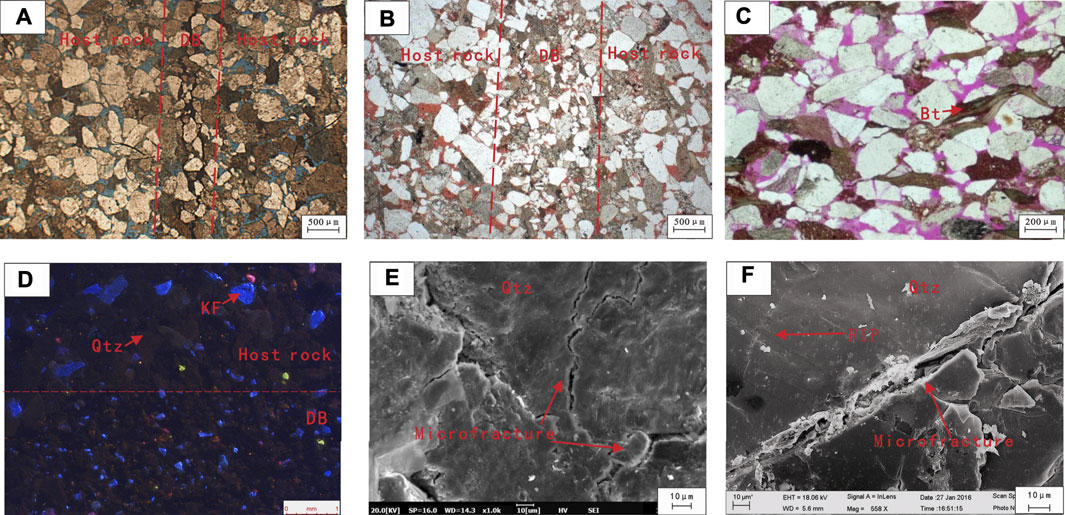
FIGURE 5. (A) The microscopic characteristics of the disaggregation band, LN2-3-1, 4,871 m, porosity is shown in blue, plane-polarized light (PPL). (B) The microscopic characteristics of the CSB, feldspar, and quartz grains in the CSB are fragmented as crush micro-breccia and block the primary pore throats, LN31, 4,745 m, PPL. (C) Deformed biotite squeezed into the primary pore, LN30, 4,714 m, PPL. (D) Comparison of the composition and grain size of the host rock and deformation band; feldspar (blue luminescent) has a higher level of fragmentation compared to quartz (non-luminescent), LN44, 4,971 m, CL. (E) “Hertzian” contact points, which is a singular contact between two grains, formed preferred orientation of fractures through grains, SEM. (F) Microfractures and quartz-filled microfractures (FIP) formed in the quartz grains, LN44, 4,971 m, SEM. Qtz, quartz, KF, K-feldspar, Bt, biotite, DB, deformation band, red dotted lines is the band boundary.
The major types of the deformation band that can be macroscopically recognized in the core are compactional shear bands (CSBs) (Figure 5B) caused by grain reorganization and cataclasis (Fossen et al., 2018). Cathodoluminescence (CL) and X-ray diffraction patterns show minimal differences in the mineralogical composition between the deformation bands and the host rock (Figure 5D). The host rock without deformation has high porosity, excellent pore–throat connectivity, intact grains, and few microfractures. Microscopic analysis of thin sections revealed that the composition of CSB contains fractured grains (intragranular microfractures), smaller grain fragments, and clay. CL revealed that the brittle grains such as quartz and feldspar within the deformation bands are highly fragmented, having diameters lower than 10% of the grain diameter of the host rock in the bands. The preferential fracture of feldspar grains relative to quartz grains can be observed (Radjai et al., 1998; Torabi and Fossen, 2009; Lommatzsch et al., 2015; Beke et al., 2019), and grain contacts are dominated by planar and concave–convex surfaces with poor sorting. Plastic grains such as biotite are deformed by extrusion stress and squeezed into the primary pore. The brittle grains on both sides adjacent to the host rock are tightly packed, with no significant change in size compared to the host rock. And the number of microfractures and quartz-filled microfractures (FIP) formed in the quartz grains during the same generation has increased significantly (Hooker et al., 2018), mainly that formed in single grains and rarely seen through multiple grain fractures (Figure 5E). The FIP type is dominated by conjugate microfractures caused by compressive shear stress. Scanning electron microscopy shows that the conjugate microfractures developed by quartz grains are flat and highly closed, and the inner walls of the microfracture are smooth and sharp (Figure 5F).
In sedimentary basins, secondary inclusions trapped by microfractures related to the tectonic action can reveal the specific tectonic stress field characteristics. The composition, temperature, and pressure information of the corresponding paleo-fluids as the microfractures sealing can be an extremely rapid process (Lander and Laubach, 2014). Microscopic observations show that microfractures of various sizes and combinations are generated within the quartz grains during the formation of the deformation bands, and they exhibit a strong preferred orientation (Figure 6). Focusing on whether the fluid inclusions contain hydrocarbons, the inclusions of secondary fluids captured by microfractures are first classified into three categories: hydrocarbon inclusions, hydrocarbon-containing inclusions, and non-hydrocarbon inclusions, and then they are subdivided according to the mineralogical sequence, cutting relationship, inclusions composition, and homogeneous temperature (Th) into two generations of conjugate FIP. Several individual fluid inclusions were measured in each FIP to assure the reliability of homogenization temperatures from each microfracture. The Th variation was generally less than 3°C.
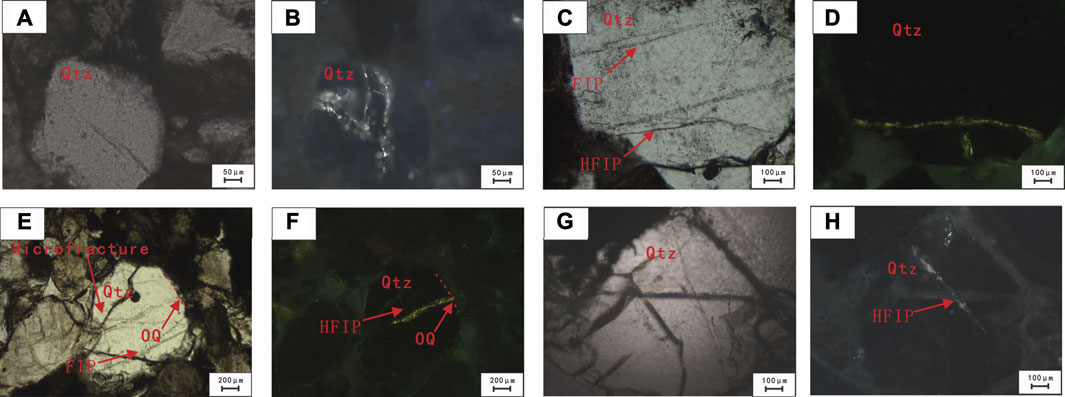
FIGURE 6. Thin section images of samples in plane-polarized light (A, C, E, G) and ultra-violet light images of the same areas (B, D, F, H). (B) X-shaped conjugated HFIP in quartz grains. (E) “Hertzian” contact points formed preferred orientation of microfractures and FIPs through the grain and quartz overgrowth which is indicated using a red dotted line. (G) Different generation microfractures and HFIP in crosscutting.
After serious analysis, the first-generation FIP is developed by compression-shear tectonic stress under brittle tectonic conditions, approximately 20–30% of the total number. Few detrital quartz grains can observe overgrowths. The longest intragranular microfractures cut across the single detrital quartz grain and stop at the dust lines of grain overgrowths, indicating that the FIP preceded the formation of the quartz grains overgrowths. The most common microfractures have straight traces marked by arrays of fluid inclusions. At room temperature, FIs trapped in microfractures contain coexisting two-phase inclusions, liquid-rich aqueous inclusions, and single-phase liquid inclusions, ranging from spherical to angular. The single-phase liquid inclusions are less than 1–3 μm in size. The two-phase liquid-rich aqueous inclusions contain 7–12 vol% vapor and are less than 4–7 μm in size. Final ice-melting temperatures were recorded in the range of approximately −2.5 to −5°C, using the experimental phase diagram to determine the salinity of the fluid, corresponding to salinities of 4–8 wt% NaCl equivalent (Bodnar, 1993), with a dominant range at approximately 5 wt% NaCl. The laser Raman spectrum indicates that the vapors of two-phase liquid-rich aqueous inclusions are mainly carbon dioxide.
The second-generation FIP is formed by compression-shear tectonic stress under brittle tectonic conditions, and the abundance is much greater than the above generation 1. The longest intragranular microfractures cut across the single detrital quartz grain and the dust lines of grain overgrowths (Anders et al., 2013) (Figure 6D). The most common microfractures show slightly curved traces marked by arrays of fluid inclusions (Figure 6E). At room temperature, microfracture-trapped FIs contain hydrocarbon inclusions and aqueous inclusions, which can be further divided into two-phase inclusions and single-phase inclusions, ranging from spherical to angular, with the fluorescence colors of near-green and green-yellow. Most of the hydrocarbon FIs have experienced oil and gas cracking and bitumen, which can be observed. The single-phase liquid inclusions are less than 1.5–3 μm in size. The two-phase inclusions contain 10 to 15 vol% vapor and less than 4–9 μm in size. Final ice-melting temperatures of aqueous inclusions were recorded in the range of approximately −5.2 to −17°C, corresponding to salinities of 8.1–20.2 wt% NaCl equivalent, with a dominant range at approximately 12 wt% NaCl. The laser Raman spectrum shows that the vapors of two-phase liquid-rich aqueous inclusions are mainly carbon dioxide, and a few inclusions contain ethane.
As most of the hydrocarbon FIs have experienced oil and gas cracking and bitumen, it can be demonstrated that its homogeneous temperature cannot represent the real formation temperature. When hydrocarbon and aqueous inclusions were captured simultaneously, the homogenous temperature of the aqueous inclusions can typically represent the capture temperature of both types of inclusions without pressure correction (Nedkvitne et al., 1993). Considering that the quartz grains in the host rock may contain inherited FIPs if tectonic movements are experienced in the source region, the FIPs can be formed during the burial compaction process of the strata (Hooker et al., 2018; O’Kane et al., 2007). However, the Triassic reservoirs experienced a complicated burial history due to the compressional uplift, and fluid inclusions with the same homogenization temperature may be trapped more than once. Hence, in this study, only the aqueous FIPs of quartz grains are consistent with the mechanical characteristics of the deformation bands.
Fluid inclusion was trapped in quartz microfractures from 51 Triassic reservoir sandstone samples. As depicted in Figure 7, the distribution of the homogenous temperatures of the coexisting oil and aqueous inclusions in all samples is analyzed and presented. In detail, microthermometric analyses indicate that all the selected fluid inclusions can homogenize to a single liquid phase. The homogenous temperature of inclusions in samples from wells LN2-3-1, LN206, and LN2-2-J1, located at the circumference of the fault horst belt, is mainly distributed in the range of 70–140°C, with the main peak range distributed in the range of 70–80°C and 110–120°C. It can be divided into two intervals, and the main peak of aqueous inclusions associated with hydrocarbon inclusions is 110–120°C and has the highest abundance. The FIP abundance in samples from well LN101 well located at the middle of the two-fault horst belt is significantly lower than that in samples in the fault horst belt circumference wells, especially the FIP abundance with the homogenous temperature of 70–80°C.
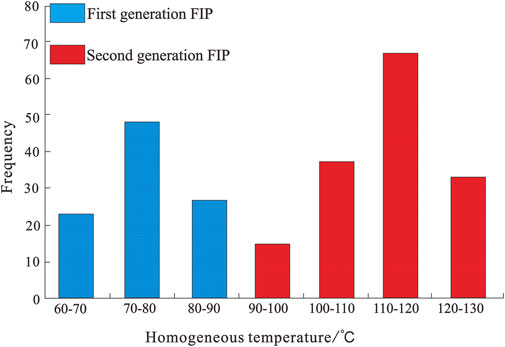
FIGURE 7. Homogenization temperature data from 12 wells, with the main peak distributed in the range of 70–80°C and 110–120°C.
The macroscopic tectonic fault features of the highly porous sandstone formation under compression-shear tectonic stress are triggered by the microscopic grain failure. And the deformation structures evolve in the direction of the maximum principal stress with the strength and nature of the tectonic movement influencing the number and distribution of the deformation bands. The evolution process from the microscopic deformation structure to the macroscopic fault structure can be revealed through multi-scale observation and investigation (Fossen and Hesthammer, 2000; Parnell et al., 2004; Parry et al., 2004; Mitchell and Faulkner, 2009; Solum et al., 2010). As cleavage cracks within brittle minerals such as feldspar and calcite are formed by external stress according to the crystallographic nature (Fossen and Hesthammer, 2000; Sun et al., 2019a), the research on microstructural petrography needs to consider not only the strength and nature of tectonic movements but also the selection of mineral grain types, microfracture characteristics, and the generation relationship of fluid inclusions.
As the host mineral, quartz grains subjected to regional stress cracking develop microfractures that are independent of mineral crystallographic properties and can be easily healed to trap fluids as fluid inclusions (Onasch, 1990; Boullier, 1999; Parnell et al., 2001). The conjugate shear FIP is composed of two crossing rupture surfaces, which are formed as a result of shear stress acting on the mineral grains exceeding the shear strength of the grains (Figure 8A) (Anders et al., 2013), and the fractured rupture surface angle is restricted by the properties of the grains and the external temperature and pressure conditions during formation. Under the brittle tectonic conditions, the direction of the acute angle bisector of the two crushing surfaces points to the direction of the maximum principal stress σ1. Under the brittle domain deformation condition, the direction of the acute angle bisector of the two crushing surfaces points to the direction of the maximum principal stress σ1 (Figure 8B) (Soliva et al., 2013; Anders et al., 2014). The microfracture abundance is proportional to the intensity of large-scale tectonic movements, and the FIP assemblages formed by more than one tectonic movement exhibit cutting relationships with each other in space.
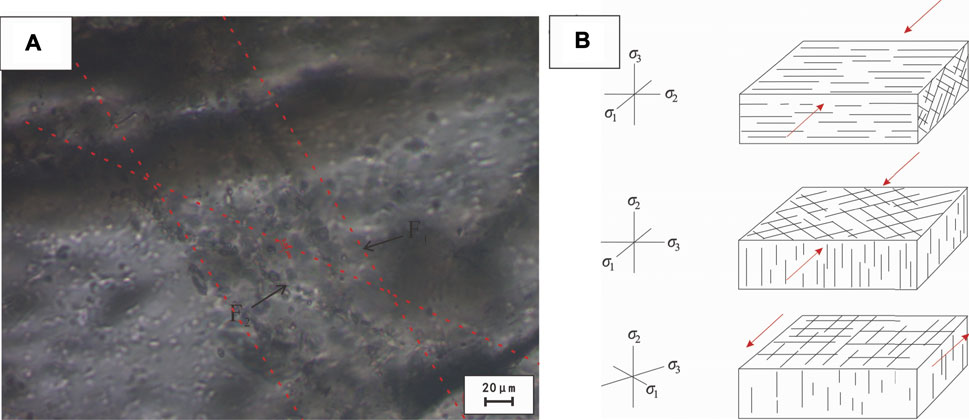
FIGURE 8. (A) Thin-section photomicrograph of the X-shaped conjugated FIP which is indicated using a red dotted line, LN2-3-1, 4,870.7 m. (B) The relation between the maximum principal stress direction and X-shaped conjugated FIP.
Microscopic analysis of thin sections revealed fragmented grains occur along the boundary between the host rock and deformation band subjected to contact stresses which have “Hertzian” contact points (Figure 9) (Radjai et al., 1998) with magnitudes much greater than the average stress. The force chains are recognized by obliquely intersecting the deformation band (Figure 9B). We interpret the preferred orientation of the microfracture and FIP is parallel to the maximum compression direction at the time of deformation (Figure 9C) (Ballas et al., 2013; Soliva et al., 2013). Permeability and porosity transient increasing during the shear-induced dilatant phase of failure may result in hydrocarbon flow into sandstone reservoirs. FIP-trapped hydrocarbon fluid inclusions crosscutting quartz grain overgrowths occur in the damage zone of the deformation band, which show that oil charging postdated the deformation band formation or performed at the same time (Parnell et al., 2004; Sun et al., 2020).
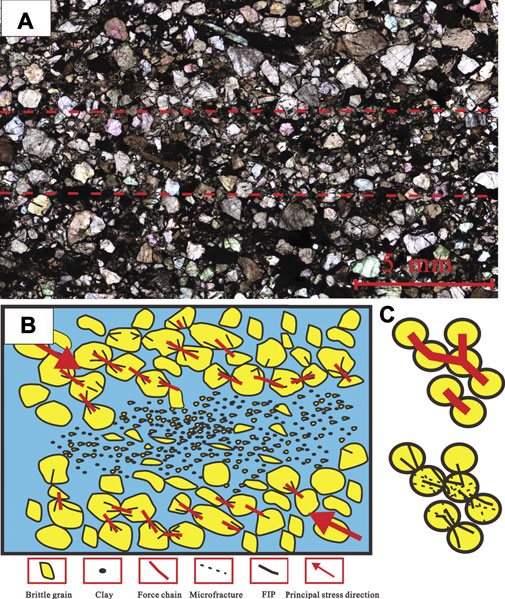
FIGURE 9. (A) Thin-section photomicrograph of microstructures from the host rock and deformation bands; the boundary is indicated using red dotted lines. (B) Illustration of the relation between maximum principal stress direction, microstructures, and the force chains. (C) The geometry of the “Hertzian” contact, FIP, and geometry of force chains as inferred from grain contact points, modified from Soliva et al. (2013).
Based on petrography and microthermometry, it is suggested that there were two generations of deformation bands formed because of the presence of two-generation conjugate FIPs observed in the CSB damage zone. The latter generation is closely related to oil and gas charging. By the integration temperature data from aqueous inclusions trapped in two generations conjugate FIPs of 51 samples collected from 12 wells with the burial plot, we can predict the time and depth of the deformation band formed.
Generally, the Triassic reservoirs are shallowly buried (0–2,000 m) within a long period and then become rapidly buried into a deeper depth (>4,500 m) in the Late Himalayan period. Integration of the minimum Th of two generation aqueous fluid inclusions in the conjugate FIPs of 51 samples, collected from 15 wells by coeval with the thermal history plot for selected wells, inferred that two-generation deformation bands are formed, respectively, in the Late Yanshan period (75∼57 Ma) and the Late Himalayan period (14∼4 Ma), coinciding with the regional uplift and extrusion.
Deformation bands in sandstone reservoirs can act as fluid pathways or barriers for fluid flow, depending on the timing relationship between the hydrocarbon charge and deformation. The mechanism of fluid sealing can be divided into the formation of cis-layer cement at the early stage (Baron et al., 2008; Exner et al., 2013; Sun et al., 2019b) and the significant decrease of physical properties compared with the host rock at the late-generation stage under the compression and torsion (Fossen et al., 2007; Solum et al., 2010). Also, the decrease of permeability by three orders of magnitude compared with that of the host rock is the threshold value for influencing fluids (Solum et al., 2010); therefore, the investigations on the influence of deformation bands on fluids not only include the present-day physical characteristics but also need to restore their dynamic evolution process, which makes them important to investigate the associated relationship between hydrocarbon charging and deformation band formation.
Two generations of shear compaction bands can be observed and identified in the Triassic reservoir by FIP characteristics and homogeneous temperature (Figure 10B). And the early-formed shear deformation bands mainly show that extrusion and crushing of brittle grains, deformation of plastic grains, and intragranular microfractures emanating from contact points are common. The microscopic conductive properties of the sandstone layer were improved, and the physical properties showed little variation compared to those of the host rock. As the extrusion intensity of the tectonic movement and the temperature of the buried environment increase, the later formed deformation bands turn into an interlayer with regular spatial combination, which can be regarded as densely spread deformation bands separating oil and water layers. Some of the deformation bands with internal quartz grains trapped hydrocarbon inclusions, implying that the oil charge would have not been affected by the deformation-related structure. In summary, the deformation bands in the research area mainly affect the physical adjustment of the hydrocarbon distribution in the later stage and the present flow properties of the reservoir and have a slight influence on the hydrocarbon migration and the charge of Triassic reservoirs.
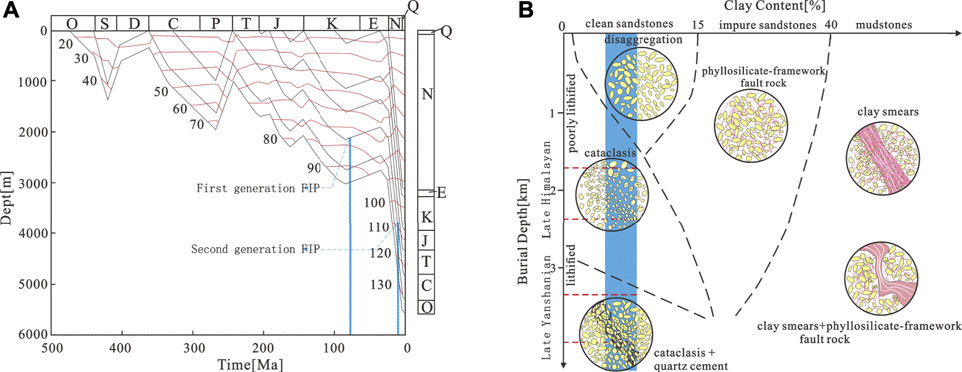
FIGURE 10. (A) Burial and thermal history and deformation band formed time for well LN10. (B) Characteristic patterns of deformation band evolution in the Lunnan uplift, modified from Fossen et al. (2007), Pei et al. (2015).
Comprehensive characteristics of deformation bands from Triassic high-porous reservoirs in the Lunnan uplift, Tarim Basin, are reported for the first time. The dominant deformation mechanisms are controlled by the strength and nature of tectonic movements. Experimental observations in terms of core samples indicate that the deformation bands can act as interbedded layers or barriers restricting the oil flow capacity. Integrated studies of fluid inclusions demonstrate the time and depth of the two-generation deformation band formed during the Yanshanian and Himalayan periods. In particular, the hydrocarbon charge has not been affected by deformation band formation because the oil-trapping quartz microfracture is cut by deformation bands. The deformation bands in the research area mainly affect hydrocarbon distribution and the present seepage flow properties of reservoirs, which may promote reservoir compartmentalization.
The raw data supporting the conclusion of this article will be made available by the authors, without undue reservation.
WY: investigation and supervision; MZ: funding acquisition and methodology; JQ: investigation; XD: draft writing and experiments; and QZ: data analysis.
The authors declare that the research was conducted in the absence of any commercial or financial relationships that could be construed as a potential conflict of interest.
All claims expressed in this article are solely those of the authors and do not necessarily represent those of their affiliated organizations, or those of the publisher, the editors, and the reviewers. Any product that may be evaluated in this article, or claim that may be made by its manufacturer, is not guaranteed or endorsed by the publisher.
Anders, M. H., Laubach, S. E., and Scholz, C. H. (2014). Microfractures: A Review. Journal Structural Geology. 69, 377–394. doi:10.1016/j.jsg.2014.05.011
Anders, M. H., Schneider, J. R., Scholz, C. H., and Losh, S. (2013). Mode I Microfracturing and Fluid Flow in Damage Zones: The Key to Distinguishing Faults from Slides. Journal Structural Geology. 48, 113–125. doi:10.1016/j.jsg.2012.11.010
Anders, M. H., and Wiltschko, D. V. (1994). Microfracturing, Paleostress and the Growth of Faults. Journal Structural Geology. 16 (6), 795–815. doi:10.1016/0191-8141(94)90146-5
Ballas, G., Soliva, R., Benedicto, A., and Sizun, J.-P. (2014). Control of Tectonic Setting and Large-Scale Faults on the Basin-Scale Distribution of Deformation Bands in Porous Sandstone (Provence, France). Journal Structural Geology. 55, 142–159. doi:10.1016/j.marpetgeo.2013.12.020
Ballas, G., Soliva, R., Sizun, J.-P., Fossen, H., Benedicto, A., and Skurtveit, E. (2013). Shear-Enhanced Compaction Bands Formed at Shallow Burial Conditions; Implications for Fluid Flow (Provence, France). Journal Structural Geology. 47, 3–15. doi:10.1016/j.jsg.2012.11.008
Baron, M., Parnell, J., Mark, D., Carr, A., Przyjalgowski, M., and Feely, M. (2008). Evolution of Hydrocarbon Migration Style in a Fractured Reservoir Deduced from Fluid Inclusion Data, Clair Field, West of Shetland, UK. Marine Petroleum Geology. 25 (2), 153–172. doi:10.1016/j.marpetgeo.2007.05.010
Beke, B., Fodor, L., Millar, L., and Petrik, A. (2019). Deformation Band Formation as a Function of Progressive Burial: Depth Calibration and Mechanism Change in the Pannonian Basin (Hungary). Marine Petroleum Geology. 105, 1–16. doi:10.1016/j.marpetgeo.2019.04.006
Bodnar, R. J. (1993). Revised Equation and Table for Determining the Freezing Point Depression of H2O-Nacl Solutions. Geochim. Cosmochim. Acta 53. doi:10.1016/0016-7037(93)90378-A
Bossennec, C., Géraud, Y., Moretti, I., Mattioni, L., and Stemmelen, D. (2018). Pore Network Properties of Sandstones in a Fault Damage Zone. Journal Structural Geology. 110, 24–44. doi:10.1016/j.jsg.2018.02.003
Boullier, A-M. (1999). Fluid Inclusions: Tectonic Indicators. Journal Structural Geology. 21 (8-9), 1229–1235. doi:10.1016/s0191-8141(99)00039-5
Exner, U., Kaiser, J., and Gier, S. (2013). Deformation Bands Evolving from Dilation to Cementation Bands in a Hydrocarbon Reservoir (Vienna Basin, Austria). Marine Petroleum Geology. 43, 504–515. doi:10.1016/j.marpetgeo.2012.10.001
Fisher, Q. J., and Knipe, R. J. (2001). The Permeability of Faults within Siliciclastic Petroleum Reservoirs of the North Sea and Norwegian Continental Shelf. Mar. Pet. Geology. 18 (10), 1063–1081. doi:10.1016/s0264-8172(01)00042-3
Folk, R. L., and Ward, W. C. (1957). Brazos River Bar [Texas]; a Study in the Significance of Grain Size Parameters. Journal Sedimentary Research. 27 (1), 3–26. doi:10.1306/74d70646-2b21-11d7-8648000102c1865d
Fossen, H., and Bale, A. (2007). Deformation Bands and Their Influence on Fluid Flow. Bulletin 91 (12), 1685–1700. doi:10.1306/07300706146
Fossen, H., and Hesthammer, J. (2000). Possible Absence of Small Faults in the Gullfaks Field, Northern North Sea: Implications for Downscaling of Faults in Some Porous Sandstones. Journal Structural Geology. 22 (7), 851–863. doi:10.1016/s0191-8141(00)00013-4
Fossen, H., Schultz, R. A., Shipton, Z. K., and Mair, K. (2007). Deformation Bands in Sandstone: A Review. Journal Geological Society. 164 (4), 755–769. doi:10.1144/0016-76492006-036
Fossen, H., Soliva, R., Ballas, G., Trzaskos, B., Cavalcante, C., and Schultz, R. A. (2018). A Review of Deformation Bands in Reservoir Sandstones: Geometries, Mechanisms and Distribution. Geol. Soc. Lond. Spec. Publications 459 (1), 9–33. doi:10.1144/sp459.4
Goldstein, R. H., and Reynolds, T. J. (1994). Systematics Of Fluid Inclusions In Diagenetic Minerals. SEPM Short Course: Systematics of Fluid Inclusions in Diagenetic Minerals. Tulsa, OK: SEPM Short Course.
Hooker, J. N., Laubach, S. E., and Marrett, R. (2018). Microfracture Spacing Distributions and the Evolution of Fracture Patterns in Sandstones. Journal Structural Geology. 108, 66–79. doi:10.1016/j.jsg.2017.04.001
Lander, R. H., and Laubach, S. E. (2014). Insights into Rates of Fracture Growth and Sealing from a Model for Quartz Cementation in Fractured Sandstones. GSA Bulletin. 127 (3-4), 516–538. doi:10.1130/b31092.1
Laubach, S. E., Eichhubl, P., Hilgers, C., and Lander, R. H. (2010). Structural Diagenesis. Journal Structural Geology. 32 (12), 1866–1872. doi:10.1016/j.jsg.2010.10.001
Lommatzsch, M., Exner, U., Gier, S., and Grasemann, B. (2015). Structural and Chemical Controls of Deformation Bands on Fluid Flow: Interplay between Cataclasis and Diagenetic Alteration. Bulletin 99 (04), 689–710. doi:10.1306/10081413162
Miao, Y., Li, X., Zhou, Y., Wu, K., Chang, Y., Xiao, Z., et al. (2018). A Dynamic Predictive Permeability Model in Coal Reservoirs: Effects of Shrinkage Behavior Caused by Water Desorption. J. Pet. Sci. Eng. 168, 533–541. doi:10.1016/j.petrol.2018.05.028
Miao, Y., Zhao, C., and Zhou, G. (2020). New Rate-Decline Forecast Approach for Low-Permeability Gas Reservoirs with Hydraulic Fracturing Treatments. J. Pet. Sci. Eng. 190, 107112. doi:10.1016/j.petrol.2020.107112
Mitchell, T. M., and Faulkner, D. R. (2009). The Nature and Origin of Off-Fault Damage Surrounding Strike-Slip Fault Zones with a Wide Range of Displacements: A Field Study from the Atacama Fault System, Northern Chile. Journal Structural Geology. 31 (8), 802–816. doi:10.1016/j.jsg.2009.05.002
Nedkvitne, T., Karlsen, D. A., Bjørlykke, K., and Larter, S. R. (1993). Relationship between Reservoir Diagenetic Evolution and Petroleum Emplacement in the Ula Field, North Sea. Marine Petroleum Geology. 10 (3), 255–270. doi:10.1016/0264-8172(93)90108-5
O'Kane, A., Onasch, C. M., and Farver, J. R. (2007). The Role of Fluids in Low Temperature, Fault-Related Deformation of Quartz Arenite. Journal Structural Geology. 29 (5), 819–836. doi:10.1016/j.jsg.2007.01.003
Onasch, C. M. (1990). Microfractures and Their Role in Deformation of a Quartz Arenite from the Central Appalachian Foreland. Journal Structural Geology. 12 (7), 883–894. doi:10.1016/0191-8141(90)90061-3
Parnell, J., Middleton, D., Honghan, C., and Hall, D. (2001). The Use of Integrated Fluid Inclusion Studies in Constraining Oil Charge History and Reservoir Compartmentation: Examples from the Jeanne d'Arc Basin, Offshore Newfoundland. Marine Petroleum Geology. 18 (5), 535–549. doi:10.1016/s0264-8172(01)00018-6
Parnell, J., Watt, G. R., Middleton, D., Kelly, J., and Baron, M. (2004). Deformation Band Control on Hydrocarbon Migration. Journal Sedimentary Research. 74 (4), 552–560. doi:10.1306/121703740552
Parry, W. T., Chan, M. A., and Beitler., B. (2004). Chemical Bleaching Indicates Episodes of Fluid Flow in Deformation Bands in Sandstone. Bulletin 88 (2), 175–191. doi:10.1306/09090303034
Pei, Y., Paton, D. A., Knipe, R. J., and Wu, K. (2015). A Review of Fault Sealing Behaviour and its Evaluation in Siliciclastic Rocks. Earth-Science Reviews 150, 121–138. doi:10.1016/j.earscirev.2015.07.011
Philit, S., Soliva, R., Castilla, R., Ballas, G., and Taillefer, A. (2018). Clusters of Cataclastic Deformation Bands in Porous Sandstones. Journal Structural Geology. 114, 235–250. doi:10.1016/j.jsg.2018.04.013
Radjai, F., Wolf, D. E., Jean, M., and Moreau, J.-J. (1998). Bimodal Character of Stress Transmission in Granular Packings. Phys. Rev. Lett. 80 (1), 61–64. doi:10.1103/physrevlett.80.61
Schueller, S., Braathen, A., Fossen, H., and Tveranger, J. (2013). Spatial Distribution of Deformation Bands in Damage Zones of Extensional Faults in Porous Sandstones: Statistical Analysis of Field Data. Journal Structural Geology. 52, 148–162. doi:10.1016/j.jsg.2013.03.013
Schultz, R. A., and Fossen, H. (2008). Terminology for Structural Discontinuities. Bulletin 92 (7), 853–867. doi:10.1306/02200807065
Soliva, R., Schultz, R. A., Ballas, G., Taboada, A., Wibberley, C., Saillet, E., et al. (2013). A Model of Strain Localization in Porous Sandstone as a Function of Tectonic Setting, Burial and Material Properties; New Insight from Provence (Southern France). Journal Structural Geology. 49, 50–63. doi:10.1016/j.jsg.2012.11.011
Solum, J. G., Brandenburg, J. P., KostenkoBrandenburg, O. V., Wilkins, S. J., and Schultz, R. A. (2010). Characterization of Deformation Bands Associated with Normal and Reverse Stress States in the Navajo Sandstone, Utah. Bulletin 94 (9), 1453–1475. doi:10.1306/01051009137
Su, J., Zhu, G., Yang, H., Dang, X., Wang, Y., Zhang, B., et al. (2013). The Research of Types and Formation Mechanism of Physical Adjustment Reservoirs: Applying the Three-Dimensional Fluorescence Quantitative to Study on the Adjustment Mechanism of Triassic Oil and Gas Reservoirs in the Lunnan Area, Tarim Basin[J]. Acta Petrologica Sinica, 2013 29 (9), 32513262.
Sun, L., and Li, Y. (2004). The Lunnan Lower Uplift:a Multiple Oil-Gas Accumulation Play in the Tarim Basin, NW China[J]. Chin. J. Geology. (02), 296–304.
Sun, Z., Li, X., Liu, W., Zhang, T., He, M., and Nasrabadi, H. (2020). Molecular Dynamics of Methane Flow Behavior through Realistic Organic Nanopores under Geologic Shale Condition: Pore Size and Kerogen Types. Chem. Eng. J. 398, 124341. doi:10.1016/j.cej.2020.124341
Sun, Z., Li, X., Shi, J., Zhang, T., Feng, D., Sun, F., et al. (2018). A Semi-analytical Model for the Relationship between Pressure and Saturation in the CBM Reservoirs. J. Nat. Gas Sci. Eng. 49, 365–375. doi:10.1016/j.jngse.2017.11.022
Sun, Z., Shi, J., Wu, K., Zhang, T., Feng, D., and Li, X. (2019). Effect of Pressure-Propagation Behavior on Production Performance: Implication for Advancing Low-Permeability Coalbed-Methane Recovery. SPE J. 24 (02), 681–697. doi:10.2118/194021-pa
Sun, Z., Wu, K., Shi, J., Zhang, T., Feng, D., Wang, S., et al. (2019). Effect of Pore Geometry on Nanoconfined Water Transport Behavior. AIChE J. 65 (8), e16613. doi:10.1002/aic.16613
Torabi, A., and Fossen, H. (2009). Spatial Variation of Microstructure and Petrophysical Properties along Deformation Bands in Reservoir Sandstones. Bulletin 93 (7), 919–938. doi:10.1306/03270908161
TorabiBraathen, A., Fossen, H., and Braathen, A. (2013). Insight into Petrophysical Properties of Deformed Sandstone Reservoirs. Bulletin 97, 619–637. doi:10.1306/10031212040
Yang, H., Hao, F., Han, J., Cai, Z., Gu, Q., et al. (2007). Fault Systems and Multiple Oil-Gas Accumulation Play of the Lunnan Lower Uplift, Tarim Basin[J]. Chin. J. Geology. (04), 795–811.
Zhang, S., Zhang, B., Yang, H., Zhu, G., Su, J., and Wang, X. (2012). Adjustment and Alteration of Hydrocarbon Reservoirs during the Late Himalayan Period, Tarim Basin, NW China[J]. Pet. Exploration Develop. 39 (06), 668–680. doi:10.1016/s1876-3804(12)60096-2
Zhang, Y., Ren, J., Yang, H., Hu, D., and L, P. (2011). Structure Features and its Evolution of Lunnan Low Uplift, the Tarim Basin[J]. Oil Gas Geology. 32 (03), 440–447.
Keywords: deformation band, FIP, homogenization temperature, fault seal, reservoir characteristics, Tarim basin
Citation: Yan W, Zha M, Qu J, Ding X and Zhang Q (2021) Deformation Bands and Associated FIP Characteristics From High-Porous Triassic Reservoirs in the Tarim Basin, NW China: A Multiscale Analysis. Front. Earth Sci. 9:743157. doi: 10.3389/feart.2021.743157
Received: 17 July 2021; Accepted: 09 August 2021;
Published: 28 September 2021.
Edited by:
Zheng Sun, China University of Mining and Technology, ChinaReviewed by:
Yisheng Liu, Chengdu University of Technology, ChinaCopyright © 2021 Yan, Zha, Qu, Ding and Zhang. This is an open-access article distributed under the terms of the Creative Commons Attribution License (CC BY). The use, distribution or reproduction in other forums is permitted, provided the original author(s) and the copyright owner(s) are credited and that the original publication in this journal is cited, in accordance with accepted academic practice. No use, distribution or reproduction is permitted which does not comply with these terms.
*Correspondence: Wenyuan Yan, MTU2NzI3OTkxQHFxLmNvbQ==
Disclaimer: All claims expressed in this article are solely those of the authors and do not necessarily represent those of their affiliated organizations, or those of the publisher, the editors and the reviewers. Any product that may be evaluated in this article or claim that may be made by its manufacturer is not guaranteed or endorsed by the publisher.
Research integrity at Frontiers
Learn more about the work of our research integrity team to safeguard the quality of each article we publish.