 Konstantinos Michailos
 N. Seth Carpenter
 György Hetényi
- 1Institute of Earth Sciences, University of Lausanne, Lausanne, Switzerland
- 2Kentucky Geological Survey, University of Kentucky, Lexington, KY, United States
- 3Department of Earth and Environmental Sciences, University of Kentucky, Lexington, KY, United States
Intermediate-depth earthquakes (>40 km) have been observed beneath the central Himalayas over decades, with little known about their nature and characteristics. Here, we apply a state-of-the-art systematic processing routine, starting from continuous waveform data, to obtain the most comprehensive high-quality earthquake catalog with a focus on the intermediate-depth seismicity beneath the central Himalayas. We construct a catalog containing 414 robust earthquake locations with depths ranging from 40 to 110 km spanning from late 2001 till mid-2003. We calculate earthquake magnitudes in a consistent way and obtain values ranging between ML 0.8 and 4.5 with a magnitude of completeness of Mc 2.4. This information allows us to study the spatiotemporal characteristics of the seismicity in great detail. Earthquakes mainly take place in a cluster, consisting of two linear segments at ca. 35° azimuth difference, situated beneath the high Himalayas in NE Nepal and adjacent S. Tibet. Seismicity there does not feature any mainshock-aftershock patterns but presents a few sequences with potential seismicity migration rates compatible with linear or diffusive migration. This result, along with previous studies in the lower Indian crust, allows interpreting these events as related to metamorphic reactions involving dehydration processes. However, given the geodynamic context, a tectonic interpretation with a dextral basement fault zone propagating beneath the Himalaya and continuing as a westward propagating tear fault would also be possible. This represents a continuous fault zone from the deep crust in S. Tibet, across the Himalaya along the Dhubri-Chungthang fault zone (DCFZ) to the Shillong plateau, which could be an inherited tectonic feature.
1 Introduction
The Himalayan orogen is a unique and complex geological structure that comprises the highest mountain chain on Earth. The kinematics of the orogen are controlled by the continental collision between the Indian and Eurasian plates (e.g., Molnar and Tapponnier, 1975). The collision began 65–50 Ma (Yin and Harrison, 2000) and has a current convergence rate of ∼2 cm/yr (Bettinelli et al., 2006). The crustal structure and geometry of the Himalayan orogen has been the focus of several international scientific experiments (INDEPTH, HIMNT, Hi-CLIMB, GANSSER, Hi-KNET; Nelson et al., 1996; Schulte-Pelkum et al., 2005; Nábělek et al., 2009; Diehl et al., 2017; Hoste-Colomer et al., 2018) along with many active and passive seismic studies (e.g., Kind et al., 2002; Wittlinger et al., 2004; Mitra et al., 2005; Priestley et al., 2008; Acton et al., 2011; Caldwell et al., 2013; Paul and Mitra, 2017; Singer, 2017) and seismic velocity model studies (Monsalve et al., 2008; Huang et al., 2009; Sheehan et al., 2014). These studies have highlighted a gradually thickening Indian crust while crossing the orogen from the South to the North (i.e., ∼40 km in the southern edges; 60–65 km beneath the high Himalayas; 75–90 km beneath southern Tibet) a feature that is generally constant along the length of the central part of the orogen (e.g., Priestley et al., 2019).
The orogen’s active tectonics have caused a number of devastating earthquakes in the past (Mugnier et al., 2013; Bilham, 2019). In addition to shallow events, which are responsible for the seismic hazard, intermediate-depth earthquakes (40–100 km) also take place beneath the orogen near the plate interface and intra-slab regions (Figure 1; Chen and Molnar, 1983; Monsalve et al., 2006; Priestley et al., 2008; Paul et al., 2015; Schulte-Pelkum et al., 2019; Wang et al., 2020). These events have been identified over decades now (e.g., Chen et al., 1981; Chen and Molnar, 1983), and their significance and location relative to the Moho contributed to advancing the understanding of the rheology of the continental lithosphere (e.g., Chen and Molnar, 1983; Maggi et al., 2000; Jackson, 2002; Jackson et al., 2004).
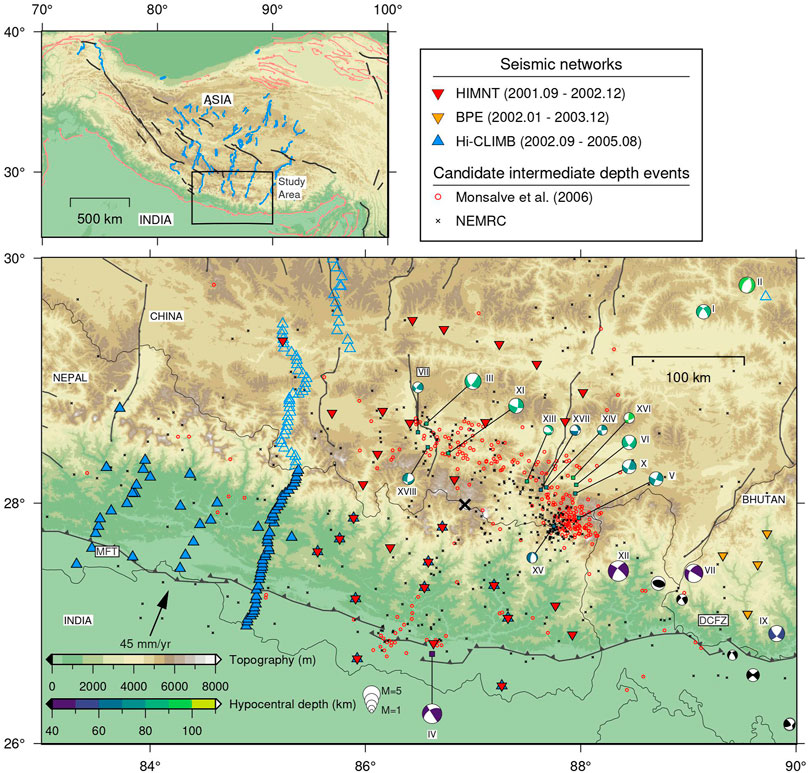
FIGURE 1. Spatial distribution of seismic networks operating in the Himalayas between late 2001 and mid-2003. Red and orange inverted triangles show the HIMNT and BPE seismic sites, respectively. Blue triangles depict Hi-CLIMB. Empty blue triangles show the locations of the Hi-CLIMB seismic sites not used in this study. Red circles and black crosses indicate the epicenters of the candidate intermediate-depth events (Details can be found in Table 1). Black cross highlights the location of Mt Everest. Active faults are shown as thick gray lines. The black arrow indicates the local velocity of Indian Plate relative to Eurasia (∼45 mm/yr; DeMets et al., 2010). MFT is the Main Frontal Thrust and DCFZ is the Dhubri-Chungthang fault zone. Focal mechanisms colored according to their hypocentral depths and noted with Roman numerals from I to XVIII (see more details in Supplementary Table S1 of the supplementary material) depict moment tensor inversions determined by the Global CMT catalog and previous studies for intermediate-depth events in the region (Chen et al., 1981; Molnar and Chen, 1983; Chen, 1988; Chen and Kao, 1996; Zhu and Helmberger, 1996; de la Torre et al., 2007; Alvizuri and Hetényi, 2019). Black focal mechanisms show shallower than 40 km depth earthquakes determined by Diehl et al. (2017) that lie along the Dhubri-Chungthang fault zone (DCFZ). Inset shows the location of the study area in the broader region. Active faults (Styron et al., 2010) are colored according to the type of faulting (red for thrust, blue for normal, and black for strike-slip faults).
Under normal conditions, and apart from subduction settings, earthquakes would not occur in continents at depths ranging between 40 and 100 km, but the unique tectonic setting of the Himalayas allows this, although the mechanisms and processes causing this intermediate-depth seismicity beneath the Himalayan orogen are debated. Eclogitization metamorphic reactions have been suggested to take place in the underthrusted continental crust (Henry et al., 1997). Within this process, water is considered to play an important role (Jackson et al., 2004; Hetényi et al., 2007). There are two models on the origin of this water: it may be introduced from an external source (Jackson et al., 2004; Priestley et al., 2008), or underthrust with the hydrous minerals of the Indian lower crust (ILC) and then dehydrate (Hetényi et al., 2007; Hetényi et al., 2021). In either case, eclogitization leads to volume reduction affecting the local stress field, and dehydration increases pore fluid pressure and hence enables brittle failure. The fluids can ultimately migrate upwards, as documented by magnetotelluric (Lemonnier et al., 1999; Unsworth et al., 2005) and seismic data (Nelson et al., 1996) along the INDEPTH transect, and via local low seismic velocity zones as observed elsewhere in southern Tibet (Hetényi et al., 2011). Alternatively, Craig et al. (2012) proposed a rheological model for the underthrusted ILC beneath Tibet and related it to seismicity distribution. They assume a cold anhydrous underthrusting ILC that is being heated up sufficiently slowly to remain seismogenic at great depths beneath the orogen, without particular emphasis on fluids.
Understanding whether metamorphic reactions play a role in intermediate-depth seismicity in the Himalayas is of particular importance as these earthquakes serve as the primary modern analogue for interpreting petrological observations of the former Caledonides orogen mid-crust, now exposed at the surface in Norway. Starting with the seminal paper of Austrheim (1987) describing fluid migration and eclogitization, there has been nearly 35 years of research involving mineralogical, petrological, rock physics, mechanical, seismic, deformation and other, complementary studies on this topic (e.g., Petley-Ragan et al., 2019; Zertani et al., 2019; Malvoisin et al., 2020; Zertani et al., 2020). The occurrence of present-day intermediate-depth seismic events in the Himalayas that can potentially help explain the petrological observations made at the surface in Norway remains an exciting prospect. For this reason, a detailed examination of the spatiotemporal evolution and characteristics of these intermediate-depth events can be helpful with testing and interpreting the mechanisms causing seismogenesis at such depths. Detailed earthquake catalogs can provide information on the properties of seismic deformation taking place and potentially pinpoint to mechanisms that drive seismogenesis (e.g., Hainzl and Ogata, 2005; Lohman and McGuire, 2007; Hauksson et al., 2019; De Barros et al., 2020; Ross et al., 2020). Such catalogs may assist with answering questions: Are these events characteristic of tectonic processes, with possibly mainshock-aftershock sequences? Are there swarms or patterns that can be interpreted as fluid migration? Answering such questions first requires determining whether or not the available data facilitate making such a distinction at present.
Previous seismicity studies in the central Himalayas have mainly focused on the shallow seismic activity (e.g., Pandey et al., 1995; Monsalve et al., 2006; Liang et al., 2008; Carpenter et al., 2010; Baillard et al., 2017; Hoste-Colomer et al., 2017; Hoste-Colomer et al., 2018) and have paid little attention to intermediate-depth events. The most comprehensive analysis of the local seismicity beneath the central Himalayas was performed by Monsalve et al. (2006). They used almost 20 months of seismic data from the Himalaya Nepal Tibet Seismic Experiment (HINMT; de la Torre and Sheehan, 2005) and observed a bimodal distribution of hypocentral depths of seismicity that included 139 intermediate-depth events. de la Torre et al. (2007) determined focal mechanism solutions for some of these intermediate-depth locations with focal depths ranging from 60 to 90 km near the Moho beneath the central Himalayas. This analysis suggested that strike-slip faulting and east-west deformation takes place near and below the Moho (see focal mechanisms in Figure 1). Alvizuri and Hetényi (2019) calculated the full seismic moment tensor for the largest and best constrained intermediate-depth event, initially detected by Monsalve et al. (2006). The moment tensor solution contained components of both double couple and tensile crack, which supports local dehydration embrittlement processes beneath the Himalayas.
Here we address the need for a detailed intermediate-depth earthquake catalog for the central Himalayas orogen especially given that the space and time evolution of these events has not been addressed so far. In particular, starting with continuous waveform data and applying modern detection and analyses methods, we present the most comprehensive intermediate-depth earthquake catalog for the central Himalayas. We examine the spatial and temporal characteristics of the seismicity and discuss possible mechanisms for seismogenesis at such depths to explain our seismological observations.
2 Materials and Methods
2.1 Seismic Data
We use continuous waveform data from three different temporary seismic networks that operated in the central Himalayas region from late 2001 till mid-2003 (HIMNT, Hi-CLIMB, BPE; de la Torre and Sheehan, 2005; Monsalve et al., 2006; Nábělek et al., 2009; Miller, 2002; Velasco et al., 2007). The composite seismic network consists of 114 seismic sites in total. We do not use all the Hi-CLIMB seismic sites and only use the initial phase of the Hi-CLIMB network that complemented and re-occupied some of the HIMNT locations. We choose not to use the later Hi-CLIMB phases as they occupied the transect sites at times that were not suitable for earthquake location purposes. Figure 1 shows the spatial distribution of the composite seismic network. The number of operational seismic sites and spatial coverage of the composite seismic network varies substantially with time. Details for all seismic networks used here can be found in the supplementary material (Supplementary Figure S1). We also include data from individual seismic site IC.LSA in Tibet. All the continuous waveform data used here are archived at the Incorporated Research Institutions for Seismology Data Management Center (IRIS–DMC). Waveform access and processing were performed using the ObsPy package in Python (Krischer et al., 2015).
2.2 Candidate Intermediate-Depth Events
As a first step, we create a list of candidate events of all the available intermediate-depth earthquakes located in the central Himalayas with hypocentral depths greater or equal to 40 km. In particular, we combine existing catalogs from the previous study of Monsalve et al. (2006) and the National Earthquake Monitoring and Research Center (NEMRC) of Nepal. This process provided us with 931 candidate intermediate-depth events (Table 1 and Figure 1). We note that this number of events potentially contains many duplicates as the two catalogs overlap in both time and space.
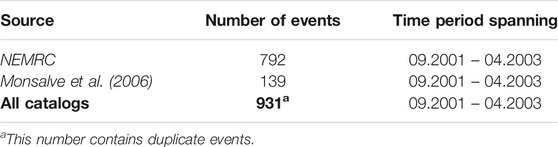
TABLE 1. Details of candidate intermediate-depth events (recorded with ≥40 km hypocentral depths) from existing catalogs. Dates are in month/year format (mm.yyyy).
2.3 Earthquake Catalog Compilation
We start with the 931 candidate events (Table 1 and Figure 1) and locate as many events as possible given the waveform data availability. We apply a semi-automatic processing and locating method, similar to the one described in Michailos et al. (2019). In brief, we cut all the available continuous waveform data within the time windows around the origin times of the candidate events (extending 10 s before and 50 s after the earthquake’s origin time). We identify and pick P and S phases within the cut waveforms, using an automatic phase picker called kpick (Rawles and Thurber, 2015). All automatic P and S wave phases are then manually inspected on unfiltered seismograms, false or uncertain picks are removed, and new manual picks are added where appropriate. This analysis yields 226 intermediate-depth events based on 2,604 P and 1,654 S high-quality phase picks, roughly half of which are manual.
By applying this analysis and not solely creating a composite earthquake catalog in which we would combine information from the two previous catalogs, we avoid inconsistencies and heterogeneities due to the use of different location methods, velocity models, seismic networks, magnitude scales. Also, by applying this processing, we ensure that the earthquake catalog is devoid of duplicate events that otherwise would be extremely hard to distinguish if we were to use only their location information (i.e., origin time and hypocenter). We note, however, that this initial catalog of 226 candidate events is based on origin times from two different catalogs that were not compiled in the same way. Therefore this initial catalog, based on analysis of segments of the waveform data, is likely to include inconsistencies due to the use of different earthquake detection methods used by the previous study Monsalve et al. (2006) and NEMRC.
To overcome this inherent heterogeneity in the catalog and obtain a broader and more complete picture of the seismicity, we analyze the continuous waveform data using a recently developed earthquake signal detector and phase picker called EQTransformer (Mousavi et al., 2020). EQTransformer uses a deep learning model trained on earthquake observations (1 million earthquake and 300,000 noise waveforms) from around the globe and synchronously performs earthquake detection and phase picking (Mousavi et al., 2020). We use this algorithm for the same period as our initial earthquake catalog and only keep the additional events. We manually inspect the additional events (in addition to the initial 221 candidate intermediate-depth events from this analysis) and refine picks where appropriate. This process provides us with 122 additional intermediate-depth earthquakes locations. In total, we locate 348 intermediate-depth events that correspond to high-quality 3,852 P, and 2,765 S phase picks. This analysis also yielded 347 robust earthquake locations with hypocenters shallower than 40 km depth, which we do not investigate further.
2.4 Matched-Filter Earthquake Detection
We use matched-filter earthquake detection techniques to extend further the intermediate-depth catalog (hypocentral depths greater than 40 km). In particular, we use EQcorrscan (Chamberlain et al., 2017), an open-source Python package for detecting repeating and near-repeating seismicity. We create templates of 6 s lengths (starting 0.2 s before P and S phases of earthquakes) recorded on at least four seismic sites. Tests with different template lengths (2, 4, 6, and 8 s) were performed and templates of 6 and 8 s gave very similar results that detected more intermediate-depth events compared to the rest. We choose 6 s over 8 s templates for computational efficiency. Templates and continuous waveforms are down-sampled to 50 Hz and bandpass filtered between 1.0 and 10.0 Hz. We discard noisy templates that have a signal-to-noise ratio (SNR) smaller than 4.0. After applying this analysis, we retain 277 templates (out of 348). We then scan these templates through the continuous data spanning late 2001 till mid-2003 and calculate network cross-correlation sums (NCCS) based on aligned single-channel cross-correlation coefficients. When NCCS exceeds 10 times the Median Absolute Deviation (MAD) of the daily NCCS, an earthquake detection is defined. This process provides us with ∼2,000 earthquake detections in total.
To ensure the robustness of these detections and remove false detections, we use an automatic location process, described in Michailos et al. (2019), that iteratively determines earthquake locations keeping the locations that meet some given quality criteria (i.e., earthquake recorded on at least four stations and an RMS value < 1 s). As a final quality control step, we manually inspect all the automatically determined locations, and we obtain 64 additional, robustly located intermediate-depth earthquake locations. This relatively low number of final earthquake locations obtained from matched filter detection is due to the sparse seismic network in northeastern Nepal where the majority of our templates are located and strict quality criteria we apply in order to maintain only the robustly located events. To check that the matched filter detection routine performed well, we manually inspected a subset of the initial ∼2,000 matched filter detections. These detections contained earthquake signals but were ultimately rejected because they were detected in fewer than four stations.
2.5 Earthquake Location
2.5.1 Initial Absolute Earthquake Locations
We calculate preliminary absolute earthquake locations using the probabilistic non-linear earthquake location algorithm, NonLinLoc (Lomax et al., 2000). We consider four different 1-D velocity models: 1) Tibet (Monsalve et al., 2006), 2) Nepal (Pandey et al., 1995; Cotte et al., 1999; Monsalve et al., 2006), 3) gradational version of the Tibet velocity model, 4) the global iasp91 velocity model (Kennett and Engdahl, 1991). We examine the effect on the hypocentral depths of the earthquakes by using these different velocity models. Overall, all four velocity models, apart from the one developed by Monsalve et al. (2006) for the Nepal region, yield similar results (see more details in supplementary material). Because the majority of the intermediate-depth earthquakes are located near southern Tibet; we choose to use the 1-D velocity model developed by Monsalve et al. (2006) for the southern Tibet region that is in agreement with receiver-function calculations (e.g., Moho depth of ∼70 km; Schulte-Pelkum et al., 2005). We use a constant VP/VS ratio of 1.77 (same value used to construct the velocity models).
We select NonLinLoc to obtain preliminary earthquake locations as 1) earthquake locations are represented as a posterior probability density function (PDF; that can be plotted as a cloud of possible locations surrounding the maximum likelihood hypocenter) which includes the effects of the location uncertainties deriving from the seismic network geometry and arrival time calculations, 2) NonLinLoc includes station elevation information for the creation of the velocity grid and the calculation of the travel times that are of great importance given the high topography of the Himalayas. We do not apply any weighting scheme on the quality of the picks, that is to say, all picks are equally weighted because all picks were manually inspected and refined. During this initial NonLinLoc run, we also calculate station corrections.
2.5.2 Final Absolute Earthquake Locations With Station Corrections
For the final absolute earthquake locations, we improve the accuracy of the arrival travel times by including station corrections (estimated during the preliminary NonLinLoc run; Supplementary Figure S6 in supplementary material). To do so, we use the equal differential-time (EDT) function, which is known to cope well with outliers in arrival travel times (Lomax, 2005). Using a method like EDT, we address issues arising from: a) the use of a 1-D velocity model for a broader region than what it was developed for (i.e., unmodeled velocity structures throughout the examined region), b) misidentifying phase picks (especially for S-wave picks), or c) uncertain absolute arrival times at specific sites due to interrupted or limited satellite communication.
The robustness of earthquake locations and the accuracy of the hypocentral depth estimates depend upon the knowledge of the crustal structures, the number and quality of the phase picks, and the network geometry (Pavlis, 1986; Havskov and Ottemöller, 2010). As a general rule, hypocentral depth errors increase near the boundaries and outside of the regions covered by the seismic networks. Keeping this in mind, we retain events with distances to the closest station smaller than the two times their hypocentral depth (mean distance to closest station 72.7 ± 32.5 km; Supplementary Figure S7 in supplementary material). We also discard events with fewer than eight total picks, events lacking at least two S-phase picks, and events that have a root mean square (RMS) larger than 1 s. Hypocentral uncertainties of absolute earthquake locations have average values of 11.4 and 14.1 km on the horizontal and vertical directions, respectively (Supplementary Figure S8 in supplementary material).
2.5.3 Relative Earthquake Locations
To refine the earthquake locations, better examine the internal seismicity structure, and to better identify any potential seismicity migration, we use double-difference earthquake location techniques. This technique leverages the high precision of differential travel time measurements and minimizes the effects of unknown velocity structures that may exist within the source-receiver ray paths (Waldhauser and Ellsworth, 2000). In particular, we use HypoDD (Waldhauser, 2001) and the 1-D velocity model of (Monsalve et al., 2006).
Of the 414 absolute earthquake locations, we are able to relocate 298 events using HypoDD. The difference in hypocentral depths between the absolute and relative earthquake locations is generally smaller than 5 km (90th percentile of 4.6 km; see Supplementary Figure S9 in the supplementary material), which is smaller than the absolute earthquake location uncertainties. We perform an uncertainty analysis, a modified bootstrapping approach (Efron and Robert, 1994; Waldhauser and Ellsworth, 2000), to assess the robustness of the final relocations, and we obtain mean values of 1.2 and 2.3 km for horizontal and vertical directions.
It has to be stressed, however, that the robustness and accuracy of these techniques are strongly dependent on the correctness of the velocity model, along with the accuracy of the absolute earthquake locations used (Michelini and Lomax, 2004). Thus double-difference methods can provide a very detailed and accurate pattern for the earthquakes within a cluster of similar events, but the overall position of the cluster remains dependent on the starting absolute earthquake locations and might not always be accurate (Wolfe, 2002; Menke and Schaff, 2004). In addition to this, the use of a 1-D velocity model over a 3-D one that is not available for the region introduces limitations in the precision of the relative earthquake locations (e.g., Matoza et al., 2013) caused by lateral variations in velocity structures. Nevertheless, we proceed with migration analysis under the assumption that the relative locations are not adversely affected by such biases.
2.6 Magnitude Estimation
We estimate local magnitudes to quantify the earthquakes’ physical size consistently using a formula calculated by Adhikari et al. (2015). The local magnitude scale formula we use here was developed for the broader Nepal region and it includes geometric spreading and elastic attenuation correction terms. We do not include station correction terms. We automatically define amplitude picks (4,410 in total) on the vertical components of seismograms (band-passed 0.3–7 Hz) in a 1-s time window starting after the S wave picks, using a utility function from the EQcorrscan Python package (Chamberlain et al., 2017). Amplitude picks are measured on synthetic Wood-Anderson seismograms on the vertical components. We use the vertical components as they have been found to be less sensitive to local amplification effects (Havskov and Ottemöller, 2010).
Using the amplitudes and the formula, we calculate magnitudes at individual seismic sites and the average value of these is kept as the earthquake’s magnitude. Because the local magnitude formula was initially developed for a different region (i.e., broader Nepal region), we examine the consistency and robustness of our magnitude estimates by comparing a sample of our magnitudes to the ones from the same earthquakes recorded by existing catalogs (NEMRC; Monsalve et al., 2006). Our local magnitude estimates are on average 0.38 ± 0.07 (95% CI) magnitude units underestimated compared to magnitude values of Monsalve et al. (2006) and NEMRC, but provide consistent estimates within our dataset, which is essential for the spatio-temporal analysis performed here (Supplementary Figure S10 of the supplementary material). In addition, we calculate the magnitude residuals, and we find no bias with hypocentral distance (Supplementary Figure S11 supplementary material).
3 Results
3.1 Spatial Distribution of Intermediate Depth Seismicity
We present 414 high-quality intermediate-depth earthquake locations beneath the central Himalayas orogen spanning from late 2001 through mid-2003. Hypocentral depths of the seismic activity range from 40 to 100 km (average focal depth of 65.8 km). Estimated local magnitudes ML range from 0.79 to 4.51. The overall spatial distribution of seismicity is similar to those observed by previous studies (e.g., Pandey et al., 1999; Monsalve et al., 2006; de la Torre et al., 2007; Velasco et al., 2007; Diehl et al., 2017).
The majority of the intermediate-depth earthquakes (248 events) are clustered in a region near southern Tibet and northeastern Nepal (box in Figure 2) with hypocentral depths generally larger than 60 km. Epicenters within this cluster of events align on a west-northwest to east-southeast oriented sub-linear structure in the vicinity of the Higher Himalayas. We refer to this cluster as “Cluster 1” hereafter. Cluster 1 is composed of two main linear features, one strikes at west-northwest to east-southeast (N ∼105°), and one strikes northwest to southeast (N ∼140°), as it can be clearly seen in the inset of Figure 2 highlighted by the cross-sections A–A′ and C–C’, respectively. The two main linear features appear not to merge at their endpoints but rather slightly to the west of the eastern end of the N ∼105° segment. The lateral termination of seismicity in Cluster 1, especially at its western edge, is considered a natural feature and not an artifact observed due to limitations of the seismic network.
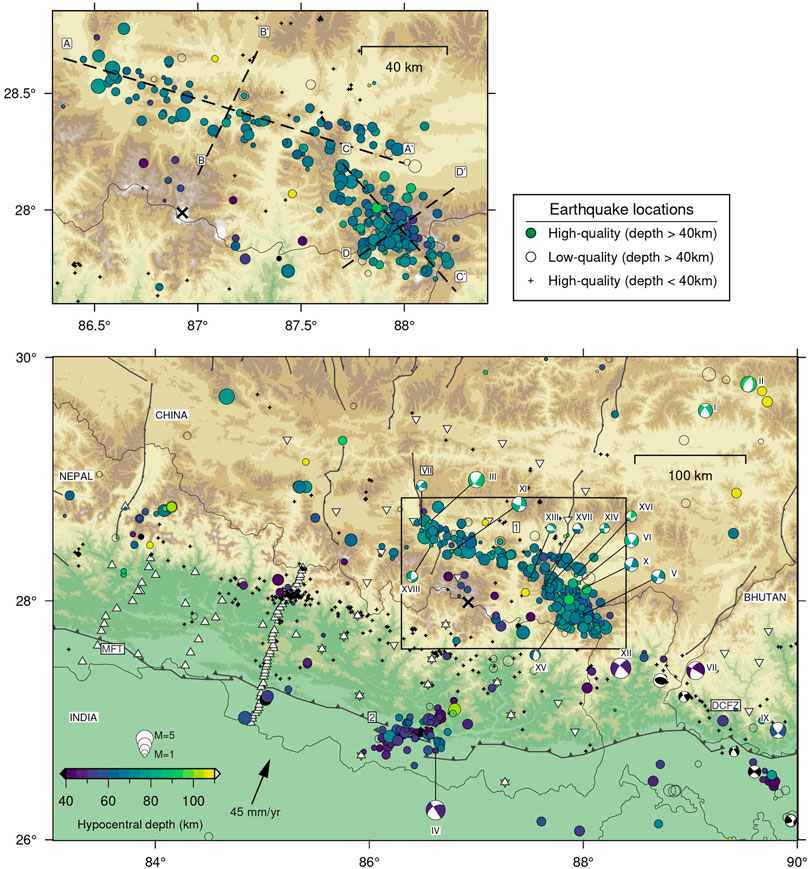
FIGURE 2. Epicenters of 414 relative and absolute earthquake locations calculated using HypoDD (Waldhauser, 2001) and NonLinLoc (Lomax et al., 2000) with a 1D velocity model (Monsalve et al., 2006). Well constrained earthquake locations (high-quality) are shown by colored circles scaled by their respective magnitudes. Poorly constrained earthquake locations (low-quality) are indicated by empty black circles. Black crosses depict the high-quality shallow seismicity located in this study. The large black cross depicts the location of Mount Everest. MFT is the Main Frontal Thrust and DCFZ is the Dhubri-Chungthang fault zone. Framed numbers 1 and 2 show the seismicity clusters described in the text. Focal mechanisms are the same as in Figure 1. Inset shows the expanded view of the region marked by the box, focusing on Cluster 1. Black dashed lines with capital letters indicate cross-sections shown in Figures 3, 4.
The hypocentral distribution of seismicity in Cluster 1 is generally uniform, with a mean value of 68.7 km. Figure 3 depicts the hypocentral depths along the profiles highlighted in the inset of Figure 2. Seismicity depths are generally constant along the length of the profile A–A′ ranging from 58 to 78 km within their respective hypocentral errors. Seismic deformation occurs within a ∼150 km long and ∼35 km wide (across strike) zone (profile B–B′). In the southeastern section of Cluster 1 (Figure 4), depths range mostly between 60 and 75 km within uncertainties. Seismic deformation there takes place in a narrower zone compared to profile A–A’ (∼60 km long and ∼30 km wide zone) and seismicity rates are higher here compared to near A–A′ profile. A significant number of events along C–C′ are clustered near the 70 km depth velocity model layer boundary, which represents the Moho, as distance to closest station increases from C to C’. This location artifact is due to the velocity jump in the 1D velocity model we use here that causes discontinuities in the travel times (e.g., Havskov and Ottemöller, 2010). For more details on this, refer to the Supplementary Section 1.2.
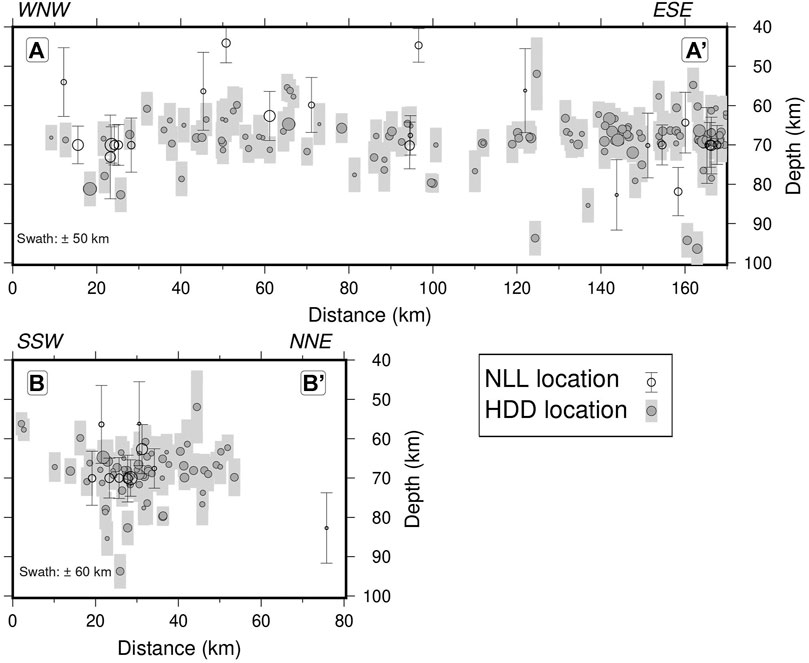
FIGURE 3. Vertical cross-sections of earthquake hypocenters. Dark gray and black open circles depict the relative and absolute earthquake locations’ hypocenters. Earthquake location uncertainties are shown as vertical black and light gray bars, respectively. The locations of cross-sections A–A′ are marked in Figure 2. Earthquakes within 50 and 60 km on either side of the cross-sections are shown. Note that cross-sections are slightly vertically exaggerated and the size of the symbols are scaled to their respective magnitudes.
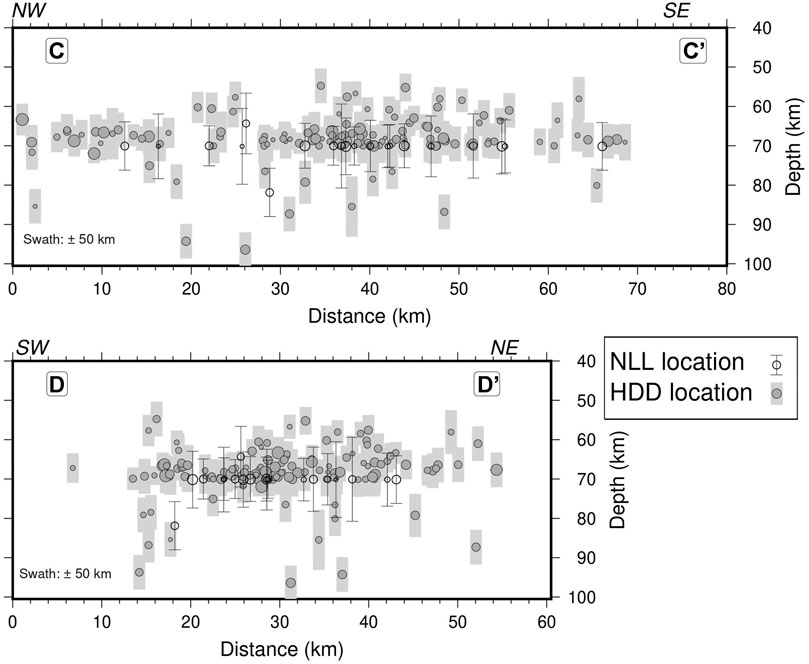
FIGURE 4. Same as Figure 3 but for cross-sections C–C′ and D–D’. Earthquakes within 50 km on either side of the cross-sections are shown. Note that cross-sections are vertically exaggerated and the size of the symbols are scaled to their respective magnitudes.
We also observe another cluster of intermediate-depth earthquakes (depths generally >35 km) located in southeastern Nepal (Cluster 2; Figure 2). This cluster forms a east-northeast to west-southwest structure and is very close to the hypocenter of the lower crustal M 6.5 1988 Udayapur earthquake (Chen and Kao, 1996). Previous studies (e.g., Pandey et al., 1999) that used a different dataset than the one presented here, suggested that Cluster 2 seismicity there might be related to the aftershock sequence of the M6.5 Udayapur earthquake. Given the time span of our dataset here (19 months), we can not conclude whether Cluster 2 is part of the aftershock sequence or not, as there is no noticeable decrease in the frequency or magnitudes of the events with time (see Figure 5). Shallow seismicity (<40 km; Figure 2) delineates the seismicity at the mid-crustal ramp on the southern front of High-Himalaya, as well as the Dhubri-Chungthang fault zone (DCFZ) across southwestern Bhutan previously highlighted by (Velasco et al., 2007; Diehl et al., 2017).
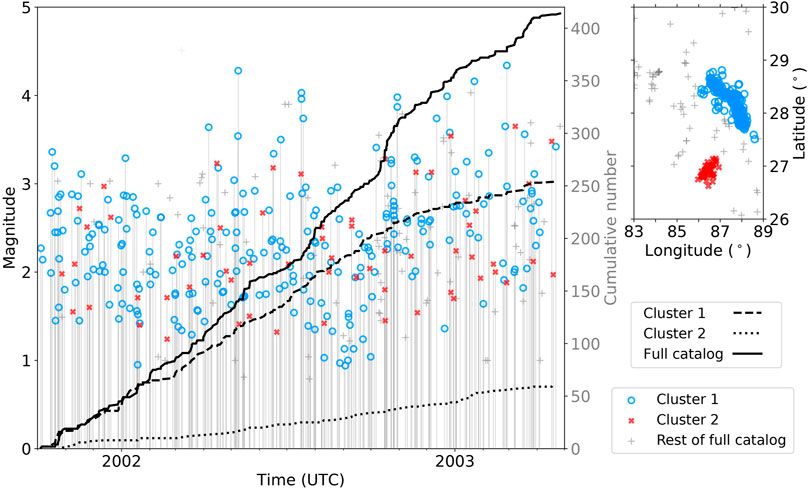
FIGURE 5. Local magnitudes of earthquakes versus time for Cluster 1 (blue circle), Cluster 2 (red cross) and the remaining events of the full catalog (gray cross), are shown in the left axis. Solid, dashed and dotted black lines represent the cumulative number of events versus time for the full catalog, Cluster 1 and Cluster 2, respectively (right axis). Inset depicts the spatial distribution of the events.
3.2 Spatio-Temporal Evolution
In the following sections we examine a number of different properties of the seismicity: rate of seismicity, inter-event times, magnitude frequency distributions, and potential spatial migration rates.
3.2.1 Rate of Seismicity and Inter-event Times
Seismic activity near southern Tibet and Northeastern Nepal (Cluster 1) is remarkably continuous throughout the examined period (Supplementary Figure S13 in supplementary material). Figure 5 shows the distribution of magnitudes with time for the two defined clusters. The magnitude detection threshold is ∼1.4 for the examined time period (lower detection threshold of around 1.0 in mid-2002 for Cluster 1). Cluster 1 contains several M > 4.0 events that do not appear to have any clear aftershocks. That is to say, magnitudes between the largest event and the next largest event is very small (e.g., 0.2 magnitude units). In contrast, for a mainshock-aftershock sequence, the magnitude difference between the mainshock event and the largest aftershock is usually 1.2 magnitude units (Båth, 1965). Cluster 2 has a steady occurrence rate for events with magnitudes ranging from 3.0 to 3.5.
The rate of seismic activity is relatively constant for the full catalog with sporadic slight accelerations (Figure 5). We also observe a change in seismicity rates with the evolution of the seismic network that coincides with the start of operation of the Hi-CLIMB network and the occurrence of several events in western Nepal (October 2002; Figure 5). Cluster 1 exhibits the high and constant rates until mid-late October 2002 (end of operation for HIMNT network) and later on, seismicity rates decrease significantly. Cluster 2, near Udayapur, has a relatively constant detection threshold and remarkably low seismicity rates, suggesting a balance in stress release.
The time between successive events, inter-event times, for the two clusters is shown in Figure 6. The majority of events from Cluster 1 exhibit relatively large inter-event times of between a day and 10 days. Cluster 2 has the largest inter-events times (>2 days on average). The lowest inter-event times (between a couple of hours to 15 min) are presented by events outside the two defined clusters (gray crosses in October 2002; Figure 6). These events are located in the western Nepal region. There is no apparent indication of mainshock-aftershock sequence that would be highlighted by a series of short inter-event times.
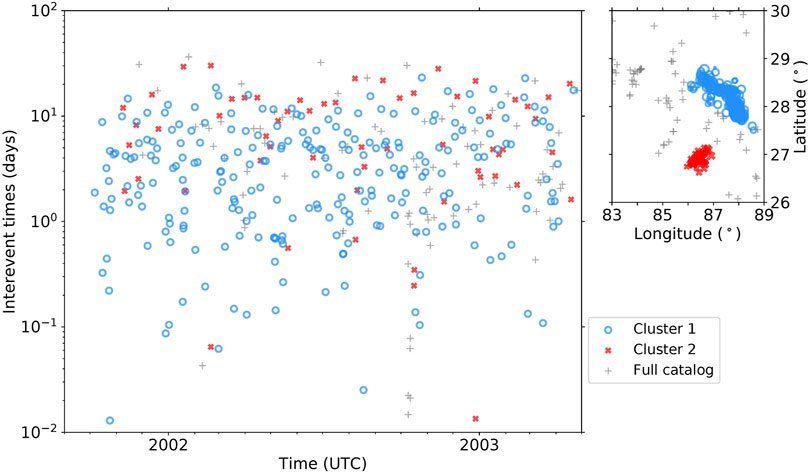
FIGURE 6. Inter-event times for the intermediate-depth earthquakes (>40 km) that occurred between 2001 and 2003 for Cluster 1 (blue circle), Cluster 2 (red cross) and the rest of the events in the catalog (gray cross). Inset depicts the spatial distribution of the events.
3.2.2 Magnitude Frequency Distribution
Gutenberg-Richter distributions are generally used to describe the relative numbers of small and large earthquakes (Gutenberg and Richter, 1942). Local magnitude estimates in the full catalog range from 0.79 to 4.51 with a magnitude of completeness of Mc = 2.4. We calculate Mc with the maximum curvature method (Wiemer and Wyss, 2000), applying 0.4 magnitude units upward correction similar to Woessner and Wiemer (2005). We calculate b-values by fitting the cumulative density function with a power-law above the magnitude of completeness and obtain a b-value of 0.91 ± 0.004 for the full catalog (Figure 7). Cluster 1 has a larger magnitude of completeness (i.e., Mc = 2.85) and a slightly higher b-value (0.96). Clusters 2 has a relatively small number of events (61) to obtain a robust b-value estimate.
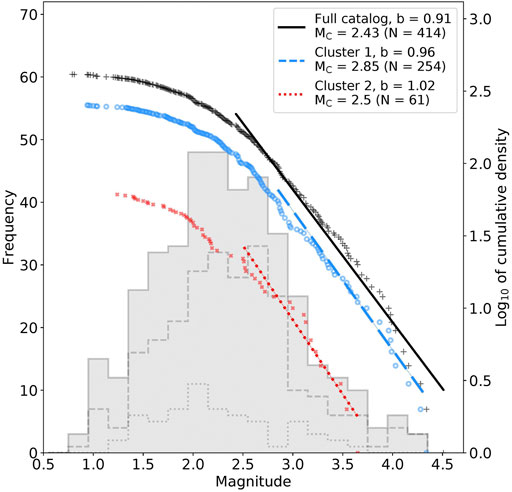
FIGURE 7. Magnitude frequency distribution of earthquakes for full catalog, Cluster 1, and Cluster 2. Left axis (Frequency) shows the number of earthquakes in each magnitude bin. The magnitude bin used here is 0.2 magnitude units. Right axis (logarithm of cumulative density) depicts the cumulative number of earthquakes of magnitude ML and higher. The magnitude of completeness is calculated using the maximum curvature method (Wiemer and Wyss, 2000) applying 0.4 magnitude units upward correction. The b-values are calculated by fitting the cumulative density function with a power-law above a magnitude threshold.
3.2.3 Seismicity Migration Rates
We seek to identify any potential seismicity migration pattern focusing on Cluster 1 that lies beneath and North of the high Himalayas and Mount Everest. Spatial or temporal seismicity migrations generally occur within swarm sequences and not within mainshock-aftershock sequences (e.g., Vidale and Shearer, 2006; Fischer and Hainzl, 2021). Seismicity migrations can be used as proxies for pinpointing potential mechanisms as drivers for seismogenesis (e.g., Shapiro et al., 1997; Lohman and McGuire, 2007; De Barros et al., 2020).
We visually examine the earthquake’s occurrence time versus the distance along strike and perpendicular to cross-section A–A′ from Figure 2 to identify any potential patterns. Figure 8 depicts the evolution of seismicity in time and space within cross-section A–A’. Data points are color-coded according to the along-strike distance, by doing so we ensure that any observed perpendicular to the strike pattern occurs in the same place and not far away from each other. We observe a sequence of 5–6 events that could potentially be characterized as seismicity migration (i.e., the sequence on November 17, 2001 in Figure 8 highlighted by a black arrow). We do the same for cross-section C–C’ (Figure 9) and do not observe any clear example of a sequence of events that stand out with a similar number of events.
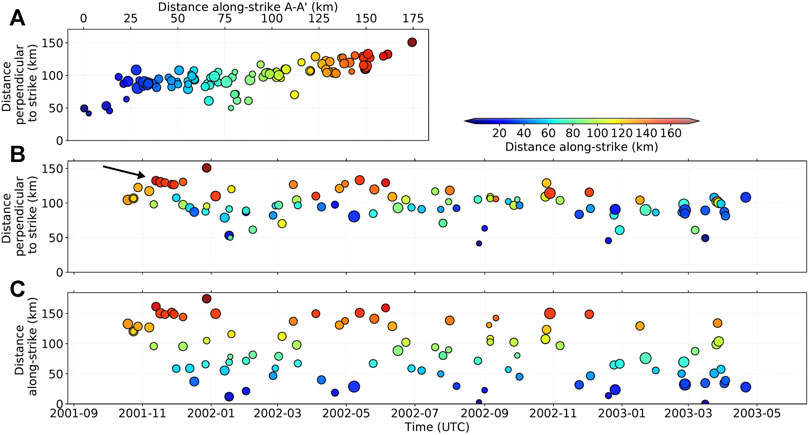
FIGURE 8. Graph visualizing the space and time evolution of the hypoDD relocated seismicity along strike and perpendicular to Cluster 1. Circles are colored according to the distance along strike of cross-section A–A’. (A) Rotated map view of seismicity along cross-section A–A’ (strike) and B–B’ (perpendicular to strike). (B) Distance perpendicular to strike vs. time. (C) Distance along strike vs. time. Figure format is adapted from Shelly et al. (2007). The black arrow highlights the November 17, 2001 sequence.
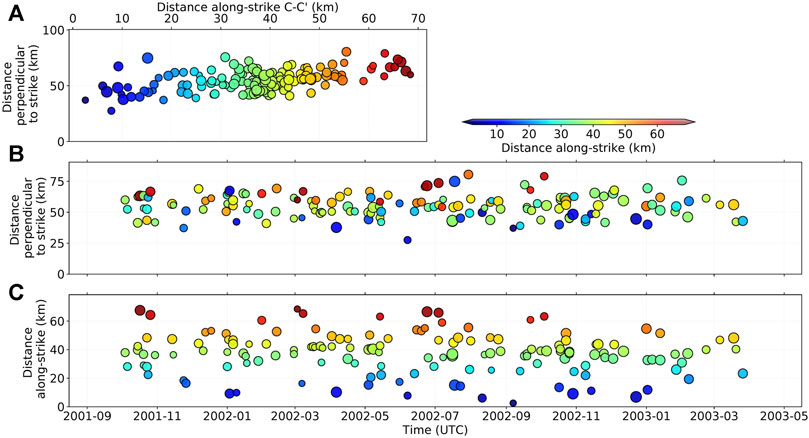
FIGURE 9. Same as Figure 8 but for cross-sections C–C′ and D–D’.
To examine this potential migration pattern in more detail and possibly identify more sequences, we perform additional analysis (see supplementary material for detailed information). In this analysis, we examine the evolution of all succeeding events in our catalog by calculating the difference in time and distance of each event to its successive events and keeping those groups that are sufficiently close within a 3D volume with respect to any first event (time and space window of 20 days and 20 km). We found four such sequences that satisfy these criteria and exhibit apparent migration patterns. This relatively small number of sequences does not allow a robust quantitative estimation for diffusion rates, directivity, magnitude variation, or migrations velocities. We can, however, report that all the examined sequences generally fit with simple models of linear or diffusive migration, with rates of the same order of magnitude: for linear seismicity migration velocities at < 1.0 km/day, and for hydraulic diffusivity values <1.0 m2/s.
4 Discussion
We present the most detailed intermediate-depth earthquake catalog, comprised of 414 events with high-quality locations for the central Himalayas to date. Combining this with information from previous seismicity studies (e.g., Diehl et al., 2017), we have been able to observe a potential connection of the intermediate-depth seismicity across the DCFZ to the Shillong plateau for the first time. We start with continuous data and apply a systematic processing routine to all the available data. By applying this analysis that includes modern detection techniques (e.g., Mousavi et al., 2020), we avoid inconsistencies that may arise by combining earthquake catalogs constructed using different detection, picking and location methods and extend the number of intermediate-depth earthquakes previously located in the region (i.e., 139 events; Monsalve et al., 2006).
Using this earthquake catalog, we examine the seismicity characteristics at depths >40 km beneath southern Tibet and the central Himalayas. Overall, we observe a mostly monotonous pattern of seismicity: no clear mainshock-aftershock sequences, relatively large inter-event times, almost constant seismicity rates, small difference in magnitude units between largest and second largest events, and potential indications for spatial migrations based on a few examples. The nearly continuous seismic activity and the evidence of potential seismicity migration within sequences of succeeding events at reasonable rates we observe here allow for the interpretation that fluids and metamorphic dehydration reactions to play a role in seismogenesis within a hydrous ILC beneath the high Himalayas. Laboratory experiments on natural hydrous granulites deformed at various pressure-temperature conditions fracture within both granulite and eclogite stability fields (Incel et al., 2017). Metamorphic dehydration reactions densify rocks (i.e., reduction in volume) and create a network of fractures in the ILC where at least locally permeability can be high. This behavior and relation to dehydration embrittlement is also suggested by a moment tensor solution that includes a clear isotropic component, obtained for one of the largest intermediate-depth events calculated by Alvizuri and Hetényi (2019) that is also within our catalog (focal mechanism VII in Figures 1, 2). This interpretation could be strengthened with additional analyses, including stress drop estimations, but the limited data and lack of path and site terms restricted this possibility. While the few sequences we identified here could represent fluid migration following dehydration reactions, metamorphic arguments can be put forward for single events as well. An example of such a single event includes a magnitude 4 earthquake (ML = 4.5, 6th of June 2013, 19:01:03 UTC) that occurred in the lower crust at ∼76 km depth in northern Bhutan, a region covered at the time by GANSSER temporary seismic network (Diehl et al., 2017; Singer, 2017). Despite the dense coverage of the seismic network, no aftershock was observed for at least a year (e.g., Diehl et al., 2017). This single event could be an indication that rocks near the earthquake’s hypocenter have undergone metamorphic reactions. The freed fluids likely escaped on pre-existing pathways and no further surrounding rock masses were ready to react similarly, hence the dehydration process triggered a single event and no aftershocks.
As an alternative interpretation, the nearly constant seismic activity could be due to the background microseismicity of the area and depth range. In that case, tectonics can be the mechanism controlling seismogenesis at such depths beneath the central Himalayas. One could expect tensional fracturing due to the bending of the Indian plate from north-dipping back to horizontal; however, the observed focal mechanisms (Figure 1; de la Torre et al. (2007)) show mostly strike-slip and some transtensional events along the N105° striking part of Cluster 1. The strike-slip component here can be explained with the dextral basement fault zone that separates the Shillong block and India (Vernant et al., 2014), with active seismicity (see next paragraph); it can also be an inherited tectonic feature, continuing the rift zone related to the formation of the Shillong Plateau as presented in (Talwani et al., 2016).
The linear N140°-striking part of Cluster 1 (Figure 2 including the shallow seismicity <40 km depths) appears to be a continuation of the Dhubri-Chungthang fault zone (DCFZ) that is identified from the NW corner of the Shillong Plateau, crossing southwestern Bhutan and then beneath Sikkim (e.g., Diehl et al., 2017). A more detailed view of this can be found in Figure 10 (and Supplementary Video S1) that shows a 3D view of the intermediate-depth earthquake hypocenters in conjunction with the shallower events located near the DCFZ zone by Diehl et al. (2017). The hypocenter of the M6.9 2011 Sikkim Himalaya earthquake is also shown in Figure 10 (both GCMT and USGS solutions). The significant discrepancies in location from different seismological institutions for the M6.9 2011 Sikkim Himalaya earthquake make it rather unclear whether the earthquake occurred within Cluster 1 or farther away to the southeast. Considering the location uncertainties and a ∼50 km of subsurface rupture length obtained by empirical relations of Wells and Coppersmith (1994) for the M6.9 2011 Sikkim Himalaya earthquake, this major event could represent the connection between the DCFZ and the N140°-striking part of Cluster 1, and propagate the dextral deformation further beneath the orogen, possibly continuing as a tear fault along the N105°-segment (see focal mechanisms in Figure 1). The counterargument for this tectonic interpretation is the lack of a mainshock-aftershock sequences in our catalog. But a longer catalog and therefore observation time is required.
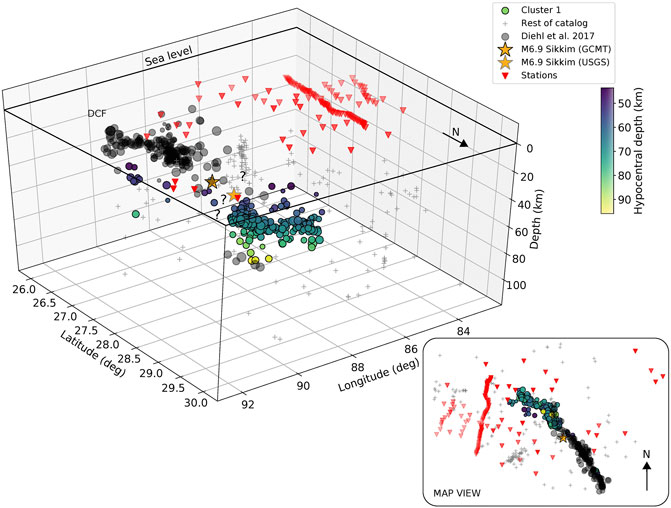
FIGURE 10. Three dimensional view of seismicity near Dhubri-Chungthang fault zone (DCFZ) and Cluster 1. Hypocenter locations determined in this study, located in Cluster 1, are colored according to their hypocentral depths (see color scale) and the rest of the events in the catalog are depicted with gray crosses. Black circles show the seismicity located by Diehl et al. (2017) in the vicinity of DCFZ. Stars show the M6.9 2011 Sikkim Himalaya earthquake hypocenters provided by the U.S. Geological Survey (USGS) and the Global Centroid Moment Tensor (GCMT). Question marks depict the region where the DCFZ seismicity could be connected to Cluster 1, possibly through the M6.9 event. Inset shows the map view of the seismicity. For a more detailed view of the seismicity see also Supplementary Video S1.
The intermediate-depth seismicity analyzed here is likely to include hypocenters that occurred both in the lower crust and in the upper mantle. It has to be stressed though, that the hypocenter uncertainties in our earthquake locations make it impossible to determine whether the intermediate-depth seismicity takes place below or above the Moho (70–75 km in Southern Tibet by receiver function analysis; Schulte-Pelkum et al., 2005; Nábělek et al., 2009), or, likely, both; similarly, it is currently impossible to estimate how thick the Moho as a vertical velocity-transition is. Further analysis (e.g., waveform fitting analysis) is required to distinguish between lower crustal and upper mantle events, which is beyond the scope of this paper. It should also be noted that the catalog presented here is relatively sparse due to the network’s geometry and the large hypocentral depths, and thus a more dedicated seismic network could provide a more complete and higher resolution picture of seismicity. In addition to this, our catalog only covers a year and half of the ongoing seismic deformation with high-quality locations, that is only a small snapshot with respect to typical dehydration periods (∼1,000 years) compared to calm metamorphic times (Malvoisin et al., 2020). Therefore, potential future directions should include longer and denser seismic networks in the region that can help provide more robust locations along with modeling studies of rock mechanics. More detailed intermediate-depth event sequences could afford comparisons with sequences in shallower contexts that could potentially shed more light on whether these intermediate-depth events are tectonic, fluid related, or a mix of the two.
5 Conclusion
We present the most comprehensive, high-quality catalog of 414 intermediate-depth earthquakes that occurred in the central Himalayas between late 2001 and mid-2003. Intermediate-depth earthquakes are mainly concentrated in a 55–80 km deep cluster within two linear interconnected segments: a N105°-striking segment in southernmost Tibet adjacent to northeast Nepal, and a N140°-striking segment. The latter segment is likely connected to the M6.9 2011 Sikkim earthquake and the Dhubri-Chungtang fault zone cutting across the Himalayas, a connection that is observed for the first time. Seismicity there presents the following characteristics: 1) absence of mainshock-aftershock sequences, 2) small largest to next largest magnitude differences, 3) relatively constant seismicity rates, 4) inter-event times mostly >1 day, 5) a few sequences with potential spatial migration of generally <1.0 km/day. Our results, and particularly the absence of mainshock-aftershock sequences, suggest that eclogitization reactions that densify the hydrous Indian lower crust (ILC) could locally increase permeability and cause brittle failure. On the other hand, a tectonically inherited dextral deformation zone propagating beneath the orogen, and continuing as a westward tear fault beneath southernmost Tibet, is also a plausible scenario. We note that these two explanations are not mutually exclusive, and given the available data, no argument can be made on which one plays the most important role for seismogenesis. Further advances in this research can be obtained with longer observation times, as well as by opening access to seismological waveform data from all past, ongoing and forthcoming seismic networks and experiments.
Data Availability Statement
The continuous seismic data from the three temporary networks used in this study can be found at the Incorporated Research Institutions for Seismology Data Management Center (IRIS-DMC; https://ds.iris.edu/ds/nodes/dmc/) with the following network codes: HIMNT, YL; Hi-CLIMB, XF; BPE, XA. The details of the intermediate-depth earthquakes catalog constructed in this study are available in the supplementary material in CSV and QuakeML format.
Author Contributions
KM led the project and performed the analyses. GH provided initial ideas for the research and guidance. NC contributed by providing catalog data and discussions from early drafts of the manuscript. KM lead the manuscript writing, with input from GH and NC. All authors have read and approved the final version of the manuscript.
Funding
This work was funded by the Swiss National Science Foundation project OROG3NY (Grant PP00P2_187199).
Conflict of Interest
The authors declare that the research was conducted in the absence of any commercial or financial relationships that could be construed as a potential conflict of interest.
Publisher’s Note
All claims expressed in this article are solely those of the authors and do not necessarily represent those of their affiliated organizations, or those of the publisher, the editors and the reviewers. Any product that may be evaluated in this article, or claim that may be made by its manufacturer, is not guaranteed or endorsed by the publisher.
Acknowledgments
We thank the National Earthquake Monitoring and Research Center (NEMRC) of Nepal and John Nabelek for sharing catalog data and Benjamin Malvoisin for helpful discussions on seismicity migrations. We also thank Calum Chamberlain for useful feedback with the matched filter detection analysis and Maria Mesimeri for providing bootstrap analysis codes.
Supplementary Material
The Supplementary Material for this article can be found online at: https://www.frontiersin.org/articles/10.3389/feart.2021.742700/full#supplementary-material
References
Acton, C. E., Priestley, K., Mitra, S., and Gaur, V. K. (2011). Crustal Structure of the Darjeeling-Sikkim Himalaya and Southern Tibet. Geophys. J. Int. 184, 829–852. doi:10.1111/j.1365-246X.2010.04868.x
Adhikari, L. B., Gautam, U. P., Koirala, B. P., Bhattarai, M., Kandel, T., Gupta, R. M., et al. (2015). The Aftershock Sequence of the 2015 April 25 Gorkha-Nepal Earthquake. Geophys. J. Int. 203, 2119–2124. doi:10.1093/gji/ggv412
Alvizuri, C., and Hetényi, G. (2019). Source Mechanism of a Lower Crust Earthquake beneath the Himalayas and its Possible Relation to Metamorphism. Tectonophysics 769, 128153. doi:10.1016/j.tecto.2019.06.023
Austrheim, H. (1987). Eclogitization of Lower Crustal Granulites by Fluid Migration through Shear Zones. Earth Planet. Sci. Lett. 81, 221–232. doi:10.1016/0012-821X(87)90158-0
Baillard, C., Lyon-Caen, H., Bollinger, L., Rietbrock, A., Letort, J., and Adhikari, L. B. (2017). Automatic Analysis of the Gorkha Earthquake Aftershock Sequence: Evidences of Structurally Segmented Seismicity. Geophys. J. Int. 209, 1111–1125. doi:10.1093/gji/ggx081
Båth, M. (1965). Lateral Inhomogeneities of the Upper Mantle. Tectonophysics 2, 483–514. doi:10.1016/0040-1951(65)90003-X
Bettinelli, P., Avouac, J. P., Flouzat, M., Jouanne, F., Bollinger, L., Willis, P., et al. (2006). Plate Motion of India and Interseismic Strain in the Nepal Himalaya from GPS and DORIS Measurements. J. Geodesy 80, 567–589. doi:10.1007/s00190-006-0030-3
Bilham, R. (2019). Himalayan Earthquakes: A Review of Historical Seismicity and Early 21st century Slip Potential. Geol. Soc. Spec. Publ. 483, 423–482. doi:10.1144/SP483.16
Caldwell, W. B., Klemperer, S. L., Lawrence, J. F., Rai, S. S., and Ashish, (2013). Characterizing the Main Himalayan Thrust in the Garhwal Himalaya, India with Receiver Function CCP Stacking. Earth Planet. Sci. Lett. 367, 15–27. doi:10.1016/j.epsl.2013.02.009
Carpenter, N., Nabelek, J., and Braunmiller, J. (2010). South-central Tibetan Seismicity from HiCLIMB Seismic Array Data. M.S. Thesis. Corvallis: Oregon State University.
Chamberlain, C. J., Hopp, C. J., Boese, C. M., Warren-Smith, E., Chambers, D., Chu, S. X., et al. (2017). EQcorrscan: Repeating and Near-Repeating Earthquake Detection and Analysis in Python. Seismological Res. Lett. 89, 173–181. doi:10.1785/0220170151
Chen, W.-P. (1988). A Brief Update on the Focal Depths of Intracontinental Earthquakes and Their Correlations with Heat Flow and Tectonic Age. Seism. Res. Lett. 59, 263–272. doi:10.1785/gssrl.59.4.263
Chen, W.-P., and Kao, H. (1996). Seismotectonics of Asia: Some Recent Progress. World Regional 1, 37–62.
Chen, W.-P., and Molnar, P. (1983). Focal Depths of Intracontinental and Intraplate Earthquakes and Their Implications for the thermal and Mechanical Properties of the Lithosphere. J. Geophys. Res. 88, 4183–4214. doi:10.1029/jb088ib05p04183
Chen, W.-P., Nabelek, J. L., Fitch, T. J., and Molnar, P. (1981). An Intermediate Depth Earthquake beneath Tibet: Source Characteristics of the Event of September 14, 1976. J. Geophys. Res. 86, 2863–2876. doi:10.1029/jb086ib04p02863
Cotte, N., Pedersen, H., Campillo, M., Mars, J., Ni, J. F., Kind, R., et al. (1999). Determination of the Crustal Structure in Southern Tibet by Dispersion and Amplitude Analysis of Rayleigh Waves. Geophys. J. Int. 138, 809–819. doi:10.1046/j.1365-246X.1999.00927.x
Craig, T. J., Copley, A., and Jackson, J. (2012). Thermal and Tectonic Consequences of India Underthrusting Tibet. Earth Planet. Sci. Lett. 353-354, 231–239. doi:10.1016/j.epsl.2012.07.010
De Barros, L., Cappa, F., Deschamps, A., and Dublanchet, P. (2020). Imbricated Aseismic Slip and Fluid Diffusion Drive a Seismic Swarm in the Corinth Gulf, Greece. Geophys. Res. Lett. 47, 1–9. doi:10.1029/2020GL087142
de la Torre, T. L., Monsalve, G., Sheehan, A. F., Sapkota, S., and Wu, F. (2007). Earthquake Processes of the Himalayan Collision Zone in Eastern Nepal and the Southern Tibetan Plateau. Geophys. J. Int. 171, 718–738. doi:10.1111/j.1365-246x.2007.03537.x
de la Torre, T. L., and Sheehan, A. F. (2005). Broadband Seismic Noise Analysis of the Himalayan Nepal Tibet Seismic experiment. Bull. Seismol. Soc. Am. 95, 1202–1208. doi:10.1785/0120040098
DeMets, C., Gordon, R. G., and Argus, D. F. (2010). Geologically Current Plate Motions. Geophys. J. Int. 181, 1–80. doi:10.1111/j.1365-246x.2009.04491.x
Diehl, T., Singer, J., Hetényi, G., Grujic, D., Clinton, J., Giardini, D., et al. (2017). Seismotectonics of Bhutan: Evidence for Segmentation of the Eastern Himalayas and Link to Foreland Deformation. Earth Planet. Sci. Lett. 471, 54–64. doi:10.1016/j.epsl.2017.04.038
Fischer, T., and Hainzl, S. (2021). The Growth of Earthquake Clusters. Front. Earth Sci. 9, 1–13. doi:10.3389/feart.2021.638336
Gutenberg, B., and Richter, C. F. (1942). Earthquake Magnitude, Intensity, Energy, and Acceleration. Bull. Seism. Soc. Am. 32, 163–191. doi:10.1785/bssa0320030163
Hainzl, S., and Ogata, Y. (2005). Detecting Fluid Signals in Seismicity Data through Statistical Earthquake Modeling. J. Geophys. Res. Solid Earth 110, 1–10. doi:10.1029/2004JB003247
Hauksson, E., Ross, Z. E., and Cochran, E. (2019). Slow-Growing and Extended-Duration Seismicity Swarms: Reactivating Joints or Foliations in the Cahuilla Valley Pluton, Central Peninsular Ranges, Southern California. J. Geophys. Res. Solid Earth 124, 3933–3949. doi:10.1029/2019JB017494
Havskov, J., and Ottemöller, L. (2010). Routine Data Processing in Earthquake Seismology: With Sample Data, Exercises and Software. Netherlands Dordrecht: Springer Science & Business Media. doi:10.1007/978-90-481-8697-6
Henry, P., Le Pichon, X., and Goffé, B. (1997). Kinematic, thermal and Petrological Model of the Himalayas: Constraints Related to Metamorphism within the Underthrust Indian Crust and Topographic Elevation. Tectonophysics 273, 31–56. doi:10.1016/s0040-1951(96)00287-9
Hetényi, G., Cattin, R., Brunet, F., Bollinger, L., Vergne, J., Nábělek, J. L., et al. (2007). Density Distribution of the India Plate beneath the Tibetan Plateau: Geophysical and Petrological Constraints on the Kinetics of Lower-Crustal Eclogitization. Earth Planet. Sci. Lett. 264, 226–244. doi:10.1016/j.epsl.2007.09.036
Hetényi, G., Chanard, K., Baumgartner, L. P., and Herman, F. (2021). Metamorphic Transformation Rate over Large Spatial and Temporal Scales Constrained by Geophysical Data and Coupled Modelling. J. Metamorph. Geol., 1–13. doi:10.1111/jmg.12604
Hetényi, G., Godard, V., Cattin, R., and Connolly, J. A. (2011). Incorporating Metamorphism in Geodynamic Models: The Mass Conservation Problem. Geophys. J. Int. 186, 6–10. doi:10.1111/j.1365-246X.2011.05052.x
Hoste-Colomer, R., Bollinger, L., Lyon-Caen, H., Adhikari, L. B., Baillard, C., Benoit, A., et al. (2018). Lateral Variations of the Midcrustal Seismicity in Western Nepal: Seismotectonic Implications. Earth Planet. Sci. Lett. 504, 115–125. doi:10.1016/j.epsl.2018.09.041
Hoste-Colomer, R., Bollinger, L., Lyon-Caen, H., Burtin, A., and Adhikari, L. B. (2017). Lateral Structure Variations and Transient Swarm Revealed by Seismicity along the Main Himalayan Thrust north of Kathmandu. Tectonophysics 714-715, 107–116. doi:10.1016/j.tecto.2016.10.004
Huang, G. C. D., Wu, F. T., Roecker, S. W., and Sheehan, A. F. (2009). Lithospheric Structure of the central Himalaya from 3-D Tomographic Imaging. Tectonophysics 475, 524–543. doi:10.1016/j.tecto.2009.06.023
Incel, S., Hilairet, N., Labrousse, L., John, T., Deldicque, D., Ferrand, T., et al. (2017). Laboratory Earthquakes Triggered during Eclogitization of Lawsonite-Bearing Blueschist. Earth Planet. Sci. Lett. 459, 320–331. doi:10.1016/j.epsl.2016.11.047
Jackson, J., Austrheim, H., McKenzie, D., and Priestley, K. (2004). Metastability, Mechanical Strength, and the Support of Mountain Belts. Geology 32, 625–628. doi:10.1130/G20397.1
Jackson, J. (2002). Strength of the continental Lithosphere: Time to Abandon the Jelly sandwich? GSA Today 12, 4–10. doi:10.1130/1052-5173(2002)012<0004:sotclt>2.0.co;2
Kennett, B. L., and Engdahl, E. R. (1991). Traveltimes for Global Earthquake Location and Phase Identification. Geophys. J. Int. 105, 429–465. doi:10.1111/j.1365-246X.1991.tb06724.x
Kind, R., Yuan, X., Saul, J., Nelson, D., Sobolev, S. V., Mechie, J., et al. (2002). Seismic Images of Crust and Upper Mantle beneath Tibet: Evidence for Eurasian Plate Subduction. Science 298, 1219–1221. doi:10.1126/science.1078115
Krischer, L., Megies, T., Barsch, R., Beyreuther, M., Lecocq, T., Caudron, C., et al. (2015). ObsPy: A Bridge for Seismology into the Scientific Python Ecosystem. Comput. Sci. Discov. 8, 0–17. doi:10.1088/1749-4699/8/1/014003
Lemonnier, C., Marquis, G., Perrier, F., Avouac, J. P., Chitrakar, G., Kafle, B., et al. (1999). Electrical Structure of the Himalaya of Central Nepal: High Conductivity Around the Mid-crustal Ramp along the MHT. Geophys. Res. Lett. 26, 3261–3264. doi:10.1029/1999GL008363
Liang, X., Zhou, S., Chen, Y. J., Jin, G., Xiao, L., Liu, P., et al. (2008). Earthquake Distribution in Southern Tibet and its Tectonic Implications. J. Geophys. Res. Solid Earth 113, 1–11. doi:10.1029/2007JB005101
Lohman, R. B., and McGuire, J. J. (2007). Earthquake Swarms Driven by Aseismic Creep in the Salton Trough, California. J. Geophys. Res. Solid Earth 112, 1–10. doi:10.1029/2006JB004596
Lomax, A. (2005). A Reanalysis of the Hypocentral Location and Related Observations for the Great 1906 California Earthquake. Bull. Seismol. Soc. Am. 95, 861–877. doi:10.1785/0120040141
Lomax, A., Virieux, J., Volant, P., and Berge-thierry, C. (2000). “Probabilistic Earthquake Location in 3D and Layered Models,” in Advances in Seismic Event Location (Springer), 101–134. doi:10.1007/978-94-015-9536-0_5
Maggi, A., Jackson, J. A., McKenzie, D., and Priestley, K. (2000). Earthquake Focal Depths, Effective Elastic Thickness, and the Strength of the continental Lithosphere. Geology 28, 495–498. doi:10.1130/0091-7613(2000)028<0495:efdeet>2.3.co;2
Malvoisin, B., Austrheim, H., Hetényi, G., Reynes, J., Hermann, J., Baumgartner, L. P., et al. (2020). Sustainable Densification of the Deep Crust. Geology 48, 673–677. doi:10.1130/G47201.1
Matoza, R. S., Shearer, P. M., Lin, G., Wolfe, C. J., and Okubo, P. G. (2013). Systematic Relocation of Seismicity on Hawaii Island from 1992 to 2009 Using Waveform Cross Correlation and Cluster Analysis. J. Geophys. Res. Solid Earth 118, 2275–2288. doi:10.1002/jgrb.50189
Menke, W., and Schaff, D. (2004). Absolute Earthquake Locations with Differential Data. Bull. Seismol. Soc. Am. 94, 2254–2264. doi:10.1785/0120040033
Michailos, K., Smith, E. G. C., Chamberlain, C. J., Savage, M. K., and Townend, J. (2019). Variations in Seismogenic Thickness along the Central Alpine Fault, New Zealand, Revealed by a Decade’s Relocated Microseismicity. Geochem. Geophys. Geosys. 20, 470–486. doi:10.1029/2018GC007743
Michelini, A., and Lomax, A. (2004). The Effect of Velocity Structure Errors on Double-Difference Earthquake Location. Geophys. Res. Lett. 31, 1–4. doi:10.1029/2004GL019682
Miller, K. (2002). Bhutan Pilot Experiment. Other/Seismic Network. International Federation of Digital Seismograph Networks.
Mitra, S., Priestley, K., Bhattacharyya, A. K., and Gaur, V. K. (2005). Crustal Structure and Earthquake Focal Depths beneath Northeastern India and Southern Tibet. Geophys. J. Int. 160, 227–248. doi:10.1111/j.1365-246x.2004.02470.x
Molnar, P., and Chen, W. P. (1983). Focal Depths and Fault Plane Solutions of Earthquakes under the Tibetan Plateau. J. Geophys. Res. 88, 1180–1196. doi:10.1029/JB088iB02p01180
Molnar, P., and Tapponnier, P. (1975). Cenozoic Tectonics of Asia: Effects of a continental Collision. Science 189, 419–426. doi:10.1126/science.189.4201.419
Monsalve, G., Sheehan, A., Rowe, C., and Rajaure, S. (2008). Seismic Structure of the Crust and the Upper Mantle beneath the Himalayas: Evidence for Eclogitization of Lower Crustal Rocks in the Indian Plate. J. Geophys. Res. Solid Earth 113, 1–16. doi:10.1029/2007JB005424
Monsalve, G., Sheehan, A., Schulte-Pelkum, V., Rajaure, S., Pandey, M. R., and Wu, F. (2006). Seismicity and One-Dimensional Velocity Structure of the Himalayan Collision Zone: Earthquakes in the Crust and Upper Mantle. J. Geophys. Res. Solid Earth 111, 1–19. doi:10.1029/2005JB004062
Mousavi, S. M., Ellsworth, W. L., Zhu, W., Chuang, L. Y., and Beroza, G. C. (2020). Earthquake Transformer An Attentive Deep-Learning Model for Simultaneous Earthquake Detection and Phase Picking. Nat. Commun. 11, 1–12. doi:10.1038/s41467-020-17591-w
Mugnier, J. L., Gajurel, A., Huyghe, P., Jayangondaperumal, R., Jouanne, F., and Upreti, B. (2013). Structural Interpretation of the Great Earthquakes of the Last Millennium in the central Himalaya. Earth-Science Rev. 127, 30–47. doi:10.1016/j.earscirev.2013.09.003
Nábělek, J. L., Hetényi, G., Vergne, J., Sapkota, S., Kafle, B., Jiang, M., et al. (2009). Underplating in the Himalaya-Tibet Collision Zone Revealed by the Hi-CLIMB Experiment. Science 325, 1371–1374. doi:10.1126/science.1167719
Nelson, K. D., Zhao, W., Brown, L. D., Kuo, J., Che, J., Liu, X., et al. (1996). Partially Molten Middle Crust beneath Southern Tibet: Synthesis of Project INDEPTH Results. Science 274, 1684–1685. doi:10.1126/science.274.5293.1684
Pandey, M. R., Tandukar, R. P., Avouac, J. P., Lavé, J., and Massot, J. P. (1995). Interseismic Strain Accumulation on the Himalayan Crustal Ramp (Nepal). Geophys. Res. Lett. 22, 751–754. doi:10.1029/94gl02971
Pandey, M. R., Tandukar, R. P., Avouac, J. P., Vergne, J., and Héritier, T. (1999). Seismotectonics of the Nepal Himalaya from a Local Seismic Network. J. Asian Earth Sci. 17, 703–712. doi:10.1016/S1367-9120(99)00034-6
Paul, H., Mitra, S., Bhattacharya, S., and Suresh, G. (2015). Active Transverse Faulting within Underthrust Indian Crust beneath the Sikkim Himalaya. Geophys. J. Int. 201, 1072–1083. doi:10.1093/gji/ggv058
Paul, H., and Mitra, S. (2017). Three-Dimensional Crustal Architecture beneath the Sikkim Himalaya and its Relationship to Active Deformation. J. Geophys. Res. Solid Earth 122, 7860–7878. doi:10.1002/2017JB014506
Pavlis, L. G. (1986). Appraising Earthquake Hypocenter Location Errors: A Complete, Practical Approach for Single-Event Locations. Bull. Seismol. Soc. Am. 76, 1699–1717. doi:10.1785/bssa0760051514
Petley-Ragan, A., Ben-Zion, Y., Austrheim, H., Ildefonse, B., Renard, F., and Jamtveit, B. (2019). Dynamic Earthquake Rupture in the Lower Crust. Sci. Adv. 5, 1–8. doi:10.1126/sciadv.aaw0913
Priestley, K., Ho, T., and Mitra, S. (2019). The Crustal Structure of the Himalaya: A Synthesis. Geol. Soc. Spec. Publ. 483, 483–516. doi:10.1144/sp483-2018-127
Priestley, K., James, J., and Mckenzie, D. (2008). Lithospheric Structure and Deep Earthquakes beneath India, the Himalaya and Southern Tibet. Geophys. J. Int. 172, 345–362. doi:10.1111/j.1365-246X.2007.03636.x
Rawles, C. J., and Thurber, C. H. (2015). A Non-parametric Method for Automatic Determination of P-Wave and S-Wave Arrival Times: Application to Local Micro Earthquakes. Geophys. J. Int. 202, 1164–1179. doi:10.1093/gji/ggv218
Ross, Z. E., Cochran, E. S., Trugman, D. T., and Smith, J. D. (2020). 3D Fault Architecture Controls the Dynamism of Earthquake Swarms. Science 368, 1357–1361. doi:10.1126/science.abb0779
Schulte-Pelkum, V., Monsalve, G., Sheehan, A. F., Shearer, P., Wu, F., and Rajaure, S. (2019). Mantle Earthquakes in the Himalayan Collision Zone. Geology 47, 815–819. doi:10.1130/G46378.1
Schulte-Pelkum, V., Monsalve, G., Sheehan, A., Pandey, M. R., Sapkota, S., Bilham, R., et al. (2005). Imaging the Indian Subcontinent beneath the Himalaya. Nature 435, 1222–1225. doi:10.1038/nature03678
Shapiro, S. A., Huenges, E., and Borm, G. (1997). Estimating the Crust Permeability from Fluid-Injection-Induced Seismic Emission at the KTB Site. Geophys. J. Int. 131, 5–8. doi:10.1111/j.1365-246X.1997.tb01215.x
Sheehan, A. F., de la Torre, T. L., Monsalve, G., Abers, G. A., and Hacker, B. R. (2014). Physical State of the Himalyan. J. Geophys. Res. Solid Earth 119, 567–580. doi:10.1002/2013JB010601
Shelly, D. R., Beroza, G. C., and Ide, S. (2007). Non-volcanic Tremor and Low-Frequency Earthquake Swarms. Nature 446, 305–307. doi:10.1038/nature05666
Singer, J. (2017). Tectonics of the Bhutan Himalaya: New Insights from Seismic Tomographic Images of the Lithosphere. Ph.D. Thesis. ETH Zurich.
Styron, R., Taylor, M., and Okoronkwo, K. (2010). Database of Active Structures from the Indo-Asian Collision. EOS 91, 181–182. doi:10.1029/2010EO200001
Talwani, M., Desa, M. A., Ismaiel, M., and Sree Krishna, K. (2016). The Tectonic Origin of the Bay of Bengal and Bangladesh. J. Geophys. Res. Solid Earth 121, 4836–4851. doi:10.1002/2015JB012734
Unsworth, M. J., Jones, A. G., Wei, W., Marquis, G., Gokarn, S. G., Spratt, J. E., et al. (2005). Crustal Rheology of the Himalaya and Southern Tibet Inferred from Magnetotelluric Data. Nature 438, 78–81. doi:10.1038/nature04154
Velasco, A. A., Gee, V. L., Rowe, C., Grujic, D., Hollister, L. S., Hernandez, D., et al. (2007). Using Small, Temporary Seismic Networks for Investigating Tectonic Deformation: Brittle Deformation and Evidence for Strike-Slip Faulting in Bhutan. Seismol. Res. Lett. 78, 446–453. doi:10.1785/gssrl.78.4.446
Vernant, P., Bilham, R., Szeliga, W., Drupka, D., Kalita, S., Bhattacharyya, A. K., et al. (2014). Clockwise Rotation of the Brahmaputra Valley Relative to India: Tectonic Convergence in the Eastern Himalaya, Naga Hills, and Shillong Plateau. J. Geophys. Res. Solid Earth 119, 6558–6571. doi:10.1002/2014jb011196
Vidale, J. E., and Shearer, P. M. (2006). A Survey of 71 Earthquake Bursts across Southern California: Exploring the Role of Pore Fluid Pressure Fluctuations and Aseismic Slip as Drivers. J. Geophys. Res. Solid Earth 111, 1–12. doi:10.1029/2005JB004034
Waldhauser, F., and Ellsworth, W. L. (2000). A Double-Difference Earthquake Location Algorithm: Method and Application to the Northern Hayward Fault, California. Bull. Seismol. Soc. Am. 90, 1353–1368. doi:10.1785/0120000006
Waldhauser, F. (2001). HypoDD - A Program to Compute Double-Difference Hypocenter Locations. USGS Open File Report 01-113. Available at: http://geopubs.wr.usgs.gov/open-file/of01-113/.
Wang, Y., Deng, Y., Shi, F., and Peng, Z. (2020). The Indo-Eurasia Convergent Margin and Earthquakes in and Around Tibetan Plateau. J. Mineral. Petrol. Sci. 115, 118–137. doi:10.2465/jmps.190927
Wells, D. L., and Coppersmith, K. J. (1994). New Empirical Relationships Among Magnitude, Rupture Length, Rupture Width, Rupture Area, and Surface Displacement. Bull. Seismol. Soc. Am. 84, 974–1002.
Wiemer, S., and Wyss, M. (2000). Minimum Magnitude of Completeness in Earthquake Catalogs: Examples from Alaska, the Western United States, and Japan. Bull. Seismol. Soc. Am. 90, 859–869. doi:10.1785/0119990114
Wittlinger, G., Vergne, J., Tapponnier, P., Farra, V., Poupinet, G., Jiang, M., et al. (2004). Teleseismic Imaging of Subducting Lithosphere and Moho Offsets beneath Western Tibet. Earth Planet. Sci. Lett. 221, 117–130. doi:10.1016/s0012-821x(03)00723-4
Woessner, J., and Wiemer, S. (2005). Assessing the Quality of Earthquake Catalogues: Estimating the Magnitude of Completeness and its Uncertainty. Bull. Seismol. Soc. Am. 95, 684–698. doi:10.1785/0120040007
Wolfe, C. J. (2002). On the Mathematics of Using Difference Operators to Relocate Earthquakes. Bull. Seismol. Soc. Am. 92, 2879–2892. doi:10.1785/0120010189
Yin, A., and Harrison, T. M. (2000). Geologic Evolution of the Himalayan-Tibetan Orogen. Annu. Rev. Earth Planet. Sci. 28, 211–280. doi:10.1146/annurev.earth.28.1.211
Zertani, S., Labrousse, L., John, T., Andersen, T. B., and Tilmann, F. (2019). The Interplay of Eclogitization and Deformation during Deep Burial of the Lower Continental Crust A Case Study from the Bergen Arcs (Western Norway). Tectonics 38, 898–915. doi:10.1029/2018TC005297
Zertani, S., Vrijmoed, J. C., Tilmann, F., John, T., Andersen, T. B., and Labrousse, L. (2020). P Wave Anisotropy Caused by Partial Eclogitization of Descending Crust Demonstrated by Modeling Effective Petrophysical Properties. Geochem. Geophys. Geosys. 21, 1–18. doi:10.1029/2019GC008906
Keywords: Himalayas, seismicity, spatio-temporal evolution, metamorphism, tectonics
Citation: Michailos K, Carpenter NS and Hetényi G (2021) Spatio-Temporal Evolution of Intermediate-Depth Seismicity Beneath the Himalayas: Implications for Metamorphism and Tectonics. Front. Earth Sci. 9:742700. doi: 10.3389/feart.2021.742700
Received: 16 July 2021; Accepted: 06 September 2021;
Published: 01 October 2021.
Edited by:
Nibir Mandal, Jadavpur University, IndiaReviewed by:
Supriyo Mitra, Indian Institute of Science Education and Research Kolkata, IndiaJosé Borges, University of Evora, Portugal
Copyright © 2021 Michailos, Carpenter and Hetényi. This is an open-access article distributed under the terms of the Creative Commons Attribution License (CC BY). The use, distribution or reproduction in other forums is permitted, provided the original author(s) and the copyright owner(s) are credited and that the original publication in this journal is cited, in accordance with accepted academic practice. No use, distribution or reproduction is permitted which does not comply with these terms.
*Correspondence: Konstantinos Michailos, a29uc3RhbnRpbm9zLm1pY2hhaWxvc0B1bmlsLmNo, a29uc3RhbnRpbm9zLm1pY2hhaWxvc0BnbWFpbC5jb20=