 Feng Wang1,2
 Guohe Huang
 Guoqing Wang
 Ruixin Duan
- 1State Key Joint Laboratory of Environmental Simulation and Pollution Control, China-Canada Center for Energy, Environment and Ecology Research, UR-BNU, School of Environment, Beijing Normal University, Beijing, China
- 2Sino-Canada Resources and Environmental Research Academy, North China Electric Power University, Beijing, China
- 3Key Laboratory of Power Station Energy Transfer Conversion and System, North China Electric Power University, Ministry of Education, Beijing, China
- 4State Key Laboratory of Hydrology-Water Resources and Hydraulic Engineering, Nanjing Hydraulic Research Institute, Nanjing, China
Streamflow prediction is one of the most important topics in operational hydrology. The responses of runoffs are different among watersheds due to the diversity of climatic conditions as well as watershed characteristics. In this study, a stepwise cluster analysis hydrological (SCAH) model is developed to reveal the nonlinear and dynamic rainfall-runoff relationship. The proposed approach is applied to predict the runoffs with regional climatic conditions in Yichang station, Hankou station, and Datong station over the Yangtze River Watershed, China. The main conclusions are: 1) the performances of SCAH in both deterministic and probabilistic modeling are notable.; 2) the SCAH is insensitive to the parameter p in SCAH with robust cluster-tree structure; 3) in terms of the case study in the Yangtze River watershed, it can be inferred that the water resource in the lower reaches of the Yangtze River is seriously affected by incoming water from the upper reaches according to the strong correlations. This study has indicated that the developed statistical hydrological model SCAH approach can characterize such hydrological processes complicated with nonlinear and dynamic relationships, and provide satisfactory predictions. Flexible data requirements, quick calibration, and reliable performances make SCAH an appealing tool in revealing rainfall-runoff relationships.
Highlights:
• A stepwise cluster analysis hydrological model (SCAH) was proposed.
• The proposed SCAH is applied in three stations runoff simulation in the Yangtze River watershed.
• Both deterministic and probabilistic predictions are generated in the proposed SCAH.
Introduction
Streamflow prediction is one of the most important topics in operational hydrology, which can provide valuable information for water resource allocation, hydropower generation, flood risk management, irrigation, and agricultural crop forecasting (Fan et al., 2015). A crucial task is to select and develop an advanced forecasting model which can effectively model hydrological processes and provide accurate prediction (Liu et al., 2016). The task is complicated by the many complexities in hydrological systems such as extensive nonlinearities, temporal-spatial variations, interactions, and uncertainties (Solomatine and Ostfeld, 2008; Cheng et al., 2016). During the past decades, great effort has been applied to this issue and a series of hydrological models have been developed to improve hydrologic prediction (Xie et al., 2020; Wang et al., 2021c). These hydrological models primarily include process-based and data-driven models (Li et al., 2015). The process-based models represent the runoff generating mechanisms realistically based on the inherent mass and energy conservation laws in the water cycle system. The main drawback of such models is that the expression of physical processes is often oversimplified, and many uncertainties such as model structure (and/or parameter) uncertainties exist (Bhadra et al., 2009; Zhang et al., 2016). Another drawback is that the process-based models mainly rely on the parameterization process and cannot reflect the mapping between independent (i.e., explanatory, boundary input) and dependent (i.e., response, output) variables in the hydrologic system (Wang et al., 2021a). In comparison, the data-driven models are able to capture this mapping, which involves the analysis of boundary input and the corresponding response time series rather than the physical process (Solomatine and Ostfeld, 2008). Due to the flexible data requirements, quick calibration, and reliable performance, data-driven models have been proven to be effective for streamflow forecasting (Fan et al., 2016). Nonparametric statistical techniques mainly including statistical regression, artificial intelligence, and machine learning methods have been commonly used as practical tools to calculate surface runoff.
However, previous data-driven models still suffer from several difficulties in reflecting the inherently complicated relationships within the environmental process (Wang et al., 2021b). A number of statistic models such as multiple linear regression, autoregressive, and autoregressive integrated moving average cannot reflect nonlinear relationships between predictors (e.g., climatic factors) and responses (e.g., streamflow) (Solomatine and Ostfeld, 2008; Ordieres-Meré et al., 2020). Besides, it can hardly fit the observations very well with nonlinear relationships in the water cycle (Fan et al., 2020; Li et al., 2020). The artificial intelligence-based models may suffer from a few deficiencies such as getting trapped in local optimum, overfitting, subjectivity in the choice of model parameters, and the components of its complex structure (Wang et al., 2020). As for machine-learning models, such as random forest (Sun et al., 2016), the reliability and development of these models met many obstacles stemming from a lack of thorough understanding of the underlying processes (Gaume and Gosset, 2003; Solomatine and Ostfeld, 2008; Li et al., 2015). To solve the above problems, one potential approach is to extend innovative and advanced multivariate statistical methods to reflect the complicated environmental processes with nonlinear and dynamic characteristics (Li et al., 2015; Yu et al., 2020). Stepwise cluster analysis is an improved multivariate analysis tool, which can handle nonlinear and discrete relationships between predictors and predictands firstly introduced by (Huang, 1992). Therefore, as the extension of previous studies, the objective of this study is to develop a stepwise cluster analysis hydrological (SCAH) approach to reveal the nonlinear and dynamic rainfall-runoff relationship. Then the developed SCAH will be applied at Yichang station, Hankou station, and Datong station within the Yangtze River Watershed, China, to demonstrate the applicability of the proposed model.
Framework of Stepwise Cluster Analysis Hydrological Model
In this study, the SCAH model framework was proposed and used for runoff prediction. The framework of this study is presented in Figure 1. Firstly, the correlations between streamflow and climatic conditions are analyzed to screen out potentially significant climatic variables. The runoffs with the selected climatic variables are simulated by the proposed SCAH model in which multiple dependent variables are taken into account. As a kind of nonparametric statistical method, stepwise cluster analysis was firstly proposed by (Huang, 1992). In stepwise cluster analysis, the sample sets of response variables are derived into new sets through cutting or merging actions based on given criteria, and cluster trees are built during the process (Duan et al., 2021). The structures of cluster trees reflect the inherent relationships between the explanatory and response variables. With the advantage of capturing discrete and nonlinear relationships between explanatory and response variables, stepwise cluster analysis has received much attention for environmental issues such as air quality prediction (Huang, 1992), process control (Huang et al., 2006), climate projections (Wang et al., 2013), stream flow prediction (Cheng et al., 2016; Zhuang et al., 2016), groundwater simulation (Han et al., 2016), and ecosystem analysis and prediction (Sun et al., 2018). This previous researcher has indicated that the stepwise cluster analysis approach can characterize environmental processes with complicated nonlinear and dynamic relationships and provide satisfactory predictions.
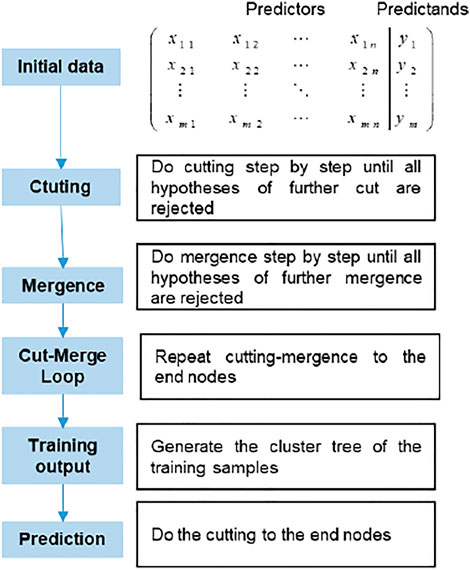
FIGURE 1. The framework of SCAH.
According to the theory of multivariate analysis of variance, the sample sets of predictors and predictands are divided into new sets through a series of cutting and merging processes (Wang et al., 2013; Li et al., 2015). As shown in Figure 1, several main steps are included in SCAH: 1) Select predictors and predictands and prepare the training matrix; 2) Do cutting actions step by step until all hypotheses of further cuts are rejected; 3) Do merging actions until all hypotheses of further merges are rejected; 4) Repeat cutting-merging to the end nodes where hypotheses of further cutting are accepted; 5) generate the cluster tree of the training samples; 6) Do prediction according to the generated cluster tree.
According to (Huang, 1992), the cutting and merging criterion is an F test based on the theory of Wilks’ likelihood ratio criterion. For example, assume a cluster
where W is the within-groups sums of squares and cross products matrix; B is the between-group sums of squares and cross products.
The cutting point is optimal, if and only if the value of
where K is the number of groups and P is the number of predictors. Z and S can be calculated as follows:
Here, K = 2 (two sub-clusters
Therefore, the criteria for cutting and merging clusters becomes to conduct a number of F tests (Rao et al., 1973). For example, the F test could be used to identify whether sub-clusters
Five statistical coefficients, including Nash–Sutcliffe efficiency (NSE) (Nash and Sutcliffe, 1970), Pearson correlation coefficient (COR), Mean Absolute Error (MAE), Root Mean Squared Error (RMSE), and Percent BIAS (PBIAS) (Gupta et al., 1999) are used to evaluate the performance of the SCAH model in the Yangtze River watershed. Let N be the total number of observations (or predictions);
Values of the NSE coefficient can range from negative infinity to 1. NSE coefficients greater than 0.75 are considered “good,” whereas values between 0.75 and 0.5 are considered as “satisfactory” (Moriasi et al., 2007). The COR value is a measure of the linear correlation between the observed and simulated values. MAE and RMSE are used to describe average model-performance error (Willmott and Matsuura, 2005). PBIAS indicates whether the simulated value is larger or smaller compared to the corresponding observed value. Model underestimated the value with PBIAS larger than 0, and overestimated opposite.
To better evaluate the model performance under uncertainties, the relative error of the interval solution (REIS) of sample i are proposed by (Li et al., 2015):
where
Therefore the mean relative error of the interval solution (MREIS) can be defined as:
The ratio of observations falling into the interval solution (RF) can be defined as
Overview of the Study Area
A case study within the Yangtze River watershed (24°30′–35°45′N and 90°33′–122°25′E) in south China (Figure 2) is applied to demonstrate the applicability of the proposed model. As the third-longest river in the world and the longest in China, the Yangtze is 6,300 km long with a basin area of 1.8 million km2 (Hayashi et al., 2004; Ma et al., 2016). The main section of the basin is located in a subtropical warm-wet zone heavily affected by both East and South Asian monsoon activities. The southern part of the basin is near to tropical climates and the northern part is close to the temperate zone. The annual mean temperature in the southern and northern parts are 19 and 15°C, respectively (Xie et al., 2020). Owing to great topographic variability, annual precipitation varies greatly in different sections of the Yangtze River with a range of 300–2,000 mm and appears to increase from northwest to southeast. Affected by summer southwest monsoon and southeast monsoon, the precipitation has noticeable seasonal and regional variations, with most of the precipitation reaching its peak from April to October (Zhang et al., 2019). It is reported that summer precipitation and rainstorm frequency have increased in the past few decades (Chaudhuri et al., 2020). By the 2080s, the annual mean precipitation is expected to increase in the range of 5.33–15.29% under different scenarios (Huang et al., 2011).
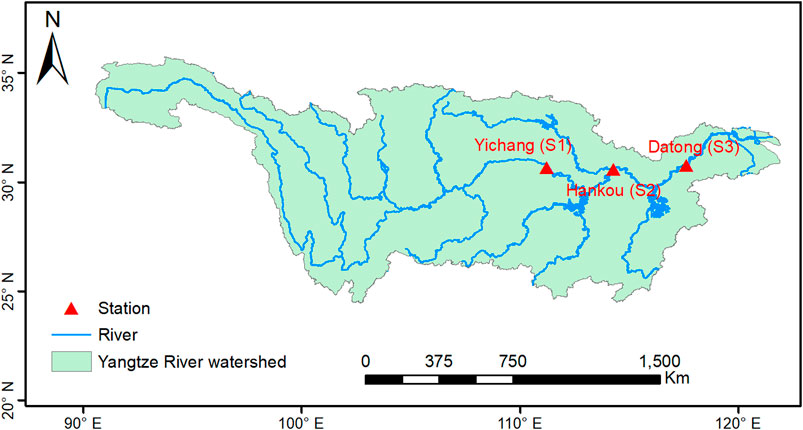
FIGURE 2. The Yangtze River watershed.
The Yangtze River spans nearly one-fifth of mainland China, traverses three economic zones in eastern, central, and western China, and crosses nineteen provinces of the country all told. As one of the most densely populated and economically developed areas in China, the Yangtze River Basin has experienced a booming economy over the last decade and constituted over 40% of gross domestic product (GDP) (Chen et al., 2017). In addition to urbanization, the Yangtze River Basin is a favorable location for agriculture, which accounts for 25% of the total cultivated land area in China (Kong et al., 2018). As the primary water source, the Yangtze River is supporting the ever-growing socio-economic development in the Yangtze River basin and northern China. Inevitably, rapid urbanization and global climatic change are accompanied by many social, economic, environmental, and resource issues. Many issues such as water resource allocation, urban flooding risk management, reservoir operation, soil erosion control, and environmental protection are associated with precise streamflow predictions. According to the Development and Planning Outline of the Yangtze River Economic Belt, issued by the National Development and Reform Commission (NDRC, 2016), the processes of urbanization and industrialization will continue to gain momentum in the next 2 decades. Therefore, precise streamflow prediction is essential in this region which helps practitioners and policymakers make more comprehensive management and targeted policy decision of water resources.
Three streamflow stations, namely Yichang station, Hankou station, and Datong station in the Yangtze River watershed are here studied, which represent the upper, middle, and lower reaches (Zhang et al., 2006). The changes of water level and streamflow of these three gauging stations represent the fundamental principles of the whole Yangtze River Catchment. Runoff data came from https://www.bafg.de/GRDC/EN/02_srvcs/21_tmsrs/stationMaps. html?nn =201566. Climatic data are obtained from the national meteorological stations closest to hydrologic stations. The time periods of all data series are dated from 1965 to 1984. The data has not been extended beyond 1990 in order to preserve the stationarity of the data, since rapid economic development and large-scale land uses have taken place in China since 1990.
Result Analyses
Correlation Analysis of Predictors
Previous reports have shown that the inclusion of additional antecedent meteorological variables, such as precipitation and temperature, in the statistical hydrological model increased streamflow forecast skill (Fan et al., 2016; Slater and Villarini, 2017). Therefore, in this study, meteorological variables for the current month, 1 month ahead, and 2 months ahead are used as predictors. The correlation coefficients between monthly streamflow and potential predictors are provided in Figure 3 and the corresponding values are supported in Table 1. From Figures 3A–C, it can be found that there are strong correlations (ranging from 0.51 to 0.91) between the antecedent meteorological variables and stream. For example, in station S1 (Yichang), temperature and vapor pressure 1 month ahead are the most correlated variables to monthly streamflow, with the highest correlation coefficient (i.e., 0.88 and 0.90). This result indicates a delay in the response of streamflow to meteorological variables. This may be related to the spatial variation of meteorological variables and the confluence time in the basin. The correlations between meteorological variables and streams between different stations are presented in Figures 3D–F, and . Strong correlations (ranging from 0.37 to 0.90) of monthly streamflow with the meteorological variables in surrounding stations are found. It is worth noting that there are strong correlations (greater than 0.86) between antecedent meteorological variables in Yichang station and the streamflow in Hankou and Datong stations. Similar results are thrown up between antecedent meteorological variables in Hankou station and the streamflow in Datong station. This may be related to the geographical location of the three stations. As shown in Figure 1, Yichang station, Hankou station, and Datong station are located in the upper, middle, and lower reaches of the Yangtze River respectively. Depending on the size and the topography of these basins, it takes days to months for the upstream precipitation to reach the downstream hydrological station through runoff generation and river confluence in the basin. Therefore, the strongest correlation is delayed in time. At the same time, according to the strong correlations, it can be inferred that the water resource in the lower reaches of the Yangtze River is seriously affected by incoming water from the upper reaches.
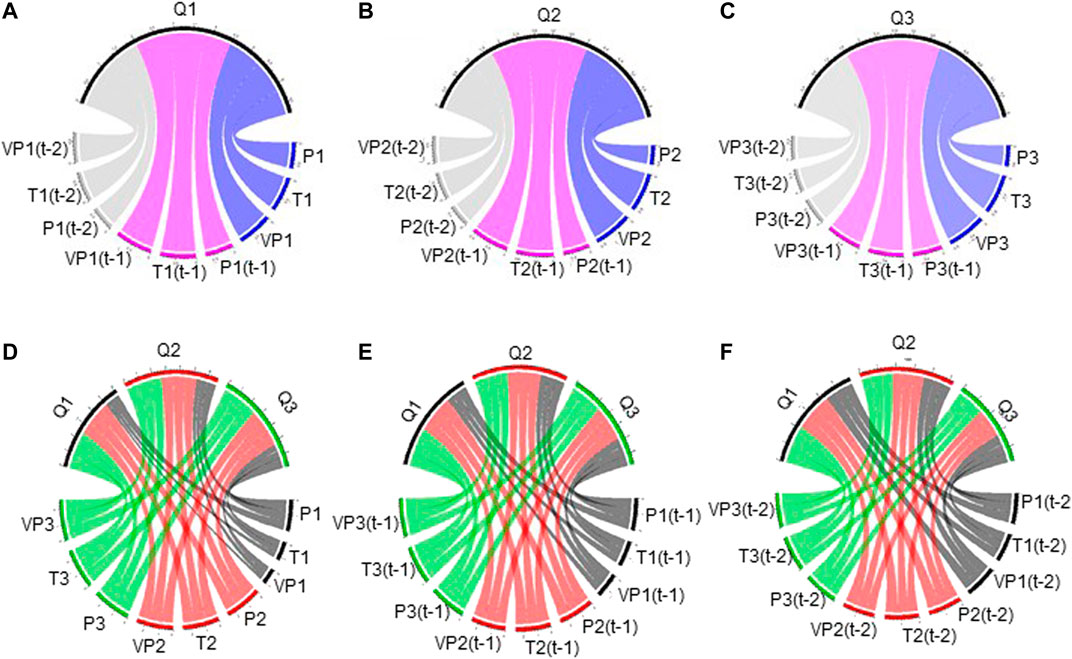
FIGURE 3. The correlation between predictors and streamflow. streamflow.[Note: (A), (B), and (C) present the correlation between predictors in different month ahead and stream. (D–F) present the correlation between predictors and streams between different stations. Predictors are defined in Table 2].

TABLE 1. The correlation between predictors and streamflow.
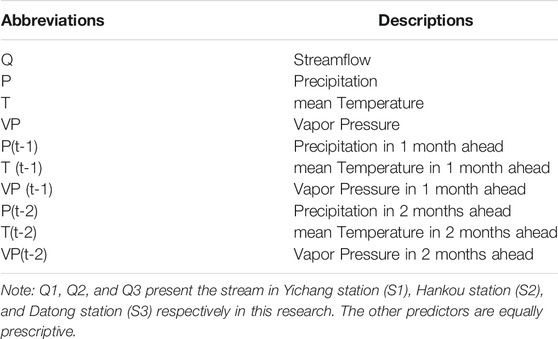
TABLE 2. Abbreviations and descriptions of predictors and predicated factors in SCAM.
Deterministic Prediction
The SCAH model is calibrated with the data from 1956 to 1975 and validated with the data from 1976 to 1985 in the Yangtze River watershed, using the abovementioned predictors. In detail, SCAH is established for only one predicted variable (i.e., streamflow for a particular station), calibrated using each station flow, and applied for the stream prediction of that station. A default significance level of 0.05 is chosen in SCAH since a 95% confidence level is acceptable for statistical testing. The generated cluster trees obtained from SCAH are presented in Figure 4. According to the generated cluster trees, streamflow of Yichang station, Hankou station, and Datong station could be predicted through forcing the predictors into three cluster trees respectively.
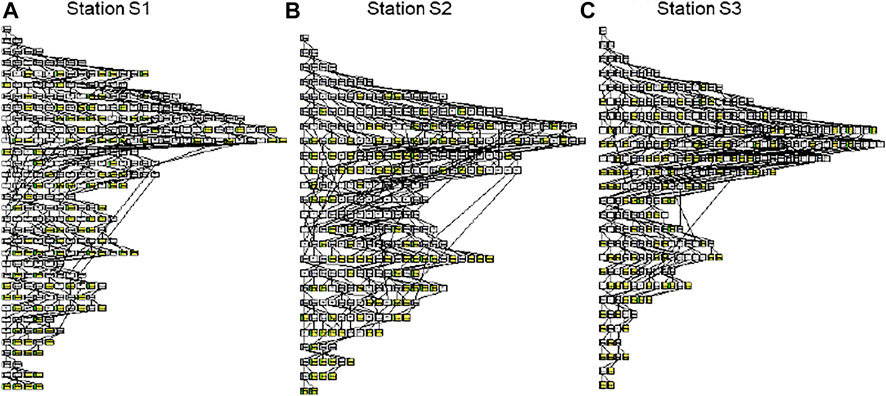
FIGURE 4. SCAH model cluster tree for (A) Station S1, (B) Station S2, and (C) Station S3. (p = 0.05 and yellow boxes indicate end nodes; Stations S1, S2, and S3 represent Yichang station, Hankou station, and Datong station).
Figure 5 shows the simulated and observed time series of monthly flow in three streamflow gauge stations during calibration and validation periods. The results show a good agreement of the observed and forecast hydrographs for SCAH, with slight under-prediction on some days (e.g., flood peak). The performance criteria of SCAH for the three stations are shown in Table 3. According to the five statistical coefficients, both the two schemes yielded acceptable simulation in all three stations. This result is consistent with previous studies (Fan et al., 2015; Li et al., 2015; Fan et al., 2016; Zhuang et al., 2016) which indicated that stepwise cluster analysis can provide reliable and efficient flow prediction. In the calibration period, measured and simulated monthly stream flows have a good match using the two schemes. The NSEs are larger than 0.94 and the CORs are larger than 0.96 with a slight difference between the three stations (Table 3). The difference between the two schemes is negligible in the calibration period. However, there are notable different performances observed between the three stations as well as the two schemes in the validation period. On the whole, the SCAH performs “good” (NSE >0.75) in three stations. In detail, using a single-site calibration approach, SCAH overestimates verification period runoff on S2 and S3 stations (Figure 5), with PBAIS <−3. The NSE ranges from 0.70 to 0.82, and COR varies from 0.84 to 0.90 across the three stations (Table 3). The lower average simulation error in SCAH can be observed through the lower MAE and RMSE values. Even both of the three stations which overestimated the streamflow during the validation period had negative PBIAS. The absolute PBIAS increased in the validation period, especially for station S3 (Datong station) where the absolute PBIAS increased from 0.14 to 4.78. The high NSE and COR, as well as the low MAE, RMSE, and PBAIS clearly indicate the superior hydrologic simulation of SCAH. This means that SCAH can reflect a comprehensive rainfall-runoff relationship, which considers the nonlinear and dynamic relationships between climate information and streamflow.
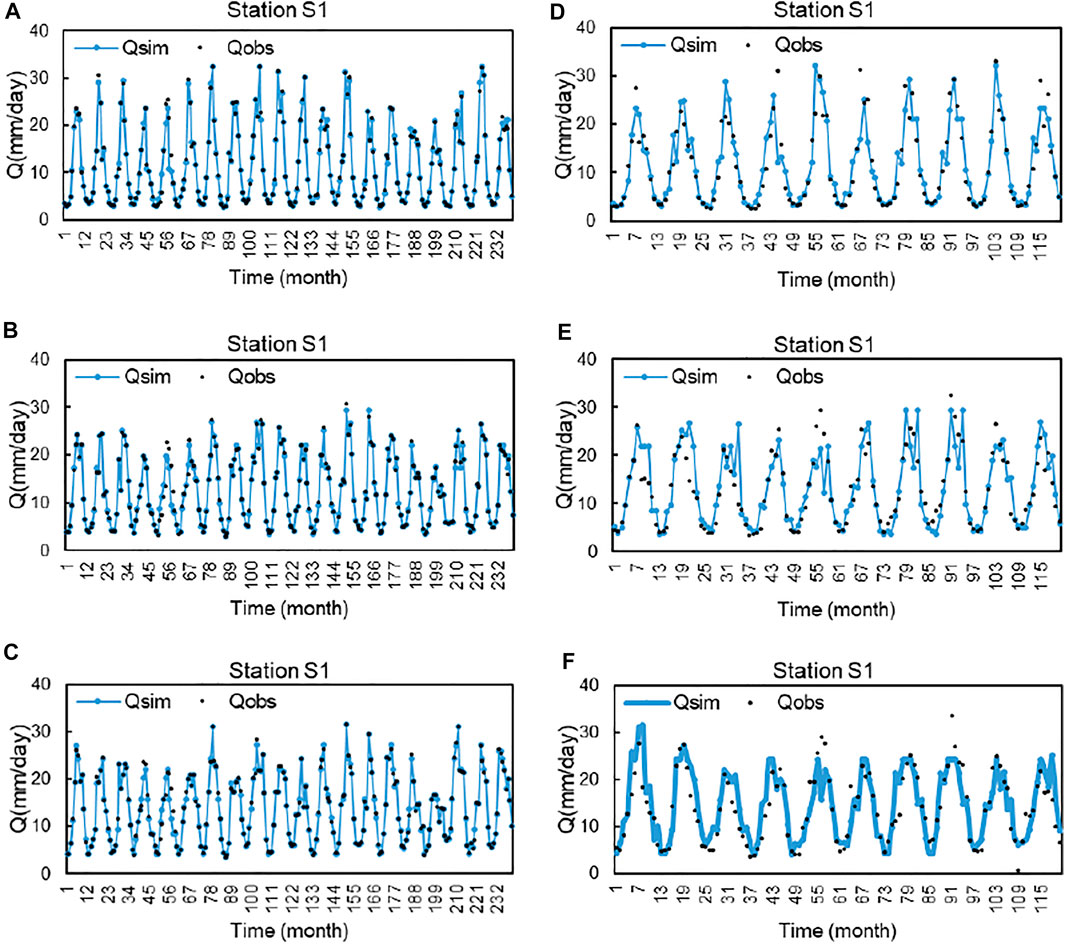
FIGURE 5. Comparison of streamflow simulated by SCAH (the blue lines) with measurement values (the black circle) in the Yangtze River watershed. (Note: the first column presents the calibration period and the second column presents the validation period. Station S1, S2, and S3 represent Yichang station, Hankou station, and Datong station).
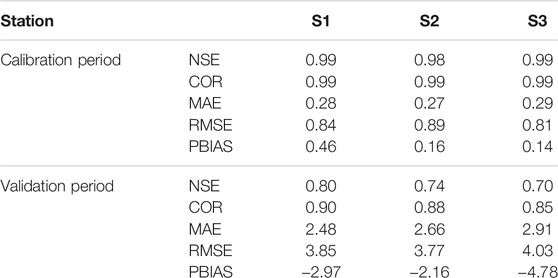
TABLE 3. Model performance of SCAH in Yangtze River watershed. (Note: Stations S1, S2, and S3 represent Yichang station, Hankou station, and Datong station).
Table 4 presents the SCAH model performance (NSE, COR, MAE, RMSE, and PBIAS) for Yichang station, Hankou station, and Datong station under different p levels for calibration and validation periods. It can be found that model representation of SCAH is sensitive to the p level. In the calibration period, as the p level rises, the model performance of SCAH tends to increase with increased NSE and COR values and decreased MAE and RMSE values; while SCAH has the best model performance when the p level equals 0.01 in the validation period. In detail, when p = 0.01, NSE and MAE values in station S1 are 0.90 and 1.61 in calibration and 0.83 and 2.18 invalidation respectively. When p = 0.10, the corresponding values are 0.99 and 0.28 in calibration and 0.80 and 2.47 in the validation respectively. This is because the higher p level means lower threshold values for cutting processes, leads to more cut actions, and corresponds to more leaf nodes (as shown in Table 4) and less variation in each leaf node, resulting in fewer deviations between predictions and observations in the calibration period. While in the validation period, the over-segmentation of leaf nodes did not lead to more accurate prediction results. In contrast, the deviation predictions and observations actually increased. Results also show that the sensitivity of different statistical indicators to p level is different, and PBIAS is the most sensitive indicator. COR and RMSE share similar trends with NSE and MAE, respectively. Therefore, the SCAH is suggested for monthly runoff prediction with a robust structural tree and better validation performance in terms of the five statistical coefficients with the three p levels evaluated in this study.
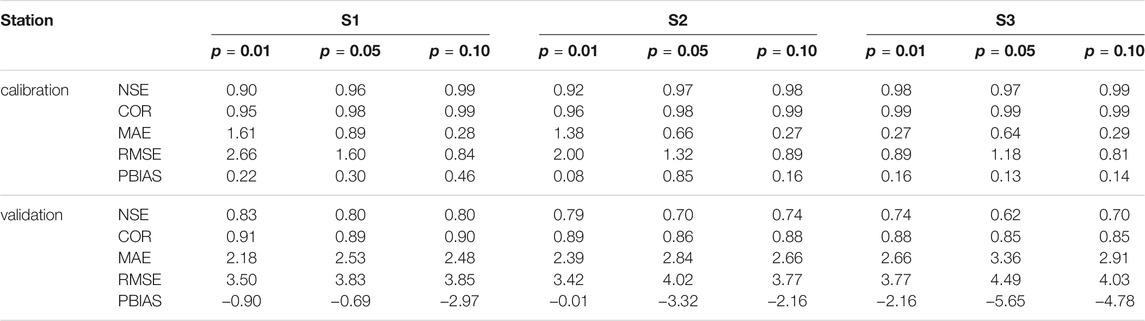
TABLE 4. Model performance of SCAH under different p levels. (Note: S1, S2, and S3 represent Yichang station, Hankou station, and Datong station).
Probabilistic Predictions
In the aforementioned study, the future deterministic prediction of streamflow was estimated using the mean value of the samples in the corresponding end node of the derived cluster tree. In fact, the proposed SCAH approach can also generate more results such as interval forecasting results (Fan et al., 2015; Li et al., 2015; Fan et al., 2016) using the maximum and minimum flow values of the end node, which can reflect uncertainties. The comparison of the forecasted intervals obtained through SCAH and observed monthly flow are presented in Figure 6. Through Figure 6, it can be seen that the forecasted intervals of SCAH can catch the fluctuations of actual monthly flow during the calibration period. Nearly all the observations are covered by the forecasting intervals. Moreover, the predicted intervals of SCAH are relatively large, especially for some peaks. During the validation period (Figures 6D–F), the forecasted intervals can generally cover the main part of observations in this period, except for some underestimates during high streamflow periods. This is because the prediction was conducted using a twenty-year training tree, which might not cover all the possible precipitation-runoff relationships, especially for the stream peak periods. Comparatively speaking, more observations are covered by the forecasting intervals obtained by SCAH with wider forecasted intervals. Generally, the results show an overall good agreement between observed data and predicted intervals.
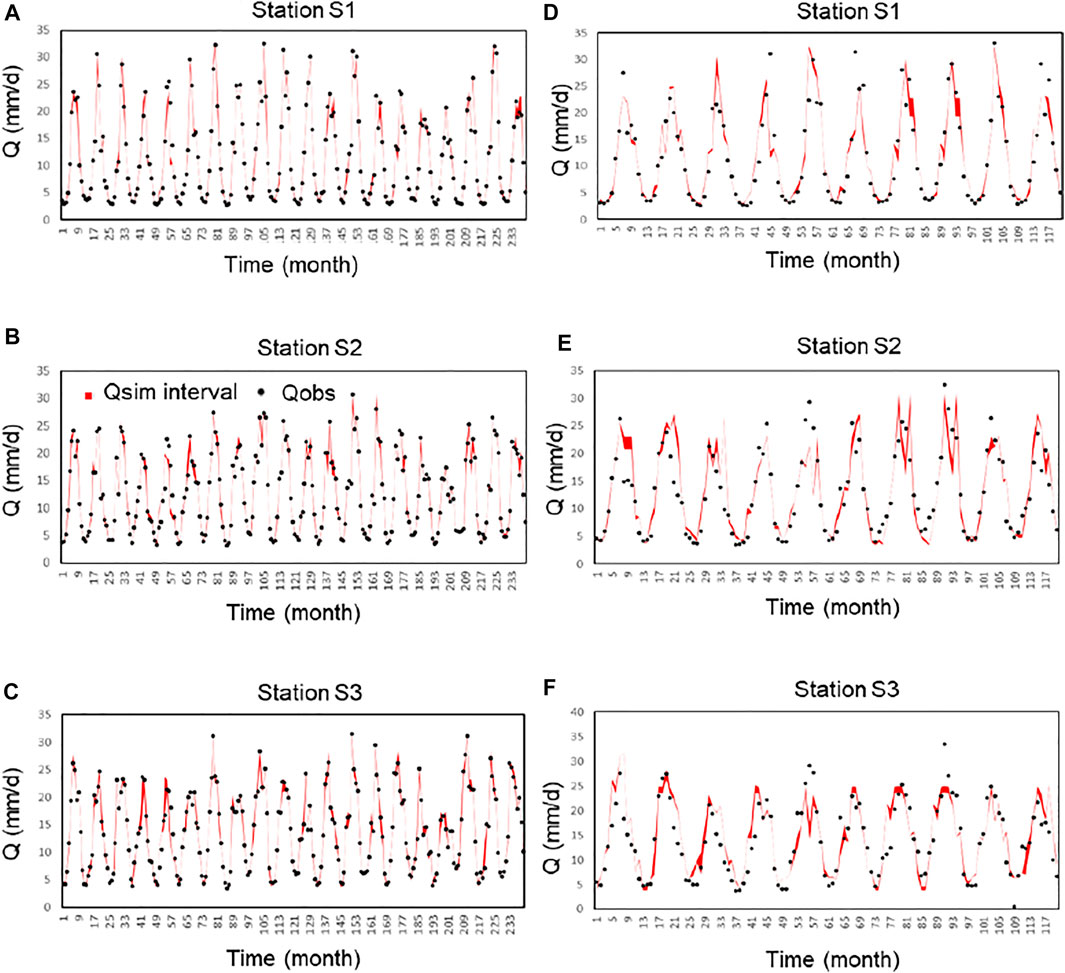
FIGURE 6. Comparison of forecasted intervals versus observed monthly flow using SCAH (the red areas) with measurement values (the black circle) in the Yangtze River watershed. (Note: the first column presents the calibration period and the second column presents the validation period. Station S1, S2, and S3 represent Yichang station, Hankou station, and Datong station).
The performance of SCAH (REIS, MREIS, and RF) for the calibration and validation periods using two calibration strategies are presented in Figure 7 and Figure 8. In the calibration period, the proportions of samples with absolute REIS smaller than 5% in thethree stations are 95.42, 96.25, and 97.92%, respectively for SCAH in Yichang station, Hankou station, and Datong station. As presented in Figure 8, the MREIS in the three stations are 1.15, 1.09, and 0.70%, respectively for SCAH during the calibration period. Moreover, among the 240 samples used for calibration, there are more than 226 samples where the observation value falls into its corresponding stream-flow interval estimated by the two calibration strategy, accounting for more than 94% of the total samples. On the whole, SCAH shows an insignificant performance in the calibration period. However, in the validation period, the proportions of samples with the absolute REIS smaller than 5% in Yichang station, Hankou station, and Datong station are 26.67, 20.83, and 28.33%, respectively. The MREIS in these three stations is 10.24, 11.73, and 21.69%, respectively. Moreover, SCAH can improve the ratio of observations falling into the interval solution. The RFs in the three stations are only 14.2, 7.50, and 12.5%, respectively for the SCAH in the three stations. The above results are sufficient to illustrate the advantages of SCAH to predict streamflow probability.
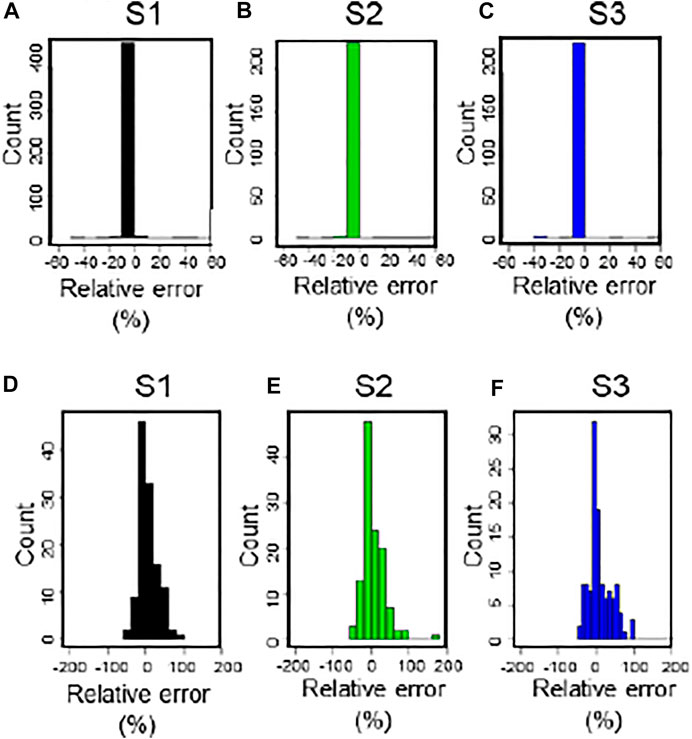
FIGURE 7. Histograms of REIS for the calibration period [i.e., (A–C)] and validation period [i.e., (D–F)]. (Note: S1, S2, and S3 represent Yichang station, Hankou station, and Datong station).
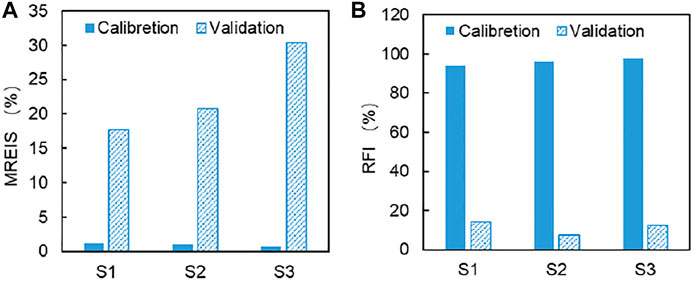
FIGURE 8. The performance (MREIS and RF) of SCAH for the calibration and validation periods. (Note: S1, S2, and S3 represent Yichang station, Hankou station, and Datong station).
Conclusion
Streamflow prediction is one of the most important topics in operational hydrology. The responses of runoffs are different among watersheds due to the diversity of climatic conditions as well as watershed characteristics. In this study, to characterize the hydrological process complicated with nonlinear and dynamic relationships, SCAH was developed and applied to predict the runoffs with regional climatic conditions over the Yangtze River watershed, China. The main conclusions are specified as follows: First, the performances of SCAH in both deterministic and probabilistic modeling are notable. Flexible data requirements, quick calibration, and reliable performances make SCAH an appealing tool in revealing rainfall-runoff relationships. Second, the SCAH is insensitive to p levels in monthly runoff prediction with a robust structural tree and good validation performance in terms of the five statistical coefficients evaluated in this study. Third, in terms of the case study of the Yangtze River watershed, it can be inferred that the water resources in the lower reaches of the Yangtze River are seriously affected by incoming water from the upper reaches according to the strong correlations.
The responses of runoffs may be different among watersheds due to the diversity of climatic conditions as well as watershed characteristics. This study has indicated that the developed SCAH approach can characterize such hydrological processes with complicated nonlinear and dynamic relationships and provide satisfactory predictions. This study provides a statistical hydrological model to simulate streamflow considering the nonlinear and dynamic relationships. On the other hand, a series of extensions, improvements, or applications can be conducted in future studies based on this study. For instance, considering multiple response variables may reflect the complex interaction and nonlinear relationship between climatic variables and streamflow in the environmental process. Although the proposed model has been applied to three watersheds in the Yangtze River watershed, including upper, middle, and lower reaches, results presented in this paper may be updated as more datasets (cases) become available and included. Our analysis can be strengthened by focusing on more catchments where more data are available. An obvious future step will also be the inclusion of the global catchments, rather than just in China where the available hydrologic data are very limited owing to data licensing issues.
Data Availability Statement
The original contributions presented in the study are included in the article/Supplementary Material, further inquiries can be directed to the corresponding author.
Author Contributions
GH: Conceptualization, supervision; YL: investigation; JX: review, revision, supervision; GW: funding acquisition; JZ: project administration; RD: review and editing; JR: visualization; All authors have read and agreed to the published version of the manuscript.
Funding
This research was supported by the National Key Research and Development Plan (2016YFA0601502) and the Natural Sciences Foundation (U2040212). All data used in this paper are available from https://www.bafg.de/GRDC/EN/02_srvcs/21_tmsrs/stationMaps.html?nn=201566 and http://data.cma.cn/. All computations are conducted in R and the related codes are available from the authors upon request.
Conflict of Interest
The authors declare that the research was conducted in the absence of any commercial or financial relationships that could be construed as a potential conflict of interest.
Publisher’s Note
All claims expressed in this article are solely those of the authors and do not necessarily represent those of their affiliated organizations, or those of the publisher, the editors and the reviewers. Any product that may be evaluated in this article, or claim that may be made by its manufacturer, is not guaranteed or endorsed by the publisher.
References
Bhadra, A., Bandyopadhyay, A., Singh, R., and Raghuwanshi, N. S. (2009). Rainfall-Runoff Modeling: Comparison of Two Approaches with Different Data Requirements. Water Resour. Manage. 24 (1), 37–62. doi:10.1007/s11269-009-9436-z
Chaudhuri, S., Roy, M., Roy, M., and Jain, A. (2020). Appraisal of WaSH (Water-Sanitation-Hygiene) Infrastructure Using a Composite Index, Spatial Algorithms and Sociodemographic Correlates in Rural India. J. Env Inform. 35 (1). doi:10.3808/jei.201800398
Chen, Y., Zhang, S., Huang, D., Li, B.-L., Liu, J., Liu, W., et al. (2017). The Development of China's Yangtze River Economic Belt: How to Make it in a green Way?. Sci. Bull. 62 (9), 648–651. doi:10.1016/j.scib.2017.04.009
Cheng, G., Dong, C., Huang, G., Baetz, B. W., and Han, J. (2016). Discrete Principal-Monotonicity Inference for Hydro-System Analysis under Irregular Nonlinearities, Data Uncertainties, and Multivariate Dependencies. Part I: Methodology Development. Hydrol. Process. 30 (23), 4255–4272. doi:10.1002/hyp.10909
D. N. Moriasi, D. N., J. G. Arnold, J. G., M. W. Van Liew, M. W., R. L. Bingner, R. L., R. D. Harmel, R. D., and T. L. Veith, T. L. (2007). Model Evaluation Guidelines for Systematic Quantification of Accuracy in Watershed Simulations. Trans. ASABE 50 (3), 885–900. doi:10.13031/2013.23153
Duan, R., Huang, G., Li, Y., Zhou, X., Ren, J., and Tian, C. (2021). Stepwise Clustering Future Meteorological Drought Projection and Multi-Level Factorial Analysis under Climate Change: A Case Study of the Pearl River Basin, China. Environ. Res. 196, 110368. doi:10.1016/j.envres.2020.110368
Fan, Y., Huang, K., Huang, G., Li, Y., and Wang, F. (2020). An Uncertainty Partition Approach for Inferring Interactive Hydrologic Risks. Hydrol. Earth Syst. Sci. 24 (9), 4601–4624. doi:10.5194/hess-24-4601-2020
Fan, Y. R., Huang, G. H., Li, Y. P., Wang, X. Q., and Li, Z. (2016). Probabilistic Prediction for Monthly Streamflow through Coupling Stepwise Cluster Analysis and Quantile Regression Methods. Water Resour. Manage. 30 (14), 5313–5331. doi:10.1007/s11269-016-1489-1
Fan, Y. R., Huang, W., Huang, G. H., Li, Z., Li, Y. P., Wang, X. Q., et al. (2015). A Stepwise-Cluster Forecasting Approach for Monthly Streamflows Based on Climate Teleconnections. Stoch Environ. Res. Risk Assess. 29 (6), 1557–1569. doi:10.1007/s00477-015-1048-y
Gaume, E., and Gosset, R. (2003). Over-parameterisation, a Major Obstacle to the Use of Artificial Neural Networks in Hydrology?. Hydrol. Earth Syst. Sci. 7 (5), 693–706. doi:10.5194/hess-7-693-2003
Gupta, H. V., Sorooshian, S., and Yapo, P. O. (1999). Status of Automatic Calibration for Hydrologic Models: Comparison with Multilevel Expert Calibration. J. Hydrol. Eng. 4 (2), 135–143. doi:10.1061/(ASCE)1084-0699
Han, J.-C., Huang, Y., Li, Z., Zhao, C., Cheng, G., and Huang, P. (2016). Groundwater Level Prediction Using a SOM-Aided Stepwise Cluster Inference Model. J. Environ. Manag. 182, 308–321. doi:10.1016/j.jenvman.2016.07.069
Hayashi, S., Murakami, S., Watanabe, M., and Bao-Hua, X. (2004). HSPF Simulation of Runoff and Sediment Loads in the Upper Changjiang River Basin, China. J. Environ. Eng. 130 (7), 801–815. doi:10.1061/(ASCE)0733-9372
Huang, G. (1992). A Stepwise Cluster Analysis Method for Predicting Air Quality in an Urban Environment. Atmos. Environ. B. Urban Atmosphere 26 (3), 349–357. doi:10.1016/0957-1272(92)90010-P
Huang, G. H., Huang, Y. F., Wang, G. Q., and Xiao, H. N. (2006). Development of a Forecasting System for Supporting Remediation Design and Process Control Based on NAPL-Biodegradation Simulation and Stepwise-Cluster Analysis. Water Resour. Res. 42 (6). doi:10.1029/2005WR004006
Huang, J., Zhang, J., Zhang, Z., Xu, C., Wang, B., and Yao, J. (2011). Estimation of Future Precipitation Change in the Yangtze River basin by Using Statistical Downscaling Method. Stoch Environ. Res. Risk Assess. 25 (6), 781–792. doi:10.1007/s00477-010-0441-9
Kong, L., Zheng, H., Rao, E., Xiao, Y., Ouyang, Z., and Li, C. (2018). Evaluating Indirect and Direct Effects of Eco-Restoration Policy on Soil Conservation Service in Yangtze River Basin. Sci. total Environ. 631-632, 887–894. doi:10.1016/j.scitotenv.2018.03.117
Li, Z., Huang, G., Han, J., Wang, X., Fan, Y., Cheng, G., et al. (2015). Development of a Stepwise-Clustered Hydrological Inference Model. J. Hydrol. Eng. 20 (10), 04015008. doi:10.1061/(ASCE)HE.1943-5584.0001165
Li, Z., Li, J. J., and Shi, X. P. (2020). A Two-Stage Multisite and Multivariate Weather Generator. J. Environ. Inform. 35 (2), 148–159. doi:10.3808/jei.201900424
Liu, Y., Guo, J., Sun, H., Zhang, W., Wang, Y., and Zhou, J. (2016). Multiobjective Optimal Algorithm for Automatic Calibration of Daily Streamflow Forecasting Model. Math. Probl. Eng. doi:10.1155/2016/8215308
Ma, M., Ren, L., Singh, V. P., Yuan, F., Chen, L., Yang, X., et al. (2016). Hydrologic Model-Based Palmer Indices for Drought Characterization in the Yellow River basin, China. Stoch Environ. Res. Risk Assess. 30 (5), 1401–1420. doi:10.1007/s00477-015-1136-z
Nash, J. E., and Sutcliffe, J. V. (1970). River Flow Forecasting through Conceptual Models Part I - A Discussion of Principles. J. Hydrol. 10 (3), 282–290. doi:10.1016/0022-1694(70)90255-6
Ordieres-Meré, J., Ouarzazi, J., El Johra, B., and Gong, B. (2020). Predicting Ground Level Ozone in Marrakesh by Machine-Learning Techniques. J. Environ. Inform. 36 (2), 93–106. doi:10.3808/jei.202000437
Rao, C. R., Rao, C. R., Statistiker, M., Rao, C. R., and Rao, C. R. (1973). Linear Statistical Inference and its Applications, 2. New York: Wiley. doi:10.1112/jlms/s1-42.1.382b
Slater, L., and Villarini, G. (2017). Evaluating the Drivers of Seasonal Streamflow in the U.S. Midwest. Water 9 (9), 695. doi:10.3390/w9090695
Solomatine, D. P., and Ostfeld, A. (2008). Data-driven Modelling: Some Past Experiences and New Approaches. J. hydroinformatics 10 (1), 3–22. doi:10.2166/hydro.2008.015
Sun, H., Gui, D., Yan, B., Liu, Y., Liao, W., Zhu, Y., et al. (2016). Assessing the Potential of Random forest Method for Estimating Solar Radiation Using Air Pollution index. Energ. Convers. Manage. 119, 121–129. doi:10.1016/j.enconman.2016.04.051
Sun, J., Li, Y. P., Gao, P. P., Suo, C., and Xia, B. C. (2018). Analyzing Urban Ecosystem Variation in the City of Dongguan: A Stepwise Cluster Modeling Approach. Environ. Res. 166, 276–289. doi:10.1016/j.envres.2018.06.009
Wang, F., Huang, G., Cheng, G., and Li, Y. (2021b). Multi-level Factorial Analysis for Ensemble Data-Driven Hydrological Prediction. Adv. Water Resour. 153, 103948. doi:10.1016/j.advwatres.2021.103948
Wang, F., Huang, G. H., Cheng, G. H., and Li, Y. P. (2021a). Impacts of Climate Variations on Non-stationarity of Streamflow over Canada. Environ. Res. 197, 111118. doi:10.1016/j.envres.2021.111118
Wang, F., Huang, G. H., Fan, Y., and Li, Y. P. (2021c). Development of Clustered Polynomial Chaos Expansion Model for Stochastic Hydrological Prediction. J. Hydrol. 595, 126022. doi:10.1016/j.jhydrol.2021.126022
Wang, F., Huang, G. H., Fan, Y., and Li, Y. P. (2020). Robust Subsampling ANOVA Methods for Sensitivity Analysis of Water Resource and Environmental Models. Water Resour. Manage. 34 (10), 3199–3217. doi:10.1007/s11269-020-02608-2
Wang, X., Huang, G., Lin, Q., Nie, X., Cheng, G., Fan, Y., et al. (2013). A Stepwise Cluster Analysis Approach for Downscaled Climate Projection - A Canadian Case Study. Environ. Model. Softw. 49, 141–151. doi:10.1016/j.envsoft.2013.08.006
Willmott, C., and Matsuura, K. (2005). Advantages of the Mean Absolute Error (MAE) over the Root Mean Square Error (RMSE) in Assessing Average Model Performance. Clim. Res. 30 (1), 79–82. doi:10.3354/cr030079
Xie, W. P., Yang, J., Yang, J. S., Yao, R. J., and Wang, X. P. (2020). Impact Study of Impoundment of the Three Gorges Reservoir on Salt-Water Dynamics and Soil Salinity in the Yangtze River Estuary. J. Environ. Inform. 36 (1). doi:10.3808/jei.202000432
Yu, B. Y., Wu, P., Wu, P., Sui, J., Ni, J., and Whitcombe, T. (2020). Variation of Runoff and Sediment Transport in the Huai River - A Case Study. J. Environ. Inform. 35 (2). doi:10.3808/jei.202000429
Zhang, J., Li, Y., Huang, G., Chen, X., and Bao, A. (2016). Assessment of Parameter Uncertainty in Hydrological Model Using a Markov-Chain-Monte-Carlo-Based Multilevel-Factorial-Analysis Method. J. Hydrol. 538, 471–486. doi:10.1016/j.jhydrol.2016.04.044
Zhang, Q., Liu, C., Xu, C.-y., Xu, Y., and Jiang, T. (2006). Observed Trends of Annual Maximum Water Level and Streamflow during Past 130 Years in the Yangtze River basin, China. J. Hydrol. 324 (1-4), 255–265. doi:10.1016/j.jhydrol.2005.09.023
Zhang, Y., Sun, A., Sun, H., Gui, D., Xue, J., Liao, W., et al. (2019). Error Adjustment of TMPA Satellite Precipitation Estimates and Assessment of Their Hydrological Utility in the Middle and Upper Yangtze River Basin, China. Atmos. Res. 216, 52–64. doi:10.1016/j.atmosres.2018.09.021
Keywords: stepwise cluster analysis hydrological model, streamflow prediction, statistical hydrological, yangtze river watershed, climate change
Citation: Wang F, Huang G, Li Y, Xu J, Wang G, Zhang J, Duan R and Ren J (2021) A Statistical Hydrological Model for Yangtze River Watershed Based on Stepwise Cluster Analysis. Front. Earth Sci. 9:742331. doi: 10.3389/feart.2021.742331
Received: 16 July 2021; Accepted: 06 September 2021;
Published: 21 September 2021.
Edited by:
Shan Zhao, Shandong University, ChinaReviewed by:
Mei Xuefei, East China Normal University, ChinaHuaiwei Sun, Huazhong University of Science and Technology, China
Copyright © 2021 Wang, Huang, Li, Xu, Wang, Zhang, Duan and Ren. This is an open-access article distributed under the terms of the Creative Commons Attribution License (CC BY). The use, distribution or reproduction in other forums is permitted, provided the original author(s) and the copyright owner(s) are credited and that the original publication in this journal is cited, in accordance with accepted academic practice. No use, distribution or reproduction is permitted which does not comply with these terms.
*Correspondence: Guohe Huang, aHVhbmdnQHVyZWdpbmEuY2E=