 Wanqin Guo
 Xiaojun Guo1
 Yushuo Liu
 Jing Li
 Donghui Shangguan
95% of researchers rate our articles as excellent or good
Learn more about the work of our research integrity team to safeguard the quality of each article we publish.
Find out more
ORIGINAL RESEARCH article
Front. Earth Sci. , 04 November 2021
Sec. Cryospheric Sciences
Volume 9 - 2021 | https://doi.org/10.3389/feart.2021.740160
This article is part of the Research Topic Debris-Covered Glaciers: Formation, Governing Processes, Present Status and Future Directions View all 20 articles
Debris-covered glaciers are an important glacier type and have attracted more and more attention. This study presents the results of ablation patterns of debris-covered tongue of the Halong Glacier in the northeastern Tibetan Plateau, by using two repeated unmanned aerial vehicle (UAV) surveys performed on August 11 and September 15, 2019. The results show that the tongue of Halong Glacier has experienced strong ablation during the surveyed period, with an overall ice loss amount to 4.17 × 10⁵ metric tons. Among all the briefly classified surface types, supraglacial debris has the largest area (80.9%) and also mass losses (58.6%) comparing to others. However, ice cliffs show the strongest and the most significant ablation rates (averagely 1.36 and 1.22 m w.e. for supraglacial and lateral ice cliffs, respectively), followed by clean ice regions (1.01 m w.e.). The backwastes of ice cliffs also resulted in up to 7.8 m horizontal back-off at different parts of Halong Glacier, lead to fast terminal retreat and narrowing down of the glacier tongue, and may result in the break off of Halong Glacier tongue into separated parts in the future. The surface ablation rates show a clear negative exponential relationship with the measured debris thicknesses, well in accordance with previous studies. Regions in cutting and flushing by supraglacial and lateral rivers have the largest surface elevation decreases but are not significant due to their limited area and the relatively lower quality of UAV digital surface models (DSMs) in those covered regions.
Debris-covered glaciers are one of the major types of glaciers worldwide, which are covered by varying extents and thicknesses of debris formed by different sources of sediments with diverse grain sizes (Bozhinskiy et al., 1986). Although almost all mountain glaciers are covered by at least thin or sparsely distributed surface debris, only parts of them with distinctive debris covers can be recognized by remote sensing, and thus were classified as debris-covered glaciers. A recent study by Herreid and Pellicciotti (2020) has revealed that about 44% of the world’s mountain glaciers are debris-covered, which was identified through Landsat imagery, while the debris-covered glacier area only accounts for 7.3% of all mountain glacier area.
Global warming during the last decades has caused significant mass losses on global glaciers (e.g., Marzeion et al., 2018; Wouters et al., 2019; Vargo et al., 2020). Previous studies found that different thicknesses of debris covers have distinctive effects on glacier ablation, in which thin debris (<0.5–2 cm) can strengthen the ice ablation while thicker debris will provide some protection to the ablation processes (Østrem, 1959; Mattson et al., 1993). However, like clean-ice glaciers, it was proved that debris-covered glaciers also experienced dramatic mass losses in response to the warming climate (e.g., Glasser et al., 2016; Pratibha and Kulkarni, 2018). Moreover, some studies have further illustrated that the debris-covered glaciers have a similar magnitude of mass loss with adjacent clean-ice glaciers, leading to a so-called “debris-cover anomaly” (Pellicciotti et al., 2015; Vincent et al., 2016; Salerno et al., 2017). Therefore, large discrepancies still exist in the knowledge acquired on the evolutions of debris-covered glaciers and their disparities with clean-ice glaciers, in which the limited accuracies and large inconsistencies of the data (in-situ observations versus remote sensing techniques) used in those studies is one major reason.
The fast developments of unmanned aerial vehicle (UAV) survey techniques during the last 2 decades have provided new opportunities to the glacier monitoring works (Pajares, 2015; Gaffey and Bhardwaj, 2020). The major advantages of UAV measurements include the accuracy and spatial resolution (Gindraux et al., 2017), and also flexibility in operation time. Therefore, the application of UAV on glacier monitoring has developed quickly during the last decades; more and more researchers have used this technique in glacier change studies, such as glacier topography (Bliakharskii et al., 2019; Ewertowski et al., 2019), mass balance (Wigmore and Mark, 2017; Bash and Moorman, 2020; Che et al., 2020), surface features (Crocker et al., 2012; Fugazza et al., 2015; Kraaijenbrink P. et al., 2016; Florinsky and Bliakharskii, 2019), velocities (Kraaijenbrink P. D. A. et al., 2016; Benoit et al., 2019; Jouvet et al., 2020), and temperatures (Kraaijenbrink et al., 2018).
Some researchers applied the UAV survey to debris-covered glacier change studies. Kraaijenbrink P. et al. (2016) have used UAV imagery to map the surface features on a debris-covered glacier, which can result in a 6 cm spatial resolution. Wigmore and Mark (2017) monitored the glacier dynamics via repeated UAV surveys and found highly heterogeneous patterns of glacier change in the Cordillera Blanca, Peru. Kraaijenbrink et al. (2018) further used a UAV vehicle that carried a thermal infrared sensor to measure the surface temperature of a debris-covered glacier in the New Zealand Alps. Che et al. (2020) used orhtomosaic and DEM from two repetitive UAV surveys to study the summer mass balance of Baishui River Glacier No.1 in Southern China. Therefore, the UAV survey technique has been proved to have great potential for debris-covered glacier monitoring and their change studies.
This study used two repetitive surveys via a UAV device with a 1-month interval in 2019, to study the ablation patterns of the debris-covered tongue of the Halong Glacier. The major objectives of this study are to understand the short-term ablation patterns of Halong Glacier among different surface types, investigate their relationships with the debris thickness and surface topography of Halong Glacier, and provide more knowledge on the temporal and spatial evolutions of debris-covered glaciers.
The Halong Glacier is located on the Anye Machen Mountain (also called Amney Machen Mountain; see Paul, 2019) in the northeastern Tibetan Plateau. According to the second Chinese glacier inventory (Guo et al., 2015), there were 74 glaciers on Anye Machen, with a total area of 102.7 km2 in 2009 (see Figure 1B). Halong Glacier is the largest glacier in this region, with an area of 20.06 km2 in 2017. It consists of two major branches, of which the south branch is longer and has a length of ∼7.8 km (Figure 1C). The records of an automatic weather station (AWS) installed at a site (4,437 m a.s.l; LT-GCP3 in Figure 1C) on the end moraine of Halong Glacier in 2014 show that the recent mean annual temperature near the glacier terminus is −3.1°C. The precipitation observation at the AWS site since 2017 also shows that this region has up to 750 mm annual precipitation, indicating that the Halong Glacier has a relatively large accumulation and ablation rate. About the lowest 3 km of the tongue of Halong Glacier is covered by debris (1.70 km2 in total) with variant thickness and abundant typical surface features of normal debris-covered glaciers, e.g., ice cliffs, supraglacial ponds, etc. (Figure 2A).
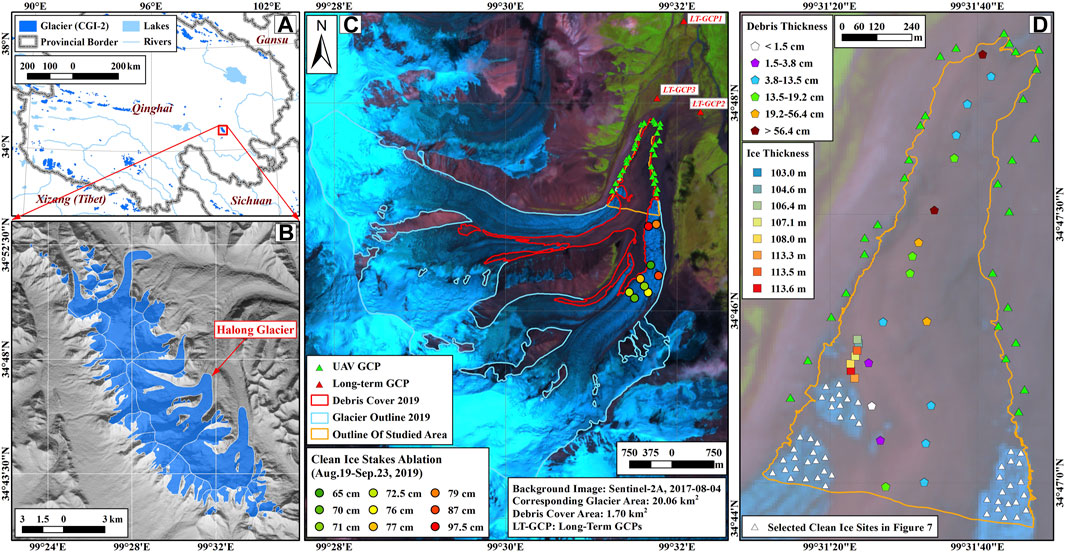
FIGURE 1. Location of Halong Glacier (A,B), distribution of UAV GCPs and ablations of installed stakes in clean ice region (C), and distribution of measured debris (on May 24, 2019) and ice (on October 2, 2016; only at selected sites) thickness (D).
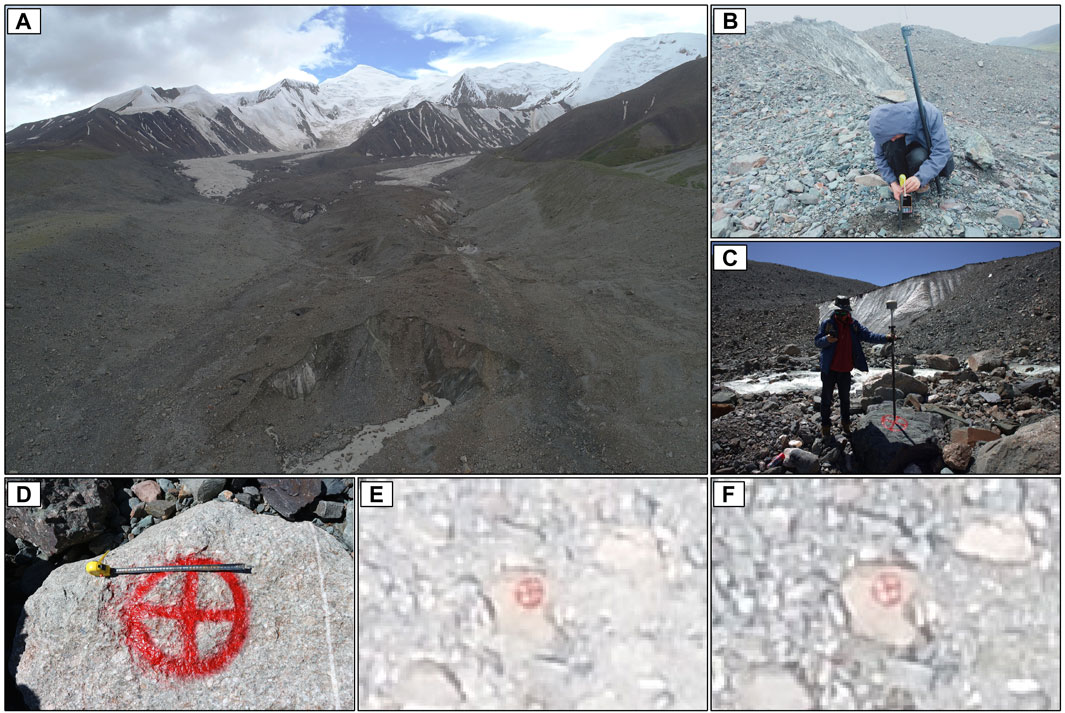
FIGURE 2. Field photos of Halong Glacier (A), measurements of debris thickness (B) and UAV GCP (C) and their painting (D), as well as the same point photoed by UAV at ∼50 m height on August 11 (E) and September 15 (F).
Yang et al. (2003) have studied the glacier change of Anye Machen during 1965-2000, which revealed that glaciers in this region has shrunk 17.3% in that period. Glaciers in this region can be regarded as in unstable status since the Halong Glacier has advanced or surged between 1965 and 2000 (Yang et al., 2003) and the nearby Yehelong Glacier also surged during 2000-2013 (Jiang et al., 2018). Another glacier has even repeatedly collapsed which was caused by surges and led to a certain level of hazards (Paul, 2019). The study by Jiang et al. (2018) further illustrated that the glaciers of Anye Machen had a negative mass balance during 2000-2013, the surface elevation of Halong Glacier has averagely decreased 8.73 ± 3.70 m, which proved that Halong Glacier was in strong melt in the last decades.
The UAV used in this study is the Phantom 4 Pro V2.0 manufactured by DJ-Innovations (DJI), which was a reliable low-cost consumer-level drone and widely used in UAV-based studies (e.g., Che et al., 2020; Hsu et al., 2020; Pearce et al., 2020; Fraser et al., 2021). It carries a 24 mm/F2.8, 20 megapixel single-lens digital camera, corresponding to 2.5–3 cm ground resolution at 50 m flight height. One battery of the Phantom 4 Pro V2.0 can support ∼15 min of flight at 4,500 m a.s.l. in summer, which can cover ∼1.8 × 10⁵ m2 ground area at the flight height of 50 m with ∼80% overlapping rate for captured photos.
Two UAV surveys were scheduled and performed in 2019, one on August 11 and another on September 15. UAV survey on August 11 has 10 flights, while September 15 has 9 flights, to cover the lower ablation area of the Halong Glacier. The camera angles were set to nadir view (90°) in all flights. The drone heights were all set to 50 m at each take-off point to make sure the drone obtaining sufficient spatial resolution.
On August 11, 30 GCPs (see Figures 2C–F for their collections) used in UAV surveying were painted and their coordinates simultaneously measured. To make sure they could be used for a longer time, sites were chosen on relatively stable locations, i.e., on boulders or larger stones located outside the active region of Halong Glacier (see Figures 1C,D). The marks of control points are circles (∼30 cm diameter) with a cross inside and lacquered by oil paint (See Figure 2D), which means they could be easily found in the UAV photos (Figures 2E,F) and existed for more than 1 year.
The coordinates of the GCPs were measured by a HUACE I70 Real-Time Kinematic Global Navigation Satellite System (RTK/GNSS; Figure 2C). The system includes two GNSS antennas, one fixed as the base station and another as the mobile measuring station. The RTK/GNSS survey was referred to and rigorously adjusted by three long-term GCPs surveyed and fixed deep in the ground during 2013-2015 (see Figure 1C for locations, LT-GCP1 to LT-GCP3). The coordinates of the long-term GCPs were rigorously determined by polygonometrical geodetic surveying method via static GNSS measurements by six HUACE T5 GNSS antennas. The horizontal and vertical coordinates for the three long-term GCPs were rigorously resolved. The positioning errors are less than ±10 mm horizontally and ±15 mm vertically, which can result in sufficient precision for all new UAV GCPs.
The Pix4D® photogrammetry software was used to process all the UAV photos following the typical procedures. The ground resolutions was set to 3 cm for the output DSMs, which can best reflect ground resolution at the flight height of ∼50 m for both UAV surveys. Before the fully automatic processing of Pix4D, all 30 GCPs were firstly stung onto the related photos by finding the cross center of each painted mark on UAV photos, which may only have a relative horizontal error of ∼±2 cm because of the high resolution and narrow width of the painted ground marks (Figure 2D). Figures 3A,B show the final mosaicked UAV images on August 11 and September 15, respectively, and Figure 3C shows the generated DSM (shaded) on September 15.
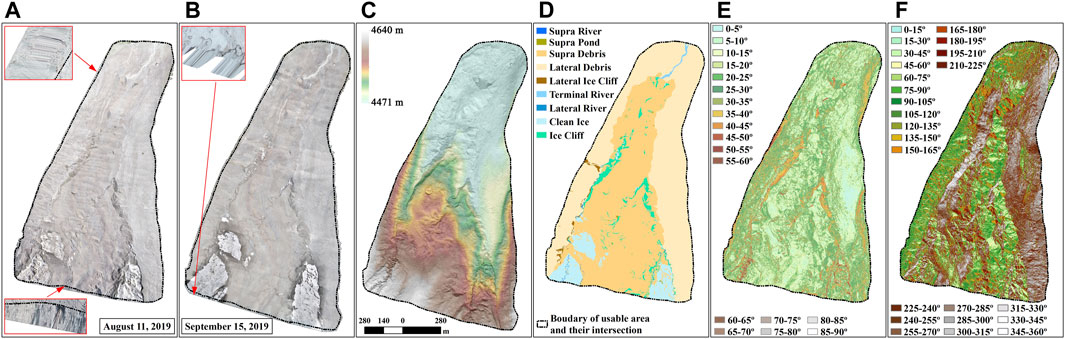
FIGURE 3. The mosaicked UAV images on August 11 (A) and September 15 (B), and the shaded DSM (C), vectorized and manually modified surface classification (D), slope (E), and aspect (F) classes, all from image and DSM on September 15. Insets in A and B show the artifacts exist along the edges of the UAV surveyed region which were excluded from the studied area by the manually digitized boundaries (dash-dot lines).
To better describe the ablation pattern of different surface types and provide an overview on the influences of different surface types on the glacier ablation, we performed a brief image classification on the mosaicked UAV image obtained on September 15 by using image segmentation algorithm in ERDAS Imagine®. The basic logic of image segmentation is to divide the image into sub-regions with similar reflectance (pixel values). We used the default parameters suggested by ERDAS Imagine® in this step, i.e. minimal pixel value differences of 15 and variance factor of 3.5. The segmented image was then vectorized and intensively manually edited referring to the UAV image on September 15, by merging small embedded patches into surrounding larger ones. All the image segments were attributed into nine surface types, i.e. clean ice, ice cliff, supra debris, supra river, supra pond, lateral debris, lateral river, lateral ice cliff, and terminal river. The lateral debris refers to those slope surfaces on the paleo lateral moraine aside the active glacier margin (the left and right side steep slopes in Figure 2A), which are mostly separated from the active glacier by lateral rivers or ice cliffs. Although there are possibly some inactive buried ices under the surface of the lateral debris, especially those regions on the two sides of the glacier tongue which are illustrated by DSM difference in Figure 4A, they cannot be identified through UAV photos or even by on-site investigations. The lateral ice cliff represents those apparently exposed ice cliffs that mainly appear on the southeast facing left side of Halong Glacier. The final classification was shown in Figure 3D.
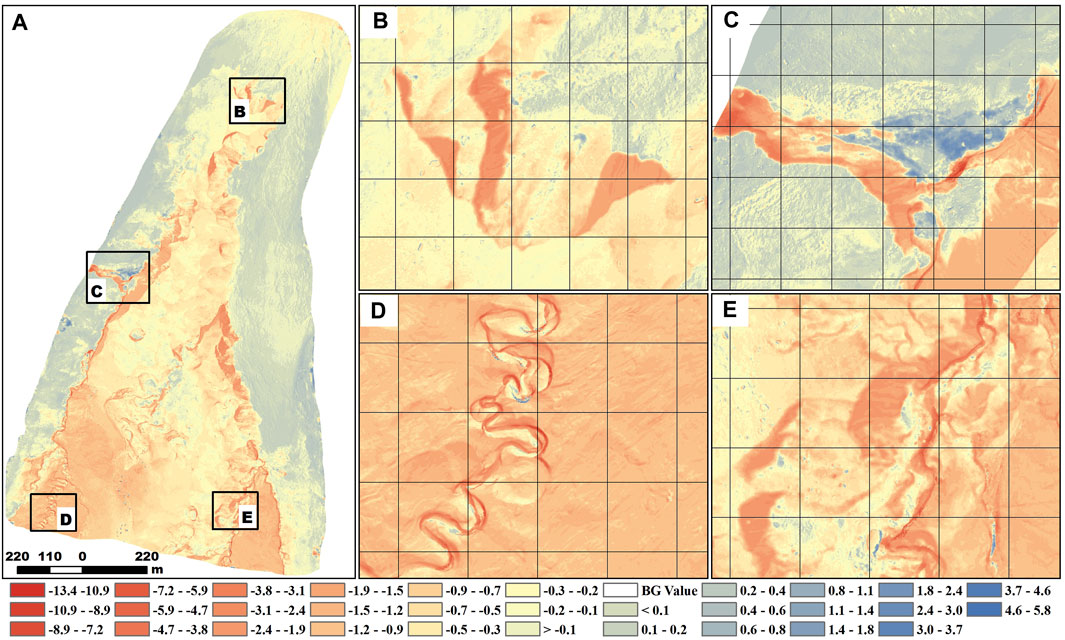
FIGURE 4. Elevation difference subtracted by DSMs on September 15 minus August 11, with spatial resolution in 3 cm. Rectangles in (A) mark the locations of glacier terminus (B), region with the largest surface uplift (C), supraglacial river channels in (D) and aside (E) clean ice regions. All gridlines shown as scale reference are in 30 m intervals..
To better illustrate the horizontal surface change of Halong Glacier, we used the following formulas to convert the vertical elevation differences into equivalent X and Y retreats on steep terrain (slope >45°), by using simple geometric transformation based on terrain slopes and aspects calculated from DSM on September 15.
Where
Simultaneous debris thickness measurement was not performed in 2019. Since the debris thickness will not have significant change annually (Bozhinskiy et al., 1986), we briefly measured the debris thickness on May 24, 2021 (see Figure 2B, and Supplementary Figure S1 for samples of debris thickness at several sites) at 23 sites on the debris-covered tongue of Halong Glacier, to study the influences of debris thickness on the ablations of the debris-covered tongue of Halong Glacier. The debris thicknesses varied significantly along the ablation area of the Halong Glacier tongue (see Figure 1D), where the minimum measured thickness is only 1.5 cm, while the underlying ice at two of the sites cannot be uncovered even after 1 m of digging. The location of these digging sites was also measured by HUACE I70 GNSS at the same time to precisely correlate them with the ablation rates retrieved.
We employed the cross-validation method to briefly assess the accuracy of the generated DSMs, in which the three-dimensional mismatches of the final processed UAV results were checked using the coordinates of the 30 GCPs by calculating the difference between the coordinates of those GCPs measured by RTK/GNSSS and on corresponding UAV images and DSMs. The results show that the mean coordinate differences and standard deviations on August 11 are 1.19 cm/±8.12 cm for X, 0.83 cm/±2.40 cm for Y, and −3.74 cm/±4.52 cm for Z. The same values on September 15 are 0.24 cm/±5.45 cm for X, 0.37 cm/±5.37 cm for Y, and −1.12 cm/±6.55 cm for Z. Although the standard deviations of elevations (Z value), which can be regarded as the error of the generated DSMs (Zhilin, 1988; Fisher, 1998), are slightly larger than the image spatial resolution used (3 cm), the centimeter-scale error will not have significant influences on the meter-scale surface elevation change as well the retrieved ablation patterns.
Figure 4 shows the elevation difference subtracted by two mosaicked DSMs (September 15 min August 11). It clearly illustrated the strong ablation of Halong Glacier between August 11 and September 15, 2019. The maximum elevation decrease of all surveyed regions can reach up to 13.4 m, while some regions also show certain levels of uplift up to 5.8 m. From the smaller zoomed maps in Figure 4, we can clearly identify that the largest elevation lowering happens on the ice cliffs aside the glacier tongue and also the lateral ice cliffs outside the margin of the active glacier.
Table 1 shows the average elevation differences for different surface types as well the corresponding ice losses by supposing an ice density of 850 kg/m3 (Huss, 2013). From Table 1, we can read that the total glacier area (exclude periglacial area covered by lateral debris and terminal river in Figure 3D) covered commonly by both UAV surveys is 0.79 km2, in which the major part (80.9%) was covered by supraglacial debris, while the rest of the area was mainly covered by clean ice (11.4%) and ice cliffs (6.3%). Our study shows that the overall mass loss between August 11 and September 15 in 2019 among the surveyed region of Halong Glacier is 417,158 tons w. e., in which 58.6%, 21.9%, 16.3% happened on regions covered by debris, clean ice, and ice cliffs, respectively. Although the supraglacial debris covered more than 4/5 of the surveyed surface, its contribution to total ice loss is much smaller (less than 3/5), in contrast to ice cliff and clean ice, which only cover very few areas (totally 17.7%) but contributed large part (totally 38.2%) of the ice loss.
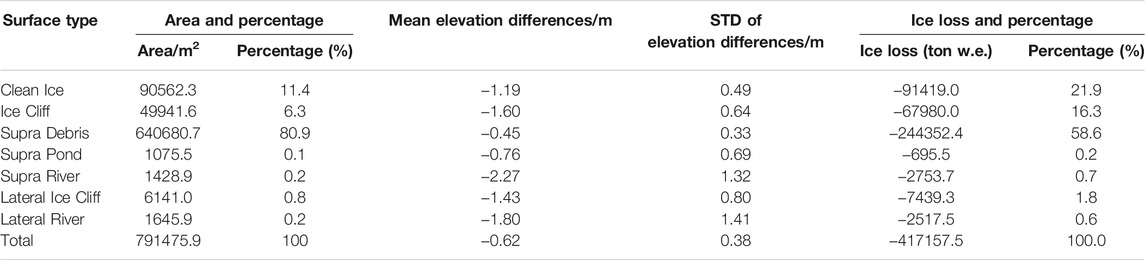
TABLE 1. The statistics of surface elevation change and corresponding ice loss for different surface types.
The mean elevation differences denote the ablation intensities of different surface types, and can clearly describe the brief ablation pattern of different surface types. The lateral and supra river have the two biggest average elevation differences, which illustrate these two surface types have the most intensive ice loss during the studied period. By contrast, the supra debris has the smallest average elevation differences, which indicates the strong protecting effects of surface debris cover on glacier ablation. The lateral ice cliff and ice cliff aside the glacier show larger average elevation differences too, while clean ice shows intermediate ablation intensity.
The standard deviation (STD) of elevation difference describes the variations of glacier ablation in each surface type. The large STD denotes the lesser dependence of the ablation rate on the surface type, which means the surface type may have an ablation rate with large differences. The strongest variation happens on the two kinds of rivers (supra and lateral), which may be caused by variant supraglacial runoff flux, terrain slope (see below), or by the lower quality of the UAV DSMs on deep channels (see Discussion). The smaller STDs, which were mainly presented by supra debris, indicate that the ablation rate on debris-covered areas are more evenly distributed. The intermediate STD of clean ice and two ice cliff type should be caused by large differences in terrain slope and aspect (see below).
The glacier ablation observations on nine stakes installed in the upper clean ice region of the south branch of the Halong Glacier (Figure 1D) were provided as a comparison to this study. The ablation of those clean ice stakes was in the range of 65–97.5 cm from August 19 to September 23, 2019. The maximum ablation of 97.5 cm appeared on the lowest site close to the margin of the study area, in good accordance with the elevation differences revealed by this study in a nearby region (lower left clean ice region in Figure 4A).
We calculated the mean elevation differences of different surface types on different slopes and aspects by intersecting the surface type with slope (in 5° interval) and aspect (in 15° interval) range classes to better understand the influences of terrain slope/aspect on the ablation rate over different surface type. Figure 5 shows the results of these analyses, in which the lateral debris-covered region was also included in this figure. Figures 5A,B,D,E show clearly that the dominants of two debris-covered regions, i.e. supraglacial and lateral debris, whose major portions were located on a surfaces with a slope smaller than 40° and with mostly east-, north-, and west-facing aspects. Two ice cliff types, i.e. the lateral ice cliff and ice cliff aside the glacier, are mainly distributed upon the surface with a slope greater than 15° and less than 60°. Supraglacial ice cliffs were mostly orientated toward northeast and northwest, but lateral ice cliffs are mostly facing east. The clean ice area was distributed more evenly on surfaces with different slopes but was also mostly orientated toward north, northeast, and northwest. Two river types (supraglacial and lateral) were located on more flat terrains (<20°) but evenly on most aspect ranges.
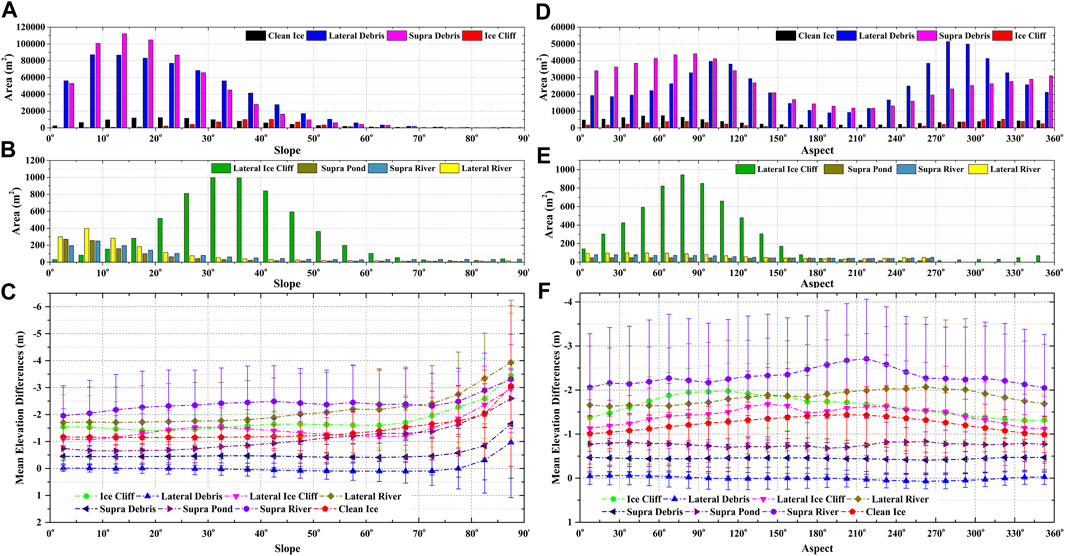
FIGURE 5. The total area of different surface types within different slope (A) and (B), in 5° interval) and aspect (D) and (E), in 15° interval) ranges, and the relationships between elevation differences and surface slope (C) as well as aspect (F) within different surface types. The error bar represents the standard deviation of elevation differences in the surface type within different slope and aspect ranges.
Figures 5C,F show the relationships between the mean elevation changes of different surface types on terrains with different slopes and aspects. The larger variances (range of error bar) of supra rivers and ponds as well lateral rivers are likely caused by incorrect inclusion of pixels surrounding or embedding into those surface types due to the highly patched surface features (see Supplementary Figure S2). Those features with a slope above 70° are not very representative due to the minimal area of each surface type on this kind of terrain (∼0.9% in total) but can describe some characteristics of the glacier ablation on those regions. Figures 5C,F clearly shows that the supraglacial debris has the minimum ablation rates among all supraglacial surface types. The ablation rates were near uniformly distributed along different slopes and aspects on all debris-covered surfaces except those with a slope steeper than 70°. This phenomenon further illustrates the strong protections of debris cover on ice ablation by comparing to the clean ice, whose ablation rates show near-linear increase with slopes larger than 40°. Furthermore, the changes of mean elevation differences of supraglacial debris along increasing slopes show a slightly decreasing trend below 70°. This can be explained by the falling and subsequent deposition of larger unstable debris (with a grain size of 10−2–10–1 m) along the edge of ice cliff or melted out from ice cliffs, as well as the downslope creeping of melt-water soaked muddy debris (with a grain size of 10−6–10–2 m). The falling of larger debris happens on steeper slopes (greater than ca. 70°) but were blocked by the downslope depositions accumulated before on the gentler slope (i.e. 40°–70°; see Supplementary Figure S3A, some of larger patches were also classified as debris cover in this study), and should be the major causes of such depositions on steep terrain. The deposition of creeping muddy debris happens on gentler slopes (Supplementary Figure S3B).
By contrast, Figure 5C also shows that the clean ices have a nearly tripled ablation rate compared to the debris-covered area on all slope classes. Besides, unlike supra debris, its ablation rates show a recognizable increasing trend with larger slopes, especially those larger than 40°, indicating the strong influences of the flushing as well as the heat release of melted water on ice ablation among this surface type (Pitcher and Smith, 2019). The slightly larger ablation (∼0.5 m) of south- than north-facing clean ice (and also supraglacial river channels) in Figure 5F can be explained by more solar radiation being received, but also may partly be induced by the influences of glacier movement on ablation patterns retrieved by the elevation differencing method (see DISCUSSION).
Supraglacial ice cliff has a larger ablation rate than clean ice. The ice cliffs with lower mean slopes (<25°) may be caused by the fast change of ice cliffs between August 11 and September 15 (e.g., the under-slope regions were turned into flatter terrain due to ice cliff retreats), or by incorrect inclusion of image classification due to highly patched surface features (see Supplementary Figure S2C). The elevation decrease of supraglacial ice cliffs with a slope above 25° show another slight increasing tendency toward larger slopes, especially those above 65°, also indicating the enhanced effects of melted water flushing and heat-releasing on the surface ice ablation. The east- and south-facing ice cliffs in Figure 5F show larger ablation rates than other orientations because of the stronger solar radiations received in these two directions. The lowering down of ablation rate for lateral ice cliff in slope ranges between 35°-70° may be caused by similar debris deposition effects because of the plentiful sources of erosion on the upper slope regions above lateral ice cliff (see Supplementary Figure S3B).
Although the elevation differences in Figure 4 can be used to represent the ice losses as a whole, they can only describe the changes in ice surface height. They cannot illustrate the retreat of steep ice cliffs caused by intensive backward ablations. To solve this problem, we converted the vertical elevation differences to horizontal retreats on steep terrains (slopes greater than 45°) by using Eqs 1–3, the results are shown in Figure 6. From this figure, we can easily distinguish the dramatic backwastes of all ice cliffs and also other regions with steep terrains. The largest absolute horizontal backwaste reached nearly 7.8 m (Figure 6C), indicating that the surface retreats caused by backwastes can easily reach 20 m over the whole ablation season (from early May to later October in recent years according to our monitoring works) since this is only a 1-month observation. Although the glacier terminus also shows significant retreat (region D in Figure 6; with a median and maximum retreat of 2.1 and 4.2 m respectively), the largest retreats appeared in the middle part of the surveyed region where a larger area of ice cliffs exist. Besides, the backwasting directions of all large supraglacial ice cliffs in debris-covered regions (See Figure 3D) are generally toward the centerline of the Halong Glacier and also the upper glacier direction, but the ice cliffs on regions right above the glacier terminus were wasting ice toward the left margin (marked by a red circle in Figure 6A). It indicates that this region is in strong narrowing which may cause the break off of the Halong Glacier at this point in the near future. This can also be proved by the shaded DSM on September 15 (Figure 3C) and elevation differences showing in Figure 4A.
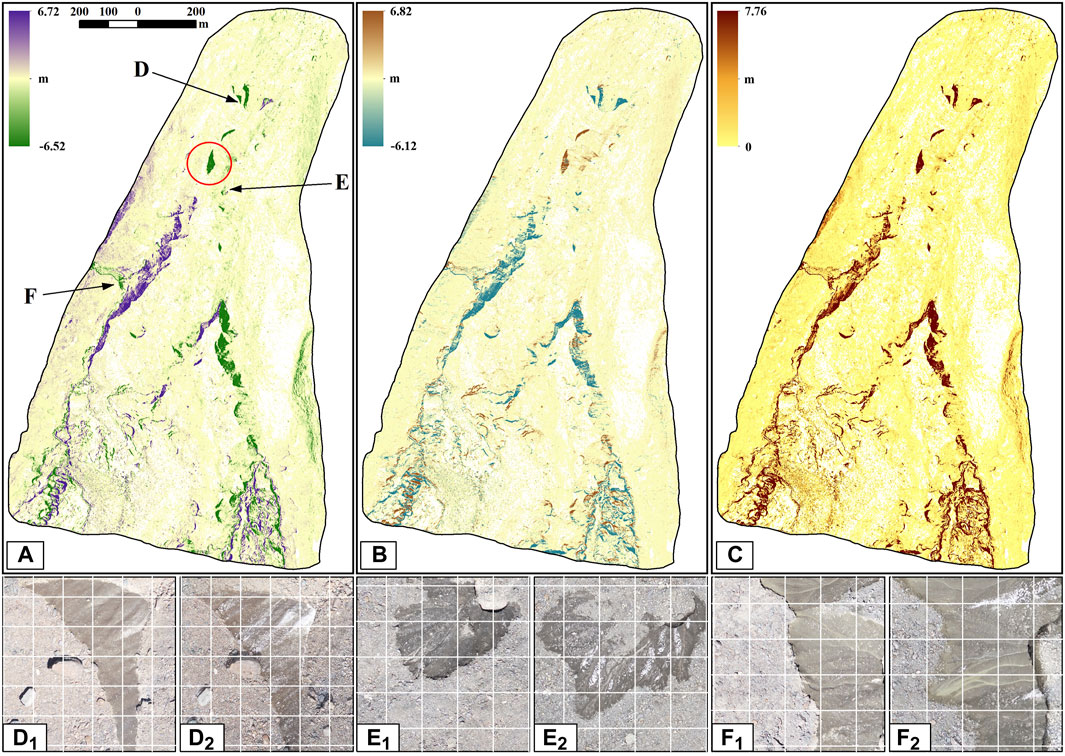
FIGURE 6. The X (A); positive to east) and Y (B); positive to north) components as well as the integrated absolute distance (C) of horizontal ice cliff retreats for regions with a slope greater than 45°. Small maps below are the samples of fast backwasting ice cliff illustrated by UAV images on August 11 (subscript 1) and September 15 (subscript 2) for three locations (D–F) marked in A, with all the gridlines in 5 m interval. The red circle in A marks the bigger backwaste toward the left side of the glacier.
The clean ice regions of Halong Glacier also show a relatively larger backwasting rate. Those regions have very rugged terrains (see Figure 4D) caused by the cutting effects of supraglacial rivers. The downslope flushing of melted water toward the river channels gradually caused the widening and deepening of glacier surface depressions and channels, further increasing the evolvements of the rugged terrain as well as the strong backwasting effects.
We extracted the slopes, aspects, and elevation differences of all the sites with measured debris thicknesses to study the relationships between debris cover thickness and surface slope/aspects, and also the influence of debris thickness on glacier ablations. We also randomly selected 50 clean-ice sites (see Figure 1D) and extracted their slope, aspects, and elevation differences for comparison. The results (Figure 7) show that there are some relationships between supraglacial debris thickness with terrain slope, aspect, and also the elevation differences (converted to ice ablation in Figure 7D to better compare with other studies). Although only the debris thicknesses on surfaces with slope below 40° were measured, they show certain insignificant relationships with terrain slope over all sites (Figure 7A), which may result from similar mechanisms mentioned before, i.e. the larger deposition rates on gentler than steeper slopes. Correspondingly, the ablation rate of all measured sites has insignificant nonlinear relationships with terrain slopes (Figure 7B) and debris thicknesses (Figure 7D). The relationship between debris thickness and surface aspect (Figure 7C) shows that east- and south-facing slopes have thinner debris than north- and west-facing ones, illustrating that the formation of debris cover may also be slightly controlled by terrain orientations.
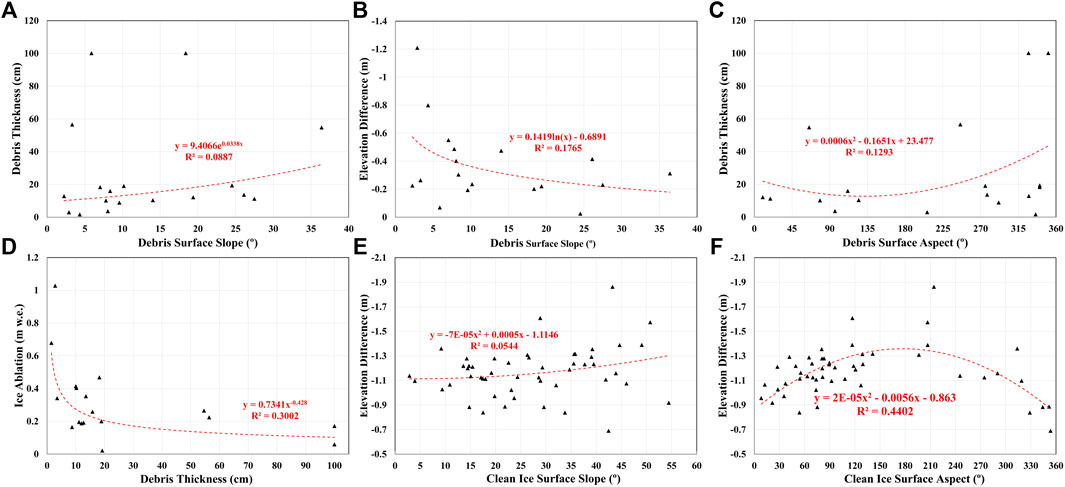
FIGURE 7. Relationships of surface slope, aspects, debris thickness, and elevation differences/ice ablations on measured sites compared to 50 randomly selected sites on clean ice.
The significance of the exponential relationship between debris thickness and ice ablation (Figure 7D) is much higher than the relationship between elevation difference and surface slope (R2 0.3002 vs. 0.1765). The ablation rate drops dramatically for debris thinner than 3 cm, then slowly decreases toward zero, in good accordance with previous studies which show strong protection effects of thicker debris (>2 cm) on glacier ablation (Østrem, 1959; Mattson et al., 1993). However, since the number of measured sites is very limited in this study, these relationships and the influences of thinner debris (<2 cm) on glacier ablation need to be further confirmed in the future.
Figure 7E shows an increasing but insignificant trend of clean ice ablations with increasing slopes, which is consistent with the phenomenon illustrated by Figure 5C that can be explained by heat releasing and flushing of upper slope melt-waters. The larger ablation rates of south-facing clean ice in Figure 7F further proved the influence of stronger solar radiation and also the impacts of glacier movements on ablation patterns retrieved by elevation differencing (see DISCUSSION).
From Table 1 and Figure 5, we can read that two river surface types, i.e. the supra and lateral rivers, have the largest elevation changes among all glacial and periglacial surface types, although they only covered ∼3100 m2 surface area. Both surface river types are mainly located on regions with slopes less than 20°. The mean elevation differences for these two types during the studied period are −2.27 m and −1.80 m, respectively, which are the first- and second-largest values over all surface types, indicating the strong cutting and flushing effects of river flow on strengthening the ablation of bilateral and underneath ices. Furthermore, regions covered by the supra river have larger elevation lowering on surfaces with slope <75° than the lateral river. The possible reason for this phenomenon is that supra rivers mostly appear on clean ice regions (Figure 3D), where the role of meltwater flushing is the most effective. However, such analysis in this study may not be comprehensive because of the limitations of the nadir view angle UAV survey discussed below.
Theoretically, the supraglacial ponds should have enhancing effects on the ablation of the glacier ice beneath because of the large absorption of energy and thus higher temperature of water in the pond than the underlying ice (Sakai et al., 2000; Miles et al., 2016; Miles et al., 2018). However, our results astonishingly show that the areas covered by supra ponds have an ablation rate only slightly greater than supraglacial debris (see Table 1 and Figure 5C). This may be because the accumulating meltwater pouring into those turbid ponds has caused their expansions and thus uplifts of surface elevation. Besides, the supraglacial ponds on Halong Glacier are all very small and shallow, which may not have bigger effects on enhancing glacier melt (see Supplementary Figure S4).
Flow is one of the representative features of glaciers, characterizing the active region of a glacier. Surface displacements caused by glacier flow should have significant influences on glacier surface ablation patterns extracted by elevation differencing. We manually measured the amplitude of the surface displacements of Halong Glacier at several locations, and briefly investigated their influences on the ablation pattern retrieved. The most active regions of the upper surveyed glacier area, i.e. two regions of clean ice and the nearby debris-covered region between them (regions coded as B-D in Figure 8A), have surface displacements ∼0.50 m during the studied period (see Figures 8B–D subscripted with 1 and 2). Due to the glacier surface movement, the surface inclining backward to glacier flow direction (south to southwest in Figure 8) has a much larger elevation difference than actual ablation, compared with those inclining toward glacier flow (mainly north), which have smaller elevation differences lower than the real ablation (Figures 8B–D with subscript 4). The displacements of narrow river channels caused by surface movements further amplified these discrepancies. This can also be proved by Figure 5F and Figure 7F, which shows that the south-facing clean ices and supraglacial river channels have larger elevation differences than other directions. On the other hand, the larger boulders on the debris-covered glacier surface are not only moving together with glacier ice but also rolling toward the downslope direction caused by differentiated surface ablations, further enlarging the inconsistencies between the elevation differences and the real surface ablations (Figure 8C). Such influences should have caused some changes in the statistics of the ablation pattern in Figure 5, particularly for the area covered by clean ice which has the most complex terrain. Therefore, it’s better to eliminate the influences of glacier movements when intending to retrieve the ablation patterns more precisely. However, it’s beyond the scope of this study and will try to be solved in future works.
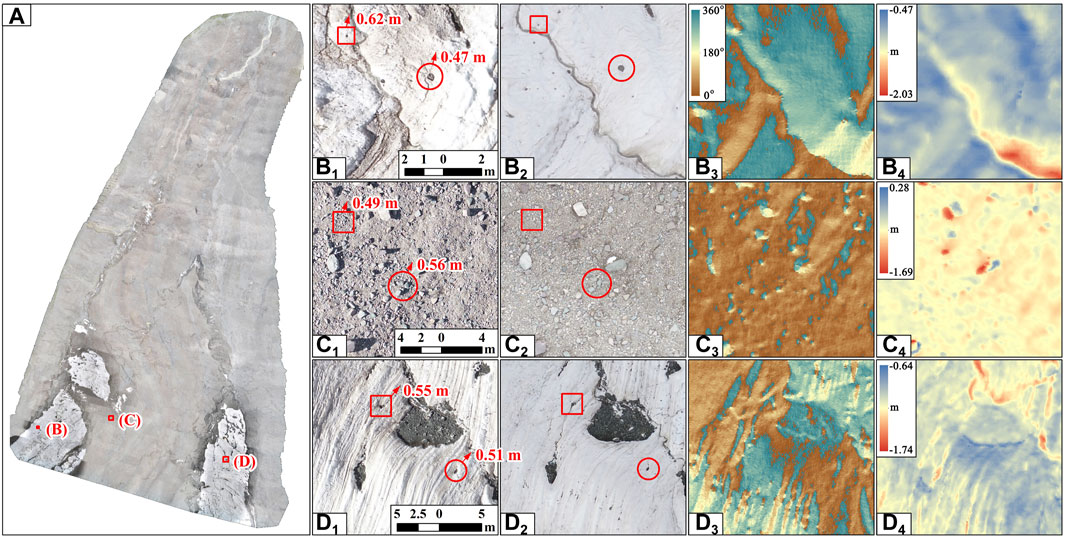
FIGURE 8. Examples illustrating the influences of glacier surface movements on retrieved ice ablation. (B), (C), and (D) correspond to three regions in (A). Subscripts 1–4 denote the UAV images on August 11 and September 15, the surface aspects from DSM on September 15, and the derived elevation differences, respectively. Rectangles and circles in one and two represent the apparent features that can be read on both images, and arrows and marked numbers are the corresponding moving directions and distances.
Besides, the glacier flow during the studied period must have caused some inputs of glacier ice from the upper regions of both major branches of the Halong Glacier. These inputted ices were also melting together with the existing glacier ice, and therefore should be counted into the total mass loss. The ice thickness measurements on Halong Glacier performed in October 2016 via Canadian EKKO-PRO Ground Penetrating Radar (Guo and Wu, 2019) showed that mean ice thickness on the upper debris-covered region right below clean ice of the north branch (see Figure 1D for the distribution and ice thickness of measured sites) was about ∼109 m (102–114 m). If using 100 m as the mean ice thickness (in regard to the surface ablation during 2016–2019) for both branches, multiplying with their total width of ∼900 m and mean estimated surface displacement of ∼0.5 m, the ice inputs from the upper glacier during the studied period can amount to 4.5 × 10⁴ m3 (3.83 × 10⁴ m3 w. e.). By considering this contribution, the total mass loss of the studied area from August 11 to September 15 will reach up to 4.55 × 10⁵ m3 w. e., i.e. the contribution of ice inputs from the upper glacier will be ∼8% of the total mass loss. However, this is only a very rough estimation. The accurate estimation needs very detailed measurements on the ice thickness along the upper edge of the studied area, as well as the well-distributed glacier surface velocity that should be extracted by feature tracking methods (e.g., Leprince et al., 2007; Messerli and Grinsted, 2015), and also the vertical profile of ice velocity below glacier surface, which are all beyond the scope of this study.
Aside from the ablation patterns of Halong Glacier, the precise and high-resolution elevation difference used in this study also obtained extra information on the additional ice storage of Halong Glacier, i.e. the existence of large amounts of buried inactive ice beyond the active glacier margin, which show clear changes during the surveyed period. Such kinds of buried ice cannot be distinguished from the single-phase UAV photos with the highest spatial resolution (∼3 cm), or even by on-site visual inspection. The difference of DEMs generated by two short-term UAV surveys in this study distinctively illustrated the existence of some of the buried ice outside the active margin of Halong Glacier, which means the buried inactive ice can be partially distinguished by this kind of method. However, such application is only confined to those regions with exposed ice cliffs or buried ice with significant ablations. The ice buried under thick debris or other kinds of sediments outside the glacier margin still cannot be distinguished because of their negligible surface lowering rate.
The analysis in Figure 5 included the lateral debris which also shows distinctive elevation changes in some regions, especially the left side and upper lateral regions on both sides (see Figure 4). From the curve of lateral debris in Figure 5C, we can see that the lateral debris with a slope below 30° generally remains unchanging. However, those between 35°-70° show slightly increased positive elevation changes, while those above 75° show large and quickly increased negative elevation differences. This may indicate that the larger erosion rate of debris-covered slopes on steep terrain which caused a large lowering down of surface elevation, while the eroded debris subsequently deposited onto the downslope gentler terrain, causing the raise in elevation of those surfaces. This means that the repetitive UAV survey with higher spatial resolutions and accuracies can be used to study the geomorphologic dynamics of periglacial slopes even over short time periods.
Although the DJI Phantom 4 Pro V2.0 has good performance in generating high-resolution DSMs with sufficient accuracies, it has some intrinsic limitations due to the single view angle camera it carried. Such a camera configuration has resulted in many artifacts on regions with reversed or steep terrain slope, e.g. the inward tilted surfaces (Figures 9A,B), steep ice cliffs, and the deep narrow river channels (Figures 9C,D). Those artifacts may have caused some problems in the retrieved ablation patterns. One solution for this by using the same device is to perform an oblique survey with tripled flights on a region, in which one uses the same nadir view angle, and another two use forward and backward view angles, respectively. However, this will drastically increase the time and workloads on surveying a small region but could be tested on the Halong Glacier in future works.
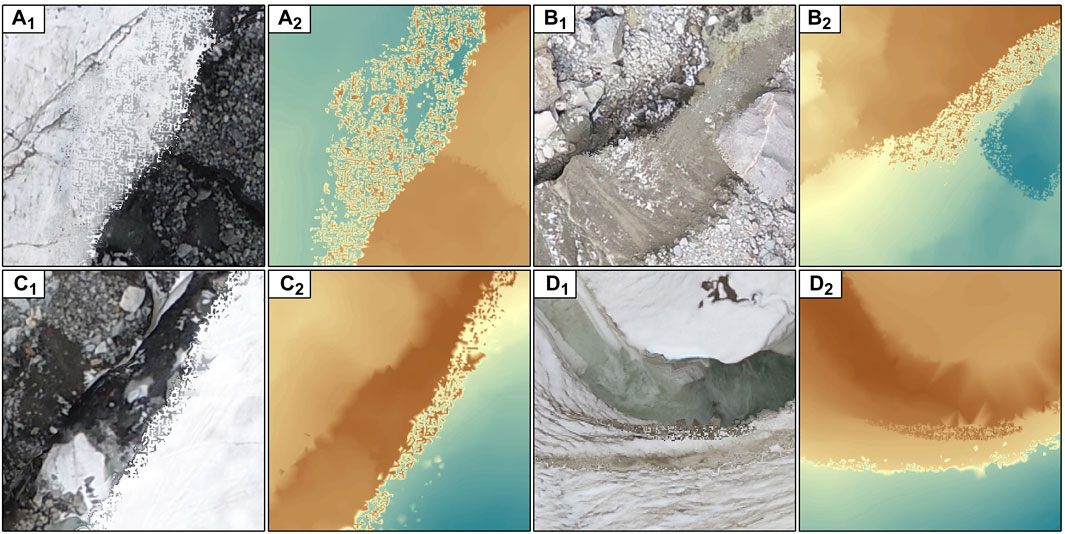
FIGURE 9. Examples of the limitations of nadir view UAV survey in DSM generation on steep terrains, e.g. lateral river aside clean ice (A) and ice cliff (B), as well as supra river aside (C) and on (D) clean ice. Subscript 1 is UAV image and two is DSM.
Additionally, this study only aimed to reveal the overall patterns of glacier ablation related to nine brief surface types. We only used one of the pixel-wise classification algorithms, i.e. image segmentation, to classify the UAV image on September 15, and disregarded the fast changes in the glacier surface between the two surveyed dates. The classification results were further simplified by merging small surface patches into surrounding larger ones to illustrate the overall patterns. Since such pixel-wise classification algorithms were proved to have very limited accuracies on high-resolution images (Myint et al., 2011), plus with the larger simplification on the classified surface types, our current results can only describe the conceptual rather than rigorous patterns of glacier ablations related to surface features. To retrieve precise and detailed relationship between surface types and glacier ablation as well as their own changes of those defined surface types, high complexity classification algorithms with higher accuracies, such as object-oriented (Johnson and Xie, 2013) or deep neural networks (Jozdani et al., 2019), should be used for both UAV images in future work.
Through two repeated UAV surveys, we studied the short-term ablation pattern of the tongue of Halong Glacier between August 11 and September 15, 2019. The results clearly show that Halong Glacier has experienced strong ablation during the studied period. The average surface lowering of the studied area was 0.62 m, with a corresponding overall mass loss of 4.17 × 10⁵ tons w. e.
Supraglacial debris cover is the dominant surface type in the studied area (80.9%), while clean ice and ice cliffs cover the major parts of the rest of the area. Different surface types have distinctive elevation lowering as well as their contribution to total ice loss. Although debris-covered regions have the minimum surface lowering (0.45 m, 0.38 m w. e.), they contributed 58.6% to total ice loss because they comprise the largest area. The regions covered by the lateral and supraglacial rivers have the largest but insignificant surface lowering rate (1.8 and 2.27 m, respectively) because of their minimal area and also the lower qualities of DSMs on those steep terrains.
Two types of ice cliff covered region, i.e. the supraglacial and lateral ice cliffs, have significant surface lowering of 1.60 m (1.36 m w. e.) and 1.43 m (1.22 m w. e.), respectively, and contributed in total 18.1% to the total ice loss, compared to their small area coverage of only 7.1%. The clean ice covered 11.4% of the studied area and has a moderate surface lowering (1.19 m, 1.01 m w. e.). However, it also contributed to 21.9% of total ice loss during the studied period. The supraglacial ponds only covered 0.1% of the whole studied area. They have insignificant surface lowering (0.76 m, 0.65 m w. e.) compared to other studies, and contributed only 0.2% to total ice loss.
Our study also revealed the fast backwastes of ice cliffs and other steep terrains. The horizontal surface retreats caused by backwasting are evenly distributed among all the ice cliff covered regions, with the maximimum retreat amount to 7.8 m. This indicates the fast changes of Halong Glacier from another aspect, which is represented by notable terminus retreat and also the glacier tongue narrowing down. The fast backwaste of ice cliffs right above the glacier terminus may further cause the break off of Halong Glacier into separated parts in the near future.
Our study proved that a low-cost UAV has large potentials for monitoring fast changes of both debris-covered and clean ice glaciers. Although the single nadir view UAV survey used in this study has some limitations on steep terrain, it can be overcome in the future through performing multiple flights using different view angles.
The original contributions presented in the study are included in the article/Supplementary Material, further inquiries can be directed to the corresponding author.
WG designed and organized this study, XG is the operator and data processor of the UAV surveys. YL provided some technical suggestions and advice on this UAV-based study. JL, LC, and JG are the assistants of related field works. DS provides part of the financial support for this study.
The study is supported by National Natural Science Foundation of China (grant No. 41201068, 41671075 and 42171148), Light of West China Program of CAS, the Strategic Priority Research Program of CAS (grant No. XDA19050702), and the Natural Science Foundation of Gansu Province (grant No. 18JR3RA394).
The authors declare that the research was conducted in the absence of any commercial or financial relationships that could be construed as a potential conflict of interest.
All claims expressed in this article are solely those of the authors and do not necessarily represent those of their affiliated organizations, or those of the publisher, the editors and the reviewers. Any product that may be evaluated in this article, or claim that may be made by its manufacturer, is not guaranteed or endorsed by the publisher.
We give thanks for the long and continuous support provided by local residents and officials of Anye Machen Mountain on the monitoring works of the glaciers in this region. We also offer thanks for all the precious works done by Dr. Junfeng Wei, Dr. Weijia Bao, Dr. Zhen Wu, and other colleagues in building the glacier monitoring networks of this region.
The Supplementary Material for this article can be found online at: https://www.frontiersin.org/articles/10.3389/feart.2021.740160/full#supplementary-material
Bash, E. A., and Moorman, B. J. (2020). Surface Melt and the Importance of Water Flow - an Analysis Based on High-Resolution Unmanned Aerial Vehicle (UAV) Data for an Arctic Glacier. The Cryosphere 14 (2), 549–563. doi:10.5194/tc-14-549-2020
Benoit, L., Gourdon, A., Vallat, R., Irarrazaval, I., Gravey, M., Lehmann, B., et al. (2019). A High-Resolution Image Time Series of the Gorner Glacier - Swiss Alps - Derived from Repeated Unmanned Aerial Vehicle Surveys. Earth Syst. Sci. Data 11 (2), 579–588. doi:10.5194/essd-11-579-2019
Bliakharskii, D. P., Florinsky, I. V., and Skrypitsyna, T. N. (2019). Modelling Glacier Topography in Antarctica Using Unmanned Aerial Survey: Assessment of Opportunities. Int. J. Remote Sensing 40 (7), 2517–2541. doi:10.1080/01431161.2019.1584926
Bozhinskiy, A. N., Krass, M. S., and Popovnin, V. V. (1986). Role of Debris Cover in the thermal Physics of Glaciers. J. Glaciol. 32 (111), 255–266. doi:10.3189/s0022143000015598
Che, Y., Wang, S., Yi, S., Wei, Y., and Cai, Y. (2020). Summer Mass Balance and Surface Velocity Derived by Unmanned Aerial Vehicle on Debris-Covered Region of Baishui River Glacier No. 1, Yulong Snow Mountain. Remote Sensing 12 (20), 3280. doi:10.3390/rs12203280
Crocker, R. I., Maslanik, J. A., Adler, J. J., Palo, S. E., Herzfeld, U. C., and Emery, W. J. (2012). A Sensor Package for Ice Surface Observations Using Small Unmanned Aircraft Systems. IEEE Trans. Geosci. Remote Sensing 50 (4), 1033–1047. doi:10.1109/tgrs.2011.2167339
Ewertowski, M. W., Tomczyk, A. M., Evans, D. J. A., Roberts, D. H., and Ewertowski, W. (2019). Operational Framework for Rapid, Very-High Resolution Mapping of Glacial Geomorphology Using Low-Cost Unmanned Aerial Vehicles and Structure-From-Motion Approach. Remote Sensing 11 (1), 65. doi:10.3390/rs11010065
Fisher, P. (1998). Improved Modeling of Elevation Error with Geostatistics. GeoInformatica 2 (3), 215–233. doi:10.1023/a:1009717704255
Florinsky, I. V., and Bliakharskii, D. P. (2019). Detection of Crevasses by Geomorphometric Treatment of Data from Unmanned Aerial Surveys. Remote Sensing Lett. 10 (4), 323–332. doi:10.1080/2150704x.2018.1552809
Fraser, R. H., Pouliot, D., and van der Sluijs, J. (2021). UAV and High Resolution Satellite Mapping of Forage Lichen (Cladonia spp.) in a Rocky Canadian Shield Landscape. Can. J. Remote Sensing. doi:10.1080/07038992.2021.1908118
Fugazza, D., Senese, A., Azzoni, R. S., Smiraglia, C., Cernuschi, M., Severi, D., et al. (2015). High-resolution Mapping of Glacier Surface Features. The UAV Survey of the Forni Glacier (Stelvio National Park, Italy). Geografia Fisica E Dinamica Quaternaria 38 (1), 25–33. doi:10.4461/GFDQ.2015.38.03
Gaffey, C., and Bhardwaj, A. (2020). Applications of Unmanned Aerial Vehicles in Cryosphere: Latest Advances and Prospects. Remote Sensing 12 (6), 948. doi:10.3390/rs12060948
Gindraux, S., Boesch, R., and Farinotti, D. (2017). Accuracy Assessment of Digital Surface Models from Unmanned Aerial Vehicles ' Imagery on Glaciers. Remote Sensing 9 (2), 186. doi:10.3390/rs9020186
Glasser, N. F., Holt, T. O., Evans, Z. D., Davies, B. J., Pelto, M., and Harrison, S. (2016). Recent Spatial and Temporal Variations in Debris Cover on Patagonian Glaciers. Geomorphology 273, 202–216. doi:10.1016/j.geomorph.2016.07.036
Guo, W., Liu, S., Xu, J., Wu, L., Shangguan, D., Yao, X., et al. (2015). The Second Chinese Glacier Inventory: Data, Methods and Results. J. Glaciol. 61 (226), 357–372. doi:10.3189/2015jog14j209
Guo, W., and Wu, Z. (2019). 2016 Halong Glacier Subglacieal Topography Dataset. Natl. Cryosphere Desert Data Cent. Available at: http://www.ncdc.ac.cn/portal/metadata/eb849170-0cc0-469c-9d77-f684588944f4.
Herreid, S., and Pellicciotti, F. (2020). The State of Rock Debris Covering Earth's Glaciers. Nat. Geosci. 13 (9), 621–627. doi:10.1038/s41561-020-0615-0
Hsu, A. J., Kumagai, J., Favoretto, F., Dorian, J., Martinez, B. G., and Aburto-Oropeza, O. (2020). Driven by Drones: Improving Mangrove Extent Maps Using High-Resolution Remote Sensing. Remote Sensing 12 (23), 3986. doi:10.3390/rs12233986
Huss, M. (2013). Density Assumptions for Converting Geodetic Glacier Volume Change to Mass Change. The Cryosphere 7 (3), 877–887. doi:10.5194/tc-7-877-2013
Jiang, Z., Liu, S., Guo, W., Li, J., Long, S., Wang, X., et al. (2018). Recent Surface Elevation Changes of Three Representative Glaciers in Anyemaqen Mountains,source Region of Yellow River. J. Glaciology Geocryology 40 (2), 231–237.
Johnson, B., and Xie, Z. (2013). Classifying a High Resolution Image of an Urban Area Using Super-object Information. ISPRS J. Photogrammetry Remote Sensing 83, 40–49. doi:10.1016/j.isprsjprs.2013.05.008
Jouvet, G., van Dongen, E., Lüthi, M. P., and Vieli, A. (2020). In Situ measurements of the Ice Flow Motion at Eqip Sermia Glacier Using a Remotely Controlled Unmanned Aerial Vehicle (UAV). Geosci. Instrum. Method. Data Syst. 9 (1), 1–10. doi:10.5194/gi-9-1-2020
Jozdani, S. E., Johnson, B. A., and Chen, D. (2019). Comparing Deep Neural Networks, Ensemble Classifiers, and Support Vector Machine Algorithms for Object-Based Urban Land Use/Land Cover Classification. Remote Sensing 11 (14), 1713. doi:10.3390/rs11141713
Kraaijenbrink, P. D. A., Shea, J. M., Litt, M., Steiner, J. F., Treichler, D., Koch, I., et al. (2018). Mapping Surface Temperatures on a Debris-Covered Glacier with an Unmanned Aerial Vehicle. Front. Earth Sci. 6, 64. doi:10.3389/feart.2018.00064
Kraaijenbrink, P. D. A., Shea, J. M., Pellicciotti, F., Jong, S. M. d., and Immerzeel, W. W. (2016b). Object-based Analysis of Unmanned Aerial Vehicle Imagery to Map and Characterise Surface Features on a Debris-Covered Glacier. Remote Sensing Environ. 186, 581–595. doi:10.1016/j.rse.2016.09.013
Kraaijenbrink, P., Meijer, S. W., Shea, J. M., Pellicciotti, F., De Jong, S. M., and Immerzeel, W. W. (2016a). Seasonal Surface Velocities of a Himalayan Glacier Derived by Automated Correlation of Unmanned Aerial Vehicle Imagery. Ann. Glaciol. 57 (71), 103–113. doi:10.3189/2016aog71a072
Leprince, S., Ayoub, F., Klinger, Y., and Avouac, J. P. (2007). Co-Registration of Optically Sensed Images and Correlation (COSI-Corr): an Operational Methodology for Ground Deformation Measurements. IGARSS 2007 IEEE Int. Geosci. Remote Sensing Symp. 1–12, 1943–1946. doi:10.1109/igarss.2007.4423207
Marzeion, B., Kaser, G., Maussion, F., and Champollion, N. (2018). Limited Influence of Climate Change Mitigation on Short-Term Glacier Mass Loss. Nat. Clim Change 8 (4), 305–308. doi:10.1038/s41558-018-0093-1
Mattson, L. E., Gardner, J. S., and Young, G. J. (1993). Ablation on Debris Covered Glaciers: an Example from the Rakhiot Glacier, Punjab, Himalaya. IAHS Publ. 218, 289–296.
Messerli, A., and Grinsted, A. (2015). Image Georectification and Feature Tracking Toolbox: ImGRAFT. Geosci. Instrum. Method. Data Syst. 4 (1), 23–34. doi:10.5194/gi-4-23-2015
Miles, E. S., Willis, I., Buri, P., Steiner, J. F., Arnold, N. S., and Pellicciotti, F. (2018). Surface Pond Energy Absorption across Four Himalayan Glaciers Accounts for 1/8 of Total Catchment Ice Loss. Geophys. Res. Lett. 45 (19), 10464–10473. doi:10.1029/2018GL079678
Miles, E. S., Pellicciotti, F., Willis, I. C., Steiner, J. F., Buri, P., and Arnold, N. S. (2016). Refined Energy-Balance Modelling of a Supraglacial Pond, Langtang Khola, Nepal. Ann. Glaciol. 57 (71), 29–40. doi:10.3189/2016aog71a421
Myint, S. W., Gober, P., Brazel, A., Grossman-Clarke, S., and Weng, Q. (2011). Per-pixel vs. Object-Based Classification of Urban Land Cover Extraction Using High Spatial Resolution Imagery. Remote Sensing Environ. 115 (5), 1145–1161. doi:10.1016/j.rse.2010.12.017
Østrem, G. (1959). Ice Melting under a Thin Layer of Moraine, and the Existence of Ice Cores in Moraine Ridges. Geografiska Annaler 41 (4), 228–230. doi:10.1080/20014422.1959.11907953
Pajares, G. (2015). Overview and Current Status of Remote Sensing Applications Based on Unmanned Aerial Vehicles (UAVs). Photogram Engng Rem Sens 81 (4), 281–330. doi:10.14358/pers.81.4.281
Paul, F. (2019). Repeat Glacier Collapses and Surges in the Amney Machen Mountain Range, Tibet, Possibly Triggered by a Developing Rock-Slope Instability. Remote Sensing 11 (6), 708. doi:10.3390/rs11060708
Pearce, S., Ljubicic, R., Pena-Haro, S., Perks, M., Tauro, F., Pizarro, A., et al. (2020). An Evaluation of Image Velocimetry Techniques under Low Flow Conditions and High Seeding Densities Using Unmanned Aerial Systems. Remote Sensing 12 (2), 232. doi:10.3390/rs12020232
Pellicciotti, F., Stephan, C., Miles, E., Herreid, S., Immerzeel, W. W., and Bolch, T. (2015). Mass-balance Changes of the Debris-Covered Glaciers in the Langtang Himal, Nepal, from 1974 to 1999. J. Glaciol. 61 (226), 373–386. doi:10.3189/2015jog13j237
Pitcher, L. H., and Smith, L. C. (2019). Supraglacial Streams and Rivers. Annu. Rev. Earth Planet. Sci. 47, 421–452. doi:10.1146/annurev-earth-053018-060212
Pratibha, S., and Kulkarni, A. V. (2018). Decadal Change in Supraglacial Debris Cover in Baspa basin, Western Himalaya. Curr. Sci. 114 (4), 792–799. doi:10.18520/cs/v114/i04/792-799
Sakai, A., Takeuchi, N., Fujita, K., and Nakawo, M. (2000). “Role of Supraglacial Ponds in the Ablation Process of a Debris-Covered Glacier in the Nepal Himalayas,” in Debris-Covered Glaciers (Seattle, Washington, USA: IAHS Publ), 264.
Salerno, F., Thakuri, S., Tartari, G., Nuimura, T., Sunako, S., Sakai, A., et al. (2017). Debris-covered Glacier Anomaly? Morphological Factors Controlling Changes in the Mass Balance, Surface Area, Terminus Position, and Snow Line Altitude of Himalayan Glaciers. Earth Planet. Sci. Lett. 471, 19–31. doi:10.1016/j.epsl.2017.04.039
Vargo, L. J., Anderson, B. M., Dadić, R., Horgan, H. J., Mackintosh, A. N., King, A. D., et al. (2020). Anthropogenic Warming Forces Extreme Annual Glacier Mass Loss. Nat. Clim. Chang. 10 (9), 856–861. doi:10.1038/s41558-020-0849-2
Vincent, C., Wagnon, P., Shea, J. M., Immerzeel, W. W., Kraaijenbrink, P., Shrestha, D., et al. (2016). Reduced Melt on Debris-Covered Glaciers: Investigations from Changri Nup Glacier, Nepal. The Cryosphere 10 (4), 1845–1858. doi:10.5194/tc-10-1845-2016
Wigmore, O., and Mark, B. (2017). Monitoring Tropical Debris-Covered Glacier Dynamics from High-Resolution Unmanned Aerial Vehicle Photogrammetry, Cordillera Blanca, Peru. The Cryosphere 11 (6), 2463–2480. doi:10.5194/tc-11-2463-2017
Wouters, B., Gardner, A. S., and Moholdt, G. (2019). Global Glacier Mass Loss during the GRACE Satellite Mission (2002-2016). Front. Earth Sci. 7, 96. doi:10.3389/feart.2019.00096
Yang, J., Ding, Y., Liu, S., Lu, A., and Chen, R. (2003). Glacier Change and Ist Effect on Surface Runoff in the Source Regions of the Yangtze and Yellow Rivers. J. Nat. Resour. 18 (5), 595–602.
Keywords: Halong Glacier, debris covered glacier, ablation pattern, unman aerial vehicle, ice cliff
Citation: Guo W, Guo X, Liu Y, Li J, Shangguan D, Chen L and Ga J (2021) Ablation Patterns of the Debris Covered Tongue of Halong Glacier Revealed by Short Term Unmanned Aerial Vehicle Surveys. Front. Earth Sci. 9:740160. doi: 10.3389/feart.2021.740160
Received: 12 July 2021; Accepted: 07 October 2021;
Published: 04 November 2021.
Edited by:
Aparna Shukla, Ministry of Earth Sciences, IndiaReviewed by:
Raaj Ramsankaran, Indian Institute of Technology Bombay, IndiaCopyright © 2021 Guo, Guo, Liu, Li, Shangguan, Chen and Ga. This is an open-access article distributed under the terms of the Creative Commons Attribution License (CC BY). The use, distribution or reproduction in other forums is permitted, provided the original author(s) and the copyright owner(s) are credited and that the original publication in this journal is cited, in accordance with accepted academic practice. No use, distribution or reproduction is permitted which does not comply with these terms.
*Correspondence: Wanqin Guo, Z3Vvd3FAbHpiLmFjLmNu
Disclaimer: All claims expressed in this article are solely those of the authors and do not necessarily represent those of their affiliated organizations, or those of the publisher, the editors and the reviewers. Any product that may be evaluated in this article or claim that may be made by its manufacturer is not guaranteed or endorsed by the publisher.
Research integrity at Frontiers
Learn more about the work of our research integrity team to safeguard the quality of each article we publish.